prepared by: b.sc. eng. (elec) september 1990 cape of
TRANSCRIPT

Univers
ity of
Cap
e Tow
n
INVESTIGATION INTO PAS-PRECODED, CONSTANT-ENVELOPE, CONTINUOUS-PHASE DIGITAL MODULATION SCHEMES
Prepared by: John N. A. Golby B.Sc. Eng. (Elec)
September 1990
A half-dissertation submitted to the Faculty of Engineering, University of Cape Town, in partial fulfilment of the requirements of the degree of Master of Science in Electrical Engineering.
The University of Cape Town has been Mm the right to reproduce this thesis In ~ole or In part. Copyright is held by the author,

The copyright of this thesis vests in the author. No quotation from it or information derived from it is to be published without full acknowledgement of the source. The thesis is to be used for private study or non-commercial research purposes only.
Published by the University of Cape Town (UCT) in terms of the non-exclusive license granted to UCT by the author.
Univers
ity of
Cap
e Tow
n

Univers
ity of
Cap
e Tow
n
i
TERMS OF REFERENCE
This thesis investigation was initiated by Dr. Robin Braun of th_e
Department of Electrical Engineering, University of Cape Town, in
February 1989. His instructions were:
1. To research angle modulation schemes that employ Partial
Response Signaling (PRS) to achieve improved spectral
efficiency and power efficiency, while maintaining constant
signal envelopes.
2. To select and review a particular scheme of this type.
3. To perform computer simulations of system performance.
4. To build a reduced-complexity modem.
5. To perform testing and evaluation of overall
performance.
system

Univers
ity of
Cap
e Tow
n
ii
ACKNOWLEDGEMENTS
The work presented in this thesis would not have been possible
without the assistance of my supervisor, Dr. Robin Braun.
Grateful thanks are also due to Mr. Jan Hesselink, for valuable
encouragement and support.
Also, to Jan Schoonees, for review comments, and to all those
associated with the development of this project.

Univers
ity of
Cap
e Tow
n
iii
SYNOPSIS
Partial response signaling ( PRS) has been used successfully to
improve the spectral properties of Pulse Amplitude Modulated (PAM)
digital transmission systems. This thesis investigation studied
the effect of PRS on frequency- and phase-modulated carrier
systems, in particular on their spectral performance and their
maintenance of constant envelope.
Because of
operations,
for use in
their high
constant-envelope
digital radio
immunity
modulation
environments
to nonlinear signal
schemes are attractive
(such as mobile and
satellite). Traditional power-efficient systems such as QPSK and
MSK have high out-of-band signal levels. Filtering of these
signals is ineffective because any further nonlinear processing
causes spectral spreading.
A literature survey has been conducted, showing the development of
constant-envelope modulation formats that employ some form of
correlative encoding. The most promising systems to date are\those
that employ Continuous Phase Frequency Shift Keying (CPFSK) with
some form of baseband pulse shaping. Systems that fall into this
category are Continuous Phase Modulation (CPM) and Correlative
Phase Shift Keying (CORPSK).
CORPSK has been studied as a typical scheme from this class.
Computer simulations were performed to analyse spectral behaviour,
time domain characteristics and the performance of synchronization
systems. These results agreed with those reported 'in the
literature.
A reduced-complexity CORPSK modem was developed, employing
coherent symbol-by-symbol detection instead of the Viterbi
algorithm. The former experiences a 4. 5 dB degradation over the
Viterbi approach.

Univers
ity of
Cap
e Tow
n
iv
Extensive testing was performed to determine system performance.
Results show that a spectral efficiency of only O. 5 bps/Hz is
achieved. However, this modulation format has no spectral
sidelobes, and so the out-of-band signal levels are much lower
than those yielded by systems such as unfiltered QPSK. CORPSK is
thus able to satisfy more stringent spectral masks than
constant-envelope OQPSK and MSK. Measured error rate
characteristics are comparable to the performance of a 4 PSK
system.
Carrier recovery is straightforward good performance is
achieved with fairly simple circuitry. Symbol timing recovery,
while possible, requires more sophisticated synchronization, and
was not attempted. However, the existence of suitable spectral
components was verified.
The effect of hardlimited amplification on the system spectrum was
simulated. No spectral sidelobes were generated, demonstrating
this system's immunity to spectral spreading.
Conclusions are that CORPSK yields a hardware solution that is
practical both in terms of system complexity and performance. This
modulation format exhibits spectral properties that are easily
predicted by simulation.
The in-depth study of actual system performance under nonlinear
conditions (bandpass limiting, TWTA nonlinearity, and even
multipath) is recommended for further research.

Univers
ity of
Cap
e Tow
n
v
TABLE OF CONTENTS
Terms of Reference
Synopsis
List of Illustrations
List of Figures
List of Tables
1. INTRODUCTION
2. LITERATURE REVIEW
3. REVIEW OF PARTIAL RESPONSE SIGNALING
3.1 Generalised Partial Response Signaling Scheme
3.2 Choosing the PRS System Polynomial
3.2.1 Location of Spectral Nulls
3.2.2 Number of Output Levels
3.3 Error Detection
3.4 The Baseband Duobinary Technique
3.5 The Baseband Duoquaternary Technique
4. CORRELATIVE PHASE SHIFT KEYING
4.1 Modulation Definition
4.2 System Spectra
4.3 Demodulation
4.3.1
4.3.2
4.3.3
Synchronization
Practical Detector Model
Error Detection
5. CORPSK SIMULATION RESULTS
Page
i
ii
vii
1
3
10
10
12
13
14
15
15
18
22
22
25
27
27
28
32
34
5.1 Baseband Eye Diagrams 34
5.1.1 Vertical Eye Opening 34
5.1.2 Horizontal Eye Opening 35
5.2 Constellation Diagram 35
5.3 Signal Spectra 36
5.4 Carrier Regeneration and Symbol Timing Recovery 37

Univers
ity of
Cap
e Tow
n
vi
5.5 Effects of Hardlimiting on the Output Spectrum 38
5.6 Error Performance in the Presence of Noise 39
6. CORPSK MODEM DESIGN
6.1 System Description
6.2 Pseudorandom Bit Sequence Generator
6.3 PRS Encoder
6.3.1 Two to Four Level Converter
6.3.2 Precoder
6.3.3 Transversal Filter
6.3.4 Level Shifter
6.3.5 Differential Encoder
6.3.6 Symbol Clock
6.4 Phase Shaper
6.5 Lowpass Transmission Filters
6.6 In-phase and Quadrature Carrier Generation
6.7 Modulator
6.8 Receiver Front End
6.9 Carrier and Symbol Timing Recovery Module
6.10 Detector and Decoder
45
46
47
49
49
49
49
49
50
50
52
54
55
55
55
56
7. SYSTEM TESTING AND EVALUATION 60
7.1 Test Requirements 60
7.2 Baseband Channels 61
7.2.1 Eye Diagrams 61
7.2.2 Baseband Spectrum 63
7.3 Transmission Filters 64
7.4 In-phase and Quadrature Carrier Generators 65
7.4.1 Spectra 65
7.4.2 XY Diagram 66
7.5 Modulator 66
7.5.1 Output Spectrum 66
7.5.2 Signal Envelope 67
7.5.2(a) XY Diagram 67 7.5.2(b) Direct Measurement of Envelope Fluctuations 68
7.6 Carrier and Symbol Timing Recovery System 68

Univers
ity of
Cap
e Tow
n
7.6.1 Spectra
7.6.2 Timing Jitter
7.7 Decoder
7.7.1 Noise Generator
vii
7.7.2 Symbol Error Rate Results
8. CONCLUSIONS
Bibliography
68
70
71
71
72
76
78
APPENDIX A: The Effect of Hard Limiting on Carrier System
Performance
APPENDIX B: Modem Circuit Diagrams
APPENDIX C: MathCad Listings
APPENDIX D: Pascal Program Listings

Univers
ity of
Cap
e Tow
n
viii
LIST OF ILLUSTRATIONS
TABLES
3.1 Characteristics of Minimum-bandwidth PRS Systems 13
3.2 Decoding Table for Duoquaternary System 20
7.1 Measured Bit Error Rate Results for CORPSK(4-7, l+D) 73
FIGURES
3.1 Model for synchronous data communications 10 3.2 Generalised partial response signaling scheme 11
3.3(a) Magnitude of Duobinary system frequency response 16
(b) Unit impulse response 16
3.4 Transversal filter implementation of Duobinary scheme 16
3.5 Duoquaternary system signal waveforms 19
4.1 Basic CORPSK modulator structure 23
4.2 Spectra of CORPSK(2-3, l+D), CORPSK(2-3, l-02),
CORPSK(2-5, (l+D) 2) (TFM), MSK and Duobinary MSK 25
4.3 Spectra of CORPSK(4-5), CORPSK(4-7, l+D) and QPSK 26
4.4(a) Analysis model for CORPSK systems 28
(b) Equivalent 28
5.1 Eye diagram for one channel 34
5.2(a) X-Y diagram and 35
(b) constellation diagram for CORPSK(4-7, l+D) 35
5.3(a) Simulated normalised CORPSK(4-7, l+D)
signal spectrum 36
(b) Simulated bandpass spectrum for CORPSK(4-7, l+D) 37
5.4(a) Second-order spectrum for CORPSK(4-7, l+D) 37
(b) Fourth-order spectrum for CORPSK(4-7, l+D) 38
5.5 Hardlimited CORPSK(4-7, l+D) spectrum 39
5.6 Noise simulation program flowchart
5.7 Error rates for CORPSK(4-7, l+D) employing
(~) the Viterbi algorithm, and
(b) symbol-by-symbol detection
40
42

Univers
ity of
Cap
e Tow
n
ix
6.l(a) CORPSK(4-7, l+D) modulator block diagram
(b) CORPSK(4-7, l+D) demodulator block diagram
6.2 Spectrum of binary pseudorandom bit sequence
6.3 PRS encoder module block diagram
6.4 Phase trajectory shaping module block diagram
45
46
47
48
50
6.5 D/A spectrum and transmission filter characteristics 53
6.6 State-variable all-pole lowpass filter configuration 53
6.7 Detector and decoder block diagram 57
7.l(a) Baseband eye diagram (measured after transmission
filter) 61
(b) Baseband eye diagram (measured after D/A) 62
7.2 Spectrum of one unfiltered baseband channel 63
7.3 Spectrum of one filtered baseband channel 64
7.4 Frequency response of baseband transmission filter 65
7.5 Spectrum of transmit carrier (one channel only) 65
7.6 Modulator output spectrum 66
7.7 Envelope fluctuation measurement by baseband analysis 67
7.8 Time-domain estimation of envelope fluctuation 68
7.9 Carrier and symbol-timing recovery nonlinearity
output spectrum 69
7.10 Recovered carrier spectrum (one channel) 70
7.11 Recovered carrier clock jitter measurement 70
7.12 Output spectrum of noise generator 71
7.13 Bit error rate test setup 72
7.14 (a) Measured bit error rates compared to
(b) correlation receiver and (c) symbol-by-symbol
detection simulation 74
A. l
A.2
A.3
A.4
A.5
Bandpass limiter model
Output/input CNR vs. input CNR for BPL
Blip development in bandpass-limited OQPSK
Spectral restoration due to hardlimiting of filtered
QPSK and MSK
Spectral restoration due to hardlimiting of
filtered MSK
A.l
A.3
A.5
A. 6
A. 7

Univers
ity of
Cap
e Tow
n
INTRODUCTION
Data transmission theory strives to achieve the transmission of
digital information using the smallest possible signal powers
occupying the least possible spectral space, yielding the lowest
possible data error rates. -power - efficiency and spectral
efficiency have usually been seen as mutually exclusive goals of
the design process and, in practice, some form of compromise or
trade-off has had to be made between them.
With the increasing diversity of the global telecommunications
network, efficient satellite communications and mobile (cellular)
communications are becoming increasingly important. As a result,
there is increasing demand for power efficient digital modulation
schemes with high spectral efficiency. Current endeavours in
increasing the spectral efficiency of existing power efficient
systems are an attempt to satisfy this need. However, a further
constraint imposed by the practical limitations of technology is
that such signal formats have a constant envelope.
Constant-envelope modulation schemes are very attractive for use
in digital radio because of their high tolerance to the nonlinear
operations convenient in high-power amplifiers and receiver IF
stages. Traditionally, four-phase systems such as OQPSK and MSK
have been used because they represent a good compromise between
necessary bandwidth and power efficiency (the former because
stringent limitations on out-of-band power must often be met, and
the latter because good error performance must be achieved with
only moderate power levels). However, any improvement in
out-of-band signal level can only be achieved by filtering of the
signal, and this introduces envelope fluctuations and therefore
reduces these scheme's immunity to the effects of nonlinearities.
In many instances, filtering of the output signal is simply not
possible, because of the high filter Q-factors and signal powers
involved. Any further nonlinear amplification of the signal simply
results in spectral spreading.
1

Univers
ity of
Cap
e Tow
n
Clearly, there exists a need to develop constant-envelope
modulation schemes whose spectral efficiency. is higher than that
yielded by power-efficient systems such as QPSK.
Spectrally-efficient modems are currently being developed in the
amplitude modulation (PAM) area, employing Partial Response
Signaling ( PRS). Their signals, however, have fluctuating
envelopes. This investigation studies the ef feet of applying-.PRS
to frequency- and phase-modulated systems with the aim of
realising the same benefits in angle modulation as are yielded in
the amplitude domain.
This study focuses on one scheme in particular - Correlative Phase
Shift Keying (CORPSK). Tamed Frequency Modulation, or TFM, has
been shown to be an example of this system.
A literature survey is presented, showing the development of PRS
precoded systems that exhibit constant signal envelopes. A
review of partial response signaling is then followed by a
description of the Correlative Phase Shift Keyed modulation
scheme. Computer simulation results are then presented for a
particular case of this system, including baseband eye diagrams,
RF waveform generation, baseband and RF spectrum analyses, and
signal space diagrams. Also, various carrier regeneration methods
are simulated to assess their viability. The results of a symbol
error rate software simulation are presented. The effect of
hardlimiting on the signal spectrum is also simulated, using an
approximation of this process, to yield a qualitative appreciation
of this scheme's immunity to the effects of system nonlinearities.
The design of a CORPSK modem is described. Hardware testing and
evaluation is performed, and some suggestions for further research
are presented.
2

Univers
ity of
Cap
e Tow
n
CHAPTER 2
LITERATURE REVIEW
The scope of this thesis investigation is limited to the
design, testing and evaluation of a Correlative Phase Shift Keyed
modem, and a survey of constant-envelope modulation schemes whose
signals are of the t'o'rin
s(t) = A·cos( wt + ~(t) ) c
( 2 . 1 )
Here ~(t), the phase function, is derived from the input data
sequence by correlation of successive symbols according to some
rule, and filtered at baseband level. Further, ~(t) is a
t . f t. f t. d d\I? ( t} h d. t. . . . con inuous unc ion o ime, an dt as no iscon 1nu1t1es ie.
there are no steps or impulses in the frequency-modulating
function. Since the correlation process produces symbol pulses
longer than one symbol interval, these systems are referred to as
being of a "partial response" type.
However, because of the historical development of such systems, it
is necessary to mention some schemes that are either "full
response," some that do not exhibit constant envelopes, or some
that have only "linear" phase functions.
In 1963, Lender developed "Correlative Level Coding" (Partial
Response Signaling) as a means of achieving higher data packing
densities, improved spectral shape and error-detection capability
in PAM-type modulation schemes [2.1], [2.2]. He also applied this
coding principle to FSK data transmission, yielding performance
superior to the conventional, differentially phase-modulated
systems.
The principles of partial response signaling were reviewed by
Kahal and Pasupathy in 1975 [ 2. 3]. They developed a theoretical
model to analyse PRS systems in terms of bandwidth, spectral nulls
and continuity of derivatives. They compared several schemes on
the basis of speed tolerance, minimum eye width and SNR
3

Univers
ity of
Cap
e Tow
n
degradation over binary systems. The effect of preceding on system
performance was also addressed.
Over the period from 1977 to 1979, Taylor and Cheung developed a
Duobinary-shaped off set-QPSK system for use on the Canadian RD-3
long-haul network [ 2. 4] , [ 2. 5] . This system allowed the
transmission of two DS3 channels (44.7 Mb.p.s.)·· i~n,,·a bandwidth
less than 45 MHz, with a signal-to-noise penalty of only 3.2 dB
over conventional QPSK. A substantial gain is achieved over
sixteen-phase modulation, which represents the most
power-efficient phase-modulated scheme capable of this speed. (The
resulting spectral efficiency was 2 b.p.s./Hz, placing this form
of QPSK in the spectrally-efficient category). A difficulty with
this system, however, was the complex method required for carrier
recovery at the receiver since, unlike with QPSK, a frequency
quadrupler and phase-locked loop were unable to process the partly
amplitude-modulated and partly phase-modulated signal.
Garrison [ 2. 6] analysed the power spectral densities of various
FSK and digital FM systems, some with correlation between input
bits. He evaluated the spectra of, amongst others, Minimum Shift
Keying (MSK) and Duobinary coded MSK. The effect of the
correlation is to reduce the size of the main lobe and to decrease
the out-of-band signal.level.
Tamed Frequency Modulation
phase-modulating function was
(TFM) [2.7] ensured that the
smoothed and correlated, yielding
not only improved spectral properties over systems such as MSK,
but only a 1 dB penalty compared to four-phase methods. Elnoubi
and Gupta [ 2. 8] analysed the error rate performances of
noncoherent detection of Duobinary-encoded MSK and TFM in mobile
radio environments characterized by fast Rayleigh-type fading and
cochannel interference. When differential detection of these
systems is employed, the MSK scheme exhibits improved error
performance over TFM.
A major difficulty in the design of constant-envelope, continuous
4

Univers
ity of
Cap
e Tow
n
(and linear) phase systems has been the characterization and
theoretical- analysis of their spectra and error performances. In
many cases, an exact formula cannot be found.
Deshpande and Wittke derived an explicit expression for the
spectrum of a correlative encoded digital FM signal [2.9]. Making
us·e ·of~ an.·-·encoding polynomial similar to- that used in TFM, a
spectral efficiency improvement of 4 7% over MSK resulted. They
also investigated the use of different baseband pulse shapes (eg.
raised cosine as opposed to rectangular, which creates a
discontinuity in the frequency-modulating function).
Anderson et al studied similar schemes and compared them in the
power-bandwidth plane [2.10]. Their results indicate that, within
the constraints imposed by Shannon's channel capacity theorem, any
power-bandwidth combination may be achieved with phase codes.
Further, channel nonlinearity is no longer seen as an obstacle to
spectrum efficiency. On the other hand, efficient phase-modulated
schemes employ low modulation indices, and so high-quality phase
synchronization is required.
Continuous Phase Modulation (CPM) was reported in 1981 [2.11],
( 2 .12]. Aulin and Sundberg showed that M-ary full response CPM
systems have improved spectral properties and gain in E /N , b 0
compared to MSK. The use of multi level data inputs as well as
smoothing of the phase trajectory at transition instants yield a
far more attractive trade-off between error performance and
spectrum efficiency.
Further improvements result from using baseband pulses longer than
one symbol interval ie. partial response CPM. Using this approach,
modulation schemes can be found that are both bandwidth- and
power-efficient.
Aulin, Rydbeck and Sundberg [2.12] reported power-bandwidth
comparisons for a number of partial response CPM (PRCPM) schemes,
as well as evaluating their minimum Euclidean distances for
5

Univers
ity of
Cap
e Tow
n
different modulation indices. An algorithm is described for
computation of the minimum distance.
By 1982, interest had developed in the use of "multi-h" CPM
modulation indices are rotated cyclically from symbol interval to
symbol interval in a known sequence. The effect is to introduce
more variety between phase shifts, and this· improves the system's
power efficiency [ 2. 20]. Aulin and Sundberg studied the minimum
Euclidean distances of multi-h partial response phase codes
[2.13], as well as spectra [2.14]. Their results indicate that
multilevel input systems provide good power-bandwidth trade-offs,
and that multilevel input, fixed-h systems are preferable to
mul ti-h, binary input schemes. Better spectral efficiencies are
yielded by employing partial response signaling.
Finally, Aulin and Sundberg [2.15] derived a numerical method with
application to computer use for calculating accurate power
spectral densities for these smoothed-phase modulation schemes.
Considerable attention has been paid to the detection methods used
in PRCPM. Svensson, Aulin and Sundberg reported a robust,
reduced-complexity approach to implementing the Viterbi
receiver [2.16]. They also derived the optimum receiver for this
case. Svensson extended this study to general CPM signals in the /
presence not only of white Gaussian noise, but also multiple
interfering signals [2.17].
The working group went on to study the use of both the serial and
parallel MSK receivers in PRCPM [2.18]. Both perform equally well
when synchronization is perfect, although the serial receiver is
easier to implement. The serial receiver is less sensitive to
phase errors but more so to bit timing errors than the parallel.
They also calculated the optimum filters for the parallel and
serial cases. In short, the performance and implementation
advantages of the serial receiver over the parallel are the same
as for conventional MSK as they are here.
6

Univers
ity of
Cap
e Tow
n
Bellini and Tartara ( 2 .19] described the use of discriminator
detection -of PRCPM, with results approaching those . yielded by
coherent methods. They also reported the development of a
moderate-complexity baseband processor for use with binary
systems.
·•··"Muilwijk [2.20] reported the development of Correlative ·Phase.
Shift Keying in 1981. This work was a generalization of
smoothed-phase modulation systems with PRS preceding, and included
TFM. This system yielded necessary bandwidths similar to
unfiltered ( ie. constant-envelope) QPSK and MSK, but far lower
out-of-band signal levels. Using four phase positions, a power
gain of 2 dB may be achieved over MSK and DQPSK. It was shown that
room existed for trade-offs between power efficiency, bandwidth
and circuit complexity. Also, practical results for TFM were
reported.
It should be noted that, while full response mul ti-h CPM systems
introduce variety in symbol-to-symbol phase shifts to enhance
power efficiency, CORPSK achieves it by using correlative coding
- more phase shifts are created than the number of input levels,
the actual number of phase shifts depending on the correlation
rule used.
Maseng [2.21] showed in 1985 that CPM signals could be
approximated in practice by a class of overlapped-pulse
phase-modulated signals, whose pulse shaping is achieved by finite
impulse response (FIR) digital filters. This system is
particularly suited to discrete processing and VLSI design.
REFERENCES
[ 2 .1] A. Lender, "The Duobinary Technique for High-speed Data
Transmission," IEEE Trans. Commun. Electron., Vol. 82, May
1963, pp. 214-218.
[ 2. 2] S. Pasupathy, "Correlative Coding: A Bandwidth-efficient
Signaling Scheme," IEEE Communications Magazine, July 1977,
pp. 4-11.
7

Univers
ity of
Cap
e Tow
n
[ 2 . 3 ] P. Kahal and S. Pasupathy,
Signaling," IEEE Trans. Commun., Vol.
September 1975, pp. 921-934.
"Partial-Response
COM-23, No. 9 1 .
[2.4] D. P. Taylor and D. Cheung, "The Effect of Carrier Phase
Error on the Performance of a Duobinary Shaped QPSK
Signal," IEEE Trans. Commun., Vol. COM-25, July 1977, pp.
738-744.
[2.5] D. P. Taylor and D. Cheung, "A Decision-directed carrier
Recovery Loop for Duobinary Encoded Offset QPSK Signals,"
IEEE Trans. Commun., Vol. COM-27, No.. 2, February 1979,
pp.461-468.
[2.6] G. J. Garrison, "A Power Spectral .Density Analysis for
Digital FM," IEEE Trans. Commun., Vol. COM-23, No. 11,
November 1975, pp. 1228-1243.
[2.7] F. de Jager and c. B. Dekker, "Tamed Frequency Modulation,
A Novel Method to Achieve Spectrum Economy in Digital
Transmission," IEEE Trans. Commun., Vol. COM-26, No. 5, May
1978, pp. 534-542.
[ 2. 8] S. Elnoubi and S. C. Gupta, "Error Rate Performance of
Noncoherent Detection of Duobinary Coded MSK and TFM in
Mobile Radio Communication systems," IEEE Trans. Veh.
Technol., Vol. VT-30, No. 2, May 1981, pp. 62-76.
[ 2. 9] G. S. Deshpande and P. H. Wittke, "Correlative Encoded
Digital FM," IEEE Trans. Commun., Vol. COM-29, No. 2,
February 1981, pp. 156-162.
[2.10] J. B. Anderson, C-E. w. Sundberg, T. Aulin, N. Rydbeck,
"Power-bandwidth Performance of Smoothed Phase Modulation
Codes," IEEE Trans. Commun., Vol. COM-29, No. 3, March
1981, pp. 187-195.
[2.11] T. Aulin and C-E. W. Sundberg, "Continuous Phase Modu
lation - Part I: Full Response Signaling," IEEE Trans.
Commun., Vol. COM-29, No. 3, March 1981, pp. 196-209.
[2.12] T. Aulin, N. Rydbeck and C-E. W. Sundberg, "Continuous
Phase Modulation - Part II: Partial Response Signaling,"
IEEE Trans. Commun., Vol. COM-29, No. 3, March 1981, pp.
210-215.
[ 2 .13] T. Aulin and C-E. Sundberg, "On the Minimum Euclidean
8

Univers
ity of
Cap
e Tow
n
Distance for a Class of Signal Space Codes," IEEE Trans.
Information Theory, Vol. IT-28, No. 1, January 1982, pp.
43-55.
[2.14] T. Aulin and C-E. Sundberg, "Minimum Euclidean Distance and
Power Spectrum for a Class of Smoothed Phase Modulation
Codes with Constant Envelope," IEEE Trans. Commun., Vol.
CQM...;-JO, No~ 7, July 1982, pp 1721-1729.
[2.15] T. Aulin and C-E. Sundberg, "Exact Asymptotic Behaviour of
Digital FM Spectra," IEEE Trans. Commun., Vol. COM-30, No.
11, November 1982, pp. 2438-2449.
[2.16) A. Svensson, C-E .. Sundberg and T. Aulin, "A Class of
Reduced-complexity Viterbi Detectors for Partial Response
Continuous Phase Modulation," IEEE Trans. Commun., Vol.
COM-32, No. 10, October 1984, pp. 1079-1087.
[2.17) N. A. B. Svensson, "Error Probability Analysis for
Continuous Phase Modulation with Viterbi Detection on a
Gaussian Channel with Multiple Signal Interference," IEEE
Trans. Commun., Vol. COM-37, No. 3, March 1989, pp.
230-237.
[ 2 .18) A. Svensson and C-E. Sundberg, "Serial MSK-type Detection
of Partial Response Continuous Phase Modulation," IEEE
Trans. Commun., Vol. COM-33, No. 1, January 1985, pp.
44-52.
[2.19] S. Bellini and G. Tartara, "Efficient Discriminator
Detection of Partial-Response Continuous Phase Modulation,"
IEEE Trans. Commun., Vol. COM-33, No. 8 August 1985, pp.
883-886.
( 2. 20) D. Muilwijk, Correlative Phase Shift Keying - A Class of
Constant Envelope Modulation Techniques," IEEE Trans.
Commun., Vol. COM-29, No. 3, March 1981, pp. 226-236.
(2.21] T. Maseng, "Digitally Phase Modulated (DPM) Signals," IEEE
Trans. Commun., Vol. COM-33, No. 9, September 1985, pp.
911-918.
9

Univers
ity of
Cap
e Tow
n
Chapter 3
Partial Response Signaling - A review
A constraint imposed on the design of Pulse-Amplitude Modulation
(PAM) systems is that signal waveshapes should contain no
intersymbol interference (ISI); that is, at any symbol instant,
the received waveform sample should contain no information from
preceding symbols. Such systems are ref erred to as "memoryless" .
This constraint is summarised in Nyquist's criteria for zero ISI.
It is possible, however, to allow a given quantity of ISI to
occur, thereby causing reshaping of the system spectrum and
increases in spectral efficiency. Because the extent of the ISI is
specified, its effect can be removed at the receiver.
This technique, called "partial response signaling," was developed
by Lender [3.1], [3.2] in 1963 primarily as a means of doubling
the transmission speeds of binary communication systems. Lender
achieved Nyquist-rate signaling, a feat not possible with
conventional PAM systems.
3.1 Generalised Partial Response Signaling System
Kabal and Pasupathy [3.3] suggest a model for a synchronous data
transmission system as shown in Fig. 3.1.
Tx Filter
Data in
Noise
Channel i----t Rx Filter Sampler
Detector
Data out
Fig. 3.1. Model for synchronous data communications.
If an ideal, noiseless system is assumed, it may be characterised
by the samples of the desired system impulse response, h(t), where
H(w) would be the system transfer function. H(w) encompasses the
10

Univers
ity of
Cap
e Tow
n
I
transmit filter, equivalent baseband channel and the receive filter.
If it is assumed that there be N adjacent impulse response
samples, spanning the entire set of non-zero samples, then
N-1
F(D) = I n=O
where {f }, n = O, 1, 2 ... , are the sample values, and n
delay operator. Further, if an input data sequence
assumed, the output sequence, {y }, will be given by n
Y(D) = X(D) F(D) 00 00
Here X(D) and Y(D) = k=-00 n=O
(3.1)
D is the
{x } is n
( 3 . 2 )
and the {x } are assumed to be independent m-ary symbols, taking n
values of { - (m-1) , - (m-3) , . . . (m-3) , (m-1) } with equal
likelihood.
Fig. 3. 2 shows a scheme for implementation of partial response
signaling.
l X/> (t-nT) n
T T T T
£ n
G(w) \- y n
Fig. 3.2. Generalised partial response signaling scheme.
11

Univers
ity of
Cap
e Tow
n
•
The system comprises a transversal filter (tapped delay line) with
filter coefficients {f }, cascaded with a second filter whose n
frequency transfer function is G(w). The transversal filter has· a
transfer function F(w), where
F(w) = F(D) lo = -JWT e
N-1
I f e-jWnT n
n=O
(3.3)
Here T is the symbol spacing, and F(w) is assumed to be periodic.
The system impulse response, h(t), will have the sample values
{f} if and only if G(w) satisfies Nyquist's first criterion n
IX) L G(w - 2~k) = T ( 3. 4)
k=-00
Different choices of G(w) are possible, and each yield a different
system function, each with its own characteristics.
3.2 Choosing the PRS system polynomial
Because of the ease of using the delay operator (eg. in (3.1)), it
is convenient to describe PRS systems by polynomials in D. If G(w)
is a high-order (approaching "brick-wall") lowpass filter, then
the polynomial will accurately describe the transversal . filter,
F(w), and any such filter and its characteristic polynomial can be
seen by inspection to be equivalent.
The selection of different system polynomials lends itself to the
tailoring of system performance. Factors to be considered are
overall transmission bandwidth, location of spectral nulls and the
number of output levels. Table 3. 1 describes some popular · PRS
systems in terms of their system polynomials, F ( D) , and · shows
their respective frequency and impulse responses, and number of
output levels, L [3.3].
12

Univers
ity of
Cap
e Tow
n
3.2.1. Location of spectral nulls
In the design of PRS systems, it is convenient to choose G(w) to
be a high-order lowpass filter, since the system response is
then defined purely by choice of F(w). Because G(w) will then have
a discontinuity at the edge of its passband (at w = rr/T), it is
necessary that F ( w) have a transmission zero at the same place for ~....,,,,-.. -
H(w) to be a continuous function.
The reason for this approach is that if H(w) and its first K-1
derivatives are continuous, and its Kth is not, the function
I h ( t) I decays asymptotically as 1 I It I K+l. Continuity of the
function and its derivatives ensures that the signal energy in the
Table 3.1. Characteristics of minimum-bandwidth PRS systems
F(D) I H(w) for lwl :S rr/T I h(t) I L
1 + D 2T cos w T 4T2 cos(rrt/T~
2 T2 - 4t 2 rr 2m-1
BT t cos(rrt/T) 1 - D j2T sin w T 2 - --
rr T2 - 4t2 2m-1
1 - D2 j2T sin wT 2T2 sin(rrt/T) - --rr T2 - t2
2m-1
1 + 2D + D2 4T cos2 w T 2T 3 sin(rrt/T) 2 rrt T2 - t2
4m-3
tails of h(t) remains small compared to its total energy. Hence,
for minimum bandwidth systems (those in ·which G(w) has this
discontinuity), F(w) should place a zero wherever discontinuities
are likely to arise.
13

Univers
ity of
Cap
e Tow
n
Since the first K-1 derivatives of a minimum bandwidth H(w) will
be continuous if and only if F(D) has (l+D) as a factor, it is
desirable that such a factor be included in the system polynomial.
As the number of such factors increases ie. as K increases, so the
roll-off of H(w) at w = rr/T decreases, and the design of practical
system filters becomes easier. The trade-off is that, as K
increases, · so does the number- of -·output levels, and hence the
system noise performance is degraded. Also, more intersymbol
interference is introduced, and so the system becomes more
sensitive to timing errors.
In systems that are not restricted by bandlimiting, it is
convenient to have a null at w = rr/T, since this allows the
insertion of a pilot tone for clock recovery at the receiver.
A similar argument applies to the introduction of a transmission
zero at zero frequency. The system response rolls off at de with
introduction of (1-D) factors into the system polynomial, but the
system noise performance is again degraded, as is the timing
sensitivity. The major advantage is that after modulation
(frequency shifting) of the baseband signal, there will be little
signal power in the region of the carrier frequency - this allows
a low-amplitude carrier to be inserted, for recovery at the
receiver.
3.2.2. Number of output levels
A PRS system with M nonzero impulse samples (as defined in §3.1)
and an m-ary input will have a number of output levels, L, where
M (m - 1) + 1 L M m ( 3. 5)
The minimum value occurs when the impulse values are the same; and
the maximum occurs when no special relationship exists between
sample values [3.3]. For example, Duobinary has M = 2. For binary
inputs, m = 2, so the number of output levels is seen to be 3 or
4. Table 3.1 shows that this system has 3 output levels (L = 3).
It has been found that the introduction of (l+D) factors into the
14

Univers
ity of
Cap
e Tow
n
system polynomial causes some of the output levels to merge, and
so the SNR degradation due to the increased number of levels is
not so severe.
3.3 Error Detection
PRs~·-encoding creates a signal that contains more levels or states
than the number of input levels. This causes an inherent
redundancy that can be used to monitor system error performance.
The mechanism will be illustrated in the following sections.
3.4 The Baseband Duobinary Technique
The Duobinary signaling scheme permits data transmission at the
Nyquist rate, which is not possible with conventional pulse
amplitude modulated (PAM) systems. Here "Duo-" signifies a
doubling of the bit capacity of the conventional binary system.
This system is a particular case of the generalised system
described in §3.1. The system polynomial (refer to Table 3.1) is
given by
F(D) = 1 + D ( 3 . 6 )
This yields a system transfer function of
H(w) = (1 + e-JWT) LP
{ 2 e-JWT/2 cosw T lwl < Tl --r - T =
0 Elsewhere ( 3 . 7 )
and an impulse response of
h(t) = 4 cos(rr(t-T/2)/T)
rrT {1-4(t-T/2) 2/T2 } ( 3. 8)
The system frequency and impulse responses are shown in Fig. 3.3,
and Fig. 3.4 shows the implementation of such a system.
15

Univers
ity of
Cap
e Tow
n
lli(w)I
(a)
(b)
-3T
Fig. 3.3: (a) Magnitude of system frequency response
(b) Unit impulse response.
Data in PRECODER 1--~-- T
LPF Out
Fig. 3.4. Transversal filter implementation of Duobinary scheme.
A two-level impulse stream is passed through a digital transversal
filter modelled by a delay element and a summer. The two-level
input is therefore transformed into a three-level signal, thereby
introducing correlation between successive digits, and hence a
controlled amount of ISI. When cascaded with a lowpass filter,
this system yields the frequency transfer function of (3.7).
16

Univers
ity of
Cap
e Tow
n
Because each duobinary symbol contains interference from only the
previous two-level bit, decoding at the receiver is merely a
matter of relating pairs of symbols to one another in the correct
fashion. Since the Duobinary filter adds two successive bits for
each output symbol, the receiver could decode the data by
subtracting from each received symbol the effect of the ·~pr-evious
(decoded) bit.
If any symbol should be decoded incorrectly, that error will
propagate throughout the remainder of the data stream. Lender
[3.2] proposed a scheme, called "precoding," to eliminate this
problem. By performing (modulo-2) the inverse function of the
system polynomial before the transversal filter, it is possible to
decode data at the receiver without reference to previous data
bits, and error propagation does not occur. The precoder in Fig.
3.4, in effect, provides the function
b k
= mod 2
( 3. 9)
where {x } is the input binary sequence and b is the output of k k
the precoder. The object is to remove, at the transmitter where
all bits are known, the effect of the preceding bit on a symbol,
without altering the spectral characteristics of the system.
Because modulo-2 addition and subtraction are equivalent, ( 3. 9)
can be expressed as
b k
=
= X G> b I k k-1
(3.10)
("<!>" the EXCLUSIVE-OR function) (3.11)
and the precoder in Fig. 3.4 is therefore implemented by means of
an EX-OR gate.
The signal from the transversal filter has three levels ie.
{yk} = { O, 1, 2 }· These are level-shifted to yield
{Y} = { -1, O, 1 } before lowpass filtering. k
17

Univers
ity of
Cap
e Tow
n
In the case of multilevel duobinary (m-ary input instead of
binary), (3.9) is generalised to
b k
= (a - b ) k k-1 mod m
(3.12)
where a are the m-ary input symbols. (The term "duo-m-ary" will k
be used for the m-ary input-level duobinary·,·~scheme) . The output
Y 's are derived in the same way as for the Duobinary case, k
yielding the same spectral shape.
Such a scheme will still exhibit a doubling of signaling speed
compared to the conventional m-ary case. Table 3.1 shows that a
two-level input duobinary system (m=2) creates three output
levels. Similarly, a four-level input is transformed into seven
output levels. Because duo-m-ary schemes have fewer signaling
levels than m-ary PAM systems of equivalent speeds, they have a
signal-to-noise advantage. This is true of many PRS schemes.
Duobinary encoding results in a set of rules governing level
transitions:
1. No two adjacent signal samples may be of opposite sign.
2. If a nonzero sample is followed by one of opposite sign,
there must be an odd number of zero (centre) samples
between them.
3. If a nonzero sample is followed by another of the same
sign, there must be an even number of zero samples
between them.
Any violation indicates a sample error, resulting in a symbol
error. By monitoring the sampled signal before decoding, such
violations may be detected, and some form of error signal created.
Such systems are described in [3.4] and [3.5, Ch. 7].
3.5 The Baseband Duoquaternary Technique
The duoquaternary technique is an extension of that used in
Duobinary systems. The implementation of the system polynomial is
18

Univers
ity of
Cap
e Tow
n
the same as for the duobinary case, (3.6), but the precoder is now
specified, for four-level input data, by
b k
= (a - b ) k k-1 mod 4
(3.13)
Duo-m-ary systems yield 2m-1 output levels, and so this scheme has
seven. The spectral properties are the same as for the,~-duobinary
case insofar as a halving of transmission bandwidth occurs
relative to the quaternary system. Properties such as speed
tolerance and eye openings are not relevant to the PRS model used
in the modem described in this volume, because the PRS signal
undergoes a transformation from the amplitude domain into the
frequency/phase domain, and it is only at that point that such
time-domain characteristics affect system performance. Rules
concerning level transitions apply here as before, and so the
possibilities for error detection remain.
{a } k
{b } k
{yk}
{Y} k
3 2 1 0
3 2 1 0
6 5 4 3 2 1 0
3 2 1 0
-1 -2 -3
Fig. 3.5. Duoquaternary system signal waveforms.
19

Univers
ity of
Cap
e Tow
n
Fig. 3. 5 shows examples of the signals
duoquaternary implementation.
a I k
b I k
y . and Y in a k k
Table 3. 2 compares output symbol values, Y , with input symbols, k
a k.
Table 3.2. Decoding table for Duoquaternary system
y a k k
3 2
2 1
1 0
0 3
-1 2
-2 1
-3 0
The transmitted data values, a~, may be decoded from the received
Y' by the following rule: k
a' k
= ( Y' 1) k mod 4
(3.14)
Because of preceding, only one sample is required per decoded
symbol.
Table 3.2 describes the relationship between original data bytes
and their transmitted symbol values. Clearly, any given data
value may be sent as one of two symbols, except for a data value
of 3, which may only be sent as a symbol O. Quite which of the two
symbols is used depends on the previous data values and the
initial conditions in the encoder, all of which are random.
Because the original data are random, all transmitted values
(except 0) are equiprobable, with the zero symbol having twice the
probability of any other symbol. The zero symbol has a probability
of transmission of 0.25, while all other symbols have probability
0.125.
20

Univers
ity of
Cap
e Tow
n
The following
partial-response
chapter
signaling
describes the
to frequency-
application of
and phase-modulated
systems, specifically Correlative Phase-Shift Keying (CORPSK).
REFERENCES
[3.1] A. Lender, "Faster Digital· Communications with Duobinary
Techniques.," Electronics, March 22, 1963, pp. 61-65.
[ 3. 2] A. Lender, "The Duobinary Technique for High-speed Data
Transmission.," IEEE Trans. Commun. Electr., Vol. 82, May
1963, pp. 214-218.
[3.3] P. Kabal and S. Pasupathy, "Partial-Response Signaling.,"
IEEE Trans. Commun., Vol. COM-23, No. 9, September 1975,
pp. 921-934.
[ 3. 4] J. Gunn and J. Lombardi, "Error Detection for Partial
Response Systems.," IEEE Trans. Commun. Technol., Vol.
COM-17, No. 6, December 1969, pp. 734-737.
[3.5] K. Feher, Digital Communications., Microwave Applications.,
Prentice-Hall, 1981, Ch. 7.
21

Univers
ity of
Cap
e Tow
n
CHAPTER 4
CORRELATIVE PHASE SHIFT KEYING
4.1 MODULATION DEFINITION
Correlative Phase Shift Keying [4.1], or CORPSK, has a signal of
the form
s ( t) = Cos ( w t + </> ( t) ) ( 4 . 1 ) c
where the signal behaviour is defined by manipulation of </> ( t)
according to an input sequence {a } = {a , a , a , } ; m 0 1 m
successive phase shifts A</> occur at t = T , T the symbol period, m s s
according to three criteria:
(1) the phase is continuous, and A</>m is given by
A</> = C ·'2rr/n m m
= </> (( m+ 1 ) T ) - </> ( mT ) ; s s
(4.2)
( 4. 3)
C is the information-carrying term, and n is the number of phase m
states, n an integer.
(2) successive phase paths follow some correlation rule, so that
each shift is determined by the current input level and that from
at least one previous interval. Because of this type of
correlative coding, there must be more possible phase shifts than
input levels.
(3) the phase path must be smoothed. This ensures good spectral
efficiency, since the derivative of the phase function is then
continuous.
Many different forms of CORPSK exist, depending on the correlation
rule whereby C in criterion (1) is derived. The notation m
CORPSK(M-N, F(D)) is used, where F(D) is the PRS system polynomial
of the type described in Chapter 3. M is the number of input
levels, and N is the number of possible phase shifts. For example,
CORPSK(4-7, l+D) represents a four-level input system with seven
possible output phase shifts, fallowing the Duobinary rule. The
22

Univers
ity of
Cap
e Tow
n
number of phase states, n, is four.
The· basic CORPSK modulator consists of a PRS encoder with
precoder, followed by a lowpass premodulation filter and angle
modulator (Fig. 4.1).
Pree. H(w) Corr. Enc . t-----r-......-i
Freq. (phase)
mod.
CORP SK out
Contr . .___,
Fig. 4.1. Basic CORPSK modulator structure
This is equivalent to a baseband PRS system followed by angle
modulation. The premodulation filter ensures that the angle
modulator follows a ~mooth phase path. If frequency modulation is
used, this is equivalent to a phase modulator whose input is the
integral of the PRS signal. This is because frequency modulation
has an inherent integrating effect.
The precoder and PRS encoder are identical to those used in the
baseband PRS case. The CORPSK process is just like
Continuous-phase Frequency Shift Keying (CPFSK) in that the
baseband signal to an angle modulator is a continuous, shaped
function in CORPSK., the shaping is by a baseband partial
response filter.
By trigonometric identities, (4.1) can be modified to be
s ( t) = Cos ( w t) Cos ( </> ( t) ) - Sin ( w t) Sin ( </> ( t) ) c c
and s(t) can therefore be represented by an
quadrature carrier modulated by the cosine
respectively, of the phase function, <f>(t).
(4.4)
in-phase and a
and the sine,
The input sequence {a } = {a , a , m 0 1
a , . . . } can be written, m
using the delay operator D, as
23

Univers
ity of
Cap
e Tow
n
a(D) = a + a D + a D2 + a n3 + ... 0 1 2 3
( 4. 5)
The output of the correlative encoder is given by
c(D) = b(D) · F(D) ( 4 • 6 )
where b(D) is the precoder output and F(D) is the encoding rule.
Referring to Fig. 4.1, the lowpass filter H(w) ensures that the
phase is not just smoothed, but that it passes through the
stationary phase points at each symbol transition instant. In
order to achieve this in conjunction with a phase modulator, it must
satisfy Nyquist's first criterion for zero ISI:
{ for k = 0 1
n (kT ) = ( 4 • 7 ) I s 0 for k * 0, k an integer
Here n1 (t) is the impulse response of the filter that satisfies
this criterion. If the input to the filter is described as
c(t) = \' c o (t-mT ) f... m s m
then the signal phase, ¢ (t), will be p
¢ (t) p
= 2rr -·c(t) • n (t) n I
If, however, a frequency modulator is used instead,
Nyquist's third criterion must be satisfied
I (2k+l)(T/2l
(2k-1)(T /2) s
n (t) dt III
= { 1 for k = 0
0 for k * 0, k an integer
The signal phase from the frequency modulator is then
¢ (t) f'
= 2rr t
I c(t) • n (t) dt III
-to s
24
( 4 . 8 )
(4.9)
(4.10)
(4.11)

Univers
ity of
Cap
e Tow
n
where 2n/nT is the transfer constant of the modulator. s
The duality that arises between (4.9 and (4.11) is because of the
integrating effect of the frequency modulator. It is of little
practical consequence, however, since encoding with F(D) followed
by a phase modulator is equivalent to encoding with F(D) (1-D)
·followed· by a frequency modulator, except- fe;r. a time delay of
T /2. The differentiating effect of the ( 1-D) factor cancels the s
frequency modulator integration.
Equations ( 4. 9) and ( 4 .11) show how CORPSK produces PRS signals
identical to those created in PAM systems, but transfers them into
the phase domain.
4.2 SYSTEM SPECTRA
Muilwijk analysed the performance of a number of signals in the
CORPSK class. Fig. 4.2 shows the spectra of three systems,
CORPSK(2-3, l+D), CORPSK(2-3, 1-D2) and CORPSK(2-S, (l+D)
2) (TFM),
compared to those of Minimum-shift Keying (MSK) and
Duobinary-encoded MSK.
P, lb( dB)
t - 0
-10
-20
-30
1-0 2
-SO 0 dB= UNMODULATED CARR IE R
o.s I I 1-fcl lb
2 Fig. 4.2. Spectra of CORPSK(2-3, l+D), CORPSK(2-3, 1-D ),
CORPSK(2-S, (l+D) 2) (TFM), MSK and Duobinary MSK.
25

Univers
ity of
Cap
e Tow
n
Comparing the spectra of MSK and Duobinary MSK, the effect of
correlative encoding is a reduction of out-of-band signal levels
and size of main lobe, and hence a reduction of necessary
bandwidth. Duobinary MSK is similar to CORPSK(2-3, l+D), except
that the frequency-modulating signal is made up of square pulses,
and is not smoothed, as in the CORPSK case. The effect of the
premodulation filter, therefore, is a lessening of ·out-of-band
signal level.
Fig. 4. 3 compares the spectra of CORPSK ( 4-5), which employs a
nonlinear encoding rule, CORPSK(4-7, l+D) and unfiltered, or
constant-envelope, QPSK for reference.
-10
-20
-30
-LO
-SO
-60
-70
-80
CORPSK(t.-7, 1+D)
;' -- .... I ' I \
O dB :UNMODULATED CARRIER
o.s
\
\ \
I I I I '
............ ' ' I \
\ \
:-QPSK
I I I I
I I I
TFM
Fig. 4.3. Spectra of CORPSK(4-5), CORPSK(4-7, l+D) and QPSK.
CORPSK(4-7, l+D) has a slightly wider main lobe than CORPSK(4-5).
However, compared to QPSK, they both have far lower out-of-band
signal levels.
26

Univers
ity of
Cap
e Tow
n
4.3 DEMODULATION
4.3.1 Synchronization
A coherent correlation receiver for CORPSK is the optimum.
Symbol-by-symbol sampling, however, yields a more practical, but
suboptimum, solution.
In either case, secure recovery of the carrier is required in
order to demodulate the received signal synchronously. CORPSK is
an angle modulated system with n phase states, and so carrier
recovery is achieved by processing the received signal with a
nonlinearity of order n, and extracting the resulting discrete
frequency component that arises at n times the carrier frequency.
This signal is then divided in frequency by n to give a frequency
and phase-stable carrier reference. The initial n-fold phase
ambiguity that results is overcome by encoding the signal
differentially at the transmitter.
The carrier regeneration process is successful because the carrier
phase remains in the region of one of the n phase states for some
portion of time when the transmitted data require no actual phase
change. This will occur when the PRS input to the modulator
is zero over one symbol period. Upon frequency multiplication by
n, all zero phase shift portions of the signal add in-phase and
create nonzero average
(This is similar to the
and MSK systems [4.2]).
power at n·w , w the carrier frequency. c c
approach used for carrier recovery in QPSK
In addition, all other phase shifts that occur become multiples of
2·rr when frequency-multiplied by n. All equal-valued phase shifts
then add in-phase to give discrete frequency components situated
symmetrically about n·w , at a distance proportional to the symbol c
rate.
27

Univers
ity of
Cap
e Tow
n
4.3.2 Practical Detector Model
Symbol-by-symbol detection offers the most practical
implementation of a CORPSK receiver but, as is shown in Chapter 5,
introduces a signal-to-noise degradation of approximately 3 dB
relative to the ideal correlation receiver. The baseband analysis
model shown in Fig. 4.4 is adopted for the simulations performed
in Chapter 5 and the tests reported in Chapter 7.
(a) Noise samples
vco {a } {a'}
m Pree Corr H(w) K DEC. m
Enc. jw
Noise
(b) ----·6,____--.. , Demod. ~ I
Carrier
Fig. 4.4(a) Analysis model for CORPSK systems (b) equivalent.
An input sequence {a } is generated and precoded, to yield the m
sequence {b }. The PRS rule (for example, Duobinary) is encoded to m
give {c } . This is then smoothed by a premodulation filter which m
satisfies Nyquist's first criterion for zero ISI. The frequency
modulator is modelled as an integrator. The in-phase and
quadrature signal components are derived by simple trigonometric
functions. Gaussian channel noise is added to each signal
independently, and the resulting waveforms sampled and decoded to
give an estimate of the transmitted symbol value.
Note that because the modulating signal
frequency modulator, successive values of
values, are encoded differentially onto
is integrated
{c } , the PRS m
the phase
by the
symbol
of the
transmitted carrier. This requires that successive phase samples
be compared in the decoder to give the PRS value, which is then
28

Univers
ity of
Cap
e Tow
n
decoded into data words by a simple mapping (Table 3.2).
The results reported in ( 4 .1] for system error rates are all
analysed in terms of E /N , the ratio of bit energy to noise b 0
density. This approach is only valid when the analysis is applied
to the correlation receiver, which is just an implementation of
the matched filter- [·4'~~·3, p .- · 505] . In the case of symbol-by-symbol
detectors, comparisons must be made on the basis of
signal-to-noise ratio (SNR) at the input of the sampler. Equation
(4.4) shows that carrier-to-noise ratio (CNR) may be used instead
of SNR, since the in-phase and quadrature carriers are scaled
directly by the values of the in-phase and quadrature signals,
respectively.
Values for E /N may be related to those of CNR according to b 0
E b
N 0
= (4.12)
where W is the baseband signal bandwidth, and R the bit rate
[4.4], [4.5]. For CORPSK(4-7, l+D) the data rate and the signal
bandwidth are equal, and therefore E /N and CNR are equal. b 0
Nevertheless, all comparisons will be in terms of CNR from now on.
The signal space diagram for CORPSK(4-7, l+D)
4. 5.
_3TT 2
a
+TT 2
is shown in Fig.
I
Fig. 4.5. Signal space for CORPSK(4-7, l+D).
29

Univers
ity of
Cap
e Tow
n
The signal phaser remains on the unit circle a.t all times. At
sampling instants, it may be located only at one of the four
stationary phase points. Although the symbol-to-symbol phase
shifts are not equiprobable (since they are derived by the
Duoquaternary rule), there is no absolute phase coherence in the
signal, and so, at the receiver, the signal phaser.may lie on any
stationary phase point with equal probability. Each of the
in-phase and quadrature signal vectors will therefore have value
+V (probability of 0.25), -V (probability of 0.25) or 0
(probability of 0. 5). The average signal power at the input of
each channel's sampler is then
p = p ·V2 + p ·V2 + p ·V2 + p ·V2 00 11 22 33
(4.13) ave
where P is the probability of the phaser being at phase point i, i
ie. a probability of 0.25. So, for the in-phase channel, with V = i
V volts,
p = I
=
p .y2 + p . 02 + p ·V2 + p . 02 0 1 2 3
0. 5 ·V2
Similarly for the quadrature channel,
p = Q
=
p ·02 + p ·V2 + p ·02 + p ·V2 0 1 2 3
0.5·V2
(4.13)
(4.14)
(4.15)
(4.16) This means that the RMS voltage at the input of each sampler is
v s = v
12 (4.17)
The detection threshold is a phase value situated between adjacent
stationary phase points - in the case of CORPSK(4-7, l+D) it lies
at odd multiples of rr/4. The receiver converts the received
in-phase and quadrature signals into a phase value and a decision
30

Univers
ity of
Cap
e Tow
n
I is made as to which phase point is represented by the coordinates.
The effect of channel noise is to turn each stationary point into
a region or cluster of possible sample points. Given that the
relevant measure of channel noise power is then the variance of
the noise, on a line joining adjacent stationary points, the
in-phase and quadratu-re-noLse components are _given, respectively, _
by
- -a.n f1n:r= ../2 •••• , •••• , •• , ••••• , •• ,. , ••• , •• ,(4 .18a} ·
and
a12 anD= J2 ...... ..-......--. •••...••.• -. .- .--.-~.-. (4 -.1-Sb)
For normalized baseband signals cos(¢(t)) and sin(¢(t)) (ie.
v = 1),
l ( Va 1 . · · ( - - 9 ) CliR•20.,· 0910 1 _--T••·••••·••••••••••'*••••·• ·4.1: · O'n .
! ...-....-,.A,.
CNR in [dB]. Therefore,
v s lOCNR/20 = (}" n
and
(}" = V • l 0-CNR/20 n s
= Q. 707·10-CNR/20
From (4.18) and (4.19),
(j nl
and
(}" nq
= 0•5·10-CNR/20
= 0. 5 '.10-CNR/20
(4.20)
(4.21)
(4.22)
(4.23)
(4.24)
These are then the values used for scaled noise voltages added to
31

Univers
ity of
Cap
e Tow
n
the sampler inputs in the noise performance simulations of Chapter
5, as well as the error rate measurements of Chapter 7.
4.3.3 Error Detection
CORPSK employs correlative coding to yield a PRS-shaped phase
trajectory in the transmitted carrier. As mentioned in Chapter 3,
such coding schemes exhibit a natural -0oding-redundancy, which can
be used for the detection, and sometimes even the correction, of
errors in the received data. Chapter 3.4 outlines the coding rules
whereby errors may be detected in conventional PRS systems. The
equivalent rules in CORPSK( 4-7, l+D) are:
1. No two adjacent phase shifts may be of opposite sign.
2. If a nonzero phase shift is followed by another of
opposite sign, there ~ust be an odd number of zero phase
shifts between them.
3. If a nonzero phase shift is followed by another of the
same sign, there must be an even number of zero phase
shifts between them.
In the symbol-by-symbol detection process, only the start- and
end-points of the phase shifts are used to decode data. For a
given input data word, the two possible Duoquaternary phase
sh if ts are complementary they traverse the unit circle in
opposite directions, but reach the same end-point. The direction
of the phase transition contains the inherent redundancy of
correlative coding. Only if accompanied by an efficient frequency
discriminator scheme (to detect transition direction) is
symbol-by-symbol detection able to realize the use of this coding
redundancy.
REFERENCES
[4.1] D. Muilwijk, "Correlative Phase Shift Keying - A Class of
Constant Envelope Modulation Techniques," IEEE Trans.
Commun., Vol. COM-29, No. 3, March 1981, pp. 226-236.
[4.2] R. de Buda, "Coherent Demodulation of FSK with Low
Deviation Ratio," IEEE Trans. Commun., vol. COM-20, No. 3,
32

Univers
ity of
Cap
e Tow
n
[4.,3]
[4.4]
[4.S]
-·
June 1972, pp.
B. P. Lathi,
Systems, Holt,
429-435.
Modern
Rinehart
Digital and
and Winston,
Analog Communication
1983.
K. Feher and the Engineers of Hewlett-Packard,
Telecommunications Measurements, Analysis, and
Instrumentation, Prentice-Hall, Inc., Englewood Cliffs,
N. J.
B. Sklar, "A structured Overview of
communications A Tutorial Review Part
Communications Magazine, August 1983, pp. 4-17.
33
Digital
1," IEEE

Univers
ity of
Cap
e Tow
n
I
I
CHAPTER 5
CORPSK SIMULATION RESULTS
Performance of the system CORPSK(4-7, l+D) was simulated both to
verify and to extend the results given by Muilwijk [5.1], who
reported only on the output spectrum and error perform&nce. ,All of
the following simulation results were produced on MathCad 2. 50,
(Appendix C) except for the noise error simulation, which was by
means of a program written in Turbo Pascal (Appendix D). The
MathCad listings are commented, so no further explanation of
method will be given here.
5.1 Baseband eye diagrams
Fig. 5 .1 shows the eye diagram for one channel (in-phase or
quadrature).
·! •..
i • ••• 1 i
. '. , . I .. . ,, I'' .. ·
. :. ,·. _: 1;; :: . :. 1 ••..•.
! . ... !':: .. ' ••I ';: •
.: "! .. :.·
'.· .· ',· ..
: .. 0 T
s
:! I I ·.;' ..... i . . :: I · ..
. . . .. .· . : .· . ~ ;
. : .
i i !
... i ·: :; i
. . . . . . . . I
; ! ! I
.. : ! i I
! 2T
s
Fig. 5.1. Eye diagram for one channel.
This result forms a useful standard by which to assess the
performance of the final digital implementation. Such comparisons
are made on the basis of degradations in vertical and horizontal
eye size.
5.1.1 Vertical eye opening (VEO)
At each sampling instant, the phase of the CORPSK(4-7, l+D) signal
can only be a multiple of rr/2. Therefore, since each channel
34

Univers
ity of
Cap
e Tow
n
represents either the (scaled) cosine or sine of the phase angle,
the sampled value can only be 0 or ±c, c real (for purposes of the
simulation, c = 1). Both the upper and lower eyes are at their
maximum opening. Any degradation in VEO in the practical
implementation would be from hardware imperfections (resulting in
uncontrolled amounts of intersymbol interference), or from channel
noise. This- d:egradat-ion is expressed,· in dB, as ·a ratio between
the practical VEO and the theoretical.
5.1.2 Horizontal eye opening (HEO)
The horizontal eye width (at the widest point) is estimated to be
0.4 of a symbol period. The HEO value can be degraded, in
practice, by the effect of imperfect transmission filters, and the
effect of channel group delay (which includes a contribution from
hardware). The greater the HEO, the greater the system's tolerance
to sample timing errors at the detection stage.
5.2 Constellation diagram
Fig. 5.2(a) shows the X-Y diagram, and 5.2(b) the constellation
diagram of the signal.
, /
/
____ ,.._. _____ -··--·.
·· .... , '\\
.. ...
\ /· I \
I \ ( I \ J \· I \ l \ I
,·; \ /
....... .,,..... .. _,~
....... , .... ··---......__ __ ·~--·-'"·_,,.-----·~
•
•
•
Fig. 5.2. (a) X-Y diagram and (b) constellation
diagram for CORPSK(4-7, l+D)
35
•

Univers
ity of
Cap
e Tow
n
-
The circular X-Y plot (Lissajous figure) indicates that CORPSK has
a constant envelope (the phase of the CORPSK carrier is seen
as a rotating phasor of unit length). In practice, any
fluctuations induced in· the envelope will be indicated by a
broadening of the circular band. Again, this degradation may be
expressed as a dB ratio relative to the average carrier envelope.
The constellation diagram (Fig. 5. 2. ( b)) shows the four phase
states. The effect of channel noise is that each of the four dots
becomes a "cluster" whose diameter is related to the noise power.
The decision distance in the signal space is then no longer the
distance between the four individual dots, but between some region
within each of the clusters, and so the noise immunity is
impaired. No cluster has an "edge" because noise with an infinite
crest factor can theoretically generate infinitely large values,
whatever the variance.
5.3 Signal spectra
The simulated baseband spectrum (Fig. 5. 3 (a) . ) corresponds well
with the results of Muilwijk [5.1], shown in Chapter 4.
I · I 10 dB/
0 f b
2f b
3f b
4f b
Sf b
6f b
Fig. S.3(a). Simulated normalised CORPSK(4-7,l+D) signal spectrum
There are no periodic sidelobes this is the effect of
pulse shaping before the angle modulator (the frequency pulse
therefore has no discontinuities). The final bandpass spectrum
(in-phase and quadrature modulated carriers added) is shown in
36

Univers
ity of
Cap
e Tow
n
Fig. 5.3(b).
I · I 10 dB/
0 w c
INf I I l I I ]15h I I I I I
1~n... i I I I 1~~r·1. , 1 . ' I 'I ., •..JA.il1~. , , I
! ,,.,,,,~11· · TTiJ1i ~ · ·• · · . i I I 'kl +~o/~~,~ .. ~i!tf~•:t!·~~,
2w 3w 4w 5w 6w c c c c c
Fig. 5.3(b). Simulated bandpass spectrum for CORPSK(4-7, l+D)
5.4 Carrier regeneration and symbol timing recovery
Simulations were performed to investigate the use of circuit
nonlinearities for the regeneration of a carrier signal at the
receiver.
The standard approach is to use a nonlinearity of order n, where n is the number of signal phase states located symmetrically in the
signal space [5.2]. In our case, n is equal to four. A
second-order nonlinearity is inadequate for this purpose, as Fig.
5.4(a) shows. Only the second-order signal harmonic appears, with
no discernible carrier information.
I · I 10 dB/
0 w c
2w 3w c c
4w 5w 6w c c c
Fig. 5.4(a). Second-order spectrum for CORPSK(4-7, l+D)
Use of a fourth-order nonlinearity yields good results (Fig.
37

Univers
ity of
Cap
e Tow
n
5.4(b)). In practice, this would be implemented with two balanced
mixers cascaded, each acting as a squarer. A simpler approach is
to use a full-wave rectifier, which will yield all orders of
signal. Simulation of this method (taking the absolute value of
the signal) yields identical results over the frequency range of
interest, with no discernible forms of aliasing error arising.
10 dB/
0 w 2w 3w 4w Sw 6w c c c c c c
Fig. 5.4(b). Fourth-order spectrum for CORPSK(4-7, l+D)
Symbol-timing components are located symmetrically about 4w ; c
their frequency separation is proportional to the symbol rate. A
symbol-rate clock may be created by locking onto two components
(or one component and the fourth-order carrier) and multi plying
them to give a difference frequency. It can be seen from Fig.
5.4(b) that the symbol-timing components are small in amplitude,
and that there appears to be some phase noise around them. These
two factors may, in practice, impair the success of this
symbol-timing recovery approach.
5.5 Effects of hard limiting on the output spectrum
Hard limiting is of ten used in, for example, satellite
transponders as signal conditioners prior to power amplification,
to prevent large amplitude swings. The usual approach is to follow
the hard limiter by a bandpass filter, tuned to the carrier
frequency concerned. This configuration is referred to as a
"bandpass limiter" (BPL). Any modulation schemes used in such
systems must obviously exhibit as high an immunity to such
operations as possible. Signals with nonconstant envelopes, such
38

Univers
ity of
Cap
e Tow
n
as filtered QPSK or MSK (filtered to reduce out-of-band signal
levels), usually experience spectral spreading as well as coupling
between in-phase and quadrature channels.
Appendix A describes the effect of a bandpass limiter on the
system carrier-to-noise ratio and the mechanisms of spectral
spreading and quadrature crosstalk- in· QPSK and MSK.
Constant-envelope systems such as CORPSK are more immune to these
last two effects, and can therefore enjoy the benefits of using
bandpass limiting.
Fig. 5. 5 shows a hardlimi ted CORPSK spectrum (compare to Fig.
5.3(b)). No sidelobes have been generated, but the out-of band
noise level has increased remarkably. This is because the
simulation modelled a pure hardlimiter the Heaviside step
function was used, and this is just a mathematical zero-crossing
detector. In practice, a bandpass limiter (BPL) would be used. The
effect would be to reduce the out-of-band signal level, leaving
the still well-defined main spectral lobe.
10 dB/
0 2w c
3w 4w Sw c
w 6w c c c c
: Fig. 5.5. Hardlimited CORPSK(4-7, l+D) spectrum __J
5.6 Error performance in the presence of noise
The effect of Gaussian channel noise on the performance of
CORPSK(4-7, l+D) was simulated with a Pascal program (listed
in Appendix D). Symbol-by-symbol sampling was assumed, and the
results were used to predict the performance of the final hardware
implementation. Fig. 5.6 is the program flowchart.
39

Univers
ity of
Cap
e Tow
n
BEGIN
Read Pulse shape
Open O/P file
New byte
Precode/ PRS Rule
Count trajectory
Add noise
Detect and Decode
Compare and count errors
Write P(e)
Increment CNR
N y
N
Fig. 5.6. Noise simulation program flowchart
40

Univers
ity of
Cap
e Tow
n
The phase pulse sample values are read -in from disk and a_ data
file is opened for program output. Simulations begin for a SNR
value of 1 dB., A random four-level word is generated and precoding
is performed. The Duoquaternary function is performed on the
precoder output, yielding a seven-level word. Based on this value,
the· previous- two values; - ana· -the phase state three symbols
previously, a phase trajectory is calculated using the phase
pulse, scaled accordingly. The in-phase and quadrature channels
are created by taking the cosine and the sine, respectively, of
the phase function. Gaussian-distributed noise values are added to
these signals separate values are used for each channel to
ensure that there be no correlation between in-phase and
quadrature channel noise.
The I and Q channels are then sampled separately and these
"Cartesian" coordinates converted into a phase angle. A decision
is then made as to which of the four signal space points is
represented by this noise-corrupted phase value. Fig. 5.7
illustrates.
x ' ' ' ' ' '
a
/ /
/
/ /
/
:~+Y<}i)~f /·: ----.......:._~ .. :~.~~~~~:.~~!~~~~~~;~ .. -.------/-/-/~,;,..-,-,------~~
... ~·.:· .. _ ... / ' / '.
/ '
X 'X / . ·.··~:;/:~} ~~;:i>. ' '' _::=.,~'.~PF -
Fig. 5.7. Simulation signal space.diagram.
41
I
Univers
ity of
Cap
e Tow
n
Successive phase samples are then compared to give the original
Duoquaternary symbol value and the original data byte is decoded from this.
Finally, the received data byte is compared with the transmitted
value. A running total is kept of the number of mismatches and
this is used-, with the transmitted symbol count, --to compute----a
symbol error rate, which is continually updated on the screen.
Once one hundred errors have been registered, the symbol error
rate is written to a disk file. The channel SNR value is
incremented and simulation begins again.
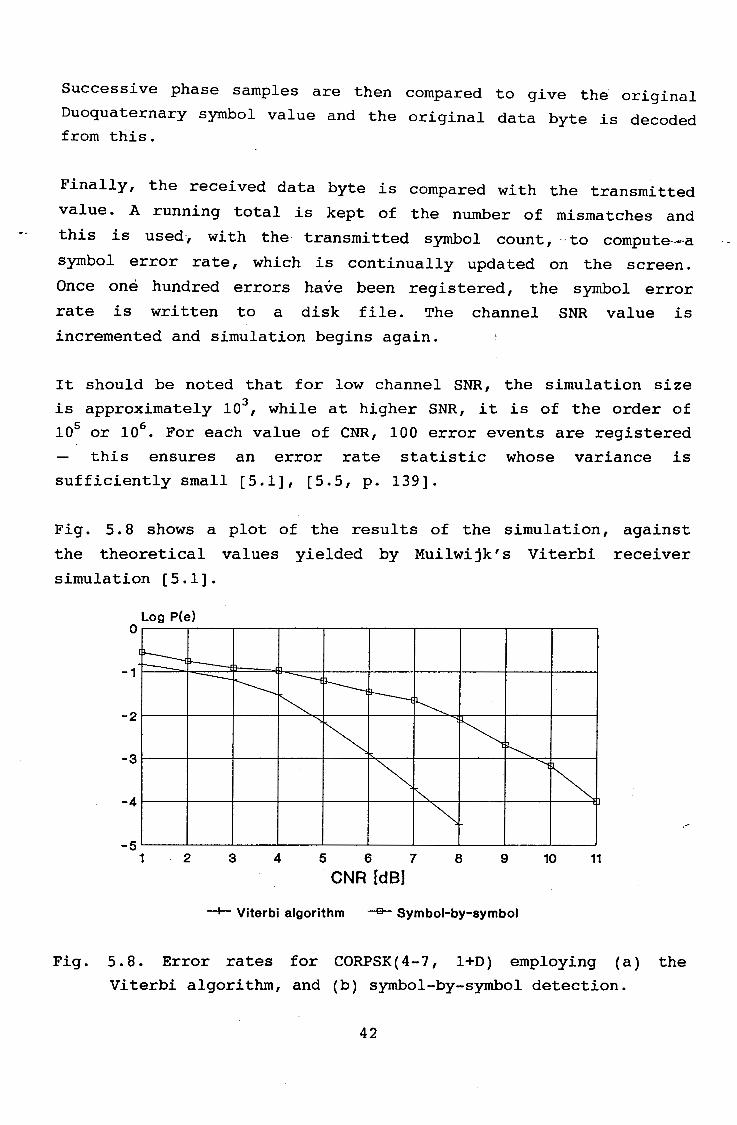
It should be noted that for low channel SNR, the simulation size
is approximately 103, while at higher SNR, it is of the order of
105 or 106• For each value of CNR, 100 error events are registered
this ensures an error rate statistic whose variance is
sufficiently small [5.1], [5.5, p. 139].
Fig. 5.8 shows a plot of the results of the simulation, against
the theoretical values yielded by Muilwijk's Viterbi receiver
simulation [5.1].
Log P(e) 0
-1 I~
~ --2
-3
-4
-5 1 2
--------~ ~ ~ ~ ~
~~~ l~ ~
~ "I
~ "" ~ 3 4 5 6 7 8 9 10 11
CNR [dB]
-+- Viterbi algorithm -a- Symbol-by-symbol
Fig. 5. 8. Error rates for CORPSK( 4-7, l+D) employing (a) the
Viterbi algorithm, and (b) symbol-by-symbol detection.
42

Univers
ity of
Cap
e Tow
n
As predicted, because symbol-by-symbol detection is a suboptimum
method, it yields higher error rates than the Viterbi, or
Maximum-likelihood (MLD), detection method. It is well-known that
the MLD approach yields a coding gain of 2. 5 to 3 dB over the
symbol-by-symbol approach in conventional PRS and PAM systems
[ 5 · 3], [ 5. 4]. It ·iS·· "'there.fore not surprising that Muilwijk' s
results are only 2 to 3. 5 dB better than our simulation, since
coherent demodulation of CORPSK yields a set of received signals
of the PAM type.
A possible source of error in the noise simulation relates to the
finite crest factor of the computer-generated noise. A Gaussian
noise value is created by summing twelve random numbers (each in
the range from 0 to 1) and subtracting 6 - this yields a Gaussian
value of zero mean and unit variance. The rms value is 1, but the
peak is limited to 6. The crest factor (ratio of peak to rms) is
then 6, or 15.5 dB. This value is then scaled appropriately for
the particular CNR in question. Whatever the final rms noise
value, the crest factor remains the same. Feher [5.5] calculated
the effect of finite crest factor noise on error probabilities for
4 PSK, 8 PSK and 16 PSK. The 4 PSK system provides a good
comparison since CORPSK( 4-7, l+D) uses four phase states. His
results showed that 15 dB crest factor noise provided valid error
rate results down to 10-8• The noise simulation only reaches 10-4
•
REFERENCES
[5.1] D. Muilwijk, "Correlative Phase Shift Keying - A Class of
Constant Envelope Modulation Techniques," IEEE Trans.
Commun., Vol. COM-29, No. 3, March 1981, pp. 226-236.
[5.2] R. Gagliardi, Satellite communications, Van Nostrand
Reinhold Company, 1984, Appendix B.3.
[5.3] H. Kobayashi, "Correlative Level Coding and
Maximum-likelihood Decoding," IEEE Trans. Inform. Theory,
Vol. IT-17, No. 5, September 1971, pp. 586-594.
[5.4] H. Kobayashi, "A Survey of Coding Schemes for Transmission
43

Univers
ity of
Cap
e Tow
n
or Recording of Digital DataJ" IEEE Trans. Commun.
Technol., Vol. COM-19, No. 6, December 1971,_pp. 1087-1100.
[5.5] Feher, K. and the Engineers of Hewlett-Packard, Tele
communications HeasurementsJ AnalysisJ and Instrumentation,
Prentice-Hall, Englewood Cliffs, N.J., 1987.
44

Univers
ity of
Cap
e Tow
n
CHAPTER 6
CORPSK MODEM DESIGN
The hardware described in this chapter does not implement the
CORPSK(4-7, l+D) modem fully. All the necessary modules required
for baseband testing were completed, as were all the
bandpass...;J:evel ·circuits. Of the synchronization subsystem, only
the carrier recovery section was completed. The recovery of symbol
timing, although simple in approach, proved unsuccessful using
only simple phase-locked loop technique.s. This aspect of
symbol-timing recovery is covered in Chapter 7.
All circuit diagrams referred to in the text are contained in
Appendix B, and will be referenced by their page numbers there.
6.1 System Description
The CORPSK( 4-7, l+D) modulator is shown in block form in Fig.
6.l(a), and the demodulator in Fig. 6.l(b).
The transmitter comprises a partial-response (PRS) encoder
followed by a phase-trajectory shaping module, which creates an
in-phase and quadrature symbol channel. Each channel contains a
digital-to-analog converter, lowpass filter and modulator. The
modulators have an in-phase and a quadrature carrier as inputs,
respectively. The outputs of the modulators are then summed to
give the final.bandpass signal.
Sin(w t) Q channel c
D/A H(w) PHASE Data PRS I ENCODER SHAPER
D/A H(w)
I channel Cos(w t) c
Fig. 6.l(a). CORPSK(4-7, l+D) modulator block diagram
45

Univers
ity of
Cap
e Tow
n
s t
CR STR
H(w)
H(w)
DEC. Data out
Fig. 6.l(b). CORPSK(4-7, l+D) demodulator block diagram
The receiver demodulates the received signal coherently into
in-phase and quadrature components and lowpass filters them to
remove high-order product terms. The I and Q channels are then
sampled separately, at the symbol rate. Successive sample-pairs
are compared by the decision circuitry to derive the value of the
transmitted symbol, and this is converted into a serial binary
data stream.
Carrier and symbol timing recovery are required for the receiver
to demodulate and sample the received signal correctly. Both these
functions are carried out by use of a circuit nonlinearity and a
phase-locked loop (PLL).
6.2 Pseudorandom bit sequence generator (PRBSG) (B.l)
"Out-of-service" testing is required to evaluate the performance
of the final modem prototype [6.1] ~ for example, to generate eye
diagrams or to perform bit error rate performance tests. This
requires that the modem be supplied with a data stream that best
represents a real-world sequence type. This can be achieved with a
"pseudorandom" bit sequence, generated by an n-stage shift
register and an EXCLUSIVE-OR gate.
The pseudorandom bit sequence pattern standardised by the CCITT
for data transmission rates of 2.048 Mbps requires the use of a
fifteen-stage pseudorandom bit sequence generator. A spectral line
46

Univers
ity of
Cap
e Tow
n
spacing /if results (Fig. 6.2.), where
/if = f
b
Power
( 6 .1)
Fig. 6.2. Spectrum of binary pseudorandom bit sequence
For a 2.048 Mbps system, /if is 62.5 Hz. The data transmission rate
of the CORPSK(4-7, l+D) modem is 120 kbps; the most suitable
specification for spectral line spacing may be derived by scaling
down the CCITT-recommended value. The required /if is then 3.66 Hz.
The use of a twenty-stage shift register yields /if of 0.11 Hz.
The prototype PRBSG employs four 7496 five-stage shift registers
(Ul-U4). Feedback is by means of a 7486 EXCLUSIVE-OR gate (U6) fed
from stages 17 and 20. A 7404 inverter (US) and R-C combination
presets the outputs of the shift registers to ensure that binary
one's are present in the loop at power-on (if only zero's exist,
there can be no feedback, and hence no data output).
6.3 PRS Encoder (B.2)
A block diagram of the partial-response encoder module is shown in
Fig. 6.3.
47

Univers
ity of
Cap
e Tow
n
Da i ~a_,I 2 - 4
levels
'1 '1 'O '1
' ' ' '
L
r--L--
I
evel ~hif ter
I a
k )
p=9
y k
I
Pre coder
I
b
·I ~ ,.,-._,11--
I Binary to 2's compl converter
.
k
T
Transversal filter
I I b
k-1
I
yk
" __J
( To phase shaper ( , Differential
I I Encoder
p k
I (
I To ~ Phase -
I II T I shaper
T
I p k-1
Fig. 6.3. PRS.encoder module block diagram
The input data stream is in binary format, and has to be converted
to a four-level signal {a }. The precoder output is given by k
b = a k k
b k-1
( 6 . 2 )
and can be formed by adding the two's complement of the {b } to k-1
the {a } . k
The system polynomial, F(D) = l+D, indicates the
addition of successive pairs of precoder output words,
bk-l 1 SI ie •
= b + b k k-1
b , s k
and
(6.3)
The output of the transversal filter, y k, is a three-bit word
48

Univers
ity of
Cap
e Tow
n
ranging from 0 to 6. This is to be placed symmetrically about zero
by subtraction, yielding
y = y - 3 k k
( 6. 4)
Therefore, {Y } = { -3, -2, -1, 0, 1, 2, 3 } . The output carrier k
,,..,...,,, ... phas·e change over one symbol, 11</> , is given by m
11</> = m
(6.5)
A differential encoder then adds successive Y (mod 4) to give the k
actual phase end-point of the transmitted phase symbol, P . The k
phase trajectory shaping module uses an appropriately delayed
replica of P as the starting phase point for the current symbol k
phase function and the tails of the preceding phase functions.
6.3.1. Two to four level converter (Ul, U2)
A 7496 shift register is clocked at
two-bit binary word at half the bit
f /2). A 74175 latches this word at b
the bit rate to provide a
rate ( ie. the symbol rate,
the symbol rate (a two-bit
word is the code representation of a four-level signal).
6.3.2. Precoder (U3, U4, US)
The two's complement converter is an exclusive-OR gate (7486); a
7483 summer performs the addition, while a 74174, clocked at the
symbol rate, acts as a delay element.
6.3.3. Transversal filter (U6)
This is effected by means of a 7483 summer and U4.
6.3.4. Level Shifter (U8)
This subtraction ( 6. 4) is also performed by two's complement
addition, with a 7483 summer. The second input to the summer is
the codeword '1101', ie. -3.
6.3.S. Differential encoder (U9, UlO) Again a 7483 and 74174 D-type flip-flop array are used.
49

Univers
ity of
Cap
e Tow
n
The current Yk is added to the ·output of the encoder, yielding a
running total. The modulo-4 property is provided by feeding back
only two bits of the output word to the input of the summer.
6.3.6 Symbol clock (U7)
All latches used in the two-to-four level converter, precoder and
differential encoder operate- at ·the symbol rate - U7A is a D-type
flip-£ lop configured as a single-stage binary counter to double
the period of the bit-rate clock.
6.4 Phase shaper (B.3, B.4)
The purpose of this module is to trace the carrier phase
trajectory over each symbol period. Each symbol trajectory is made
up of the current PRS input symbol convolved in time with a
lowpass filter step response, added to the tails of the previous
two PRS-convolved step responses, and all added to the final phase
point of the third-last symbol ( ie P ) . A further six phase k-3
points are to be interpolated on the trajectory, giving a total of
eight phase points per symbol. A large-capacity read-only memory
(ROM) can store the necessary phase path values, being addressed,
in addition, by a modulo-8 counter to count through the
interpolated points of the specified phase trajectory. The outputs
of this module. are the sine and the cosine of the phase trajectory
in analog form. Fig. 6.4 is the block diagram.
p k
y k
mod-8 clock
. I
(
l . ' (
l .
3T l=i1 T Inter-
....___ po la ting T ,____ ROM ,____
I I
Sin Sl ne
Table D/A Da ta
Cos Cos D/A .
Table Da ta
Fig. 6.4. Phase trajectory shaping module block diagram
50

Univers
ity of
Cap
e Tow
n
Each- -possible phase trajectory is uniquely specified by three
criteria:
the symbol pulse truncation length, v, in symbol intervals;
- the number of signal phase states, n;
- the number of possible phase shifts, N.
tt·The number of possible phase trajectories is therefore
N PT = v
N ·n ( 6. 6)
So, for CORPSK(4-7, l+D) with an interpolation factor of eight and
a pulse truncation length of three symbol intervals, 1372
possible trajectories result. To calculate the required ROM
capacity, these factors, v, n and N have to be powers of 2 - a
value of 8 is therefore assumed for N, and not 7. The ROM capacity
is then given by
R = NV ·n·71 ( 6 . 7 )
= 16384, or 16 kbytes,
where 11 is the oversampling ratio, 11 = 8.
It is clear from (6.7) tnat the required memory capacity increases
exponentially with v, the pulse truncation length - consequently,
truncation lengths greater than three symbol intervals, while
desirable, yield increasingly impractical implementations.
The delay elements in Fig. 6.4 are implemented with sets of
7496 shift registers, clocked at the symbol rate. Two registers
are required for the P , and three for the Y , to give P , Y k k k-3 k-2
and Y in addition to Y . These four codeword inputs together k-1 k
account for eleven ROM address bits. A further three ROM bits are
required for the modulo-8 counter input, yielding a total of
fourteen. The ROM is a 27128 (16k x 8) EPROM device.
The contents of the phase trajectory ROM were created by means of
a Pascal program (described in Appendix D).
51

Univers
ity of
Cap
e Tow
n
The sine and cosine look-up EPROMs (27Cl6's) are driven directly
by the output of the phase trajectory EPROM. Their contents were
also generated by Pascal software, listed in Appendix D. Two
DAC0800 D/A converters convert the sine and cosine digital words
into an oversampled analog signal. The differential current
outputs· of these- devices· -drive LF347-based current-to-voltage
converters. The in-phase and quadrature signals represent the
instantaneous Cartesian coordinates of the moving unit signal
vector.
6. Lowpass transmission filters (B.5)
In Pulse Amplitude Modulation (PAM) systems, it is desirable that
the transmission pulse shape have a relatively large response at
the symbol instant, and small response at subsequent multiples of
the symbol period. This minimizes intersymbol interference
(ISI). Such an all-pole lowpass filter solution is still
applicable in the design of the CORPSK modem. Although PRS
encoding deliberately introduces ISI, it is a controlled amount,
and subsequent ISI contributions must still be kept to a minimum.
Any excess ISI will cause a degradation in the system's horizontal
eye opening, and hence reduced immunity to receiver timing errors.
Lind and Nader [6.2] specify pole locations for such data
transmission filters.
For a normalized squared
transmission filter has an
error, E, of 10-4, a fourth-order
insertion loss (A ) of 3. 72 dB at N
wN, the Nyquist frequency.
attenuation is 60 dB. Assuming
At a frequency of 4.42·wN the
a roll-off of 6N dB/octave from the
point at wN, N=4, an attenuation of approximately 50 dB can be
expected at 4 ·w • N
The output spectrum of each channel's D/A converter will look
similar to that in Fig. 6. 5. If wN is chosen to be twice the
symbol rate (ie. equal to the bit rate), very little signal power
will fall within the transition region - filter group delays tend
52

Univers
ity of
Cap
e Tow
n
to be large here - and the repeated spectrum of the oversampled
waveform will fall at the filter's -50 dB point.
0 dB
I H( f) I jS(f)j
0 f s
I H( f) I
2f 3f s s
-24 dB/octave
4f Sf 6f s s
7f s s
8f
' '
s
Fig. 6.5. D/A spectrum and transmission filter characteristic.
The normalized pole positions are given by
P = -0.488949 ± )0 0.377055
1 2 ' ( 6 . 8 )
P3
,4
= -0. 243995 ± jO. 952931
These are implemented with a two-stage state-variable active
lowpass filter (Fig. 6.6.).
Bandpass output
R
'------o Law-poss output
Fig. 6.6. State-variable all-pole lowpass configuration.
53

Univers
ity of
Cap
e Tow
n
The
R 1
R 2
R 4
following
1 = 2ac
= R = 3
..
=
design equations apply:
( 6 . 9 )
1 (6.10)
~, .. ~.- c/ a.2 + (32
1 (6.11)
where A is the required de gain. The denormalized component values I
are found by employing denormalized a and (3 values, from
=
= (3 x ( 2rrf ) 0
f the new cutoff frequency. Choosing C = 0.1 nF with a 0
configuration, the first pole-pair is created with R = 1
= R = R4
= 1074 n. For the second pole-pair, R = 1359 3 1
= R = 674. 2 n. 4
6. In-phase and quadrature carrier generation (B.6)
(6.12)
unity-gain
6780 n, R 2
n, R = R 2 3
A carrier frequency of 432 kHz was chosen for convenience. A TTL
crystal oscillator (7404) generates a 3.456 MHz pulse train which
is divided down (by 8) to give the carrier frequency (74193). A
high-Q LC bandpass filter (LF347) isolates the fundamental
frequency, and its output drives the in-phase output driver and a
90° phase shifter, implemented with a unity-gain LF347-based
pole-zero element. This quadrature-shifted carrier signal then
feeds the quadrature output driver.
The 90 0 h p ase shifter is adjustable. The correct setting is
obtained by viewing both carriers on an X-Y oscilloscope, and
adjusting for a perfectly circular trace. Any deviation from this
54

Univers
ity of
Cap
e Tow
n
indicates not only a relative phase shift between the two
carriers, but also unequal carrier amplitudes.
6. Modulator (B.7)
Two SBL-1 balanced mixers are used to multiply the in-phase and
quadrature ·baseband signals by their respective .. ~-carriers. The
outputs are added in a virtual-earth configuration, thus reducing
the possibility of crosstalk. This final bandpass signal is then
amplified by a line driver stage, which isolates the output
channel by means of transformer coupling.
6. Receiver front end (B.8)
The channel is transformer-coupled into a pair of high-input
impedance noninverting amplifiers (LF347). The first provides a
buffered signal to supply the carrier and symbol timing recovery
module. The second supplies a line driver /power splitter stage,
whose two (identical) outputs drive the RF inputs of the
coherent demodulator.
6. Carrier and symbol timing recovery module (B.9, B.10)
Simulations indicated that a fourth-order nonlinearity was
required for recovery of the receive carrier from the received
bandpass signal (Chapter 5, §4). In addition, results showed that
a multi-order nonlinearity ( eg. full-wave rectifier) would not
cause undue aliasing error in the recovery spectrum.
A phase-locked loop (PLL) with a free-running frequency of 4w is 0
preceded by a precision full-wave rectifier and a Q-adjustable
resonant circuit [6.3].
The PLL is an EXAR device, the XR-215, configured as a tracking
filter. A free-running frequency of 1. 728 MHz is required. A
fairly narrow capture range is required, since the carrier
component at 1.728 MHz is surrounded by symbol timing components
55

Univers
ity of
Cap
e Tow
n
60 kHz away. A capture range, ~w , of 10 kHz was chosen. The lock c
range, ~w , must be no less than the capture range, and a value oL L
20 kHz is·therefore chosen.
6. Detector and decoder (B.11 - B.13)
· ···A block ··dia:gram ·of the detector and decoder module is shown below,
in Fig. 6.7.
The information-carrying function in CORPSK is the carrier phase,
encoded differentially. Symbol-by-symbol sampling requires that
the phase be sampled at the end of each symbol period, and
successive samples compared to give the value of the original PRS
symbol.
The in-phase and quadrature signals represent the x and y
Cartesian coordinates of a moving signal vector of unit length. ' Each sample-pair therefore represents the coordinates of the
Q Signal
I ·signal
A/D
A/D
Para to
serial
Rectangular to
polar converter
Data out
A
F=A-B-1
T B
Fig. 6.7. Detector and decoder block diagram
F
vector at the end of each symbol period. A rectangular-to-polar
conversion yields the symbol-end phase values.
The phase values from the current and the last symbol interval are
compared according to the function
56

Univers
ity of
Cap
e Tow
n
a' k
= [ [ [ ~ k - ~ k-1 J . ~ J l ] mod 4 (6.13)
to yield an estimate of the original four-level data value (See
Ch. 3). This is then converted into serial form.
The incoming in-phase and- quadrature signa,ls- are sampled at the
symbol rate by an ADC0820 analog-to-digital converter (ADC). The
incoming signals are symmetrical about zero volts, and so level
translation and scaling are performed by operational amplifiers
(LF347). The ADC's are negative-edged triggered by a 600 nS pulse,
provided by a 74123 monostable multivibrator.
The two ADC's have eight-bit outputs, and these are combined into
a sixteen-bit address for a pair of 27256 (32k x 8) EPROM's. The
Cartesian coordinate input is converted into an eight-bit
phase value. Fig. 6. 8 shows the range of output phase values
relative to the (noise-corrupted) constellation diagram.
10000000
/ /
/
10111111 /
/ /
/ /
/
a
'
/ /
/ /
' ' ' '
/
'
/ /
/
' ' '
I
00000000
11111111
Fig. 6.8. Rectangular-to-polar conversion.
57

Univers
ity of
Cap
e Tow
n
The phase of each received sample will be in the region of
multiples.of rr/2 because of the "spreading" resulting from channel
noise. The decoder makes a decision as to the original transmitted
phase value by truncating the eight-bit phase value to two,
thereby representing each of the four states by a unique codeword.
Clearly, the slightest corruption of the received signal by noise
could cause decoding errors because of the rounding-down effect of
truncation. For this reason, the rectangular-to-polar
transformation deliberately introduces a rotation of the
coordinate axes by rr/4 so that the codeword output can represent a
phase region, and not just a state. The Pascal program that
created the EPROM look-up table is listed in Appendix D.
A 74181 arithmetic logic unit (ALU) implements the subtraction
function expressed in (6.13). The inputs are the current and the
last phase region codewords, provided by a pair of 7496 shift
registers clocked at the symbol rate. The two-bit output of the
ALU is the parallel representation of the two binary data bits
transmitted. A 74151 multiplexer has, as one address input, the
symbol rate clock which provides two logic states per symbol. The
multiplexer output is therefore switched cyclically between the
two ALU output lines, and this gives the final serial data stream.
Every output bit is compared (by a 7486 EX-OR gate) with a delayed
replica of the transmitted bit to give an error signal when there
is a mismatch. A 74175 latch ensures that the source and decoded
bits are exactly synchronized. An estimate of the system bit error
rate can be made by averaging the frequency of error signals,
relative to the number of bits sent. An optical error signal is
also provided, for system adjustment.
REFERENCES
[6.1] Feher, K. and the Engineers of Hewlett-Packard, Tele
communications Measurements, Analysis, and Instrumentation,
Prentice-Hall, Englewood Cliffs, N.J., 1987.
58

Univers
ity of
Cap
e Tow
n
[6.2] L. F. Lind, S. E. Nader, "Design Tables for a Class of
Data-Transmission Filters." Electronics Letters, 15
September, 1977, Vol. 13, No. 19, pp. 564-566.
[6.3] Feher,
Signal
Cliffs,
K., Advanced Digital
Processing Techniques.
N. J., 1987.
59
Communications Systems and
Prentice-Hall, Englewood

Univers
ity of
Cap
e Tow
n
CHAPTER 7
SYSTEM TESTING AND EVALUATION
7.1 Test requirements
The primary performance parameter in any digital transmission
system is the rate at which errors occur in the recei:v-ed data
stream. The major degradations affecting this are [7.1]
1. Power amplifier AM to PM conversion.
2. Compression and expansion of signals by nonlinear
amplifiers.
3. The introduction of excessive amounts of intersymbol
interference (ISI) into the signal.
4. Reduced orthogonality in quadrature modulators.
s. Timing errors.
6. Carrier phase offset and jitter.
·Any evaluation of a modulation scheme's performance should assess
at least some, if not all, of these factors. In the case of the
CORPSK(4-7, l+D) system implemented, the first two are not
measured explicitly, although the behaviour of the system spectrum
under conditions of hardlimiting is simulated.
All-pole baseband transmission filters minimize the introduction
of uncontrolled ISI, and a qualitative assessment is made of their
efficacy.
The effect of reduced modulator orthogonality is the introduction
of envelope fluctuations as well as jitter in the recovered
carrier. Both of these are measured here. An assessment of
quadrature carrier orthogonality is performed.
The synchronization subsystem does not address directly the
recovery of symbol timing, but the peak-to-peak jitter of the
recovered carrier is measured.
Also, system performance has been characterized by the measurement
of intermediate parameters such as baseband spectra.
60

Univers
ity of
Cap
e Tow
n
All time-domain measurements were performed with a Hewlett-Packard
54501A 100 MHz digitizing oscilloscope, while an HP 8590A spectrum analyser was used for spectral measurements. All printouts from
·these instruments were by means of an HP Thinkjet printer.
7.2 Baseband channels
7.2.1 Eye diagrams
Vmarker2C 4) Vmarker 1 ( 4) deltaVC4)
-1. 42188 v -281. 250mV -1. 14063 v
stop marker: start marker:
delta t: 1/delta t:
6.64000us 2.64000us 4.00000us 250. OOOkHz
l .tit markers -~j Off +.UM
l start marker ~
Fig. 7.l(a). Baseband eye diagram for one channel (measured
after transmission filter)
Fig. 7 .1 (a) shows the baseband eye diagram for one channel,
measured after the transmission filters. The vertical eye opening
(VEO) has been degraded by circuit imperfections, such that the three signaling levels have been broadened into regions. The oscilloscope voltage markers have been placed at the upper and lower edges of the lower eye. The baseband signal has a
peak-to-peak voltage of 2.9V. Hence a performance degradation
61

Univers
ity of
Cap
e Tow
n
[7.1, p. 23] is introduced, of 20·log (1.45/1.14) = 2.1 dB. 10
The horizontal eye opening (HEO) is 3.8 µseconds. This represents
(4.0 x 10-6 x 60 x 103
) = 0.24 of a symbol interval. Our
simulation results (Chapter 5 §1. 2) predicted a HEO of 0. 4 of a
symbol interval. A degradation of 20·log10
(0.4/0.24) = 4.4 dB has
therefore resulted (if the symbol-by symbol sampling occurs at the
eye midpoint, then this degradation in HEO is of little
consequence).
[ Vmorker 1 ~
4 IMif+"UllRTJ
[ ~t •arkers ;;;;-1 off M1hM J
; !C start marker ~
L-50000-;;;· -- - - _:399:Jgg)-- ---- -- i04000-u~ 1r ·top ·•rk er !J 2.00 us/div
Vmarker2( 4) -4. 50000 V stop marker: 2. 44000us I/marker 1 C 4) -1. 06250 V start marker: -1. 56000us delta V< 4) -3. 43750 V delta t: 4. ooooous
1/del ta t: 250. OOOkH2
Fig. 7.l(b). Baseband eye diagram for one channel (measured
after D/A).
Fig. 7.l(b) shows the same channel's eye diagram, measured before
the transmission filter, at the output of the digital-to-analog
converter. The D/A output signal exhibits a first-order transient
of the order of 1 µsecond, most likely caused by circuit layout
and hardware imperfections. The result is that the eye is severely
distorted, and the width of the signaling levels is similar to
those at the transmission filter outputs ie. the VEO has been
(
62

Univers
ity of
Cap
e Tow
n
impaired. Also, the HEO has been reduced. The eye opening is, in
fact, slightly distorted compared to that at the filter output,
showing that the transmission filters actually "clean up" the
signal before transmission.
7.2.2 Baseband spectrum
The output of the D/A converter of each baseband channel is an
oversampled waveform, 8 samples per symbol period. The baseband
spectrum, centred at 0 Hz, is repeated at multiples of the
sampling rate. Fig. 7.2. shows the spectrum analyser plot.
-'1:7 DIA CONVERTER OUTPUT SPECTRUI' MKR 8 120 kHz REF -86,6 dBm ATTEN 10 dB -64.51 dB PEAK ·········:·········:·········:·········:········· ·········:···-·····:·········:··-····-·:··-·-····
~~~ .. ·······:·········:·········\·········\·········I·········~·-·······:····· .............. · ........ . ···;,;Ri<~R·-~··: ......... : ......... : ......... \········:·········:--:······:·········:·········
J~: -~~z dB I : ........ : ......... : ......... : ......... : ....... .
M~ .. : ......... : ......... : ......... : ·j· .~'.~.:. ~~\. .. : ......... : ......... : ......... : .. .1~! ~: : : : : ~ : : : :)"'
WA SB ········m: ........ · ..... ~ .. :·· .. ~ ·······:·····--~~r;~·:··J··i······~·-:· ...... . FS ......... :.. . . ~·'Y'.· .. -¥.J~ ..... : ......... : ......... : ........ 4 .. :N .. ..... ~·./ ........ .
CORR · · · · · · . . :
··································································································· . . . . . . . . . . . . . . . . . . . . . . . . . . . . . . . . . . . cEN r E R··540·:0··i«f.i;.;················-·································sPfiii··1·.-;,i00··i-if.i;.;
#RES BW 300 Hz vew 300 Hz SWP 30 s~o
MARKER -t CF
MARKER DELTA
NEXT PEAK
NO:T PK RIGHT
NE~"{T PK LEFT
PEAK EXCURS~I
Fig. 7.2. Spectrum of one unfiltered baseband channel.
This spectrum is composed of a continuous part and discrete
components at multiples of the symbol rate. Similar results were
found in [7.3], where a system comparable to CORPSK is described.
The spectrum in Fig. 7.2. appears to have a high residual noise
level surrounding the main lobe, so that it does not fall to the
low value predicted by simulations. The probable cause of this is
63

Univers
ity of
Cap
e Tow
n
D/A converter noise - a similar effect occurs in the work of
Maseng in [7.3], where measured values are 10 to 15 dB worse than
predicted. The spectral efficiency is approximately 0.5 bps/Hz.
The filtered baseband spectrum is shown in Fig. 7.3.
,.PF IL TERED BASEBflNO SPECTRUM MKR 11 -1213 kHz REF -36.6 dBm ATTEN 10 dB -59.60 dB PEAK ............................. ··················· ················································· ~ge : : : I : : : : dBi ~~~~~:H~ L L~·················································
·-s9 ,60 dB. . . ;: ········~·········:·········:·········:···· .. ···
·········'.·········:·········:·········:·····; ·:··\,;·····:·········>········:·········:········· : : : : I : \: : : : l•JA SB·········:·········:·········:·······~;;·····:······-~.~·······:·········:·········:
c6~ R :,;~~;~~~+~~~~::Ii:·:::::·: i:: ·::::·:~::~~0.~~+~~;;;;:.: ·:.: . . . . . . . . . . . . . . . . . . . . . . . . . . . . . . . . . . . .
CENT ER··555·:0··kH~·································· .. ··············3p-;;i;~··i"·:000··i·iH~ #RES BW 300 Hz UBW 300 Hz SWP 30 s~c
MARKER NORMAL
Mt1RKER DELTA
MARKER AMP TO
MKNOISE on OFF
MARKER PAUSE
MARKERS . OFF
Fig. 7.3. Spectrum of one filtered baseband channel.
Although the filtered spectrum lacks the definition of the
unfiltered case, all higher-order sampled spectral lobes have been
eliminated. Some insertion loss is apparent in the region from 60
to 120 kHz this causes a "rounding" of the edges of the
spectrum. (Note also that the transmission filters trade off their
improved ISI characteristics against a reduction in spectral
roll-off).
7.3 Transmission filters
Below is the frequency response of the baseband transmission
filter.
64

Univers
ity of
Cap
e Tow
n
4J:7 LOWPASS FILTER FREQUENCY RESPONSE REF -42.6 dBm ATTEN 10 dB -47.59 dB PEAK· ·········:·········:···················:········· ·········:·········:·········:··················· LOG 10 dB/
. . . . . . ················································· ················································ . . . . . . . .
. . . . ................................................. ················································ MARKER a · · · · · 120 kHz : . : . .. .............................................. . -47.59 dB : : : : :
·········[··'······:·········:·······~·[·\~~~·····[·········j·········j·········
"~ss··················~···························~······ CORR : · · : . . . . . . . . . . , . . . ..... , ............................................................................................ . . . . . . . . . . . . . . . . . . . . . . . . . . . . . ................................................................................................................................................................................. CENTER 707.5 kHz SPAN 1.000 MHz
#RES BW 300 Hz 'JBW 300 Hz SWP 30 sec
MARKER NORMAL
MARKER DELTA
MARKER AMPTD
Ml<HOISE on OF"F
MARKER PAUSE
MARKERS OFF
Fig. 7.4. Frequency response of baseband transmission filter.
An insertion loss of approximately 3.7 dB is expected at 120 kHz.
A 24 dB/octave rolloff is expected from that point. There is,
irideed a loss at 120 kHz, estimated to be 2 to 3 dB. From 120 kHz
to 240 kH~, the spectrum rolls off about 16 to 18 dB and flattens
out.
7.4 In-phase and Quadrature carrier generators
7.4.1 Spectra
47 CARR I ER GENERATOR SPECTRUM <ONE CHANNEL) REF" - 3.6 dBm ATTEN 10 dB -32.03 dB PEAK ··-······:··-·····-:······-··:·········:····-····:·······-·;·-·-·-··-:·········:··-·-····:·····-··-LOG . . . : : . : 10 ·········: ......... :. ·······:·········: .. ·······:······· .. ;·········:·········:·········:········· dB/ : : . : :
WA SB FS
CORR
. . . . . . . .................................................................................................. MARKER A 435 kHz -32.03 dB . .
. . . . . . . . . . . . . ·················································· . . . . .
. . . . . . . . .................... ····················· ...................................................... . . . . . . . . . . . . . . . . . . . . . . . . . . . . . . . . ··················· ····················· ······················································· . . . . . . . . . . . . . . . . . . . . . . . . .
. . . . . . . . s TA RT ·0--ti;;····························aFFsr··::76~;·:0--i<·H";;··5;:op··2·:000··i-iH'~·
#RES BW 300 Hz VBW 300 Hz SWP 60 s•o
MARKER NORMAL
MARKER DELTA
MARKER AMP TD
MKHOISE on OFF
MARKER PAUSE
MARKERS OFF
Fig. 7.5. Spectrum of transmit carrier (one channel only).
65

Univers
ity of
Cap
e Tow
n
The spectrum for one channel of the in-phase and quadrature
carrier generator is shown in Fig. 7.5. The first harmonic is over
32 dB down in amplitude from the fundamental. The third harmonic
is approximately 50 dB down. Also, there is little phase noise on
the fundamental, any components being approximately 50 dB less
than the component at this frequency. Both channels exhibit
similar characteristics.
7.4.2 X-Y diagram
The Lissajous figure of the in-phase and quadrature carriers will
show imperfections in orthogonality as well as carrier waveform
distortion. Two equal-amplitude sinusoid carriers, perfectly
orthogonal and distortion~free, will generate a perfectly circular
trace. Since their relative phase is adjustable in this design, a
perfectly circular trace was obtained, with no discernible bulges
or dents whatsoever - these would indicate waveform distortions.
7.5 Modulator
7.5.1 Output spectrum
This is shown in Fig. 7.6 •
.IP MODULATOR OUTPUT SPECTRUM REF -86.6 dBm ATTEH 10 dB -35.97 dB PEAK ·•·······:·········:·········:·········:·····-··· ·········:·········:·········:·········:········· . . . . . . . . LOG : : : : : . 10 ·········:···· .. ·············:····· .. ··:········· ·········:······ .. ·:··· .. "··:·········:········· dB/ : : : : : : : . . . . . . ················································· ................................................ .
MARKER a : . : : -445kHz : : :
~~~f·d~·········••.I·•·•··· .. ••••••••••••••P~F T ~~~:B ·········~·········~ ... ).~ ... ~ ·~~·-·· ..... ~~. !'!. .. ~ ....... ~-·······:\·~·:· . ~~ . : ···'\t{"· : ~·· : : 1~- . '+' . . . . . . . . ················································· ................................................ . . . . . . . . . . . . . . . . . . . . . . . . . . . . . . . . . ·-·-·······-·-···--··-·····-·--·-----·-·········· ........................................................................................ . CEHTER 577.5 kHz SPAN 2.000 MHz
IRES BW 300 Hz VBW 300 Hz . SWP 60 sec
Fig. 7.6. Modulator output spectrum.
66
MARKER NORMAL
MARKER DELTA
MARKER AMP TD
MKNOISE on OFF
MARKER PAUSE
MARKERS OFF

Univers
ity of
Cap
e Tow
n
The carrier frequency is 432 kHz. The spectrum analyser exhibits
some frequency drift, and so the carrier frequency appears higher
on longer sweeps.
7.5.2 Signal envelope
Any fluctuation in the output signal envelope represents a
- degradaticm~in -system performance. Two approaches are available
for assessing envelope fluctuations, each method highlighting
different causes. They are, firstly, by analysing the X-Y diagram
(Lissajous figure) of the baseband in-phase and quadrature
modulating signals, and, secondly, by measuring the envelope
fluctuations directly. The former method will show how much
degradation is introduced by the effects of phase pulse
truncation, as well as D/A and transmission filter imperfections
(unequal group delays in each channel, for example). The latter
will show the contribution not only from these, but also from the
mixers and bandpass-summer circuitry of the transmitter.
7.5.2(a) X-Y diagram
The XY diagram created by the in-phase and quadrature channels
should, in an ideal system, be a perfect circle with an infinitely
narrow trace width. Since the trace represents the final signal
envelope in a baseband form, envelope fluctuations are seen as a
spreading of the trace into a band. See Fig. 7.7.
Vpk+Vave-~ a
----~I
Fig. 7.7. Envelope fluctuation measurement by baseband analysis.
67

Univers
ity of
Cap
e Tow
n
If envelope fluctuation can be described as a ratio between
envelope peak and the average (ie. V vs. V )' then pk ave
measured fluctuation is 20·log (4.8 divs I 4.4 divs) = 0.76 dB. 10
7.5.2(b) Direct measurement of envelope fluctuations
the
the
An assessment is also obtained by viewing the modulated signal in
time and estimating the width of the fluctuation "'band" ~that
appears on the top and the bottom of the signal (Fig. 7.8.).
Fig. 7.8. Time-domain estimation of envelope fluctuation.
Using the same definition as above, an envelope fluctuation of
20·log (3 divs I 2.6 divs) = 1.2 dB is found. This indicates that 10
the baseband circuitry (D/A' s, transmission filters) introduce
approximately 0.8 dB, while the carrier circuitry (modulators and
summer) contribute just over 0.4 dB.
7.6 Carrier and symbol timing recovery system
7.6.1 Spectra
Fig. 7.9. is a plot of the output spectrum of the synchronization
nonlinearity.
Little information can be recovered from the lower-order spectra,
but the fourth-order spectrum contains a carrier component
approximately 20 dB larger than the surrounding noise. This
component is tracked by a PLL to yield the recovered receive
carrier.
68

Univers
ity of
Cap
e Tow
n
/fP CARR I E R REC 0 V E"R Y SPEC TR UM REF - 6.6 dBm ATTEN 10 dB -21.31 dB F' EA K --·----··:····--···;----. ····:·· •• ····-:········ ·:······--· :····. ····:··· ....••.•.•. ·····:········· LOG 10 dB/
. . . . . . . . . . . ·································································································· . . . . . . . . . . . . . . . . . . . . . . . . . . . . . . . . . .................................................................................................. MARKER A • '. : '. '.
5 kHz : ......... : ......... : ................... : ........ .
"i.·· ·~;r ••Jx···•·······l).~·······•·········•·········•·······•r•••••••• CORR ....... ··~~.jl· .. ·: ... ··~;;;}~· ..... ·-~~;~~~~~rj~J4~~· ... .
··················································································.················· . . . . . . . . . . . . . . . . . . . . . . . . . . . ! ......... : ......... : ......... : ..•...... : ......... : .•....... : •........ : ...•..... : ...•...•. : ........•
START 0 Hz OFFST -593.0 kHz STOP 2.000 MHz #RES SW 300 Hz UBW 300 Hz SWP 60 S~D
MARKER HORMAL
MARKER DELTA
MARKER AMP TO
11KMOISE on orr
MARKER PAUSE
MARKERS OFF
Fig. 7.9. Carrier and symbol-timing recovery nonlinearity output
spectrum.
The carrier component is surrounded by spectral components at
distances that are multiples of the symbol rate. However, they are
up to 20 dB smaller than the carrier component. They are also only
about 2 to 3 dB above the surrounding noise, and therefore require
more complex tracking circuitry. The simulation of Chapter
5 (§4) predicted that these components would be small. (Recovery
of these components is feasible, but the added circuit complexity
is beyond the scope of this investigation).
The final recovered carrier spectrum of one channel is plotted in
Fig. 7.10.
Comparing this figure with the spectrum of the original transmit
carrier (Fig. 7.5.), there is far more phase noise on the
recovered fundamental. Also, the harmonics are larger in amplitude
they, too, have larger phase noise components. The first
harmonic is now approximately 29 dB down in amplitude from the
fundamental.
69

Univers
ity of
Cap
e Tow
n
,1£:>RE OVERED CARRIER SPECTRUM REF - ·s .5 dBm f'ITTEN 10 dB -28. 71 dB PE AK -···· ···:·········:···-··-··:·· ••••••• :· •••••••• :·········:·········:·········:···-···-· :·········
LOG : : < . . ; ; . . 10 ........ : .... ·····:· ....... : ......... :·••'"'":·········:···"····:····· .... :·········:·· ...... . dB/ . : : : : : . . . . . . . . . . . . . . . . . . . . . . . . . . . . . .......................... : ......... : ~ ........ : ......... : .. ' ...... : ........ .
MARKER A . · · · ·
~I 15 . ~~: • !~z da. . . , : ......... (··;· .. ~ .... ··""')·:· .... ]~········· dBm \""'"j"'""J···. i,;.. J ...........•...... \ i; •• ·• \'\,; ~ y"~\ II \:, Jf.J.11iw .. .
rs.., ........ ':!.~ ., .: ......... '. ... .v: ... : ........ ~N1 .. .A1p,,«.1 ....... : .. '.td .. ~'. ....... : ........ . CORR .w"' . . . .··vr . . . .
. . . . . . ' . ··································································································· . . . . . . . . . . . . .
MARKER NORMAL
MARKER DELTA
MARKER AMPTD
MK HO I SE or. OFf
MARKER PAUSE
MARKERS STflRT 0 Hz OFFST -696.0 kHz STOP 2.000 MHz OFF
#F:ES BW 1 klHz VBW i kHz #SWP 20 sec
Fig. 7.10. Recovered carrier spectrum (one channel).
7.6.2 Timing jitter
The peak-to-peak timing jitter of the recovered carrier clock
(before filtering out the fundamental, for ease of measurement)
was evaluated. Fig. 7.11. shows the procedure.
hp running r ~v markers -~ r ____ r_r ____________ f _ ----- - -----·1-·· on I
'
stop marker: star- t marker:
delta t: 1/del ta t:
12B.OOOns 28.000 ns 100.000ns 10. OOOOMHz
.o.t markers ;;;--! off MllM J
start marker
Fig. 7 .11. Recovered ca.rrier clock jitter measurement.
70

Univers
ity of
Cap
e Tow
n
The carrier has a period of 1/(432 x 103) = 2.315 µseconds. The
peak-to-peak jitter, J , is measured to be 100 nseconds, or 4.3% pp
of a carrier cycle. This translates into a random carrier phase
jitter of up to 7. 7° (peak) either side of the central phase
point.
7.7 Decoder
7.7.1 Noise generator (B.14)
The output spectrum of the noise generator is shown below.
417 NO I SE GENERATOR SPECTRUM MKR A 205 kHz REF -24,5 dBm ATTEN 10 dB 5.40 dB PE AK ·········:·········:·········:·········:········ :·········:·········;·········:·········:········· LOG : : : : : 10 ·········:·········:·········:·········:········ :·········:·········:·········:·········:········· dB/ : · : : · : . . . . . ................................................ ················································· . . . . . . . . . . . . . . . . . . . . . ................................................ ................................................. . . . . . . . . . . . . . . . . . . .............. ; ................................ . ................................................. . . . . . ' . . . . . . . . . . . . . . . . . . . . . . . . ~l A SB ;;,~:w;;.,./,;_:~~ .... : ... ·µ~s;.:M;:;.:,_~~~jf~~~;:;,-
f" S ......... : ......... : ......... : ......... : ..... "<"i~ •• :.~ ••••• : ••••••••. : ••••••••• : ••••••••• : ••••••••. CORR
. . . . . . . . ··································································································· . . . . . . . . . . . . . . . . . . . . . . . . . . . . . . . . . . . ..................................................................................................................................................................................................
CENTER 30.00 kHz OFFST -760.0 kHz SPAN 2.000 MHz #RES BW 300 Hz ~IBW 300 H:z SWP 60 seo
MARKER HORMl'll
MARKER DELTA
MARKER AMP TO
MKNOISE on OFF
MARKER PAUSE
MARKERS OFF
Fig. 7.12. Output spectrum of noise generator.
The spectrum is flat to within about 4 or 5 dB across the baseband
channel width, and almost completely flat across the span of 1 MHz
(up to several MHz, in fact). It is therefore assumed that this
approximates a true white noise source.
The crest factor of the noise generated varies as the inverse of
the rms value, since the peak values are limited by supply rail
voltages. Over the range of noise tests, the crest factor varies
from 15 dB, for low CNR, to 25 dB for high CNR. These figures,
however, are an upper bound only - the characteristics of the
noise source itself could reduce this figure of merit
71

Univers
ity of
Cap
e Tow
n
substantially.
7.7.2 Symbol error rate results
Bit error rate tests were performed according to the scheme
illustrated in Fig. 7.13.
Noise
PRBSG i----.--- MODEM t-------+-f TX. I and Q
Channels
DELAY
DET DEC.
Fig. 7.13. Bit error rate test setup.
ERROR
FREQ.
COUNT
This scheme is just a form of "out-of-service" testing [7.1]. The
PRBSG generates the necessary test pattern for transmission over
the link. The effect of channel noise is evaluated by injection of
Gaussian noise, at baseband level, into the in-phase and
quadrature symbol channels of the transmitter. One independent
noise source is used per channel, to prevent correlation between
in-phase and quadrature noise components. The relationship between
signal and noise amplitudes per baseband channel and effective
transmission link carrier-to-noise ratio is described in Chapter
4 §3. 2.
The detector circuit performs an estimate of the :value of the
received symbol and converts this into a binary data stream. The
error detector circuit compares these bi ts to replicas of the
original data bits (from the PRBSG) with an EXCLUSIVE-OR gate,
which only gives a logical "high" output when the two compared
bits are different ie. when there is an error in the decoded bit.
A frequency counter (set to a long-period count - a maximum of 10
seconds) evaluates the frequency of errors. The outputs of the
counter are averaged and divided by the system bit rate to arrive
72

Univers
ity of
Cap
e Tow
n
at an average system bit error rate. Given a data rate of 120
kbps, this period allows 1.2 x 106 bits to be transmitted.
Assuming that the simulation results of Chapter 5 §6 set an upper
bound on practical system noise performance ( ie. the hardware
system will perform only as well as or worse than the simulation
model) , the expected lower limit on bit error rate is
approximately 10-4• This means that over a 10-second averaging
period, at i.east 120 bit errors will be registered-.' Most sources
consider 100 error events to be sufficient to arrive at an error
rate estimate of sufficiently small statistical variance [7.1, p.
139], [7.2].
Table 7.1. lists the measured results, over the (effective) CNR
range from 1 to 11 dB.
TABLE 7.1. Measured bit error rate results for CORPSK(4-7, l+D)
CNR [dB] S/N [ ·] (]' [V] f [kHz] P(e) n error
1 1.12 2.12 13.8 1.2 x 10⁻¹
2 1.26 1. 88 11. 0 9.0 x 10⁻²
3 1.41 1.68 12.6 1.1 x 10⁻¹
4 1.58 1.50 9.48 7.9 x 10⁻²
5 1. 78 1. 33 7.28 6.1 x 10⁻²
6 2.00 1.18 5.40 4.5 x 10⁻²
7 2.24 1.06 2.31 1.9 x 10⁻²
8 2.51 0.94 1.42 1.2 x 10⁻²
9 2.82 0.84 0.53 4.4 x 10⁻³
10 3.16 0.75 0.23 1.9 x 10⁻³
11 3.55 0.67 0.076 6.3 x 10⁻⁴
These results are plotted in Fig. 7.14 and compared to the
results simulated for the ideal correlation receiver [7 .2), and
the symbol-by-symbol detection method simulated in Chapter 5 §6.
73

Univers
ity of
Cap
e Tow
n
Log P(e) Or--.~-.~-.~-.~-,-~-,-~--.-~-.-~-.----,
-5'-----'~----L~----'-~_._~__._~_._~_._~__._~....._~
1 2 3 4 5 6 7 8 9 10 11
CNR [dB]
-t- Viterbi -e- Measured -+- Simulated
Fig. 7.14. Measured bit error rates compared to correlation
receiver and symbol-by-symbol detection simulation.
It should be borne in mind that the simulation of Chapter 5 models
directly the hardware system tested here - the hardware phase
pulse shape is, in fact, derived from the simulation program. The
simulation results set an upper bound on actual system performance
- any degradation in the measured results are because of hardware
imperfections. The results above indicate that, at most, 1 dB
degradation occurs in practice. Compared to the ideal Viterbi
(correlation) receiver, up to 4.5 dB CNR penalty is incurred, but
a far less complex receiver implementation has been achieved,
employing only symbol-by-symbol detection. These bit error rate
results are comparable to the performance of 4 PSK [7.1, p. 196].
74
'

Univers
ity of
Cap
e Tow
n
A cause of the CNR degradation is the relatively poor performance
of the modulator digital-to-analog converters (resulting in
reduced vertical eye opening). The relatively short tails of the
(theoretically infinitely-long) phase pulse causes small
discontinuities in the phase trajectory, and hence in the I and Q
channels. The transmission filters tend to smooth these out, but a
degraded trajectory portion will result.! .... The. fact that a
degradation of 2 dB is introduced in the VEO by the D/A process (§
7.2.1) suggests that the measured error rates are actually
optimistic by about 1 dB. This would be because of the finite
crest factor of the injected noise, as well .as the fact that the
noise source is only approximately white.
REFERENCES
[7.1] Feher, K. and the Engineers of Hewlett-Packard, Tele
communications Measurements, Analysis, and Instrumentation,
Prentice-Hall, Englewood Cliffs, N.J., 1987.
[7.2] o. Muilwijk, "Correlative Phase Shift Keying - A Class of
Constant Envelope Modulation Techniques," IEEE Trans.
Commun., Vol. COM-29, No. 3, March 1981, pp. 226-236.
[7.3] T. Maseng, "Digitally Phase Modulated (DPM) Signals," IEEE
Trans. Commun., Vol. COM-33, No. 9, September 1985, pp.
911-918.
75

Univers
ity of
Cap
e Tow
n
Because of their
CHAPTER 8
CONCLUSIONS
high immunity to nonlinear signal
operations, constant-envelope modulation schemes are attractive
for use in digital radio environments. Traditional systems such as
·OQPSK·- and· MSK have high out-of-band signal levels. Filtering of
these signals is ineffective because any further nonlinear
processing causes spectral spreading.
Partial response signaling (PRS) has been used successfully to
improve the spectral properties of PAM systems. This thesis
investigation studied the effect of PRS on frequency- and
phase-modulated carrier systems, in particular on their spectral
performance and their maintenance of constant envelope.
A literature survey has been conducted, showing the development of
constant-envelope modulation formats that employ some form of
correlative ~needing. The most promising systems to date are those
that employ Continuous Phase Frequency Shift Keying (CPFSK) with
some form of baseband pulse shaping. Systems that fall into this
category are Continuous Phase Modulation (CPM) and Correlative
Phase Shift Keying (CORPSK).
CORPSK has been studied as a typical scheme from this class.
Computer simulations were performed to analyse spectral behaviour,
time domain characteristics and the performance of synchronization
systems. These results agreed with those reported in the
literature.
A reduced-complexity CORPSK modem was developed, employing
symbol-by-symbol detection instead of the Viterbi algorithm. The
results indicate that a good, but suboptimum, solution is
possible using this approach.
Extensive testing was performed to determine system performance.
Results show that a spectral efficiency of only 0. 5 bps/Hz is
76

Univers
ity of
Cap
e Tow
n
achieved. However, this modulation format has no spectral /
sidelobes, and so the out-of-band signal levels are much lower
than those yielded by systems such as unfiltered QPSK. Measured
error rate characteristics are comparable to the performance of a
4 PSK system.
Carrier recovery is straightforward -:--- " a peak-to-peak jitter of
about 4% is achieved with fairly simple circuitry. Symbol timing
recovery, while possible, requires more sophisticated
synchronization, and was not attempted. However, the existence of
suitgble spectral components was verified.
The effect of hardl.imi ted amplification on the system spectrum was
simulated. No spectral sidelobes were generated, demonstrating
this system's immunity to spectral spreading. The in-depth study
of actual system performance under nonlinear conditions (bandpass
limiting, TWTA non;t.inearity, and even multipath) is recommended
for further research.
77

Univers
ity of
Cap
e Tow
n
BIBLIOGRAPHY
Feher, K., Digital Communications, Satellite-Earth
Engineering, 1983, Prentice-Hall, Englewood Cliffs, N.J.
Station
Feher, K., Digital Communications, Microwave Applications, 1987,
-~- .. ----.Prentice-Hall, Englewood Cliffs, N. J.
Feher, K. and the Engineers of Hewlett-Packard, Telecommunications
Measurements, Analysis, and Instrumentation, Prentice-Hall,
Englewood Cliffs, N.J., 1987.
Feher, K., Advanced Digital Communications Systems and Signal
Processing Techniques, 1987, Prentice-Hall, Englewood CLiffs, N.J.
Franks, L. E. I "Carrier and Bit Synchronization in
Communications A Tutorial Review," IEEE Trans. Commun.,
COM-28, No. 8, August 1980, pp. 1107-1121.
Data
Vol.
Gagliardi, Robert M., Satellite Communications, 1984, Van Nostrand
Reinhold Company, N.Y.
Horowitz, P. and Hill, W., The Art of Electronics, 1983, Cambridge
University Press.
Lathi, B. P., Modern Digital and Analog Communication Systems,
1983, Holt-Saunders.
Lowdon, E., Practical Transformer Design Handbook, Second Edition,
Howard w. Sams & Co., Inc., 1980.
National Semiconductor, Data Conversion/Acquisition Data Book,
1984.
National Semiconductor, Linear Data Book, 1984.
Saal, R., Handbook of filter Design, 1979, AEG-Telefunken.
78

Univers
ity of
Cap
e Tow
n
Snijders, Verhoeckx, Van Essen and Van Gerwen, "Digital Generation
of Linearly Modulated Data Waveforms,," IEEE Trans. Commun., Vol.
COM-23, No. 11, November 1975, pp. 1259-1270.
Sklar, B., "A Structured Overview of Digital Communications - A
Tutorial Review · - Part 1,, '! -IE,KE-- Communications Magazine, August
1983, pp. 4-17.
Sklar, B. 11 A Structured Overview of Digital Communications - A
Tutorial Review - Part 2,, 11 IEEE Communications Magazine, October
1983, pp. 6-21.
Stremler, F. G., Introduction to Communication Systems,, Second
Edition, Addison-Wesley, 1982.
Williams, Electronic Filter Design Handbook,, 1981, McGraw-Hill.
Ziemer and Peterson, Digital Communications and Spread Spectrum
Systems,, 1985, McMillan.
79

Univers
ity of
Cap
e Tow
n APPENDIX A
THE EFFECT OF HARDLIMITING ON CARRIER SYSTEM PERFORMANCE

Univers
ity of
Cap
e Tow
n
APPENDIX A
THE EFFECT OF HARD LIMITING ON CARRIER SYSTEM PERFORMANCE
Hard limiting is often used in, for example, satellite
transponders as signal conditioners prior to power amplification,
to prevent large amplitude swings. The usual approach is to follow
the hard limiter by a bandpass filter, tuned to the carrier·
frequency concerned. This configuration is referred to as a
"bandpass limiter" (BPL). Any modulation schemes used in such
systems must obviously exhibit as high an immunity to such
operations as possible. Signals with nonconstant envelopes, such
as filtered QPSK or MSK (filtered to reduce out-of-band signal
levels), usually experience spectral spreading as well as coupling
between in-phase and quadrature channels.
Presented
limiters
here is an analysis of
(from Gagliardi [A.l]).
the performance of bandpass
Fig. A. l shows the bandpass
limiter model.
,----------1 I I
! ·I~ H BPF ! . I Limiter I L ___________ J
Bandpass limiter (BPL)
Fig. A.1.· Bandpass Limiter model
A.l Effect of BPL on System CNR
The limiter is a simple threshold device, with output voltage
limits +V and -V , respectively. L L
Given that the input is a carrier and noise combined, in the form
x(t) = o: ( t) cos ( w t + e ( t ) ) c
(A.1)
A.1

Univers
ity of
Cap
e Tow
n
the BPL output is then given by
y(t) = [ 4:L l cos ( w t + e ( t) ) c
(A. 2)
The effect of the BPL is clear - namely to remove the amplitude
variations in the RF signal, while preserving phase. The envelope
amplitude is proportional to the limiter level V and so the L
limiter can provide a convenient and accurate power adjustment.
The output power is
p L
= (A. 3)
It can be shown that the carrier power at the BPL output is also
given by
p = [
2v2 l -CNR _L CNR e 1
Tr i
CNR ) __ 1 + 2
(A. 4) co
I (x) and I (x) are first and second order imaginary Bessel 0 1
functions and CNR is the input carrier-to-noise ratio of the BPL, i
such that
CNR = i
p c (A. 5)
with N B the input channel noise power. The output noise power O RF
is the difference between P , the total output power (A. 3), and L
the carrier output power, P , in (A.4). Hence co
no p - p
L co (A. 6) p
yielding an output BPL CNR of
p
CNR co = p BL (A. 7)
no
P I P co ' L
= 1 - (Pco I p )
L
(A. 8)
From (A. 4) I
A.2

Univers
ity of
Cap
e Tow
n
p
( ~ ) -CNR [ r 0 [
CNR ) + Ii(
CNR ) r co CNR e 1 1 1
(A. 9) p = 1
L 2 2
Fig. A. 2 shows a plot of the (normalized) ratio
CNR r BL
(A.10) = CNR
1
r
2.0
1.8
1.6
1.4
1.2
1.0
---------0.8
0.6
-20 -16 -13 -10 -6 -3 0 3 6 10 13 16 20
CNR;, dB
Fig. A.2. Output/Input CNR vs. input CNR for BPL
The curve illustrates how, for low CNR of the BPL input signal,
little or no change occurs between input and output CNR's.
However, for fairly large input CNR's, the BPL actually "cleans
up" the signal and a CNR gain of up to 2 dB results. This altering
of the CNR can be seen as a modification of the carrier and noise
powers at the output. Carrier and noise suppression factors, a.2
s 2 and a , can be defined according to n
p 2 p = a co s c
p 2 (NOBRF) = ex
no n
From (A.7),
A. 3
(A.11)

Univers
ity of
Cap
e Tow
n
CNR BL
The suppression factor ratio, r, is then defined as
2 ex r s = -
2 ex n
(A.12)
(A.13)
This is just the ratio plotted in Fig. A.2, and so the suppression
factors th ems elves are seen to be a function of the input CNR . 1
From (A.6) and (A.11),
p L
= ex2 P + ex2 ( N B )
s c n ORF (A.14)
From (A.13), the carrier suppression factor can be written as
ex2 P s c
= (A.15a)
Similarly, the noise suppression factor is given by
ex2 (NB )
n 0 RF = + ~NR l BL (A.15b)
These suppression factors therefore di vi de the available output
power between signal and noise, in the ratios defined in (A.15).
A.2 Effect of BPL on System Spectrum
An RF signal such as QPSK may be represented as a quadrature
carrier of the form
c(t) = Am (t) cos(w t + l/J) +Am (t) sin(w t + l/J) c c s c
The BPL output is again given by (A.2), with
e(t)
Writing the BPL output, (A.2), as a quadrature signal,
y(t) = f (t) cos(w t + l/J) + f (t) sin(w t + l/J) c c s c
A.4
(A.16)
(A.17)
(A.18)

Univers
ity of
Cap
e Tow
n
it can be deduced that the envelope amplitude is given_by
=
and
m (t) s
f (t) c
m (t) c
= f ( t) s
A solution requires that
f (t) = c
m (t) c
f (t) = s
m (t) s
4V L
Tl
[ 4:L ]
[ 4:L J
(A.19)
(A.20)
(A.2la)
(A. 2lb)
Both f (t) and f (t) depend on both data bit sequences m (t) and c s c
m (t), and so the effect of the BPL is seen to be to introduce s
undesirable coupling between
components. If the value of the
changes bit sign, obviously f (t)
the in-phase and quadrature
in-phase data channel, m (t), c
c will change sign, too. However,
o ----1-------+----- m,(t)
-------+------+-- ms(t)
Blip
Fig. A.3. Blip development in bandpass-limited OQPSK
A.5

Univers
ity of
Cap
e Tow
n
during the bit transition, m (t) passes through zero, and so c
(A.21b) shows that f (t) also reflects the change, as a s
perturbation or "blip" - see Fig. A.3. This can lead to errors in
detection of the affected channel.
In the case of QPSK, all bit transitions occur simultaneously. As
a result, bit errors are not so-significant, but the existence of
blips in the waveforms leads to bandwidth increases in the
bandpass-limited carrier.
Fig. A.4 shows the effect of bandpass limiting on filtered QPSK
and OQPSK [A.2], while Fig. A.5 shows the effect for MSK.
10°
10-6
Filtered OPSK or OQPSK BTb= 1
10-BL--~~~~--l~~~~~-'-~~~~~~~~~~~
0 1.0 3.0 4.0
Fig. A.4. Spectral restoration due to hard limiting
of filtered QPSK and OQPSK
A.6

Univers
ity of
Cap
e Tow
n
1.0
Filtered MSK
BTb = 1
Filtered-limited MSK
10-8 '--~~~~--'-~~..._~~~~~'--~~~~~~~ 0 1.0 2.0
2 !Tb
3.0 4.0
· Fig. A.5. Spectral restoration due to hard limiting
of filtered MSK
Filtering of the RF signals clearly causes reduction of the
out-of-band signal levels, but hardlimiting tends to restore the
spectral tails to their prefiltered values, also destroying their
spectral nulls. In the case of MSK, the main spectral lobe that
has been reduced by filtering has been almost completely restored.
If these carriers had been filtered to satisfy spectral masks
defining spectral occupancy, hardlimi ting makes them unsuitable for use from there on.
A. 7

Univers
ity of
Cap
e Tow
n
REFERENCES
[A.l] Robert M. Gagliardi, Satellite Communications, Van Nostrand
Reinhold Company, 1984, Chapter 4.
[A.2] D. Morais and K. Feher, "The Effects of Filtering and
Limiting on the Performance of QPSK and HSK Systems," IEEE
Trans. Commun., Vol. COM.:.28, No. 1·2, · December 1980, pp.
1999-2009.
A. 8

Univers
ity of
Cap
e Tow
n APPENDIX B
MODEM CIRCUIT DIAGRAMS

Univers
ity of
Cap
e Tow
n tJ
j .....
Data
C
lock
s c
c ~A
BCDE
Rt
k
R1
Bk2
Cl.
74
04
Ui
74
96
s c
c ~A
BCDE
Rt
k
U2
7
49
6
~288~
s c
c ~A
BCDE
Rt
k I
I I
I I
I '9
I 11
U6~,.
748?
>
U3
7
49
6
~288
~ s
c c
~ABCDE
Rtk
Data
O
ut
U4
7
49
6
~equence
gen
era
tor
PR
BS
G
7.
l. 9
90
!S
heet
1 o
t

Univers
ity of
Cap
e Tow
n tJ:I
"'
VT
Clo
e
(tb
)
~,
VT
TL
. "
,)-
Ui
.. ., •
4 .
10
::::=
;;:: S
ER
...
~i..J
Di li
R
A
QA
t;
--=±
__..
... B
Q
B [)
2 i2
. -
,__
:::j ,...
c Q
C ...
-_
u_
Q
2 -
-r-
D
Q[)
... -
[)3
ff -
-1
t T
L --
E
QE -
..... T::
... ,
_ [)
4 ~
7
f -i-~cLK
--:l
l:
-~-
PE
I
1 h~
CLR
~CLK
__
ll_
rh
rct9
6 C
LR
rc
tl'ro
::>
V~JL
VT
L
•
4 U
7A
llR
tn
_.
.z..
t;
B
Ai
[) ~
Q
A2
~ 3
A3
~
3 C
LK
__
,L
A4
-E
w.
.. 1
t Q
B
i 7
B2
I
74
74
4
83
i
T
16
B
4
VT(
TL
_u
._ c
o 7
48
3
ri
-
.. 'c
)-
ll":
l lld
··
~ 9
:> tn
9
Ai
5i
" '
[) i
Qi
A
Ai
Si
" A
2 5
2 b
f:
[)2
Q2
:=i:
A2
52
2
A3
53
3]~ 0
3
Q3
d~
A3
53
A
4 5
4
04
Q
4 A
4 5
4 U
L
DS
QS
t t
Bi
[)6
Q6
Bi
B2
7
B2
-f-
:Ji
B3
>CLK
B
3 B
4 C
LR
-
B4
co
C4
-1.L
7
4J.
74
~
i _
_ll_
co
C
4 W
--(4
83
U
SA
'-1"
483
74
86
~
"(
'1.
Yn
<
-3 •
• 3
>
=
Sig
n
- - ~ P
n
11
q
utn
-
l
9 tn
9
i 5
i 6
R
Ai
5i
" O
i Q
i I
' 5
2
A2
52
0
2
Q2
53
2
3 A
3 5
3 b
i:
~~ 0
3
Q3
54
u.2
-_
_,L
A
4 5
4
[)4
Q4
rn=
11
V
T fl D
S Q
S 8
i 0
6
Q6 ~
7 8
2
::K B
3 -1
-: ~CLK
84
C
LR
C4
W--
_u
._ c
o C
4 _
.lL
rc
t17
4
748~
Parti
al
Re$
pO
n$
e Proce~~or
Card
PR
SCA
RD
7
• .1
99
01
Sh
eet
l o
f

Univers
ity of
Cap
e Tow
n te
l w
VT
JL
UJ
---'
' Di D
2
~D3
04
P
n
rro
rn
DS
PRSC
AR
D
06
QilJJ
Q2
Q3
Q4
QS
Q6
.
Clo
ck
'V
(/f's
)
CLK
CL
R 7
41
74
II?
Yn ifjD
i Qifll
rr
om
D
2 Q
2 PR
SCA
RD
0
3
Q3
04
Q
4 D
S
QS
D
6 Q
6
It iJ
gt~
74
!"7
4
VT f
l
' Q
A
QB
QC
Q
D
QE
QA
Q
B
QC
Q
D
n Q
E
QA
I t
• Q
B Q
C QD~
QE
......
...._
QA
H-i-
QB
QC
QD
t!Q
:: Q
E
SER
Q
A I
t•
A
B
QB
c
QC
D
QD
ttt:
E
Q
E
U9
AO
.__~-t A
i '---~A2
...+-Hr-----------~ A
3
r-----++-t-t-1-t---------~!HA4
"'"
't--1
------------+
-tA
S
r+
-t-----------i:i-iA
6
-rt-r----------~-t A
7
'-+-+-1-+---------~HAS
.----------9~A9
.----t--++-t-t-t----------,~AiO
'---HH-+-1----------'~ A
11
--+---------:;i;:~ A
i2
Ai3
~
VP
P
A
B c D
UP
m
27
12
8
Ff it
le
fi
VT
JL
'
0 C
lock
<
4fs)
00~
Oi~
02
rn=
To
C
os/
Sin
e
Lo
ok
-up
0
3
04
OSEIE
0
6
07
Ph
ase
trajector~
sh
ap
ing
M
Od
ule
~izerocu~nt
Nu
mb
er
r~v1
T
RA
JSH
AP
r.
.199otsh~et
1 o
f

Univers
ity of
Cap
e Tow
n td
~
Ph
asv
Tra
J•c
tory
Inp
ut
CU
9)
-
r.
I '
? ,.. t HI
--2.
.L
I '
7 2 1 IR
.... ,
--2.
.L U
tO
AO
()
0 A
i ()
i A
2 ()
2 A
3 0
3
A4
()4
AS
<>S
A6
()6
A7
()7
AS
A9
AiO
~
VP
P
2f
l.b
UJ!
AO
()
0 '
Ai
<>i
A2
()2
A3
()3
A4
()4
AS
OS
A6
()6
A7
<>7
AS
A9
AiO
~
VP
P
27
16
ll 1
.2
I'>
I
BS
!O
UT
t
B7
B
6
BS
IO
Ur
84
B
3
82
8
i C
OH
P 1
4
VR
+
.-J.S
.. V
R-
VLC
>R
>
R
DA
CO
SOO
>1
0k
>
iOk
>
>
()
V
ee
fi7
_u1:
:i;
t ;>
] B
S
!OU
T
t 8
7
86
B
S
IOU
r 8
4
! 8
3
82
:>
8
i C
OH
P Id
V
R+
.-J.S
.. V
R-
VLC
D
AC
0800
R
>
R
iOk
)
iOk
>
Vee
fi
4 2
R
10
k
~v
v
v 'S
,, i
L-'
-r-
Ui4
A I
3 +
"'
L
F3
47
N
~
~R
14
c ?
iOk
.... ~ io
on
n
_,}
L..1
,_
Vee
fi
R
10
k
.A
T
T
6~48
4 -
7
2 ~~
LF
34
7N
R
~c
>iO
k
>
-~
_..t.
., io
on
ri7
r.
Q
ch
an
nel
ou
t C
4.7
V
pk
)
I ch
an
nel
ou
t C
4.7
V
pk
)
Ph
a$
e tr
aje
cto
ry
~haping
mo
du
le
TR
I GO
AT
7.
19
90
1S
he
et
2 o
f'

Univers
ity of
Cap
e Tow
n tJ:
I l1
1
R6.
~
R2
!Ok
!O
k
~
Cl
n8
2
I C
2
I "
I R
S
I/P
~-""-
• I
R3
-
..._,n~1~i
:i R
4 ~9
Ve
e
BP
O
/P
R12
RS
!O
k
!Ok
C3
nB
2
C4
R1
1
3k
9
Vc:
c B
P O
/P
<1
.SV
p
k)
LP
O
/P
tran
sm
issio
n rilter
(on
e
ch
an
nel)
F'I
LT
ER
J.9
9
heet
1 o
r

Univers
ity of
Cap
e Tow
n
VT
TL
Ri
1k
R
2
1k
Xi
'--~~~~--10--~~~~--'
3.4
56
H
Hz
vr
Q
ad
Ju
st
U3A
V
R1
v- iOO
k lSJ
C2
Ll
1n
33
w
O.l
rii
I V
ee
Ill
O'I
R6
1
k
T~
PN
91
8
R12
1
80
43
2
kH
z
Vee
T~
Co
s<
Mct>
S
O oh~
<1
0
dBm
>
PN
91
8
R9
1
80
Sin
CM
ct >
S
O oh~
< 10
dB
m>
an
d
Qu
ad
ratu
re C
arrie
r G
en
era
tor
l:Q
GE
N
7.
19
90
!S
heet
of
E 1

Univers
ity of
Cap
e Tow
n
'·
R3
1k
"
I C
ar-r
-i11
tr-
vi; I
~i
Ban
dp
ass
R4
~
f ~-
-· --
0 S
ign
al
ou
t I
Ch
an
nel
3k
3
<1
0
dB
m>
S
BL
-1
R2
r---
"'V
' H
2
QCar-r-ier-~
ti1
I ·
RF
Q
C
han
nel
· IF
-..
.J S
BL
-1
Vee
l+o
) m
od
ula
tor-
an
d
dr-
iver-
HIX
SU
H
7.
J.9
90
!S
heet
.1.
of

Univers
ity of
Cap
e Tow
n
Vu
; R
! R
2
l~k
i ...
.J.,,
i"'lo.I
CO
RP
Sl<
C4-
7,1+
0> --,-~A 1
T
C!
~·~
-3
0p
I
VR
!
Sig
nal
In
-I
R3
3 2
k
10
0k
SS~~ l3
#C
2 10
0p
To
P
LL
!Ok
t:Jj
\0
I V~c
01
,02
: 1
N4
14
8
2k
2
Recover~
-R
ecti
fie
r
an
d
PL
L
CR
CC
T
7.-T990~et
1 o
f

Univers
ity of
Cap
e Tow
n tJ:
l .....
0
Cl
Sig
n.a
10
I( I
in
10
0n
F
YT
rL
R4
RS
R9
3
90
cs
lOO
nF
R3
2
k2
QA
YTT
L
C2
10
0n
F
11
0p
F
U1
XR
21S
RB
SO
k
QB
I
,-W
•
• >i
i I
QC
QD
co
R7
!O
k -V
TT
L
Co
""°'
. o
ut
Vee
Vee
I C
arr
ier
<1
0
dB
m)
Q C
arr
ier
<1
0
dB
m)
Reco
very
-
Recti
fie
r
an
d
PL
L
CR
PL
L
r.-
J. 9
90
IShe
l!!t
--2
. o
f

Univers
ity of
Cap
e Tow
n t;J
j .....
.....
Qu
ad
ratu
re
sig
nal
fs
In-p
hase
sig
nal
RS
Sk
IU
22
k
R3
vss
TC2
rh 1n
8
R7
22
k
R9
vss
U?A
LF3
47M
VC
C
VT
TL
R1
0
10
0k
U?B
LF
347N
VT
TL
~VREF+
VR
EF
H
OD
E cs
R
D
WR
/RD
Y
I I
I l.
I V
IN
Q
Q~
VT
TL
0
~VREF+
VR
EF
-
HODE
cs
R
D
WR
/RD
Y
I I
l. I V
IN
ADCO~O
DB
7
~D
B6
1
DB
S .1
• D
B4
D
B3
,
DB
2
DB
! D
BO
·~
OFL
IN
T
DB
? , I
DB
6
I D
BS
14
D
B4
D
B3
·i
D
B2
3 D
B!
,. D
BO
·~
OFL
IN
T
Y d
ai:
a
for
ph
ase
co
nv
ers
ion
X d
ata
for
ph
ase
co
nv
ers
ion
CO
RP
SK
C4
-7,1
+0
) D
eco
der
DE
Cl
ep
t e!Tber------r~ -1
99
0 I
Sh
eet
i or
/
E 3

Univers
ity of
Cap
e Tow
n t:J:
I .... t-.>
Y
Data
In
X D
ata
In
U?
F
I LU..
~~-t
? ~-
11 . ~· ~· z ? .,n
77
__
,L
t1
7 ? .,n
77
_.\
...
II t AO
0
0
A!
01
A
2 0
2
A3
03
A
4 0
4
AS
OS
A6
06
A
7 0
7
AS
A'3
A!O
A
U
A12
A
13
A14
~
VP
P
27
25
6
II?
AO
0
0
Ai
01
A
2 0
2
A3
03
A
4 0
4
AS
OS
A6
06
A
7 0
7
AS
A'3
A10
A
U
A12
A
13
A14
~
VP
P
27
2'5
6
.... ..
1_
' I
~
• -
To
~
Dif
fere
nti
al
~
Dete
cto
r
j
.... ~,_
.... .....
.... '-
Tit
le
CO
RP
SK
C4-
7.
J.+
0)
Deco
der
Sizerocu~nt
Nu
mb
er
A
DE
C2
r~v
Date
: S
ep
tem
ber
7.
J.99
0 !S
heet
2 o
f
3

Univers
ity of
Cap
e Tow
n IJ
j I-
' w
Ph
a5
e
Hib
ii:
Ph
ase
Lo
bit
So
urc
e
Data
So
urc
e
Data
C
lock
VT
TL
:~IU
I.
Q
C
QD
Q
E :~IH
I I
QC
Q
D
QE
QA
VT
TL
QB
I H
I
QC
Q
D
QE
b
s
A=B
C
M+4
G
p
;:jj
M
y _
__
__
__
__
.-!
VT
TL
Data
O
ut
Err
or
Dete
ct
CO
RP
SK
C4
-7.
1+
0) D~cod~r
DE
C3
7.
19
90
ISh~~t
3 -o
f

Univers
ity of
Cap
e Tow
n tx
l t-
-' .i:
o.
n.c
.
Q1
o--' tl~J.U~
I
V<t,C
R2
S 1
00
k
S R
4 6
k8
C! r- 1u
F
I I
RS
1k
Sig
nal
in
R9
1
0k
VR
l SO
Ok
~
R.1
1
10
k
Vc:
c
RS
!::
!OS
Ve
e
Sig
nal
ou
t
Gen~rator
/ S
um
mar
<
On
e ch
an
nel onl~)
E
NO
ISE
GE
N
r. -
19
90
TS
heet
1 o
f
1

Univers
ity of
Cap
e Tow
n APPENDIX C
MATHCAD LISTINGS

Univers
ity of
Cap
e Tow
n
CREATE THE FREQUENCY PULSE SHAPE
a := 1.0 a := 112 t - - 0 - . 319
t - 96 Wt := ·2·n
t a
sin rwt 1 L tJ
s := t Wt
sum := 0 0
t
1 := 1 - .319
r ·scalel sum := 1s 1 L 1 J
s := 1 96
(Remove singularity)
scale := 0.01880
+ sum 1-1
I Inte9rated pulse
J I.· =;: I :;::::::::::;:: I 1.1 I I ,( ""'!------1 -__,
I I II I I I
l I , I I i / I I I I ! !
I I I . I i i sum ; I I
1 I ! / I I I I ! f I I : I l I i i ! I
i I/ i i I i k~ J I I I ! ! I
-0.1 0 1 319
Sinx/x waveshape
17\1 I I I
I ;f 1\ I I I st l,./I l\~M
I I II . • I I I I I I
I i I i I
1
-1 0 t 319
********************************************************************** . CREATE THE DATA STREAM
d := 0 •• 140 k := 0 - .8
b := ceil(rnd(3) - 0.5) Random input sequence d
i := 2 •• 140
x := lb + b l - 3 i i i i-11
I.. _,
x := 0 y := 0 k 0
Duobinary Rule
y := y + x Present/next state i i-1 i
********************************************************************** CREATE THE PHASE TRAJECTORY
L := 32 Interpolation factor
m := 0 •• S·L - 1 path := sum m (2·m)+1 k := 1 •• 16
Cl
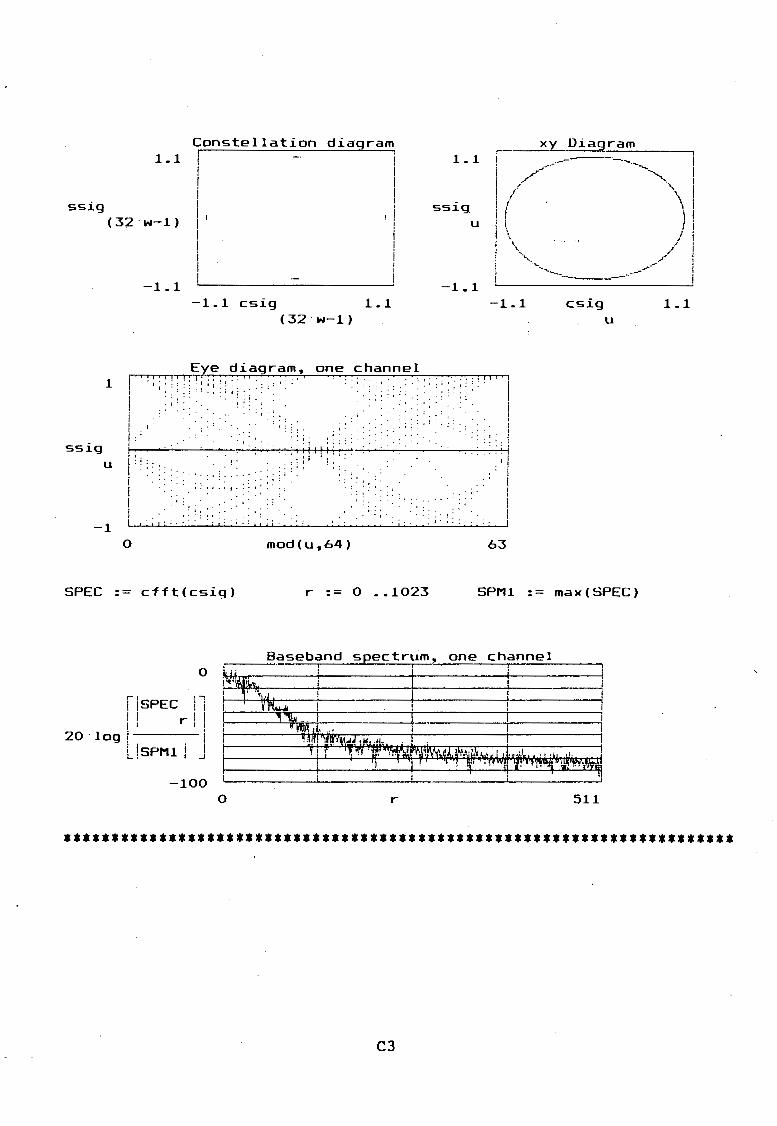
Univers
ity of
Cap
e Tow
n
Constellation diagram I
xy Diagram 1.1
ssig (32·w-1)
1
ssig
-1.1
I I : : ; : ~ ~ l ' :
i I
i I I . I:. I
-1.1 csig 1.1 (32·w-1)
: I:•'••
u I!;. I•:'.:::::.•'•• I:•'•••
:· ;; oi .: f; < ;; '.· . . •I;
-1
I I i
0
. . . . . .
mod(u,64)
I I
I i I I i I I
!
: ! ..
1.1
ssig u
-1.1 -1.1
I I . I
63
i r I i
csig u
SPEC := cfft(csig) r := 0 •• 1023 SPMl := max(SPEC)
Baseband spectrum, one channel 0
f jSPEC 11 I f .Ji. I i i I I I' r' I
20 ·Jog i I L!sPMl I J
-· l tf 'i'ii}I, ,i. .. I I I
~ "' f"ifll".'*1 ... J •lll~L . I . I I
-100 0 511
1.1
••••••••••••••••••••••••••••••••••••••••••••••••••••••••••••••••••••••
C3

Univers
ity of
Cap
e Tow
n
********************************************************************** CREATE THE BANDPASS SIGNAL AND SIMULATE CARRIER I SYMBOL TIMING RECOVERY
RFSIG := llRFCI ·csig l + jRFCQ ssig 11 U I L U U..J L U U..J 1
SPEC := cfft(RFSIG) r := 0 •• 1023
Absolute value function simulates nonlinearity
SPM := max(SPEC)
Carrier/ST recovery spectrum 0
f jSPEC 'l 1
1 r I
20 ·log! L !sPM I J
-90 0 r 1023
C4

Univers
ity of
Cap
e Tow
n APPENDIX D
PASCAL PROGRAM LISTINGS

Univers
ity of
Cap
e Tow
n
NOISE SIMULATION PROGRAM
The Pascal program "Noise Sim" generates baseband in-phase and
quadrature CORPSK( 4-7, l+D) signals and simulates the effect of
additive Gaussian channel noise. The signal is generated and
decoded ·c _in the same way as in the hardware implementation;
decoding is on a symbol-by-symbol basis. A running total of errors
is kept, and error probabilities calculated for a range of
signal-to-noise ratios. Simulation output is to a data file.
PHASE TRAJECTORY ROM CREATION PROGRAM
This program is not listed here, as it is based on the routine
"Count_Traj" of the noise simulation program. All possible input
combinations of State_minus_3, Yn_minus_2, Yn_minus_l, Yn_minus_O
and Int_Counter are generated in parallel as an integer ranging
from 0 to 16383. The variable Int Counter forms the least
significant part of the counter word, as this is used to step
through the eight interpolation points of that symbol period.
The program "Decoder" is listed on page D.8.
D.l

Univers
ity of
Cap
e Tow
n
Prog~am Noise_Sim;
{****************************************************************} {* Generates baseband I and Q CORPSK(4-7, l+D) signals and *} {* simulates the effect of additive Gaussian channel noise. *} {* The signal is generated and decoded in the same way as in *} {* the hardware; decoding is on a symbol-by-symbol basis. A *} {* ru·nning total of errors is kept, and P(e) is calculated for *} {* a range of signal~to-noise ratios. *} {****************************************************************}
Uses CRT;
Const
Var
Pi
Ch: Pathfile: ROMWord, Mem Counter: Int counter:
=
Yn minus 2, Yn-minus-1, Yn-minus-0, State minus 3: ROMValue: Patharray: ROMByte: Bytefile: Continue: i, j, Byte3back, Byte2back, Oldbyte, Newbyte, Oldprec, Pree, OldPRS, PRSOut, Noise Counter, Noise-Channel, EBoverNO, Delta, Decoded_symbol, Error Count, Count Cycles, Symbol Count: Noise value: Noise-scale, PathValue, Cossig, Sinesig, Angle, NewPhase, OldPhase, Errorprob:
3.141592654;
Char; Text;
Longint; Integer;
Integer; Real; Array[0 .. 39] of real; Byte; File of Byte; Boolean;
Longint; Array[l .. 2] of Real;
Real;
D.2

Univers
ity of
Cap
e Tow
n
Asciival: String; Noisefile: Text;
(*====================================================~=========*) Procedure Initialise_Variables; { Clear variables }
Begin Continue:= true; Yn minus 2:= O; Yn-minus-1:= O; Yn-minus-0:= O; State minus 3:= O; Oldbyte:= O; Newbyte:= O; Oldprec:= O; Pree:= O; OldPRS:= O; PRSOut:= O; Noise Counter:= O; Noise-Channel:= O; Delta:= O; Decoded_symbol:= O; Error Count:= O; Errorprob:= O; Symbol_Count:= O; Count Cycles:= O; Noise-scale:= O; PathValue:= O; Cossig:= O; Sinesig:= O; Angle:= O; NewPhase:= O; OldPhase:= O; For i:= 0 to 40 do Begin
Patharray(i):= O; End;
End;
{ Loop control variable. } { Last-but-one PRS value. } { Last seven-PRS value. } { Current seven-PRS value.} { Phase three symbols ago.} { Last four-level input } { New input word variable.} { Last precoder value. } { New precoder output. } { Last seven-PRS value. } { New seven-PRS value. } { Noise control variable.} { Noise control variable. } { Temp. phase difference } { Value of received word. } { Number of errors. } {Computed P(e). } { Number of symbols sent. } { Loop control variable. } { Noise magnitude scaler. } { Phase trajectory sample.} { In-phase signal. } { Quadrature signal. } { Temporary phase value. } { New phase value. } { Last phase value. }
{ Clear pulse shape array.}
(*==============================================================*)
Procedure Open_Bytefile;
Begin Assign( Bytefile, 'ROMTRAJ.DAT'); Rewrite( Bytefile );
End; (*==============================================================*)
Procedure Read_disk;
Var
Begin
Value: Valcode, Pointcount: Pathword:
Real;
Integer; String;
Assign(Pathfile, 'PRSTRAJ2.DAT');
D.3
{ Read in phase pulse. }

Univers
ity of
Cap
e Tow
n
Reset(Pathfile); For Pointcount:= 0 to 39 do Begin
Readln(Pathfile, Pathword); Val(Pathword, Value, Valcode); Patharray(Pointcount]:= Value;
End; Close(Pathfile);
End; (*==============================================================*)
Procedure Open_Datafile;
Begin Assign( Noisefile, 'Noisedat.dat' ); Rewrite( Noisefile );
End;
{ Open simulation O/P file} { output values. }
(*==============================================================*)
Procedure Close_Datafile;
Begin Close( Noisefile );
End;
{ Closes output data file.}
( *====================.==========================================*)
Procedure New_byte;
Begin Byte3back:= Byte2back; Byte2back:= Oldbyte; Oldbyte:= Newbyte; NewByte:= Round(Random(4));
End; .
{ Generates four-level I/P} { and records last three. }
(*==============================================================*)
Procedure Precode;
Begin Oldprec:= Pree;
{ Performs pi::ecoding to }· { prevent error propo- } { gation at the receiver. }
If Newbyte + Oldprec >= 0 then Pree:= (Newbyte + Oldprec) mod 4 Else Pree:= (Newbyte + Oldprec + 4) mod 4;
End; (*==============================================================*)
Procedure PRSFilter;
Begin OldPRS:= PRSOut; PRSOut:= Pree - Oldprec;
End;
{ Performs l+D addition of} { precoder outputs. }
(*==============================================================*)
D.4

Univers
ity of
Cap
e Tow
n
Procedure Addnoise;
Begin ~1
{ Generate Gaussian values} { for each channel. }
Noise_scale:= O.S*exp(-(EBoverNO * (ln(lO)i)/20)); For Noise Channel:= 1 to 2 do 1
Begin Noise_value[Noise_Channel]:= O;
For Noise Counter:= 1 to 12 do Begin
Noise_value[Noise_Channel]:= Noise_value[Noise_Channel] + Random;
End; Noise_value[Noise_Channel]:= Noise_value[Noise_Channel] - 6;
End; Cossig:= Cossig + (Noise_scale * Noise_Value[l]); Sinesig:= Sinesig + (Noise_Scale * Nois~_value[2]);
.... End; (*==============================================================*)
Procedure Count_Traj; { Creates trajectory for } { each channel, eight } { samples per symbol. }
Begin State_minus_3:= St~te_minus 3 + Yn_minus_2; Yn minus 2: = Yn minus 1 ;.' Yn - minus -1: = Yn - minus -0 ;' j Yn-minus-0:= PRSOut; -For Int Counter:= 0 to 7 do Begin -
PathValue:= State minus 3 + (Yn_minus_O * Patharray[Int_counter]) + (Yn_minus_l * Patharray[Int_counter + 8]) + (Yn_minus_2 * Patharray[Int_counter + 16]);
Cossig:= Cos(Pathvalue * Pi/2); Sinesig:= Sin(Pathvalue * Pi/2);
End; Addnoise;
End; (*======~=======================================================*)
Procedure Detect;
Begin OldPhase:= NewPhase; If (Cossig=O) and (Sinesig>O) Else If (Cossig=O) and (Sinesig<O) Else If (Cossig=O) and (Sinesig=O) Else If (Cossig<O) and (Sinesig=O)
then
then
then
then
D.5
{ Converts I and Q sample } { values to polar format } { to yield signal phase. }
NewPhase:= Pi/2
NewPhase:= 3*Pi/2
NewPhase:= 0
NewPhase:= Pi
I

Univers
ity of
Cap
e Tow
n
Else If (Cossig>O) and (Sinesig=O) then NewPhase:= 0 Else Begin
Angle:= Arctan(Abs(Sinesig)/Abs(Cossig)); If (Cossig > 0) and (Sinesig > 0) then NewPhase:= Angle Else If (Cossig > 0) and (Sinesig < 0) then NewPhase:= (2*Pi)
- Angle Else If (Cossig < 0) and (Sinesig < 0) then NewPhase:= Pi + Angle Else NewPhase:= Pi - Angle;
End; End; (*==============================================================*)
Procedure Decode;
Begin
{ Compares phase shifts } { to give PRS value of Tx } { and decodes it into a } { four-level data stream. }
Delta:= Round((NewPhase - OldPhase) * 2 I Pi); If ( Delta - 1 ) >= 0 then Decoded_symbol:= (Delta - 0) mod 4
-Else Decoded symbol:= (Delta - 0 + 8) mod 4; Gotoxy(-1,24 ); Write( Byte3back, ' , Decoded_Symbol );
End; ( *============================================================·==*)
Procedure Count_Errors;
Begin Count_Cycles:= Count_Cycles + 1; If Count_Cycles > 5 then Begin
Symbol_Count:= Symbol_Count + 1;
{ Compares received word } { with the original value,} { counts the number of } { errors and computes the } { symbol error rate. }
If Decoded_symbol <> Byte3back then Error Count:= Error Count + 1;
Errorprob:= Error_Count/Symbol_Count; Write( ' ', Symbol_Count, ' ', Error_Count,
End; End;
' , Errorprob ) ;
(*==============================================================*)
Begin Randomize; Clrscr;
D. 6
{ *** MAIN PROGRAM. *** }

Univers
ity of
Cap
e Tow
n
Read Disk; Open Datafile; For EBOverNO:= 1 to 10 do Begin
Initialise Variables; . Gotoxy ( 1, 2 4 ) ; ClrEol; Gotoxy( 1,10 ); Write( 'Eb/No=', EBOverNO ); While Error Count < 101 do Begin -
New_byte; Precode; PRSFilter; Count_traj;
Detect;
Decode;
Count errors; End· -, Str( Errorprob, Asciival ); Writeln( Noisefile, Asciival );
End; Close datafile;
End. -
D.7
{ Read in phase pulse } { Open output data file } { Compute for Eb/No range }
{ Set up program variables}
{ Display current Eb/No. } { Register 100 errors for } { each Eb/No value~ } { Generate a new input. } { Perform the preceding } { Implement PRS function. } { Do signal trajectories } { and add noise. } { Rect. to pol. conversion} { of corrupted signal. · } { Compare phase values, } { decode into data stream.} { Compare received and } { sent data, compute P(e) }
{ Write P(e) to file. }
{ Close output data file. }

Univers
ity of
Cap
e Tow
n
Program Decoder; {****************************************************************} {* Generates table for EPROM to convert from rectangular to *} {* polar coordinates (phase only). The signal space is modelled*} {* as a 256 x 256 matrix. The signal phaser falls on one of *} {* 65536 points - the EPROM creates a phase angle for the *}. {* decoder to extract the differentially-encoded symbol *} {* information. The phase output ranges from 0 to 255. Since *} {* two EPROM chips are used in the hardware, the program *} {* creates two byte files, each of 32768 bytes - each is *} {* chosen by altering program parameters and running again. *} {****************************************************************} Uses DOS, CRT;
Var Filevar: Line: J, K, I: Code, Value: Word:
Text; String[3];
Longint;
Integer; Byte;
Bytefile: Ch:
File of byte; Char;
{======================================~=========================} Procedure Assign_Filename;
Begin Assign( Bytefile, 'A:DecodeB.dat' );
End; {================================================================} Procedure Write_Data;
Var A, B, c, Angle, Phi, Pi: Romvalue: Cosbyte, Sinebyte:
Begin Rewrite(Bytefile); Pi:= 4*Arctan(l); Write(Pi);
Real; Byte;
Integer;
For I:= 32768 to 65535 do Begin
Cosbyte:= Hi(I)-128; Sinebyte:= Lo(I)-128; If (Cosbyte=O) and (Sinebyte>O) then Phi:= Pi/2 Else
D.8

Univers
ity of
Cap
e Tow
n
If (Cosbyte=O) and (Sinebyte<O) then Phi:= 3*Pi/2 Else If (Cosbyte=O) and (Sinebyte=O) then Phi:= 0 Else If (Cosbyte<O) and (Sinebyte=O) then Phi:= Pi Else If (Cosbyte>O) and (Sinebyte=O) then Phi:= 0 Else Begin
Angle:= Arctan(Abs(Sinebyte)/Abs(Cosbyte)); If (Cosbyte > 0) and (Sinebyte > 0) then Phi:= Angle Else If (Cosbyte > 0) and (Sinebyte < 0) then
Phi:= (2*Pi) - Angle Else If (Cosbyte < 0) and (Sinebyte < 0) then Phi:= Pi + Angle Else Phi:= Pi - Angle;
End; Phi:= Phi + (Pi/4); If (Phi> (2*Pi)) then Phi:=Phi - (2*Pi); Romvalue:= Round(255*Phi/(2*Pi)); Write( Bytefile, Romvalue );
End; Close(Bytefile);
End; {================================================================} Begin
Assign_Filename; Write Data;
End. -
D.9