preparation of supported metal catalysts by atomic and
TRANSCRIPT
Preparation of Supported Metal Catalysts by Atomic and Molecular Layer Deposition for
Improved Catalytic Performance
by
Troy D. Gould
B.S., North Carolina State University, 2007
A thesis submitted to the
Faculty of the Graduate School of the
University of Colorado in partial fulfillment
of the requirement for the degree of
Doctor of Philosophy
Department of Chemical and Biological Engineering
2014
This thesis entitled:
Preparation of Supported Metal Catalysts by Atomic and Molecular Layer Deposition for
Improved Catalytic Performance
written by Troy D. Gould
has been approved for the Department of Chemical and Biological Engineering
______________________________________________
J. Will Medlin, Ph.D.
______________________________________________
John L. Falconer, Ph.D.
Date__________________________
The final copy of this thesis has been examined by the signatories, and we
find that both the content and the form meet acceptable presentation standards
of scholarly work in the above mentioned discipline.
iii
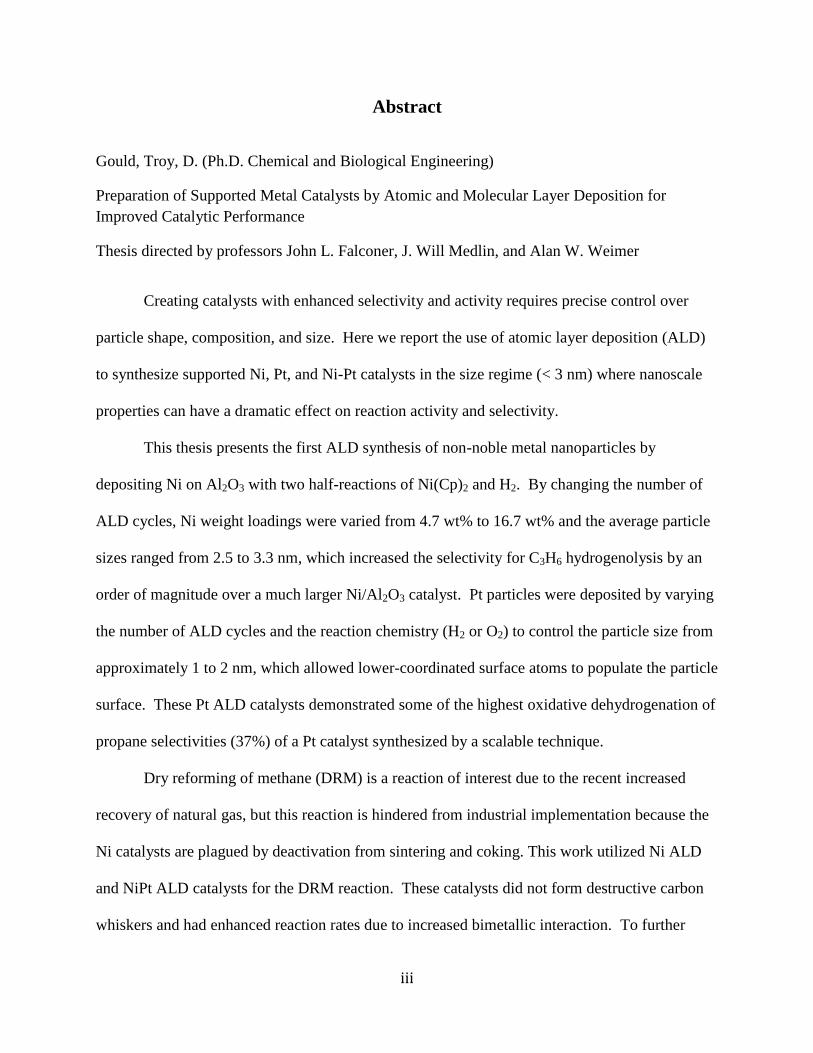
Abstract
Gould, Troy, D. (Ph.D. Chemical and Biological Engineering)
Preparation of Supported Metal Catalysts by Atomic and Molecular Layer Deposition for
Improved Catalytic Performance
Thesis directed by professors John L. Falconer, J. Will Medlin, and Alan W. Weimer
Creating catalysts with enhanced selectivity and activity requires precise control over
particle shape, composition, and size. Here we report the use of atomic layer deposition (ALD)
to synthesize supported Ni, Pt, and Ni-Pt catalysts in the size regime (< 3 nm) where nanoscale
properties can have a dramatic effect on reaction activity and selectivity.
This thesis presents the first ALD synthesis of non-noble metal nanoparticles by
depositing Ni on Al2O3 with two half-reactions of Ni(Cp)2 and H2. By changing the number of
ALD cycles, Ni weight loadings were varied from 4.7 wt% to 16.7 wt% and the average particle
sizes ranged from 2.5 to 3.3 nm, which increased the selectivity for C3H6 hydrogenolysis by an
order of magnitude over a much larger Ni/Al2O3 catalyst. Pt particles were deposited by varying
the number of ALD cycles and the reaction chemistry (H2 or O2) to control the particle size from
approximately 1 to 2 nm, which allowed lower-coordinated surface atoms to populate the particle
surface. These Pt ALD catalysts demonstrated some of the highest oxidative dehydrogenation of
propane selectivities (37%) of a Pt catalyst synthesized by a scalable technique.
Dry reforming of methane (DRM) is a reaction of interest due to the recent increased
recovery of natural gas, but this reaction is hindered from industrial implementation because the
Ni catalysts are plagued by deactivation from sintering and coking. This work utilized Ni ALD
and NiPt ALD catalysts for the DRM reaction. These catalysts did not form destructive carbon
whiskers and had enhanced reaction rates due to increased bimetallic interaction. To further

iv
limit sintering, the Ni and NiPt ALD catalysts were coated with a porous alumina matrix by
molecular layer deposition (MLD). The catalysts were evaluated for DRM at 973 K, and the
MLD-coated Ni catalysts outperformed the uncoated Ni catalysts in either activity (with 5 MLD
cycles) or stability (with 10 MLD cycles).
In summary, this thesis developed a new Ni nanoparticle ALD chemistry, explored
possibilities for changing Pt ALD particle size, brought the two techniques together to create
enhanced bimetallic catalysts, and stabilized the catalysts using MLD.

v
This thesis is dedicated to my wife Sarah for all of her love and support, and for joining me on
the journey and adventure of graduate school in Boulder.
vi
Acknowledgements
When I tell people I am tri-advised, they usually look at me like I’m crazy – but I think
my graduate studies have been an interesting journey and an overall great experience, thanks to
each one of my advisors and research groups. I’m thankful for having Will Medlin’s guidance
throughout my degree. Not only did Will give me space to be independent and learn from my
own mistakes, but he also made sure that I was always headed in the right direction. I looked to
Will not only for guidance scientifically, but Will served as a role model for how to be successful
while maintaining a work-life balance. I’m thankful for John Falconer’s rigorous and critical
review of my research and writing. Thanks to John, I feel that I am a much better scientist than I
was five years ago, or even a year ago. I’m also grateful for Alan Weimer’s support and
encouragement over the years, and his emphasis on teamwork, hence our research’s group name:
Team Weimer. Al always impressed me with how much passion he had for his research, his
desire to make a difference, and his ability to make significant contributions to his areas of focus.
Another benefit of being tri-advised is being in three research groups. I am so grateful
for the opportunities to learn from everyone, because whenever I had questions or problems there
were always so many talented and helpful people to ask. Special thanks go out to Dave King and
Jinhua(Helen) Li who were post-docs when I first started working in the Weimer lab; they really
helped me get started on doing (and understanding) ALD. I also truly believe that I could not
have done the work in this thesis without Hans Funke. Hans not only knows something about
everything, but he is an adept problem solver, and would always find the time and a way to help
me in building and fixing the equipment I used for most of my work.
The work presented in this thesis was made possible by contributions from a number of
people. Most significant was the help from Alia Lubers and Matt Montemore. Alia aided in

vii
understanding how to make the Ni ALD work many years ago, and Ni ALD was a very messy
and difficult chemistry to master. Matt Montemore provided insight through his DFT
calculations as to why the bimetallic catalysts I synthesized were performing so well. Alan Izar
was also extremely helpful in teaching me how to do MLD coatings in his reactor. One of my
undergraduate students, Jacob Carrier, also played a crucial role in logging many hours running
reactions and temperature-programmed studies. The rest of the members of my research groups
were also extremely helpful, and I am grateful for all of the discussions about our research and
exposing me to many different research projects. Not only were my research members great
scientists and colleagues, but they were also great friends.
I would also like to thank the staff in the Chemical and Biological Engineering
department. Dragan Mejic made components for me during my first couple years that I used
daily throughout my degree, and because of his excellent skill and design suggestions, the reactor
system is still going strong and will continue to do so for many years. He also taught me many
things, was always open for me to stop by and ask him questions, and helped me correct bad
habbits (like stripping threads). Dana Hauschulz and Maria Toscano-Leary were extremely
helpful with any electronic issues I had, and would drop whatever they were doing to help me. I
have to thank Andrew Schmidt especially, because dealing with financial issues for a student
who’s funding is split three ways was complicated, but somehow he kept it all together, never
complained, and was always helpful. Lastly I would like to thank Dominique de Vangel for
being extremely helpful in guiding me through all of the rules, regulations, and timelines for our
department, and doing so with a smile. I was also involved in recruiting as a graduate student
representative, and working with Dom was not only a pleasure, but was also encouraging to learn
how much he truly cares about us students.
viii
These acknowledgements would be extremely lacking without the mention of the support
from my family over the years. Their support helped get me through the tough times when
equipment was broken or kept breaking. I am especially thankful for having my wife Sarah by
my side throughout my graduate career because she was always supportive, helpful when I
needed her (or when she knew I needed help), and was someone I could always run ideas past
because she understood them. As a fellow PhD student from our department, she knew how
large the workload was, and was patient with me during my long hours in lab.
I’d also like to thank my former professor and undergraduate research advisor, Dr. Juan
Hinestroza (now at Cornell University). He introduced me to the concept of nanotechnology
during my first semester at NCSU, and granted me the incredible opportunity to begin research
during my freshman year. It was under his guidance, and through his belief in me that I
developed my interest in nanotechnology, which is perhaps why this thesis has focused on the
interface of nanotechnology and catalysis.
Lastly, this work would not have been possible without several funding sources. For
three of my years, I was funded through the National Science Foundation Graduate Research
Fellowship Program. I also received assistance for travel through the Department of Education’s
Graduate Assistantships in Areas of National Need (GAANN).
ix
Table of Contents
Abstract ……………..………………………….……………………………………………….. iii
Dedication …………….……….……………….……………………………………………...… v
Acknowledgements …….…………………….……………………………………………....…. vi
Table of Contents ……….………………….…………………………………………………….ix
List of Figures ………………………………….…………………………………………….…xiv
List of Tables …………………………………………………………..……………………… xix
List of Schematics …………………………………………………….……………………...... xix
Chapter 1: Introduction ................................................................................................................... 1
1.1 Overview ............................................................................................................................... 1
1.2 Introduction to Heterogeneous Catalysis .............................................................................. 2
1.3 Advantages of nanostructure control in transition metal heterogeneous catalysis................ 4
1.4 Dry reforming of methane on Ni-based catalysts.................................................................. 7
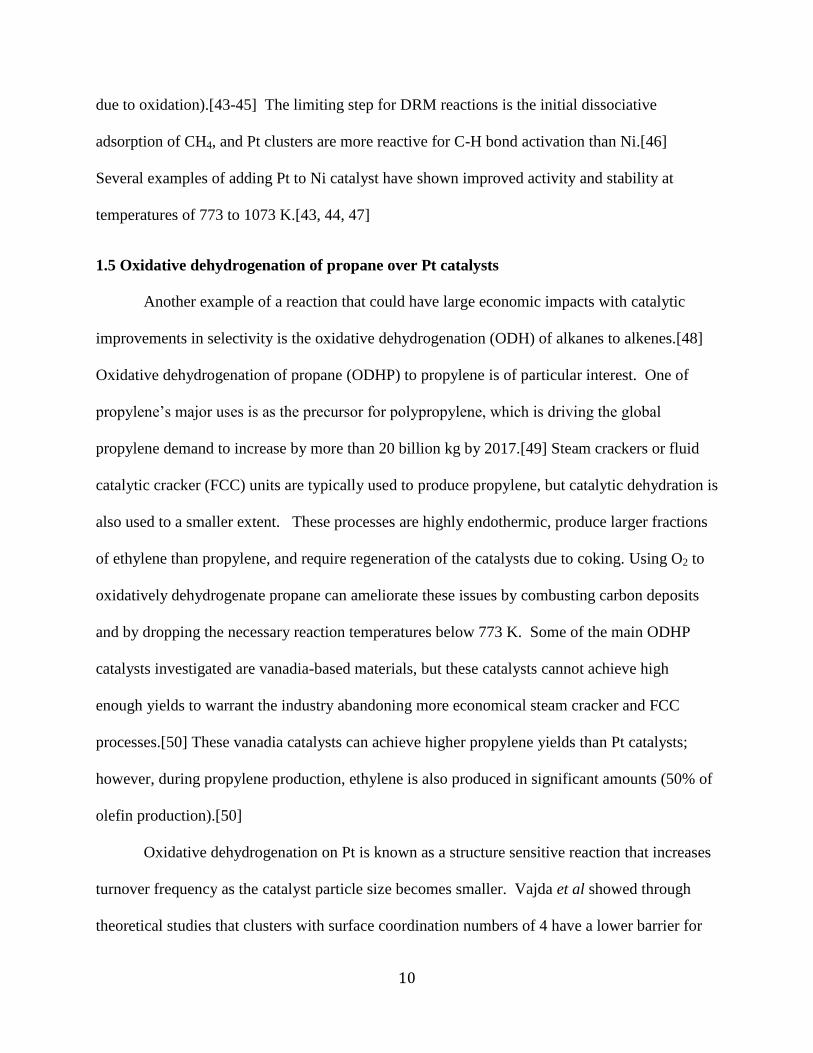
1.5 Oxidative dehydrogenation of propane over Pt catalysts .................................................... 10
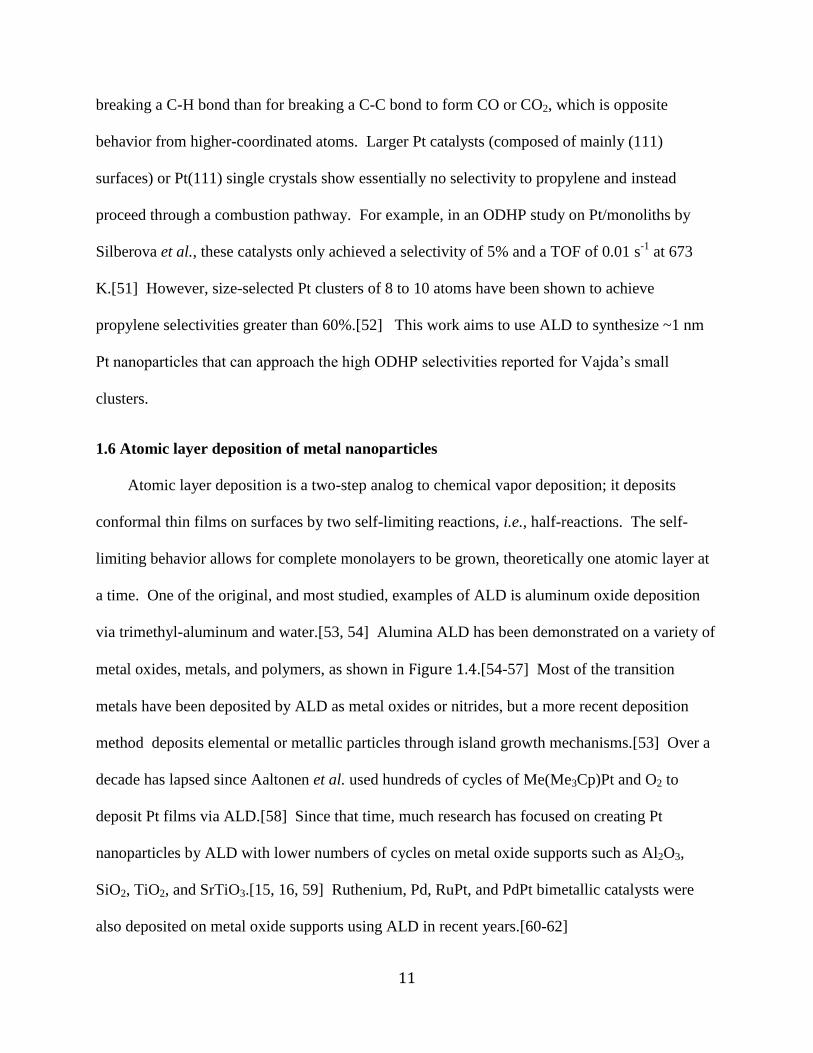
1.6 Atomic layer deposition of metal nanoparticles .................................................................. 11
1.7 Catalyst Stabilization by ALD and Molecular Layer Deposition ....................................... 14
1.8 Thesis Objectives ................................................................................................................ 19
1.9 References ........................................................................................................................... 22
Chapter 2: Synthesis of Supported Ni Catalysts by Atomic Layer Deposition ............................ 25
2.1 Abstract ............................................................................................................................... 25
x
2.2 Introduction ......................................................................................................................... 25
2.3 Materials and Methods ........................................................................................................ 28
2.3.1 Nickel ALD Catalyst Preparation ................................................................................. 28
2.3.2 Catalyst Characterization .............................................................................................. 29
2.3.3 Reactor Studies/ CO TPD ............................................................................................. 30
2.4 Results and Discussion ........................................................................................................ 30
2.4.1 Preparation of Ni Metal Nanoparticles via ALD with H2 ............................................ 30
2.4.2. Catalyst Characterization ............................................................................................. 33
2.4.3. Catalytic Performance ................................................................................................. 41
2.5. Conclusions ........................................................................................................................ 43
2.6. References .......................................................................................................................... 44
2.7 Chapter 2 Appendix – Additional HRTEM images of Ni ALD particles ........................... 47
Chapter 3: Controlling nanoscale properties of supported platinum catalysts through atomic layer
deposition ...................................................................................................................................... 50
3.1 Abstract ............................................................................................................................... 50
3.2 Introduction ......................................................................................................................... 50
3.3 Experimental Methods ........................................................................................................ 53
3.3.1 ALD synthesis .............................................................................................................. 53
3.3.2 Catalyst Characterization .............................................................................................. 54
3.3.3 Catalyst Evaluation ....................................................................................................... 56
xi
3.4 Results and Discussion ................................................................................................... 57
3.4.1 Effect of second precursor and number of cycles on particle size ............................... 57
3.4.2 In-situ ALD FTIR ......................................................................................................... 60
3.4.3 Probing surface structure by CO DRIFTS and CO TPD .............................................. 65
3.4.4 Catalyst evaluation for ODHP ...................................................................................... 72
3.5 Conclusions ......................................................................................................................... 75
3.6 References ........................................................................................................................... 75
3.7 Supplemental Figures .......................................................................................................... 77
Chapter 4: Enhanced Dry Reforming of Methane on Ni and Ni-Pt Catalysts Synthesized by
Atomic Layer Deposition .............................................................................................................. 81
4.1. Abstract .............................................................................................................................. 81
4.2. Introduction ........................................................................................................................ 81
4.3. Experimental Methods ....................................................................................................... 84
4.3.1 Catalyst synthesis. ........................................................................................................ 84
4.3.2 Catalyst Characterization. ............................................................................................. 85
4.3.3 Reaction Studies. .......................................................................................................... 86
4.3.4 Density Functional Theory Calculations. ..................................................................... 86
4.4. Results and Discussion ....................................................................................................... 88
4.4.1 Nickel Catalysts. ........................................................................................................... 88
4.4.2.1 Nickel-Platinum ALD Catalyst Materials Characterization. ..................................... 93
xii
4.4.2.2 NiPt DRM reactivity. ................................................................................................. 98
4.4.2.3 Carbon deposition on NiPt. ..................................................................................... 101
4.4 Conclusions ....................................................................................................................... 105
4.5 References ......................................................................................................................... 106
4.8. Supplemental Information ................................................................................................ 108
5. Stabilizing Ni Catalysts by Molecular Layer Deposition of Porous Aluminum Oxide .......... 111
5.1. Abstract ............................................................................................................................ 111
5.2. Introduction ...................................................................................................................... 112
5.3. Experimental Methods ..................................................................................................... 116
5.3.1 Catalyst preparation .................................................................................................... 116
5.3.2 Catalyst characterization ............................................................................................. 117
5.3.3 Reaction studies .......................................................................................................... 117
5.4. Results and Discussion ..................................................................................................... 118
5.4.1. MLD Layer Deposition & Preparation ...................................................................... 118
5.4.2. Catalyst evaluation for DRM stability and activity ................................................... 122
5.5. Conclusions ...................................................................................................................... 128
5.6. References ........................................................................................................................ 129
5.7 Supplemental Information ................................................................................................. 131
5.8 Chapter 5 Appendix: Molecular Layer Deposition on NiPt ALD Catalysts ..................... 134
5.8.1 Introduction and Experimental Methods .................................................................... 134
xiii
5.8.2 Characterization of Ni ALD catalysts and MLD stabilizing layers ............................ 134
5.8.3 Dry reforming activity and stability ........................................................................... 138
5.8.4. Conclusions ............................................................................................................... 143
Chapter 6: Conclusions and Recommendations ......................................................................... 145
6.1 Conclusions ....................................................................................................................... 145
6.2 Future Directions and Recommendations ......................................................................... 147
6.2.1 Investigating MLD-coated DRM catalysts ................................................................. 147
6.2.2 Investigating other metal ALD chemistries for nanoparticle deposition with H2. ..... 149
6.2.3 Nickel oxide ALD as base-layer for Pt ALD. ............................................................ 152
6.2.4 ALD catalysts for hydrodeoxygenation of furfural .................................................... 155
6.2.5 References .................................................................................................................. 156
Chapter 7: Bibliography .............................................................................................................. 157

xiv
List of Figures
Figure 1.1. The four structure sensitivities for catalytic reactions as a function of particle size.
[30] .................................................................................................................................................. 6
Figure 1.2. Fraction of atoms on the surface with a given atom coordination number, I, at
different particle sizes, d, (or total number of atoms (NT)1/3) for the ideal uniform cubo-
octahedron particle shape.[30] [28] ................................................................................................ 6
Figure 1.3. Three types of carbon deposition on Ni catalysts: (A) pyrolytic carbon, (B)
encapsulating carbon, (C) whisker/nanotube carbon.[40] .............................................................. 9
Figure 1.4. Demonstrated metal oxide chemistries shown in red, and metal ALD demonstrated in
blue.[63] (this representation is missing (Cu, Co, Fe),[64] Ni,[64, 65] and Ru[61] from the
demonstrated metal ALD elements.) ............................................................................................ 12
Figure 1.5. Reaction mechanism for Pt ALD with O2 on γ-alumina. I: 1st Pt dose. II: 1
st O2 dose.
III. 2nd
Pt dose. IV: End of 2nd
Pt dose. V: 2nd
O2 dose. VI: 3rd
Pt dose.[15] ................................ 13
Figure 1.6.Reaction mechanism for Pt ALD with H2 on γ-alumina. I: 1st Pt dose. II: 1
st H2 dose.
III. 2nd
Pt dose. IV: 2nd
H2 dose.[15] ............................................................................................. 13
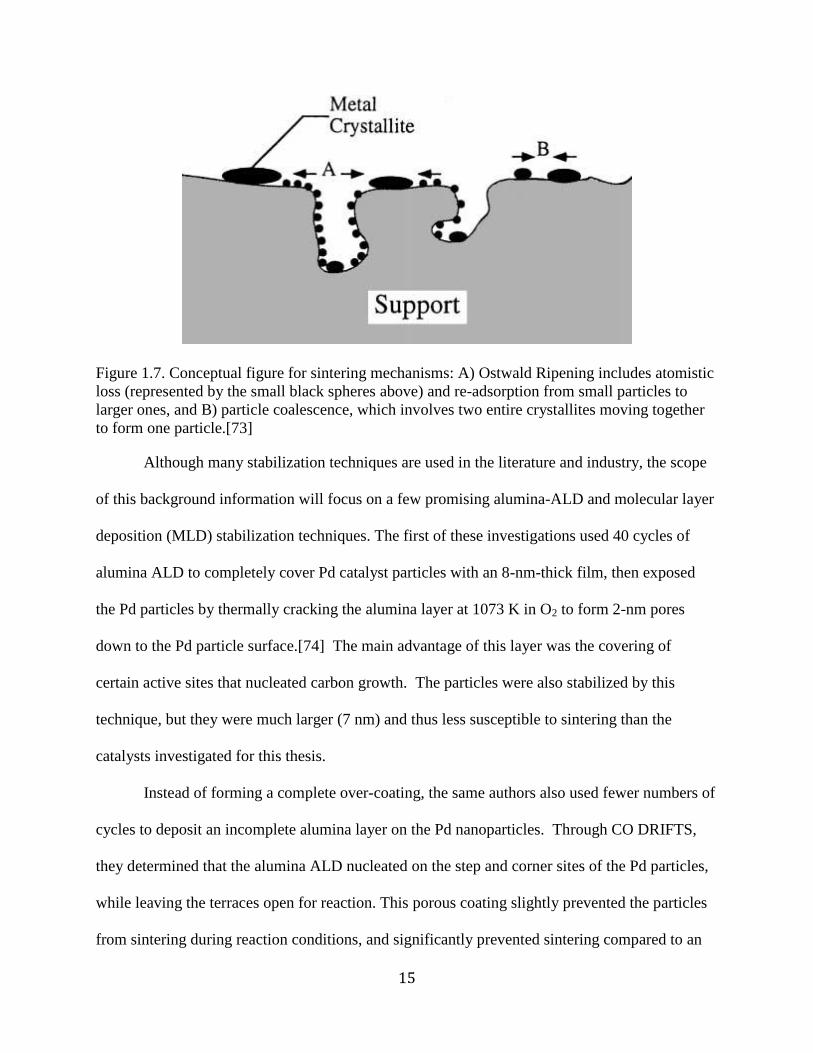
Figure 1.7. Conceptual figure for sintering mechanisms: A) Ostwald Ripening includes atomistic
loss (represented by the small black spheres above) and re-adsorption from small particles to
larger ones, and B) particle coalescence, which involves two entire crystallites moving together
to form one particle.[73] ............................................................................................................... 15
Figure 1.8 Schematic of supported Pt catalyst nanopartilces: (a) uncoated, as deposited by ALD,
(b) Pt particles coated by hybrid polymer-inorganic MLD, then calcined to form stabilizing
porous alumina layer.[75] ............................................................................................................. 17
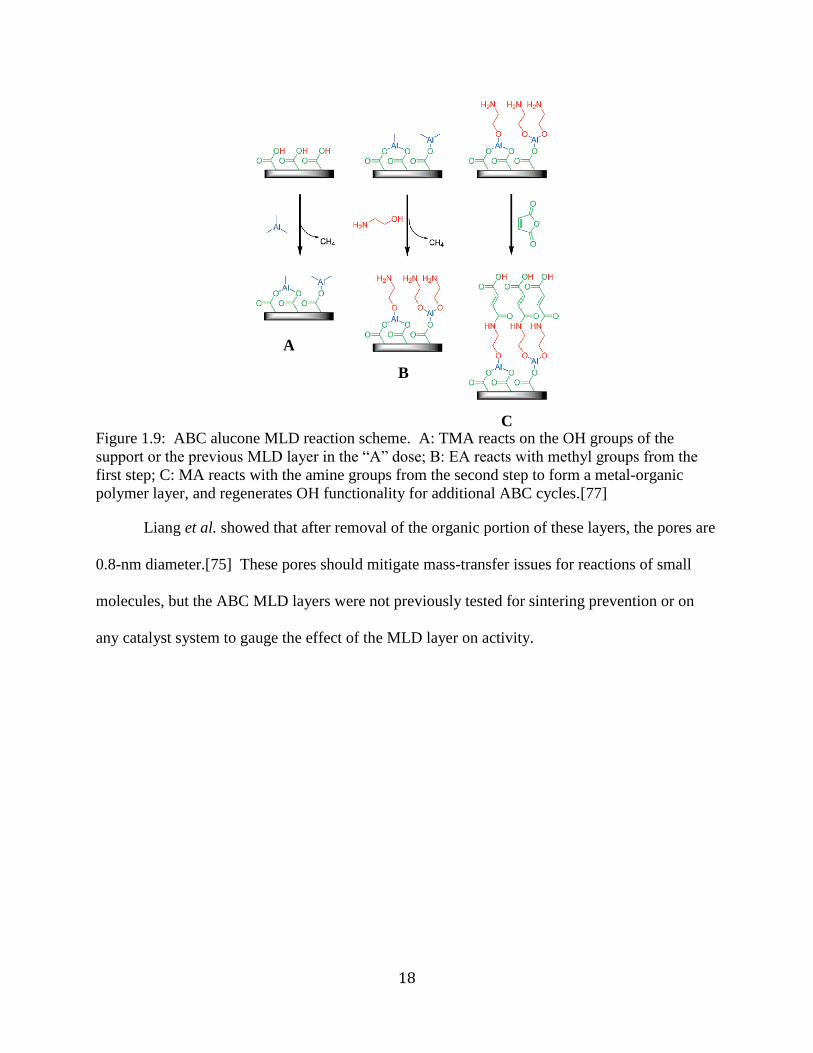
Figure 1.9: ABC alucone MLD reaction scheme. A: TMA reacts on the OH groups of the
support or the previous MLD layer in the “A” dose; B: EA reacts with methyl groups from the
first step; C: MA reacts with the amine groups from the second step to form a metal-organic
polymer layer, and regenerates OH functionality for additional ABC cycles.[77] ...................... 18
Figure 2.1 A) In-situ mass spectra of the first half-cycle NiCp2 dose B) Second half reaction
with H2 gas (20% in Ar) dosed as the precursor ........................................................................... 33
Figure 2.2. TEM and HRTEM images of Ni/Al2O3 catalysts prepared by 1 (A), 5 (B), and 15 (C)
ALD cycles ................................................................................................................................... 35
Figure 2.3 HRTEM image of Ni metal nanoparticles (dark spots on image ~ 3 nm in diameter)
deposited via ALD using NiCp2 and H2 as the two precursors. ................................................... 36
xv
Figure 2.4. Carbon monoxide, CO2, and CH4 TPD spectra for CO adsorption on ALD and IW
Ni/Al2O3 catalysts ......................................................................................................................... 40
Figure 2.5. Hydrogenolysis TOF versus maximum β2 desorption rate (normalized by number of
surface sites). The line is a quadratic fit. ..................................................................................... 42
Figure 2.A1. Nickel ALD catalyst particles imaged by NISTs HRTEM at 500,000x
magnification. ............................................................................................................................... 48
Figure 3.1A. From left to right, HRTEM, HAADF STEM, and size distribution of Pt
nanoparticles synthesized by one cycle of Pt ALD with O2 on spherical nano-alumina support. 58
Figure 3.1B. From left to right: HRTEM, HAADF STEM, and size distribution of 1-cycle Pt
ALD nanoparticles synthesized with H2 on spherical nano-alumina support. .............................. 58
Figure 3.2A. Pt ALD particle size distribution and TEM images of 5 cycles O2 Pt ALD ........... 59
Figure 3.2B. Pt ALD particle size distribution and TEM image of 5 cycles H2 Pt ALD ............. 59
Figure 3.3. A) In-situ Pt ALD FTIR spectrogram with H2 used as the second precursor. B) In-situ
Pt ALD FTIR spectrogram with O2 used as the second precursor. .............................................. 62
Figure 3.4. Carbon monoxide stretching frequencies from DRIFTS as a function of H:Pt ratios
from chemisorption for several ALD catalysts. ............................................................................ 68
Figure 3.5. Carbon monoxide TPD of Pt catalysts with different particle sizes: A) CO desorption,
B) CO2 desorption ......................................................................................................................... 70
Figure 3.6. A)CO DRIFTS spectra for the 5-cycle H2 ALD catalyst as a function of temperature,
B) CO stretching frequency peak position as a function of temperature. ..................................... 72
Figure 3.7. Selectivity to C3H6 vs. temperature for Pt ALD catalysts in the ODHP reaction. Error
bars represent standard deviation from multiple experiments. The same catalyst weight and
approximate space velocity were used for all measurements. ...................................................... 73
Figure 3.S1. Absorbance from CO DRIFTS experiments after CO saturation (~ 180 kPa) for the
different Pt/Al2O3 catalysts. Peak locations for single-atom linearly-adsorbed CO stretching are
noted. ............................................................................................................................................. 77
Figure 3.S2. CO DRIFTS spectra for catalyst at varying CO pressures (different pressures are
labeled): A) 1 cycle Pt ALD (with H2), B) 5 cycles Pt ALD (with H2) ........................................ 78

xvi
Figure 3.S3. Hydrogen produced during CO TPD for the ALD catalysts, coinciding with CO2
desorption. The signal shown above is the raw H2 signal normalized per gPt, but the H2 signal
was not calibrated. ........................................................................................................................ 79
Figure 3.S4. Yield of C3H6 during ODHP on the Pt ALD catalysts in O2-lean reaction
conditions. ..................................................................................................................................... 80
Figure 3.S5. ODHP reaction vs time for three temperatures on the Pt ALD 5-cycle (H2) catalyst.
....................................................................................................................................................... 80
Figure 4.1. A) DRM reforming rates as a function of time for Ni IW and Ni ALD catalysts at 873
K. Both porous and nanosphere Al2O3 supports were used for the Ni ALD catalysts. B) TEM
image showing carbon whiskers on the Ni IW catalyst supported on porous Al2O3 after 36 h on-
stream. C) TEM image of Ni ALD catalysts on nonporous Al2O3 spheres after 72 h of DRM at
873 K. ............................................................................................................................................ 90
Figure 4.2. Hydrogen uptake of Ni, Pt, and NiPt catalysts obtained by temperature-programed
reduction. ...................................................................................................................................... 94
Figure 4.3. Adsorbate dependent surface termination of Ni-Pt bimetallic surfaces, where a
positive value indicates that Pt/Ni/NiPt is more favorable and a negative value indicates that
Ni/Pt/NiPt is more favorable. Insets show metallic structures that were used for the DFT
calculations. .................................................................................................................................. 95
Figure 4.4. Phase diagram for NiPt bimetallic surfaces as a function of the CO and CO2 chemical
potentials. The “X” denotes representative chemical potentials of the adsorbates during the
experiments in this work assuming atmospheric total pressure. ................................................... 96
Figure 4.5. Carbon monoxide temperature-programmed desorption of Ni-Pt ALD catalysts
before and after reaction. .............................................................................................................. 98
Figure 4.6. Steady-state rates of dry reforming of methane at 873 K normalized per gram of
metal. The three bimetallic catalysts had Pt added to the two Ni catalysts shown on the left.
Error bars represent standard deviation. ....................................................................................... 99
Figure 4.7. A) Carbon and oxygen adsorption energies of different metal surfaces. B) CO
formation and CH4 dissociation energies of different metal surfaces......................................... 101
Figure 4.8. (Top) Bimetallic NiPt ALD catalyst particles after 32 h of reaction at 873 K indicate
varying particle sizes with minimal carbon whisker deposition. Metal particles (dark <20 nm)
were supported on spherical alumina supports. (Bottom) NiPt catalyst prepared by IW after 42 h
of reaction show growth of carbon whiskers. ............................................................................. 103

xvii
Figure 4.S1. TEM image of Ni ALD particles (pre-sintered for 24 h in 50% H2 at 873 K) after
10-h DRM reaction time. The catalyst contains a large number of carbon whiskers. ................ 108
Figure 4.S2. Dry reforming rates at 873 K during first 10 h of reaction for all catalysts
investigated. ................................................................................................................................ 109
Figure 4.S3. Steady-state H2:CO ratios for all catalysts investigated during DRM at 873 K. .. 109
Figure 4.S4. Four NiPt alloys used in the DFT studies. All have a NiPt mixed alloy for the
bottom two layers, with a Ni/Pt ratio of 1:1................................................................................ 110
Figure 4.S5. Carbon dioxide formed during temperature-programmed oxidation of NiPt catalysts
after DRM at 873 K .................................................................................................................... 110
Figure 5.1. A) Ni nanoparticles (~2-5 nm dark particles) deposited on spherical alumina;
Ni/Al2O3 nanoparticles coated by B) 5-MLD cycles, C) 10-MLD cycles, D) 15-MLD cycles,
where the hybrid polymer-inorganic MLD layer is the lighter layer encompassing the spheres in
B-D. ............................................................................................................................................. 119
Figure 5.2.Chemisorption H2 uptake on metal Ni sites after different reduction temperatures for
the uncoated Ni ALD catalyst and catalysts modified by 5, 10, and 15 MLD layers. The size of
the markers shown above are approximately equal to the measurement error. .......................... 121
Figure 5.3. Methane dry reforming rate of the Ni ALD catalyst modified with 10 ABC MLD
layers for varying calcination treatments used to remove the organic components from the MLD
layers. .......................................................................................................................................... 122
Figure 5.4. Dry reforming rates at 973 K for uncoated Ni ALD catalyst, and the same catalyst
coated with 5, 10, and 15 MLD layers. ....................................................................................... 123
Figure 5.5. Effect of oxidizing and reducing 1 h each at 773 K on DRM rate over time on A) Ni
ALD catalyst modified with 10 MLD layers, B) Ni ALD catalyst modified with 5 MLD layers.
..................................................................................................................................................... 125
Figure 5.6. TEM images of post-reaction Ni catalysts on spherical alumina supports: (A)
uncoated sample after 82-h DRM reaction, (B) coated with 5-MLD layers after 24-h reaction, (C)
coated with 10-MLD cycles after 108-h total time on stream and 2 regenerations .................... 126
Figure 5.7. Rate of CO2 formation during TPO after DRM at 973 K for 82 h and 24 h for the
uncoated catalyst, 24 h for the 5-MLD catalyst, and 39 h for the 15-MLD catalyst. ................. 128
xviii
Figure 5.S1. Carbon dioxide formed during TPO used to remove the organic component of the
hybrid polymer-inorganic MLD layer from a 10-MLD cycle modified Ni/Al2O3 ALD catalyst.
..................................................................................................................................................... 131
Figure 5.S2. Dry reforming rate of Ni catalyst with 10-MLD layers after oxidizing the catalyst at
773 K and then reducing it at 973 K. .......................................................................................... 132
Figure 5.S3. Nickel particle size distributions of A) Ni ALD uncoated catalyst after 82-h DRM,
B) Ni ALD catalyst with 5-MLD layers after 2 regenerations and 138-h total DRM time, C) Ni
ALD catalyst with 10-MLD layers after 2 regenerations and 108-h DRM. ............................... 133
Figure 5.A1. NiPt nanoparticles (~1-2 nm dark particles) deposited on spherical alumina, B) NiPt
nanoparticles coated by 10-MLD cycles, C) NiPt nanoparticles coated by 15-MLD cycles. .... 135
Figure 5.A2. TEM of NiPt ALD catalysts (< 2-nm dark particles) coated with 15 MLD cycles
after calcination in air at 673 K for 1 h, then reduced at 773 K for 1 h. ..................................... 136
Figure 5.A3. Carbon dioxide form during TPO used to remove the organic components of the
NiPt catalyst and the Ni catalyst, each with 10 ABC MLD polymer hybrid layers. .................. 137
Figure 5.A4. Dry reforming rates at 973 K: A) first 24 h for uncoated NiPt ALD catalyst, and the
same catalysts coated with 10 and 15 MLD layers. B) Long term DRM rates for uncoated and
15-MLD catalyst. C) DRM Rates normalized to final observed DRM rate for uncoated NiPt and
15-MLD NiPt catalysts. .............................................................................................................. 141
Figure 5.A5. TEM images of post-reaction NiPt catalysts on spherical alumina supports: (A)
uncoated sample, after 24 h reaction, (B) coated with 10 MLD layers, after 12 h reaction, (C)
coated with 15 MLD cycles, after 172 h reaction ....................................................................... 142
Figure 5.A6. Rate of CO2 formation during temperature-programmed oxidation, after dry
reforming of methane for the times indicated, of an alumina-supported NiPt ALD catalyst and
the NiPt ALD catalyst with 15 MLD cycles ............................................................................... 143
Figure 6.1. Possible Fe nanoparticles deposited by ALD with ferrocene and H2 at 673 K. ...... 151
Figure 6.2. HRTEM of 20 cycles Pt ALD (done with O2) on NiO ALD layer on top of alumina
nanosphere support. .................................................................................................................... 153
Figure 6.3. HRTEM of 20 cycles Pt ALD (with H2) on NiO ALD layer on top of Al2O3. ....... 154

xix
List of Tables
Table 2.1. Catalyst characterization .............................................................................................. 37
Table 2.2. Propylene hydrogenation and hydrogenolysis turnover frequencies (TOF) at 498 K
and hydrogenolysis selectivity. Standard errors of reaction TOF are shown. ............................. 42
Table 3.1. Pt catalyst properties ................................................................................................... 60
Table 3.2. Catalyst properties for Pt ALD deposited on porous Al2O3 ........................................ 66
Table 3.3. Catalytic ODHP performance at 673 K ....................................................................... 74
Table 4.1. Catalyst composition and chemisorption results ......................................................... 88
Table 4.2. Barriers to atomic carbon diffusion ........................................................................... 104
Table 5.A3. Catalyst properties and DRM activity..................................................................... 138
List of Schemes
Scheme 2.1. Reaction scheme for first ALD half reaction in which the NiCp2 precursor reacts
with surface OH. ........................................................................................................................... 31
Scheme 2.2. Reaction scheme for second ALD half reaction in which H2 reacts with surface
species. .......................................................................................................................................... 32
Scheme 3.1. Reaction scheme for metal island growth H2 ALD. A) Alumina surface before Pt
dose. B) Surface after MePt(Me3Cp) dose. C) Pt atoms diffusing on surface after H2 dose D) Pt
nanoparticle formed. E) Next MePt(Me3Cp) dose reacts on OH groups. F) Subsequent H2 dose
allows Pt to diffuse to existing particles or to form new particles. ............................................... 63
Scheme 3.2. Reaction scheme for metal island growth O2 ALD. Steps A and B are identical to
those in Scheme 1. C) Pt atoms diffusing on surface after O2 dose D) Pt nanoparticle formed. E)
Next MePt(Me3Cp) dose reacts on Pt-O sites. F) Subsequent O2 dose removes organic ligands
and newly deposited Pt bind to existing Pt clusters. ..................................................................... 65
Scheme 5.1 Schematic representation of depositing metal nanoparticles, coating these particles
with MLD layers, and calcining the catalyst to remove the organic to form a porous alumina
layer............................................................................................................................................. 115
1
Chapter 1: Introduction
1.1 Overview
The goal of this thesis is to explore and understand enhanced nanoscale effects in
catalysis by creating supported Ni, Pt, and NiPt catalysts with particle sizes below 3 nm using
atomic layer deposition (ALD) as the synthesis technique. Specifically, the objectives of this
thesis are to:
1) Develop and explore the catalytic advantages of synthesizing Ni nanoparticles by ALD
for the hydrogenolysis of alkenes.
2) Explore the effect of varying Pt nanoparticle size on surface structure and selectivity for
the oxidative dehydrogenation of propane.
3) Synthesize bimetallic Ni-Pt catalysts by ALD to improve dry reforming of methane
activity and coking resistance.
4) Stabilize nanoparticles synthesized by ALD using porous coatings prepared with
molecular layer deposition (MLD) to maximize the benefits of maintaining small particle
size in harsh reforming conditions.
This introduction provides a broad background and motivation for studying the nanoscale
catalytic enhancements found in this thesis. An overview of nanostructure effects on catalysis is
provided, in addition to specific information about the correlation between particle size and
catalytic activity for two of the reactions studied in this thesis. This introduction also provides
information about the synthesis methodology used to create these nanoparticles (ALD) and
modify the particles with stabilizing layers. Finally, detailed explanations of the specific
objectives for this thesis are given.
2
1.2 Introduction to Heterogeneous Catalysis
A major milestone in the field of heterogeneous catalysis was the discovery of the Haber-
Bosch process in 1905.[1, 2] This process converts N2 and H2 gas to ammonia at an industrial
scale, allowing for production of fertilizer that contributed substantially to population growth,
and is estimated to provide fertilizer that sustains approximately 1/3 of the population today.[1]
Since that time, heterogeneous catalysis has spurred the development of several crucial
industries, and is utilized in approximately 90% of the total production in the chemical
industry.[2, 3] Discoveries of synthetic zeolite materials and the fluid catalytic cracking (FCC)
process led to substantial development of the petrochemical industry for fuels and plastics
production.[4] During the 20th
century, most advances in catalysis came through guess-and-
check high throughput catalyst screening.[3, 5] While high-throughput screening identified many
useful catalysts, the discovery of better catalysts has recently been driven by fundamental
understanding of how catalysts work and how to design specific catalysts for specific reactions.
Advances in computational power have allowed for significant development of catalyst
modeling for surfaces, and more recently, nanoparticles.[6-9] More sophisticated synthesis
techniques have been developed to allow for spatial control over catalyst morphology and
composition. Additionally, advanced experimental techniques have been developed to study
catalysts at varying levels: fundamental studies in ultra-high vacuum (UHV) on single
crystals,[10] advanced spectroscopic techniques for structure and composition of the
catalysts,[11-14] in-situ monitoring of catalyst syntheses,[15, 16] and in-operando monitoring of
catalytic materials during realistic reaction conditions.[6, 17] The collective knowledge gained
from modeling and experimentation provide insight into fundamental broad-reaching principles
in catalysis, such as the d-band theory for relating electronic structure to metal-adsorbate
3
interactions.[18, 19] More recently, researches have attempted to develop models, or investigate
key parameters (such as CO and O binding energies) that will have predictive power for
identifying the best catalyst for a given reaction.[20, 21] The prediction of ideal catalysts based
on fundamental principles is called rational catalyst design, and is the future of metal catalyst
discovery in terms of advancing catalyst activity and selectivity, in addition to designing
catalysts for reactions that are currently extremely difficult to perform. [22-24]
Heterogeneous catalysis has grown to encompass a wide range of materials such as
zeolites, metal oxides, transition metals, metal salts, organic materials, or a combination of any
of these materials.[3] The most widely used form of heterogeneous catalysts are transition metals
supported on metal oxides, which began significant development with the discovery of the
Fischer-Tropsch (F-T) process in 1913.[2] A large proportion of supported metal catalysts used
in fuel and chemical production are supported on Al2O3, SiO2, ZrO2, or carbon, and these
supports often affect the catalytic behavior of the metals or the catalytic properties of a bi-
functional metal/metal oxide catalyst.[3] The work in this thesis used Al2O3 supports only, and
focused on Ni and Pt transition metal catalysts. These two metals catalyze many reactions
industrially, but exist at the opposite ends of the price spectrum, with current December 2013
market prices of Ni around $0.43 per troy-ounce and Pt priced around $1400 U.S. dollars per
troy-ounce.[25] Although Pt is the superior catalyst for many reactions, economic incentives to
offset the catalyst cost motivate the need for greater selectivity (to reduce costs of purification
and separation), or greater activity and stability (to reduce the amount of Pt required). Many
catalysts, especially those with the highest cost, are supported as nanoparticles with diameters
less than 10 nm. These small sizes increase the surface to volume ratio of the catalysts, thereby
maximizing the amount of active surface area exposed to reaction conditions and wasting less of
4
these precious metals on the interior. Catalysts also have other advantages when their particles
are smaller than 5 nm.[6, 26, 27] When catalyst nanoparticles become sufficiently small, the
fraction of atoms on (111) terraces diminishes, and other lower-coordinated atoms start to
become the dominant type of surface atom.[28, 29] Changing the coordination and type of
catalytic site can have dramatic effects on catalytic activity and selectivity. Depending on the
type of reaction, decreasing the particle size can shut down a reaction completely, have no
change in catalytic behavior with particle size, or enhance catalytic properties.[26, 27, 30]
1.3 Advantages of nanostructure control in transition metal heterogeneous catalysis
Heterogeneous catalysis was once considered a “black art” due to uncertainties of how
catalysts worked at the fundamental level. However, with the advance of more fundamental
techniques such as ultra-high vacuum (UHV) single crystal studies or density functional theory
(DFT) computations, a more rational approach to understanding and designing catalysts tailored
to specific reactions has been widely successful.[8, 10, 17, 19, 31, 32] The catalysis field has
been advancing towards precise control of nanometer and sub-nanometer features in catalytic
materials. These advances were made possible by new synthesis methods, better analytical
techniques to probe ultra-small features, and by the greater understanding of fundamental
catalytic principles at the nanoscale through theoretical investigations.[6, 17, 33]
Metal nanoparticles can exhibit catalytic properties that differ greatly from bulk materials
due to geometric and electronic effects that arise when the particles become smaller than 10
nm.[26, 30] Additionally, a clear advantage in catalyst activity and utilization is achieved with
nanoparticles because as the size decreases, the fraction of surface atoms increases. More
interestingly, selectivity and/or activity increase for some reactions when the particle diameters
drop below 10 nm, or even further as the diameters approach 2 nm.[26, 27]
5
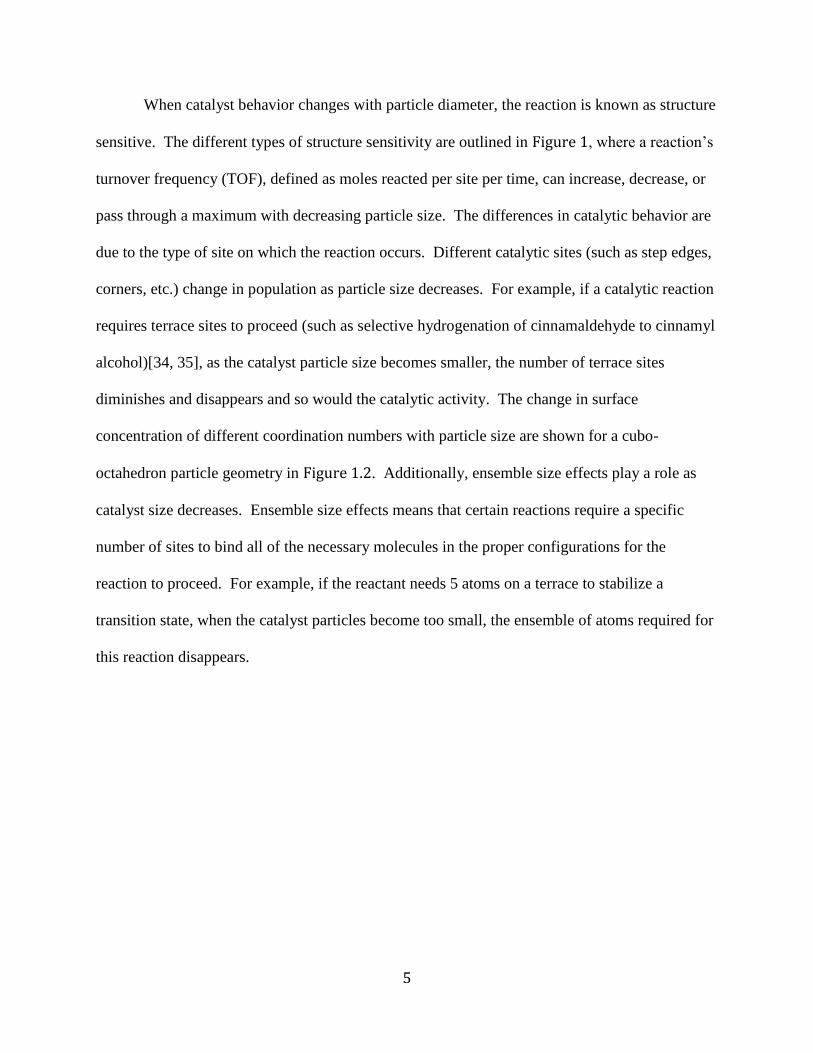
When catalyst behavior changes with particle diameter, the reaction is known as structure
sensitive. The different types of structure sensitivity are outlined in Figure 1, where a reaction’s
turnover frequency (TOF), defined as moles reacted per site per time, can increase, decrease, or
pass through a maximum with decreasing particle size. The differences in catalytic behavior are
due to the type of site on which the reaction occurs. Different catalytic sites (such as step edges,
corners, etc.) change in population as particle size decreases. For example, if a catalytic reaction
requires terrace sites to proceed (such as selective hydrogenation of cinnamaldehyde to cinnamyl
alcohol)[34, 35], as the catalyst particle size becomes smaller, the number of terrace sites
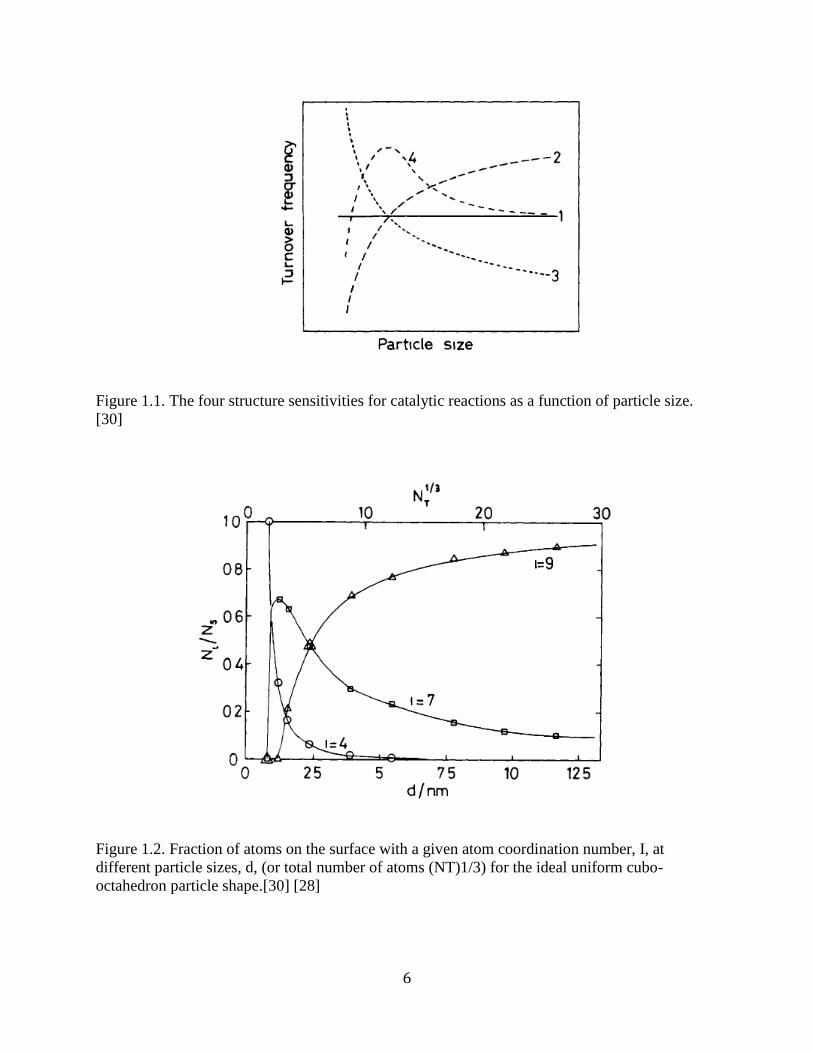
diminishes and disappears and so would the catalytic activity. The change in surface
concentration of different coordination numbers with particle size are shown for a cubo-
octahedron particle geometry in Figure 1.2. Additionally, ensemble size effects play a role as
catalyst size decreases. Ensemble size effects means that certain reactions require a specific
number of sites to bind all of the necessary molecules in the proper configurations for the
reaction to proceed. For example, if the reactant needs 5 atoms on a terrace to stabilize a
transition state, when the catalyst particles become too small, the ensemble of atoms required for
this reaction disappears.
6
Figure 1.1. The four structure sensitivities for catalytic reactions as a function of particle size.
[30]
Figure 1.2. Fraction of atoms on the surface with a given atom coordination number, I, at
different particle sizes, d, (or total number of atoms (NT)1/3) for the ideal uniform cubo-
octahedron particle shape.[30] [28]
7
Changes in coordination number have such large effects on TOF because of electronic
structure effects, geometric effects, and the interaction of these factors with the type of bond
being reacted. Activation of a σ-bond, such as with CH4 activation, can occur on a single atom.
As the coordination number of an atom decreases, the localization of the valence electrons on the
atom’s surface increases (shifting the d-band center upwards), and the degree of orbital overlap
with that of the reactant also increases. These two factors aid in dissociating the σ-bond even
though the transition state structure does not change. Other reactions such as hydrogenolysis
require molecules to interact with multiple sites (such as those found on step edges) to stabilize
transition states and cleave bonds by activating the π-bond.
1.4 Dry reforming of methane on Ni-based catalysts
The recent enhancements in natural gas recovery have drawn much attention to methane
steam reforming (MSR) and dry reforming of methane (DRM) with CO2 to produce H2 or syngas
for fuel production. These reforming reactions and their heat of reaction (∆H298) are listed
below:
Methane steam reforming:
CH4 + H2O → CO + 3H2 ∆H298 = 206 kJ/mol
Dry reforming of methane:
CO2 + CH4 → 2CO + 2H2 ∆H298 = 247 kJ/mol
Both reactions are highly endothermic, and are typically run industrially from 773 K up to
1073 K in tubular reformers. A side reaction, the reverse water gas shift, can also occur during
DRM conditions to create water and CO. Methane steam reforming is mainly used to produce
hydrogen since the H2:CO ratio in the product stream is typically 3:1 or higher.[36-38]
Currently, up to 95% of the U.S. production of H2 is done through MSR.[39] The mixture of H2

8
and CO gases, otherwise known as syngas (or synthesis gas), is used to make a variety of longer
chain molecules. The classic and most historic example of this is the Fischer-Tropsch (FT)
process that can create fuel-grade molecules from syngas. Depending on the desired product and
the associated reaction chemistry, different ratios of H2:CO are required as a feed stream. These
ratios are almost always less than 3:1, and typically are 2:1 (for low-temperature FT), or 1:1 (for
higher alcohol synthesis), or for methanol and DME syntheses the ratio of (H2 - CO2):(CO +
CO2) is approximately 2.[36] To bring down the ratio of H2:CO, the stream is often put through
reverse water gas-shift reactions to deplete H2 and increase CO. Dry reforming has potential for
dealing with this issue since the H2:CO ratio is typically less than one. Not only does DRM use
CO2 instead of H2O, but the resultant product stream can be blended with a stream from MSR to
achieve a desired H2:CO ratio for chemical synthesis.
Nickel is the primary catalyst used for these reforming reactions, but Ni catalysts are plagued
by deactivation due to sintering and coking.[36, 40, 41] Sintering decreases the rate of reaction,
but coking can eventually form enough carbon to shut the reaction down completely or totally
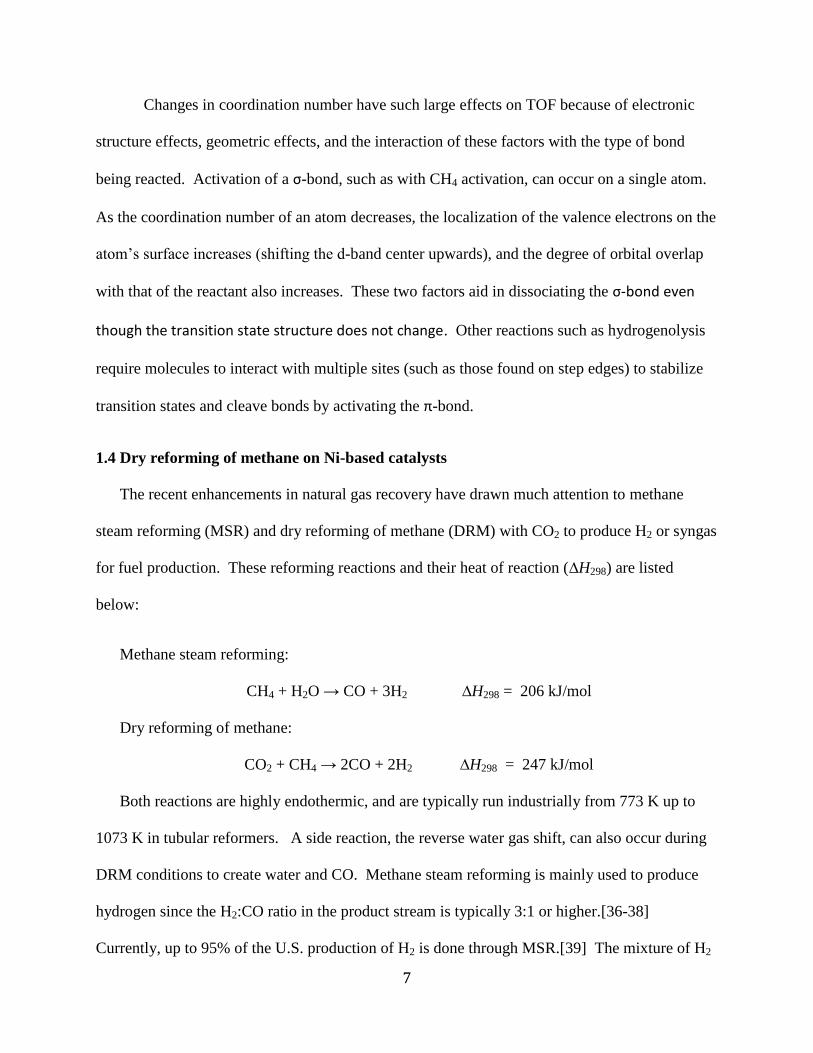
clog reactors.[36] Examples of the types of carbon that can be deposited are shown below in
Figure 1.3; whisker carbon is the most destructive form for industrial methane reforming. These
carbon whiskers can lift the Ni particles off the support, and by continuously growing more
carbon from the rear of the particle, the nanotubes can build up large pressure drops in the
reactor, crush the catalyst particles against the walls of reformers, and decrease heat transfer
from tubular reformers.
9
Figure 1.3. Three types of carbon deposition on Ni catalysts: (A) pyrolytic carbon, (B)
encapsulating carbon, (C) whisker/nanotube carbon.[40]
Methane reforming can be run at higher temperatures (1073 to 1173 K) to
thermodynamically limit the amount of carbon formed.[42] Not only are these temperatures
extremely energy intensive and costly, but they also cause problems with decreased activity due
to the formation of nickel-aluminates and excessive surface area loss due to sintering. For these
reasons, much research has been conducted on finding ways to limit carbon deposition without
using these high temperatures. One of the methods most pertinent to this thesis is to use small
particles that destabilize carbon nucleation. A DFT study on graphite formation from
decomposed CH4 indicated that carbon preferentially nucleates on Ni(211) step edges as opposed
to terrace sites.[7] However, the study also calculated that a critical size step edge greater than
2.5 nm was needed to anchor and form a stable carbon cluster on which more carbon can grow.
This work aims to utilize 3-nm Ni particles to increase activity due to higher surface area and
enhance coking resistance due to sufficiently small step edges.
Other attempts at increasing the stability and activity for DRM involve adding Pt to the Ni
catalysts. Incorporating Pt can break up Ni ensembles, inducing the same effect of limiting Ni
particle size. Additionally, Pt can increase the Ni reducibility (or keep Ni from losing activity
10
due to oxidation).[43-45] The limiting step for DRM reactions is the initial dissociative
adsorption of CH4, and Pt clusters are more reactive for C-H bond activation than Ni.[46]
Several examples of adding Pt to Ni catalyst have shown improved activity and stability at
temperatures of 773 to 1073 K.[43, 44, 47]
1.5 Oxidative dehydrogenation of propane over Pt catalysts
Another example of a reaction that could have large economic impacts with catalytic
improvements in selectivity is the oxidative dehydrogenation (ODH) of alkanes to alkenes.[48]
Oxidative dehydrogenation of propane (ODHP) to propylene is of particular interest. One of
propylene’s major uses is as the precursor for polypropylene, which is driving the global
propylene demand to increase by more than 20 billion kg by 2017.[49] Steam crackers or fluid
catalytic cracker (FCC) units are typically used to produce propylene, but catalytic dehydration is
also used to a smaller extent. These processes are highly endothermic, produce larger fractions
of ethylene than propylene, and require regeneration of the catalysts due to coking. Using O2 to
oxidatively dehydrogenate propane can ameliorate these issues by combusting carbon deposits
and by dropping the necessary reaction temperatures below 773 K. Some of the main ODHP
catalysts investigated are vanadia-based materials, but these catalysts cannot achieve high
enough yields to warrant the industry abandoning more economical steam cracker and FCC
processes.[50] These vanadia catalysts can achieve higher propylene yields than Pt catalysts;
however, during propylene production, ethylene is also produced in significant amounts (50% of
olefin production).[50]
Oxidative dehydrogenation on Pt is known as a structure sensitive reaction that increases
turnover frequency as the catalyst particle size becomes smaller. Vajda et al showed through
theoretical studies that clusters with surface coordination numbers of 4 have a lower barrier for
11
breaking a C-H bond than for breaking a C-C bond to form CO or CO2, which is opposite
behavior from higher-coordinated atoms. Larger Pt catalysts (composed of mainly (111)
surfaces) or Pt(111) single crystals show essentially no selectivity to propylene and instead
proceed through a combustion pathway. For example, in an ODHP study on Pt/monoliths by
Silberova et al., these catalysts only achieved a selectivity of 5% and a TOF of 0.01 s-1
at 673
K.[51] However, size-selected Pt clusters of 8 to 10 atoms have been shown to achieve
propylene selectivities greater than 60%.[52] This work aims to use ALD to synthesize ~1 nm
Pt nanoparticles that can approach the high ODHP selectivities reported for Vajda’s small
clusters.
1.6 Atomic layer deposition of metal nanoparticles
Atomic layer deposition is a two-step analog to chemical vapor deposition; it deposits
conformal thin films on surfaces by two self-limiting reactions, i.e., half-reactions. The self-
limiting behavior allows for complete monolayers to be grown, theoretically one atomic layer at
a time. One of the original, and most studied, examples of ALD is aluminum oxide deposition
via trimethyl-aluminum and water.[53, 54] Alumina ALD has been demonstrated on a variety of
metal oxides, metals, and polymers, as shown in Figure 1.4.[54-57] Most of the transition
metals have been deposited by ALD as metal oxides or nitrides, but a more recent deposition
method deposits elemental or metallic particles through island growth mechanisms.[53] Over a
decade has lapsed since Aaltonen et al. used hundreds of cycles of Me(Me3Cp)Pt and O2 to
deposit Pt films via ALD.[58] Since that time, much research has focused on creating Pt
nanoparticles by ALD with lower numbers of cycles on metal oxide supports such as Al2O3,
SiO2, TiO2, and SrTiO3.[15, 16, 59] Ruthenium, Pd, RuPt, and PdPt bimetallic catalysts were
also deposited on metal oxide supports using ALD in recent years.[60-62]

12
Figure 1.4. Demonstrated metal oxide chemistries shown in red, and metal ALD demonstrated in
blue.[63] (this representation is missing (Cu, Co, Fe),[64] Ni,[64, 65] and Ru[61] from the
demonstrated metal ALD elements.)
Platinum ALD is perhaps the most studied form of particle ALD because of the attractive
properties of the Pt nanoparticles, and the ease at which the Pt ALD can be performed with the
Me3Pt(MeCp) precursor. This wide usage of Pt ALD has led to several studies elucidating the Pt
ALD reaction mechanism. Work by the Kessels group, through in situ FTIR monitoring of gas-
phase products during ALD, showed that the initial reaction step involves the Pt precursor
reacting with surface hydroxyl groups to form CH4.[16, 66] The second half-reaction, involving
O2, combusts the remaining ligands to leave behind the Pt nanoparticles. The first half reaction,
dosing the Pt precursor is [16]:
2(MeCp)PtMe3(g) + 3 O(ads) → 2(MeCp)PtMe2(ads) + CH4(g) + CO2(g) + H2O(g)
The second half-reaction, using O2 as the precursor is [16]:
2(MeCp)PtMe2(ads) + 24 O2(g) → 2 Pt(s) + 3 O(ads) + 16 CO2(g) + 13 H2O(g)
This Pt ALD mechanism was verified and expanded upon by Setthapun et al. by in-situ
monitoring of Pt ALD with EXAFS and XANES.[15] Schematics of their proposed ALD

13
mechanisms are shown in Figure 1.5 and Figure 1.6. They found that during the second half-
reaction, the O2 forms Pt-O species that become reaction sites for subsequent ALD cycles.
Although the reaction above is useful, and the schemes below in Figure 1.5 and Figure 1.6 are
helpful for understanding the reactions taking place during ALD, these studies fail to address the
issue of particle formation. The ALD may take place on an individual site as depicted in Figure
1.5, but the resultant material is not an individual atom of Pt and is instead a coalescence of
many atoms. With the exception of their one study of Pt ALD with H2,[15] all other metal
nanoparticle ALD use the second half-cycle reagent of O2 or formalin to deposit the
nanoparticles.[16, 59-62, 66] Before the success of Ni ALD with H2 shown in this work,[65]
only noble metal nanoparticles were deposited via ALD.
Figure 1.5. Reaction mechanism for Pt ALD with O2 on γ-alumina. I: 1st Pt dose. II: 1
st O2 dose.
III. 2nd
Pt dose. IV: End of 2nd
Pt dose. V: 2nd
O2 dose. VI: 3rd
Pt dose.[15]
Figure 1.6.Reaction mechanism for Pt ALD with H2 on γ-alumina. I: 1st Pt dose. II: 1
st H2 dose.
III. 2nd
Pt dose. IV: 2nd
H2 dose.[15]

14
As previously mentioned, precious metals such as Pt and Pd are often deposited at high
dispersions to minimize raw materials costs. These catalysts also exhibit enhanced catalytic
activity for certain reactions when they are ultra-small (< 2 nm).[62, 67] Palladium and Pt ALD
naturally produce small particles, but several efforts have been made to decrease the particle size
even further. Some studies have intentionally blocked or removed sites for Pd ALD, or
attempted low temperature deposition to slow diffusion.[67, 68] Several studies have used DFT
to probe how Pt and Pd atoms adsorb and diffuse and nucleate on TiO2 and Al2O3 supports.[69-
71] These studies found that hydroxyl groups on the alumina surface can decrease the adsorption
energy of these metal atoms, and the OH groups also increase the diffusion barrier for migration
across the support surface.[70, 71]
1.7 Catalyst Stabilization by ALD and Molecular Layer Deposition
Although many of the nanoparticle catalysts discussed in this thesis have extraordinary
catalytic performance in their native, as-synthesized state, a major barrier to implementation of
these technologies is sintering of the catalysts. Catalyst nanoparticles sinter through two primary
mechanisms depicted in Figure 1.7: 1) particle coalescence, whereby entire catalyst particles
migrate across the surface, and 2) Ostwald ripening, where larger catalyst particles grow to
become more stable at the expense of atom loss from smaller catalyst particles.[41, 72, 73]
Sintering becomes more of an issue as particle size decreases, since one of the driving forces for
particle growth is minimization of surface energy of the particle, and this surface energy is
highest on smaller particles.[3, 69]
15
Figure 1.7. Conceptual figure for sintering mechanisms: A) Ostwald Ripening includes atomistic
loss (represented by the small black spheres above) and re-adsorption from small particles to
larger ones, and B) particle coalescence, which involves two entire crystallites moving together
to form one particle.[73]
Although many stabilization techniques are used in the literature and industry, the scope
of this background information will focus on a few promising alumina-ALD and molecular layer
deposition (MLD) stabilization techniques. The first of these investigations used 40 cycles of
alumina ALD to completely cover Pd catalyst particles with an 8-nm-thick film, then exposed
the Pd particles by thermally cracking the alumina layer at 1073 K in O2 to form 2-nm pores
down to the Pd particle surface.[74] The main advantage of this layer was the covering of
certain active sites that nucleated carbon growth. The particles were also stabilized by this
technique, but they were much larger (7 nm) and thus less susceptible to sintering than the
catalysts investigated for this thesis.
Instead of forming a complete over-coating, the same authors also used fewer numbers of
cycles to deposit an incomplete alumina layer on the Pd nanoparticles. Through CO DRIFTS,
they determined that the alumina ALD nucleated on the step and corner sites of the Pd particles,
while leaving the terraces open for reaction. This porous coating slightly prevented the particles
from sintering during reaction conditions, and significantly prevented sintering compared to an
16
uncoated catalyst under Ar for 6 h at 773 K. A third ALD-based technique is called ABC ALD
chemistry, where instead of two half-reactions, a third reaction is used in between the regular
two half-reactions. This third reaction does not interfere with the species stabilized by ligands
from the first reaction, and can instead be used to build up material around the catalyst particles
to stabilize them. Lu et al. found that these “walls” created around Pd-ALD catalysts stabilized
the particles during synthesis to 1 nm in diameter or less; however, no substantial evidence was
presented to show that these structures prevent sintering at high temperatures or reaction
conditions.
Molecular layer deposition is another stabilization technique similar to ALD’s self-
limiting, controllable properties, but instead of depositing atomic layers of metal oxides, MLD
deposits metal-organic polymer layers composed of molecules (not atoms) from each complete
cycle. Once the desired number of cycles are deposited, the MLD layer is calcined (or water-
etched) to remove the polymeric components, leaving behind a porous alumina layer. The
simplest form of MLD involves two half-reactions, much like ALD, and the work demonstrated
by the Weimer group focused on aluminum alkoxide (i.e., alucone) MLD.[75, 76] This reaction
typically uses TMA and ethylene glycol as the two reagents to create the polymeric hybrid film,
which when calcined produced a porous inorganic layer with 0.6-nm diameter pores. Liang et al.
used these MLD layers to stabilize Pt-ALD particles on SiO2 by depositing 10, 20, 30, and 40
MLD layers.[76] Active metal surface area was partially covered by the MLD layers, but was
similar for the 20, 30, and 40-cycle samples at room temperature and 673 K. When they held the
catalysts at 873 K to cause sintering, the MLD-modified catalysts had similar active metal
surface areas. When the catalysts were sintered at 1073 K, the sample with the thickest MLD
layer (40 MLD cycles) had the smallest amount of sintering (11% active surface area loss)

17
compared to the 34% loss for the 30-cycle sample or the 69% loss for the 10-cycle sample. A
schematic depicting this coating is shown in Figure 1.8.
Figure 1.8 Schematic of supported Pt catalyst nanopartilces: (a) uncoated, as deposited by ALD,
(b) Pt particles coated by hybrid polymer-inorganic MLD, then calcined to form stabilizing
porous alumina layer.[75]
The catalytic activity for CO oxidation on these Pt catalysts was decreased by the
addition of MLD layers. This decrease in activity was attributed to mass transfer limitations
from the 0.6-nm pores. A new type of alucone MLD using three components (ABC MLD) was
reported by Yoon et al. and still had self-limiting conformal film growth like AB MLD.[77] In
this approach, the three reagents are TMA, ethyl amine (EA), and maleic anhydride (MA). Each
component undergoes a self-limiting reaction, as shown in Figure 1.9,[77] to form a longer
polymeric chain than the AB alkoxide MLD.
18
Figure 1.9: ABC alucone MLD reaction scheme. A: TMA reacts on the OH groups of the
support or the previous MLD layer in the “A” dose; B: EA reacts with methyl groups from the
first step; C: MA reacts with the amine groups from the second step to form a metal-organic
polymer layer, and regenerates OH functionality for additional ABC cycles.[77]
Liang et al. showed that after removal of the organic portion of these layers, the pores are
0.8-nm diameter.[75] These pores should mitigate mass-transfer issues for reactions of small
molecules, but the ABC MLD layers were not previously tested for sintering prevention or on
any catalyst system to gauge the effect of the MLD layer on activity.
A
B
C
19
1.8 Thesis Objectives
This thesis aims to demonstrate and understand the advantages of synthesizing
nanostructured supported catalysts via atomic layer deposition (ALD). The catalytic systems
under investigation are Al2O3-supported Ni, Pt, and NiPt bimetallic catalysts synthesized mainly
by H2 ALD. The catalysts synthesized in this work are among the smallest supported
nanoparticles ever reported, and are in the size range where nanoscale effects can drastically
change reaction activity and selectivity.[26-28, 30] Increased reaction selectivity can arise from
specific sites (such as step edges or other lower-coordinated atoms) on the catalyst surface, and
increased catalytic activity can come from higher fractional exposure of metal atoms on the
nanoparticle surface.
This work has successfully synthesized Ni nanoparticles by ALD, and demonstrated that
these particles are sufficiently small to exhibit catalytic enhancements based on the nanoscale
features of the metal. As an extension of Ni nanoparticle ALD with H2, we hypothesized that
using H2 as the second half-cycle reagent alters the Pt ALD mechanism and particle size
compared to traditional Pt ALD with O2. By combining the two metal ALD chemistries,
nanoscale bimetallic catalysts were created and showed enhanced activity and coking resistance
during DRM. Additionally, we hypothesized that nanoscale effects can be enhanced and
maintained in harsh industrially-relevant conditions by modifying the Ni nanoparticles with Pt
ALD and further with a stabilizing alumina MLD layer. This thesis aims to explore the
synthesis, modification, and performance of these ALD catalysts through four specific
objectives:
20
1 Synthesize supported Ni nanoparticles by ALD to enhance hydrogenolysis selectivity.
This work demonstrates the first non-noble metal ALD of nanoparticles by depositing Ni
with NiCp2 and H2 reagents. The particle size and Ni weight loading deposited varied with the
number of ALD cycles performed, and the Ni ALD was able to achieve relatively small particles
for such high weight loadings. The small Ni particles had an increased number of step-edges on
their surfaces, which correlated with increased hydrogenolysis selectivity and activity.
2 Investigate the effects of varying Pt ALD second half-reaction chemistries on the ALD
mechanism, nanoparticle size, nanoscale features, and ODHP selectivity.
In contrast to Ni ALD, Pt nanoparticles can be synthesized via ALD using either O2 or H2
as the secondary reagent. This work aims to understand some of the mechanistic differences
associated with the two reaction chemistries of Pt ALD by monitoring the support OH
concentration via in situ IR during the ALD process. Additionally, the differences in
nanoparticle size as a function of chemistry and number of cycles were analyzed. The surface
structures of the catalysts were probed through CO adsorption and analysis by TPD or CO
DRIFTS. The catalysts were evaluated for selectivity of propane oxidative dehydrogenation
(ODH), which is known to take place on low coordination number (CN = 4) Pt atoms.[52] These
Pt ALD particles are among some of the smallest ever synthesized with a feasibly scalable
technique and bridge the gap of controlled molecular-beam deposited clusters and actual
supported Pt clusters.
3 Modify Ni ALD particles with Pt ALD to enhance both activity and stability during dry
reforming of methane.
This study aims to evaluate Ni ALD and NiPt catalysts for DRM activity. Ni ALD
monometallic catalysts have high surface areas per gram of metal, and are sufficiently small to

21
limit the deactivation of the catalyst due to coking. Long term stability of these catalysts and the
degree of coke build-up compared to normal incipient wetness Ni catalysts was investigated.
Bimetallic catalysts were created by coating the Ni ALD catalysts with Pt ALD to improve DRM
performance. The Pt addition enhanced both activity and coking resistance of the Ni
nanoparticles.
4 Modify Ni and NiPt ALD particles with stabilizing Al2O3 MLD layers to enhance
activity and resistance to coking by reducing sintering during dry reforming of
methane.
This work focused on demonstrating the potential of MLD to minimize sintering, thereby
retaining the nanoscale advantages of these catalyst nanoparticles. The catalysts were
intentionally tested under extremely harsh conditions (DRM at 973 K) to show the maximum
benefit of the MLD layers under conditions that readily sinter and deactivate catalysts. Porous
alumina stabilizing layers were added to the Ni and NiPt ALD catalysts by depositing alucone
ABC MLD, then calcining the layers to form porous alumina. Stability studies, catalyst
characterization techniques such as chemisorption, TEM, and coke formation measurements
were performed. The effectiveness of these stabilizing layers on reducing sintering and
maintaining high DRM rates was found to vary with the number of MLD cycles, but the
sintering was reduced in all cases. The MLD layers on the Ni catalysts were more effective at
maintaining a high DRM rate than the NiPt catalysts.
22
1.9 References
[1] D.W. Wolfe, Tales from the underground: a natural history of subterranean life, Basic Books,
2001.
[2] J.N. Armor, Catalysis Today 163 (2011) 3-9.
[3] C.N. Satterfield, Heterogeneous catalysis in practice, McGraw-Hill New York, 1980.
[4] J. Weitkamp, Solid State Ionics 131 (2000) 175-188.
[5] R.P.H. Gasser, G. Ehrlich, Physics Today 40 (1987) 128.
[6] G.A. Somorjai, H. Frei, J.Y. Park, Journal of the American Chemical Society 131 (2009)
16589-16605.
[7] H. Bengaard, J.K. Nørskov, J. Sehested, B.S. Clausen, L.P. Nielsen, A.M. Molenbroek, J.R.
Rostrup-Nielsen, Journal of Catalysis 209 (2002) 365-384.
[8] S. Alayoglu, A.U. Nilekar, M. Mavrikakis, B. Eichhorn, Nat Mater 7 (2008) 333-338.
[9] M. Mavrikakis, P. Stoltze, J.K. Nørskov, Catalysis Letters 64 (2000) 101-106.
[10] M.T. Schaal, M.P. Hyman, M. Rangan, S. Ma, C.T. Williams, J.R. Monnier, J.W. Medlin,
Surface Science 603 (2009) 690-696.
[11] B.K. Teo, EXAFS: basic principles and data analysis, Springer-Verlag Berlin, 1986.
[12] D. Koningsberger, R. Prins, (1987).
[13] B.J. Kip, F.B.M. Duivenvoorden, D.C. Koningsberger, R. Prins, Journal of Catalysis 105
(1987) 26-38.
[14] J.F. Watts, J. Wolstenholme, An Introduction to Surface Analysis by XPS and AES, by John
F. Watts, John Wolstenholme, pp. 224. ISBN 0-470-84713-1. Wiley-VCH, May 2003. 1 (2003).
[15] W. Setthapun, W.D. Williams, S.M. Kim, H. Feng, J.W. Elam, F.A. Rabuffetti, K.R.
Poeppelmeier, P.C. Stair, E.A. Stach, F.H. Ribeiro, J.T. Miller, C.L. Marshall, The Journal of
Physical Chemistry C 114 (2010) 9758-9771.
[16] W. Kessels, H. Knoops, S. Dielissen, A. Mackus, M. van de Sanden, Applied Physics
Letters 95 (2009) 013114-013114-013113.
[17] G.A. Somorjai, R.L. York, D. Butcher, J.Y. Park, Physical Chemistry Chemical Physics 9
(2007) 3500-3513.
[18] B. Hammer, J.K. Nørskov, H.K. Bruce C. Gates, Theoretical surface science and catalysis -
calculations and concepts, in: Advances in Catalysis, Academic Press, 2000, pp. 71-129.
[19] J.K. Nørskov, T. Bligaard, A. Logadottir, S. Bahn, L.B. Hansen, M. Bollinger, H. Bengaard,
B. Hammer, Z. Sljivancanin, M. Mavrikakis, Y. Xu, S. Dahl, C.J.H. Jacobsen, Journal of
Catalysis 209 (2002) 275-278.
[20] M.M. Montemore, J.W. Medlin, The Journal of Physical Chemistry C 117 (2013) 20078-
20088.
[21] G. Jones, J.G. Jakobsen, S.S. Shim, J. Kleis, M.P. Andersson, J. Rossmeisl, F. Abild-
Pedersen, T. Bligaard, S. Helveg, B. Hinnemann, J.R. Rostrup-Nielsen, I. Chorkendorff, J.
Sehested, J.K. Nørskov, Journal of Catalysis 259 (2008) 147-160.
[22] J. Greeley, M. Mavrikakis, Nature materials 3 (2004) 810-815.
[23] G.A. Somorjai, Y. Li, Introduction to surface chemistry and catalysis, John Wiley & Sons,
2010.
[24] I. Chorkendorff, J.W. Niemantsverdriet, Concepts of modern catalysis and kinetics, Wiley.
com, 2006.
[25] Current Metal Prices, in, Prospecting and Mining Journal, 2013.
[26] G.C. Bond, Surface Science 156, Part 2 (1985) 966-981.
23
[27] R.A. Van Santen, Accounts of Chemical Research 42 (2008) 57-66.
[28] R.V. Hardeveld, F. Hartog, Advances in Catalysis 22 (1972) 75-110.
[29] R. Van Hardeveld, A. Van Montfoort, Surface Science 4 (1966) 396-430.
[30] G.C. Bond, Chemical Society Reviews 20 (1991) 441-475.
[31] F. Abild-Pedersen, J. Greeley, J. Nørskov, Catalysis Letters 105 (2005) 9-13.
[32] F. Studt, F. Abild-Pedersen, T. Bligaard, R.Z. Sørensen, C.H. Christensen, J.K. Nørskov,
Science 320 (2008) 1320-1322.
[33] Y. Li, G.A. Somorjai, Nano Letters 10 (2010) 2289-2295.
[34] K.R. Kahsar, D.K. Schwartz, J.W. Medlin, Journal of the American Chemical Society
(2013).
[35] P. Gallezot, D. Richard, Catalysis Reviews 40 (1998) 81-126.
[36] J.R. Rostrup-Nielsen, J. Sehested, J.K. Nørskov, Hydrogen and synthesis gas by steam- and
C02 reforming, in: Advances in Catalysis, Academic Press, 2002, pp. 65-139.
[37] S. Wang, G.Q. Lu, G.J. Millar, Energy & Fuels 10 (1996) 896-904.
[38] J.H. Edwards, A.M. Maitra, Fuel Processing Technology 42 (1995) 269-289.
[39] Natural Gas Reforming, in: U.S.D.o. Energy (Ed.), U.S. Department of Energy, 2013.
[40] J. Sehested, Catalysis Today 111 (2006) 103-110.
[41] J. Sehested, Journal of Catalysis 217 (2003) 417-426.
[42] M. Gharibi, F.T. Zangeneh, F. Yaripour, S. Sahebdelfar, Applied Catalysis A: General 443-
444 (2012) 8-26.
[43] M. García-Diéguez, I.S. Pieta, M.C. Herrera, M.A. Larrubia, L.J. Alemany, Applied
Catalysis A: General 377 (2010) 191-199.
[44] M. García-Diéguez, E. Finocchio, M.Á. Larrubia, L.J. Alemany, G. Busca, Journal of
Catalysis 274 (2010) 11-20.
[45] S.R. de Miguel, I.M.J. Vilella, S.P. Maina, D.S. José-Alonso, M.C. Román-Martínez, M.J.
Illán-Gómez, Applied Catalysis A: General (2012).
[46] D. Li, Y. Nakagawa, K. Tomishige, Applied Catalysis A: General 408 (2011) 1-24.
[47] B. Pawelec, S. Damyanova, K. Arishtirova, J.L.G. Fierro, L. Petrov, Applied Catalysis A:
General 323 (2007) 188-201.
[48] E.L. Hu, S.M. Davis, R. Davis, E. Scher, Applications: Catalysis by Nanostructured
Materials: Nanotechnology Research Directions for Societal Needs in 2020, in, Springer
Netherlands, 2011, pp. 445-466.
[49] Ceresana, Market Study: Propylene (UC-1705), in, Ceresana, 2011.
[50] F. Cavani, N. Ballarini, A. Cericola, Catalysis Today 127 (2007) 113-131.
[51] B. Silberova, M. Fathi, A. Holmen, Applied Catalysis A: General 276 (2004) 17-28.
[52] S. Vajda, M.J. Pellin, J.P. Greeley, C.L. Marshall, L.A. Curtiss, G.A. Ballentine, J.W. Elam,
S. Catillon-Mucherie, P.C. Redfern, F. Mehmood, P. Zapol, Nat Mater 8 (2009) 213-216.
[53] S.M. George, Polymer 1550 (2012) 125.
[54] R.L. Puurunen, Journal of applied physics 97 (2005) 121301-121301-121352.
[55] D.M. King, J.A. Spencer Ii, X. Liang, L.F. Hakim, A.W. Weimer, Surface and Coatings
Technology 201 (2007) 9163-9171.
[56] J. Elam, D. Routkevitch, P. Mardilovich, S. George, Chemistry of Materials 15 (2003)
3507-3517.
[57] D.M. King, X. Liang, A.W. Weimer, Powder Technology 221 (2012) 13-25.
[58] T. Aaltonen, M. Ritala, T. Sajavaara, J. Keinonen, M. Leskela¨, Chemistry of Materials 15
(2003) 1924-1928.

24
[59] J. Li, X. Liang, D.M. King, Y.-B. Jiang, A.W. Weimer, Applied Catalysis B: Environmental
97 (2010) 220-226.
[60] X. Liang, L. Lyon, Y.-B. Jiang, A. Weimer, Journal of Nanoparticle Research 14 (2012) 1-
12.
[61] S.T. Christensen, H. Feng, J.L. Libera, N. Guo, J.T. Miller, P.C. Stair, J.W. Elam, Nano
Letters 10 (2010) 3047-3051.
[62] Y. Lei, B. Liu, J. Lu, R.J. Lobo-Lapidus, T. Wu, H. Feng, X. Xia, A.U. Mane, J.A. Libera,
J.P. Greeley, J.T. Miller, J.W. Elam, Chemistry of Materials 24 (2012) 3525-3533.
[63] P. Stair, Topics in Catalysis 55 (2012) 93-98.
[64] B.S. Lim, A. Rahtu, R.G. Gordon, Nat Mater 2 (2003) 749-754.
[65] T.D. Gould, A.M. Lubers, B.T. Neltner, J.V. Carrier, A.W. Weimer, J.L. Falconer, J. Will
Medlin, Journal of Catalysis 303 (2013) 9-15.
[66] A.J.M. Mackus, N. Leick, L. Baker, W.M.M. Kessels, Chemistry of Materials 24 (2012)
1752-1761.
[67] H. Feng, J.A. Libera, P.C. Stair, J.T. Miller, J.W. Elam, ACS Catalysis 1 (2011) 665-673.
[68] J. Lu, P.C. Stair, Angewandte Chemie International Edition 49 (2010) 2547-2551.
[69] Y. Zhou, C.L. Muhich, B.T. Neltner, A.W. Weimer, C.B. Musgrave, The Journal of
Physical Chemistry C 116 (2012) 12114-12123.
[70] N. Aaron Deskins, D. Mei, M. Dupuis, Surface Science 603 (2009) 2793-2807.
[71] M. Corral Valero, P. Raybaud, P. Sautet, The Journal of Physical Chemistry B 110 (2006)
1759-1767.
[72] C.H. Bartholomew, Applied Catalysis A: General 107 (1993) 1-57.
[73] C.H. Bartholomew, Applied Catalysis A: General 212 (2001) 17-60.
[74] J. Lu, B. Fu, M.C. Kung, G. Xiao, J.W. Elam, H.H. Kung, P.C. Stair, Science 335 (2012)
1205-1208.
[75] X. Liang, B. W Evanko, A. Izar, D. M King, Y.-B. Jiang, A.W. Weimer, Microporous and
Mesoporous Materials (2012).
[76] X. Liang, J. Li, M. Yu, C.N. McMurray, J.L. Falconer, A.W. Weimer, ACS Catalysis 1
(2011) 1162-1165.
[77] B. Yoon, D. Seghete, A.S. Cavanagh, S.M. George, Chemistry of Materials 21 (2009) 5365-
5374.
25
Chapter 2: Synthesis of Supported Ni Catalysts by Atomic Layer Deposition
As accepted by Journal of Catalysis (July 2013)
2.1 Abstract
Nickel nanoparticles grown on an Al2O3 support by atomic layer deposition (ALD) had
higher selectivity for propylene hydrogenolysis. The Ni was deposited in a fluidized bed reactor
with bis(cyclopentyldienyl)Ni and H2 reactants. Varying the number of ALD cycles varied the
Ni loading between 4.7 - 16.8 wt% and the average Ni particle diameters between 2.4 - 3.3 nm.
The number of surface sites per gram of Ni, determined from CO TPD, was at least five times
higher on ALD-prepared catalysts than typical Ni/Al2O3 catalysts prepared by incipient wetness
impregnation. The fraction of CO desorbed from steps and kinks on the ALD-prepared catalysts
was at least three times higher. Correspondingly, the selectivity for propylene hydrogenolysis,
instead of hydrogenation, was above 10% on an ALD-prepared catalyst but below 0.4% on the
incipient wetness catalyst. Preparing catalysts by ALD appeared to increase the step and kink
site density and thus increase hydrogenolysis selectivity.
2.2 Introduction
To meet the demand for high performance catalysts in the petroleum and biofuels
industries, efforts have increased to rationally design and synthesize catalysts that enhance
selectivity, activity, and/or robustness.[1-3] Catalytic performance can be enhanced by
designing catalysts based on theory of highly idealized structures, including fundamental ultra
high vacuum (UHV) studies of single crystals,[4-7] and DFT modeling of nanoclusters with
nanoscale and bimetallic features.[8-10] For example, Hang et al. used DFT and STEM to
elucidate how step edges on a Ni(211) surface enhance ethylene hydrogenolysis compared to a
Ni(111) surface.[10, 11] Designing catalysts with nanoscale features can improve activity and
26
selectivity by increasing uncoordinated surface sites and defects. [11-13]
Not only do
nanostructured catalysts have high activity per gram of metal because they have higher
dispersions, but the inherent nanoscale features can also allow catalysts to have different
turnover frequencies or selectivities than bulk materials.[12, 14-16] In the case of structure
sensitive reactions such as hydrogenolysis, enhancements in selectivity can arise from both
electronic effects and ensemble size effects as the metal particles become smaller.[17, 18]
Although understanding the catalytic properties of nanoparticles has improved, a gap still
exists between studies on model systems and synthesizing nanoscale heterogeneous catalysts
with enhanced performance. In many nanotechnology applications, one large barrier to
implementation is converting the technology to a large-scale, reliable process.[12] Most
nanoparticle synthesis techniques that can achieve supported catalyst particles with diameters of
2 to 3 nm involve solution-based particle growth, often with hazardous solvents, reducing agents,
or capping agents. Additional steps necessary to deposit the particles are photodegradation,
polyol deposition, or multi-step processes of impregnation, exchange or anchoring the particles
to the support, followed by calcination and reduction.[19-21] This issue of scalability can be
addressed by utilizing atomic layer deposition (ALD) as a gas-phase technique in a fluidized bed
reactor (FBR) to synthesize high-performance nanoparticle catalysts directly on the support.[22]
Atomic layer deposition is similar to chemical vapor deposition, except that the two reactants are
dosed in two “half reactions” or “half cycles” to allow for a site specific reaction with the first
reactant, followed by a second reaction to achieve the desired material deposition.[23]
Deposition of noble metal nanoparticles of Pt, Ru and Pd on several metal oxide supports
by ALD has been demonstrated by using a variety of cyclopentyldienyl-based metal precursors
for Pt and Ru and a hexafluoroacetylacetonate precursor for Pd.[24-27] Depositing noble metals
27
with less than 10 ALD cycles produces clusters with diameters less than 2 nm and high
dispersions (0.40 – 0.90).[24-26] The ALD process yields exceptionally small nanoparticles that
can be stabilized by modification with other materials such as porous alumina ALD over-layers
to prevent coking or sintering.[28, 29] During metal ALD, oxygen is typically used as the
reagent of the second half reaction for Pt, Ru, and most other ALD cycles that use
cyclopentadienyl organometallic precursors. Atomic layer deposition with O2 leads to
nanoparticle deposition of the noble metals,[30] but for other transition metals such as Co, Fe,
and Ni, only metal oxide films deposit using O2 or ozone as the second precursor.[31-34]
Metallic films have been synthesized using O2 as the second precursor with Ni organometallic
precursors, but only by reducing the deposited metal oxide film with H2 or H radicals.[23]
Reducing agents as the second reactant have only been demonstrated with noble metals and
copper, or to create thick metallic films.[35, 36]
In the present work, we demonstrate how ALD provides a scalable avenue for producing
supported Ni nanoparticles of specific sizes with nanostructures necessary for higher
hydrogenolysis selectivities and activities. Varying the number of ALD cycles deposited
nanoparticles with different physical and chemical properties. The mass and size of particles
deposited were measured via inductively coupled plasma mass spectroscopy (ICP-MS) and
transmission electron microscopy (TEM). Temperature-programmed desorption (TPD) of CO
was performed to validate active site calculations based on particle size and to elucidate any
differences in CO desorption modes between the catalysts. Propylene hydrogenation and
hydrogenolysis rates were measured to evaluate activity and selectivity advantages of preparing
catalyst nanoparticles via ALD.
28
2.3 Materials and Methods
2.3.1 Nickel ALD Catalyst Preparation
Nickel was deposited on alumina particles by first reacting bis(cyclopentadienyl)nickel
(NiCp2) in a N2 carrier gas with alumina, and then reacting 20% H2 (balance Ar) with the
organometallic molecules bound to the surface. The solid NiCp2 precursor was loaded into a
stainless steel vessel, which was purged with N2 and then held at 365 K to control the precursor
vapor pressure.
Varying numbers of cycles were used on separate batches of the support, which was
either a porous alumina powder (Albemarle MARTOXID AN/I) or a non-porous alumina
powder with nanospheres less than 50 nm in diameter (Aldrich 544833 gamma alumina, ~40m2/g
BET surface area). Thermogravimetric analysis, similar to the method proposed by Rigney et
al.[37], was used to estimate the OH surface density of the gamma alumina nanospheres on a
Netzsch STA 449 F1 Jupiter thermogravimetric analyzer. The alumina sample was heated at a
ramp rate of 10 K/min from room temperature to 1273 K in a flow of 100 sccm Ar in order to
remove both adsorbed water and surface hydroxyl groups. The weight loss after 673 K was
attributed to OH removal via water desorption. This temperature cutoff was determined by an
inflection in the derivative of weight loss and because liquid water is known to be mostly
removed by heating at 673 K.[38]
All ALD reactions were monitored in situ by mass spectrometry (Stanford Research
Systems QMS 200) and took place at 573 K at approximately 0.1 Pa in a vertical fluidized bed
reactor system, which is described in detail elsewhere.[22] The support was degassed overnight
in the reactor under a N2 flow of 5 sccm, and all carrier gas and reagent gas streams were set to 5
sccm, resulting in a bed space velocity of 0.73 h-1
. Mass spectrometry scans from 1-200 m/z
29
revealed species correlated to the ALD reaction as 28 (N2), 44 (CO2), 40 (C3 fragment), 66
(cyclopentadiene, Cp), 187 and 188 (NiCp2) for the first half reaction, and 66 (C5H6), 2 (H2), and
16 (CH4) for the second half reaction. Breakthrough of NiCp2 occurred for all cycles with dose
times ranging from 5 min to 2 h for up to 1 g of support. The ALD-synthesized catalysts were
compared to a Ni catalyst (8 wt% Ni) prepared by incipient wetness (IW). The catalyst was
prepared by dissolving Ni(NO3)2· 6H2O in deionized water, adding the 0.67 g Ni(NO3)2 / L
solution to the porous Al2O3 support (Saint Gobian SA 63158 with a pore volume of 0.64 g/cm3),
drying the catalyst at 383 K for 2 h, then increasing the temperature at approximately 10 K/min
to 823 K and calcining at 823 K for 6 h. The catalyst was then reduced for 3 h at 623 K in pure
H2.
2.3.2 Catalyst Characterization
Nickel, aluminum, and impurity silicon content were measured using inductively coupled
plasma mass spectroscopy (ICP-MS). The catalysts were digested in a HF/aqua regia solution
for at least 24 h before analysis. Transmission electron microscopy (TEM) images of the catalyst
particles were obtained using a Philips CM-100 microscope. Powder samples were embedded in
epoxy, cured at 333 K for two days, and cross sectioned using a Leica UC6 Ultramicrotome to
thicknesses of 50-70 nm. High resolution transmission electron microscopy (HRTEM) images
were obtained using a JEOL 2010 FEG (Field Emission Gun) Analytical Electron Microscope at
the MIT SEF (shared experimental facility), using the Orius CCD. Samples were prepared for
the HRTEM using epoxy-embedded cross-sections or by dropping powders suspended in
isopropanol onto holey carbon grids and wicking away the excess liquid to deposit the particles
on the grid. Due to the difficulty in distinguishing the smaller and less densely populated
particles of 1 and 5 ALD cycles, Al2O3 nanospheres were used to facilitate imaging the Ni
30
particles, whereas the 15 ALD cycle sample was imaged on a porous Al2O3 substrate. Nickel
particle diameters were measured via NIST ImageJ software with the HRTEM and TEM images.
2.3.3 Reactor Studies/ CO TPD
A differential reactor composed of a 6.35-mm ID quartz tube in a temperature-controlled
furnace was used to measure reaction kinetics and carry out temperature-programmed desorption
(TPD). Reactor feed and effluent were analyzed on a SRS-RGA200 mass spectrometer. All
catalysts were reduced at 573 K in 20% H2 (balance Ar) for 2 h before exposure to reaction
conditions. Hydrogenation and hydrogenolysis were monitored at temperatures from 323 K to
573 K at flows of 10/40/50 sccm of C3H6/H2/Ar. Less than 10 mg of catalyst powder was mixed
with inert zirconia to a total bed weight of 500 mg. Propylene was used as a probe molecule to
screen for hydrogenation and hydrogenolysis rates. Turnover frequencies (TOF) were calculated
using the rate of product formation (after reaching steady state values) and the number of metal
surface sites determined by CO TPD.
For TPD, 100-300 mg of catalyst were loaded into the quartz tube and then reduced in
20% H2 for 2 h at 573 K, purged with Ar, and cooled for 2 h to room temperature. Carbon
monoxide was adsorbed to saturation from a stream of 20% CO (balance Ar) at room
temperature at a flow rate of 100 sccm for 10 min. The temperature was increased from room
temperature to 798 K at approximately 100 K/min in a sweep gas of 25 to 50 sccm Ar.
2.4 Results and Discussion
2.4.1 Preparation of Ni Metal Nanoparticles via ALD with H2
The Ni nanoparticles were deposited on alumina while effluent gas from the FBR was
monitored via mass spectrometry. Figure 2.10a shows in situ mass spectrometry signals for the

31
first ALD half-reaction, and Scheme 2.1 shows a surface reaction mechanism consistent with
experimental observations. Immediately following the introduction of the precursor, the signal
for the Cp ring m/z=66 increased, indicating cleavage of the ring during the deposition reaction.
A fraction of the organic ligands from the Cp groups were also oxidized to CO2, likely because
of contaminant O2 in the reactor streams or O2 adsorbed on previously deposited metal within the
reactor. We propose that the O-H bond of a surface hydroxyl group was replaced by an O-Ni
bond when the NiCp2 precursor reacted with the surface OH groups, much like the replacement
of the O-H bond with a O-Pt bond, detected by in-situ XAFS of Pt ALD.[39] As discussed
below, this first reaction step also left species bound to the Ni atoms in the form of Cp groups
and possibly other carbonaceous fragments, which are similar to those determined from in situ
gasphase infra-red analysis and detected by x-ray adsorption techniques during the first step of
Pt ALD.[30, 39]
Scheme 2.1. Reaction scheme for first ALD half reaction in which the NiCp2 precursor reacts
with surface OH.
The intact NiCp2 precursor appeared in the reactor effluent after 5 min, indicating that the
available surface sites were beginning to saturate. The Cp ring signal decreased simultaneously,
but at a slower rate because the Cp ring adsorbed and desorbed throughout the reactor and the
lines to the mass spectrometer. The slower rate of removal of the Cp ring was indicated by the
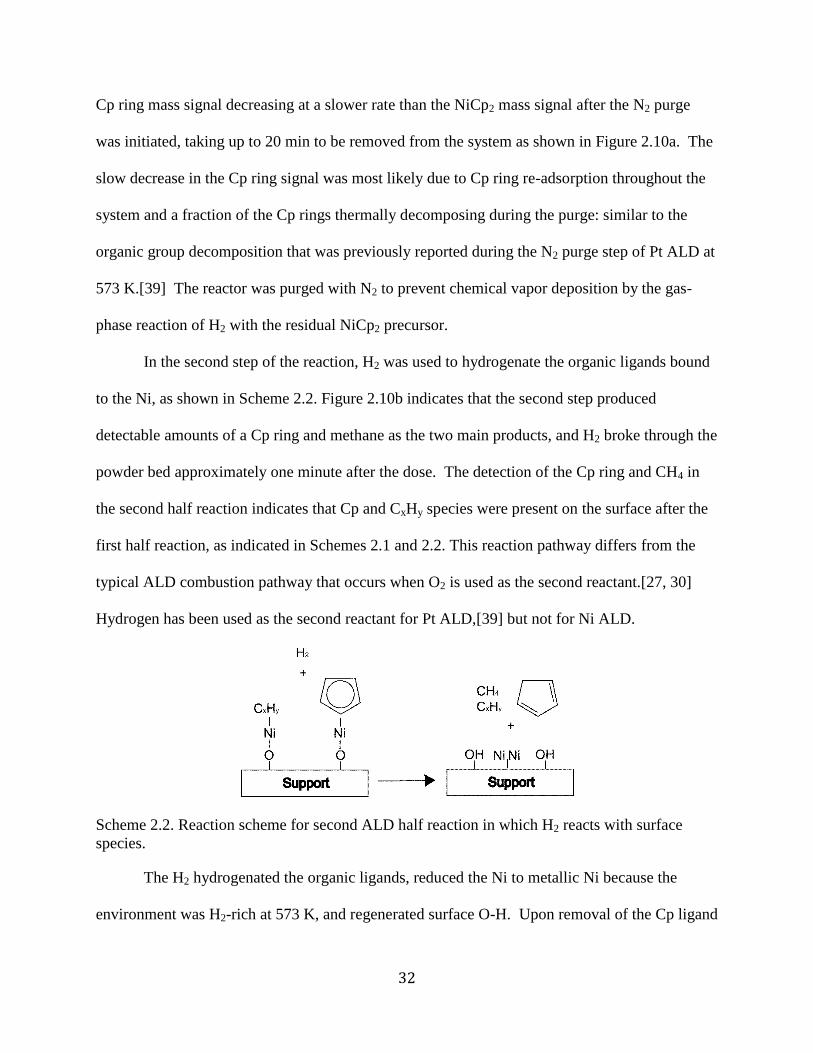
32
Cp ring mass signal decreasing at a slower rate than the NiCp2 mass signal after the N2 purge
was initiated, taking up to 20 min to be removed from the system as shown in Figure 2.10a. The
slow decrease in the Cp ring signal was most likely due to Cp ring re-adsorption throughout the
system and a fraction of the Cp rings thermally decomposing during the purge: similar to the
organic group decomposition that was previously reported during the N2 purge step of Pt ALD at
573 K.[39] The reactor was purged with N2 to prevent chemical vapor deposition by the gas-
phase reaction of H2 with the residual NiCp2 precursor.
In the second step of the reaction, H2 was used to hydrogenate the organic ligands bound
to the Ni, as shown in Scheme 2.2. Figure 2.10b indicates that the second step produced
detectable amounts of a Cp ring and methane as the two main products, and H2 broke through the
powder bed approximately one minute after the dose. The detection of the Cp ring and CH4 in
the second half reaction indicates that Cp and CxHy species were present on the surface after the
first half reaction, as indicated in Schemes 2.1 and 2.2. This reaction pathway differs from the
typical ALD combustion pathway that occurs when O2 is used as the second reactant.[27, 30]
Hydrogen has been used as the second reactant for Pt ALD,[39] but not for Ni ALD.
Scheme 2.2. Reaction scheme for second ALD half reaction in which H2 reacts with surface
species.
The H2 hydrogenated the organic ligands, reduced the Ni to metallic Ni because the
environment was H2-rich at 573 K, and regenerated surface O-H. Upon removal of the Cp ligand
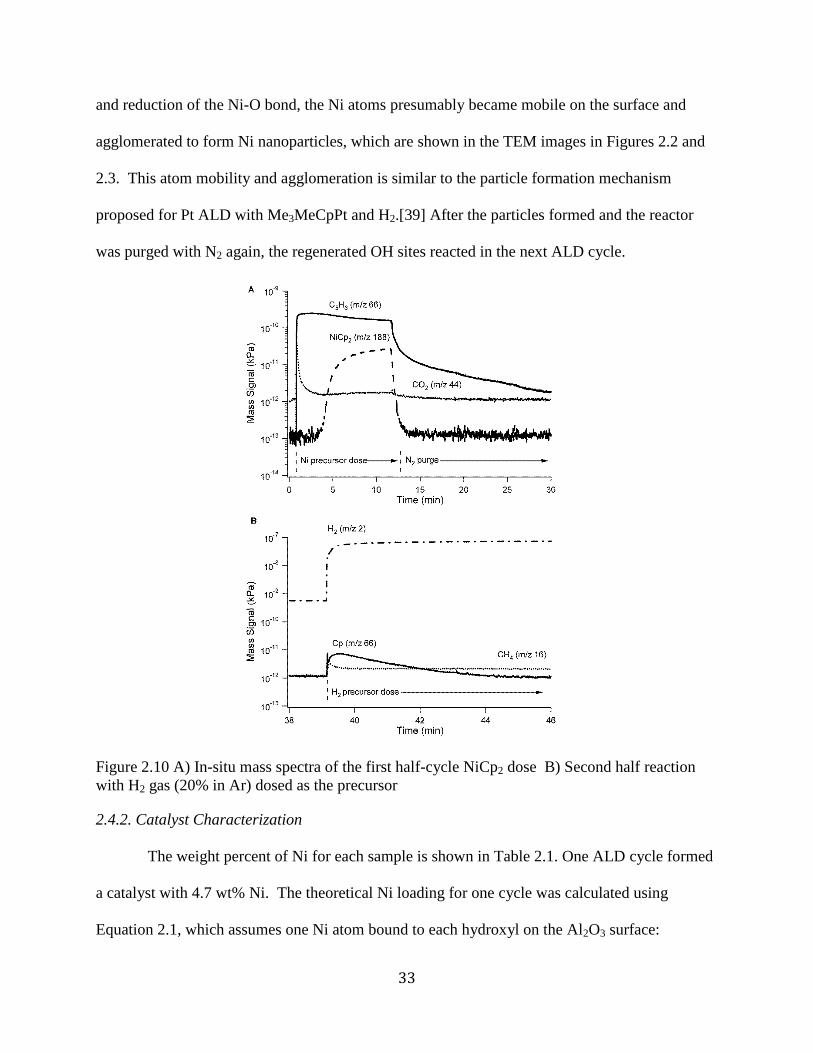
33
and reduction of the Ni-O bond, the Ni atoms presumably became mobile on the surface and
agglomerated to form Ni nanoparticles, which are shown in the TEM images in Figures 2.2 and
2.3. This atom mobility and agglomeration is similar to the particle formation mechanism
proposed for Pt ALD with Me3MeCpPt and H2.[39] After the particles formed and the reactor
was purged with N2 again, the regenerated OH sites reacted in the next ALD cycle.
Figure 2.10 A) In-situ mass spectra of the first half-cycle NiCp2 dose B) Second half reaction
with H2 gas (20% in Ar) dosed as the precursor
2.4.2. Catalyst Characterization
The weight percent of Ni for each sample is shown in Table 2.1. One ALD cycle formed
a catalyst with 4.7 wt% Ni. The theoretical Ni loading for one cycle was calculated using
Equation 2.1, which assumes one Ni atom bound to each hydroxyl on the Al2O3 surface:

34
(2.1)
where L is the theoretical weight loading of Ni for one ALD cycle, MW is the molecular weight
of Ni, ρOH is the OH density on the Al2O3 surface, SAAl2O3 is the specific surface area of the
Al2O3, and A is Avogadro’s number. The hydroxyl surface density of the alumina nanospheres
estimated by thermogravimetric analysis, was 12.6 OH/nm2, which is similar to the value of 14
+/- 0.5 reported by an extensive IR-deuterium exchange study by Baumgarten et al.. [40] Using
12.6 OH/nm2
and a measured BET surface area of 37.7 m2/g in Equation 1 yield a theoretical
weight loading of 4.63 wt%. Since this value is nearly identical to the measured weight loading,
most of the OH groups likely reacted with NiCp2 molecules during the first ALD cycle.[41]
Subsequent ALD cycles had a lower growth rate per cycle, most likely because reactive hydroxyl
sites were depleted on the support.
After each ALD cycle, the newly-deposited Ni atoms coalesced into approximately 3-nm
particle sizes or diffused to existing particles. Although some of the initial surface sites were
regenerated for subsequent ALD cycles, the deposited nanoparticles physically blocked a
significant portion of the original sites. The percentage of Al2O3 surface area covered by Ni
particles was estimated at approximately 18% for the 1-cycle sample by using the average
particle diameter and weight loading to determine the cross-sectional area of all the particles
deposited. In addition to Ni depositing at a lower rate per cycle, Figure 2.2 shows that the
average particle size obtained from TEM images did not increase much as the number of ALD
cycles increased on both the porous and nanosphere supports.

35
Figure 2.2. TEM and HRTEM images of Ni/Al2O3 catalysts prepared by 1 (A), 5 (B), and 15 (C)
ALD cycles
The nanoparticles in the center of the HRTEM images appeared spherical, which would
imply a particle height-to-diameter ratio of 1. The images near the nanosphere support edges,
however, show that the particles were disc-like, with a height-to-diameter ratio of approximately
0.5. The surface area per gram of a disc-like particle is higher than that of a sphere of the same
diameter, and the surface area can be adjusted with a shape correction factor α that is dependent
on the height-to-diameter ratio of the particles.[42] Calculations that incorporated particle
morphology (e.g., active surface area in Equation 2.2) were adjusted by a shape correction factor
of 1.20.[42] A HRTEM scan of the porous Al2O3 support with Ni deposited by 15 ALD cycles
(Fig. 3) showed that Ni deposited throughout the support. The average ALD nanoparticle sizes
(2.4 – 3.3 nm) were comparable to the smallest alumina-supported Ni nanoparticles previously
reported (2.9 nm for 2.3% Ni weight loading),[43] but the weight loadings of the ALD particles
were 2 to 8 times higher. To our knowledge, these are the smallest Ni particles on alumina
supports for Ni weight loadings of 4.7-16.5%.
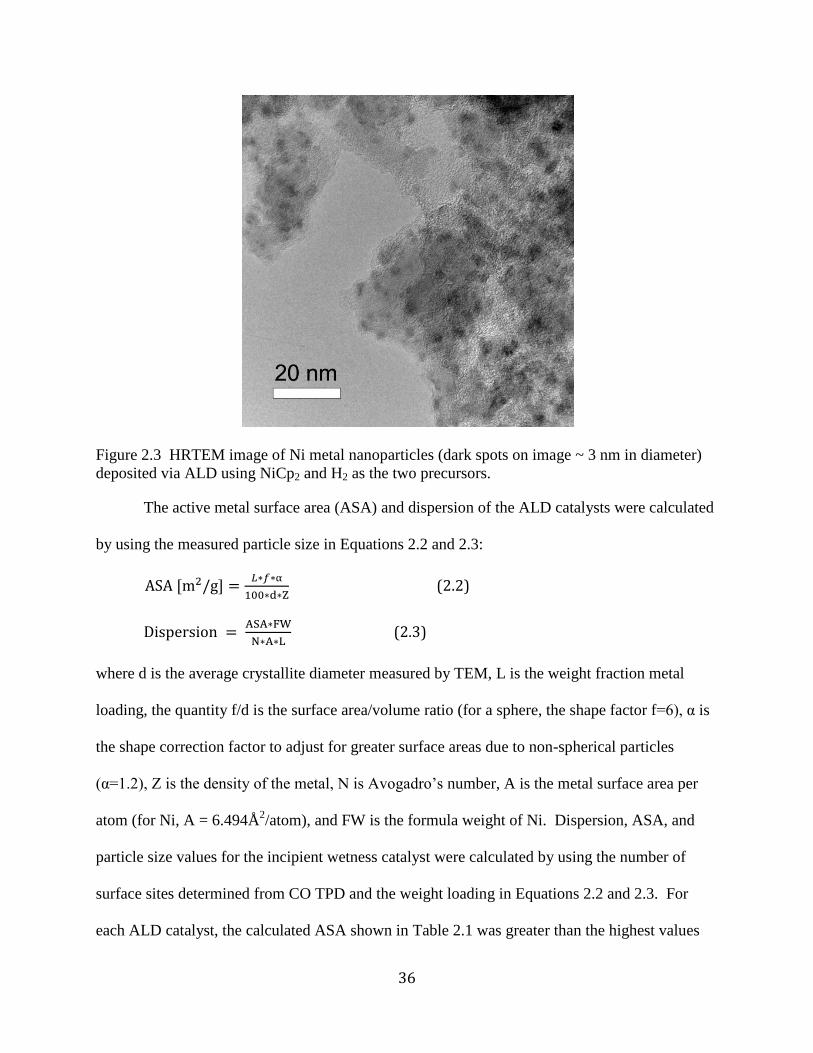
36
Figure 2.3 HRTEM image of Ni metal nanoparticles (dark spots on image ~ 3 nm in diameter)
deposited via ALD using NiCp2 and H2 as the two precursors.
The active metal surface area (ASA) and dispersion of the ALD catalysts were calculated
by using the measured particle size in Equations 2.2 and 2.3:
(2.2)
(2.3)
where d is the average crystallite diameter measured by TEM, L is the weight fraction metal
loading, the quantity f/d is the surface area/volume ratio (for a sphere, the shape factor f=6), α is
the shape correction factor to adjust for greater surface areas due to non-spherical particles
(α=1.2), Z is the density of the metal, N is Avogadro’s number, A is the metal surface area per
atom (for Ni, A = 6.494Å2/atom), and FW is the formula weight of Ni. Dispersion, ASA, and
particle size values for the incipient wetness catalyst were calculated by using the number of
surface sites determined from CO TPD and the weight loading in Equations 2.2 and 2.3. For
each ALD catalyst, the calculated ASA shown in Table 2.1 was greater than the highest values
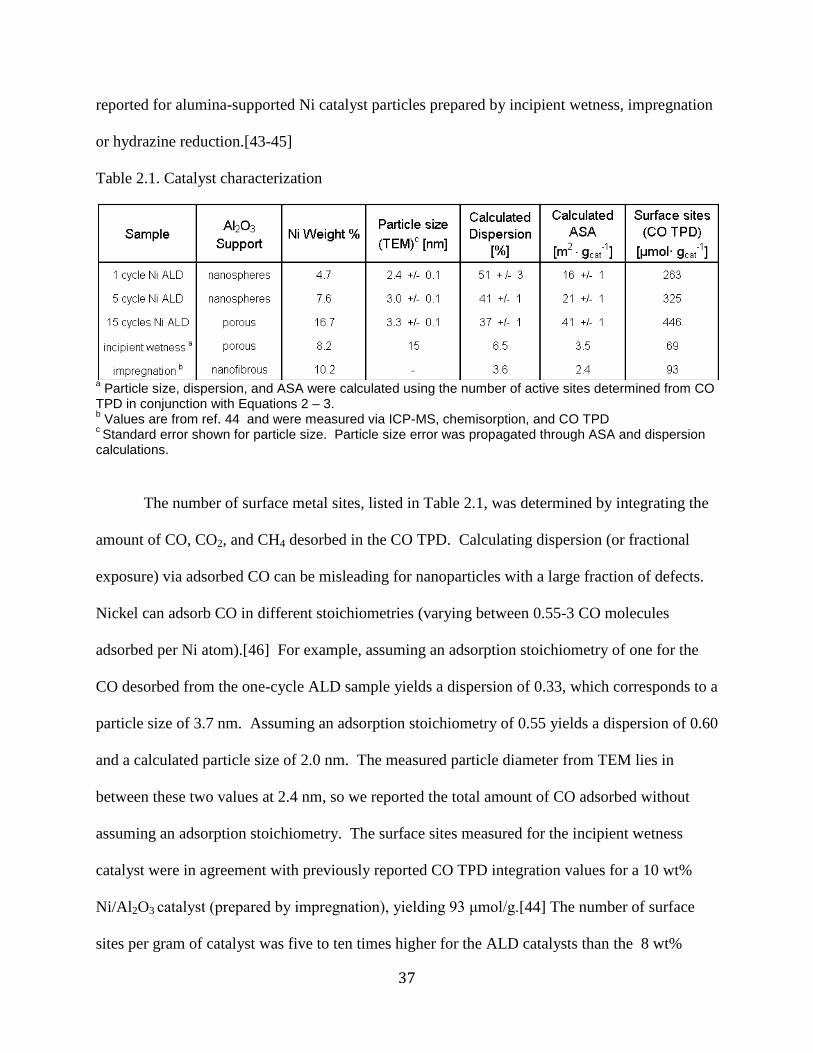
37
reported for alumina-supported Ni catalyst particles prepared by incipient wetness, impregnation
or hydrazine reduction.[43-45]
Table 2.1. Catalyst characterization
a Particle size, dispersion, and ASA were calculated using the number of active sites determined from CO
TPD in conjunction with Equations 2 – 3. b Values are from ref. 44 and were measured via ICP-MS, chemisorption, and CO TPD
c Standard error shown for particle size. Particle size error was propagated through ASA and dispersion
calculations.
The number of surface metal sites, listed in Table 2.1, was determined by integrating the
amount of CO, CO2, and CH4 desorbed in the CO TPD. Calculating dispersion (or fractional
exposure) via adsorbed CO can be misleading for nanoparticles with a large fraction of defects.
Nickel can adsorb CO in different stoichiometries (varying between 0.55-3 CO molecules
adsorbed per Ni atom).[46] For example, assuming an adsorption stoichiometry of one for the
CO desorbed from the one-cycle ALD sample yields a dispersion of 0.33, which corresponds to a
particle size of 3.7 nm. Assuming an adsorption stoichiometry of 0.55 yields a dispersion of 0.60
and a calculated particle size of 2.0 nm. The measured particle diameter from TEM lies in
between these two values at 2.4 nm, so we reported the total amount of CO adsorbed without
assuming an adsorption stoichiometry. The surface sites measured for the incipient wetness
catalyst were in agreement with previously reported CO TPD integration values for a 10 wt%
Ni/Al2O3 catalyst (prepared by impregnation), yielding 93 μmol/g.[44] The number of surface
sites per gram of catalyst was five to ten times higher for the ALD catalysts than the 8 wt%
38
incipient wetness catalyst or similar impregnation catalysts.[44] The number of surface sites on
the 7.57 wt% ALD catalyst was approximately five times higher than the 8 wt% incipient
wetness catalyst. Even though the two catalysts are of similar weight loading, the particles
deposited via ALD had a much higher fraction of Ni surface atoms.
Perhaps more significant than the increase in dispersion, CO TPD showed that desorption
was different on the ALD catalysts, as shown in Figure 2.. Carbon monoxide desorbs from Ni
catalysts in three peaks: 1) α1 below 423 K corresponding to single-site adsorption and
desorption of molecular CO, 2) β1 at 423 – 623 K corresponding to associative desorption of C
and O, and 3) β2 from 623 - 723 K corresponding to associative desorption from step edge and
kink sites.[44, 47-49] The ALD catalysts exhibited all three desorption regimes, but CO
primarily desorbed in the β1 and β2 modes, as shown in Figure 2.. The likelihood of forming
Ni(CO)4 was relatively low since no low-temperature (< 348 K) CO peaks were detected.
Previous CO TPD studies on Ni indicate that Ni(CO)4 decomposes into CO around 323 - 348
K.[49] The ALD catalysts all had proportionally larger β2 CO peaks than the incipient wetness
catalyst. As expected, the peak areas were larger on a per gram basis because the higher
dispersions and weight loadings provided much more surface area for CO to adsorb. Moreover,
the ratio of β2 to α1 or β1 peak areas increased with the number of ALD cycles, indicating the
concentration of step or kink sites on the ALD catalyst surface increased as the number of cycles
increased. Although this increase in step or kink site concentration seems counter-intuitive since
coordination number decreases with particle size, the concentration of reactive steps has
previously been shown to proceed through a maximum as particle size increases.[50, 51]
During CO TPD, CO2 and CH4 also formed, and the CO2 desorption modes were
primarily β1 and β2, with a small amount of α1 desorption. Additionally, much more CO2
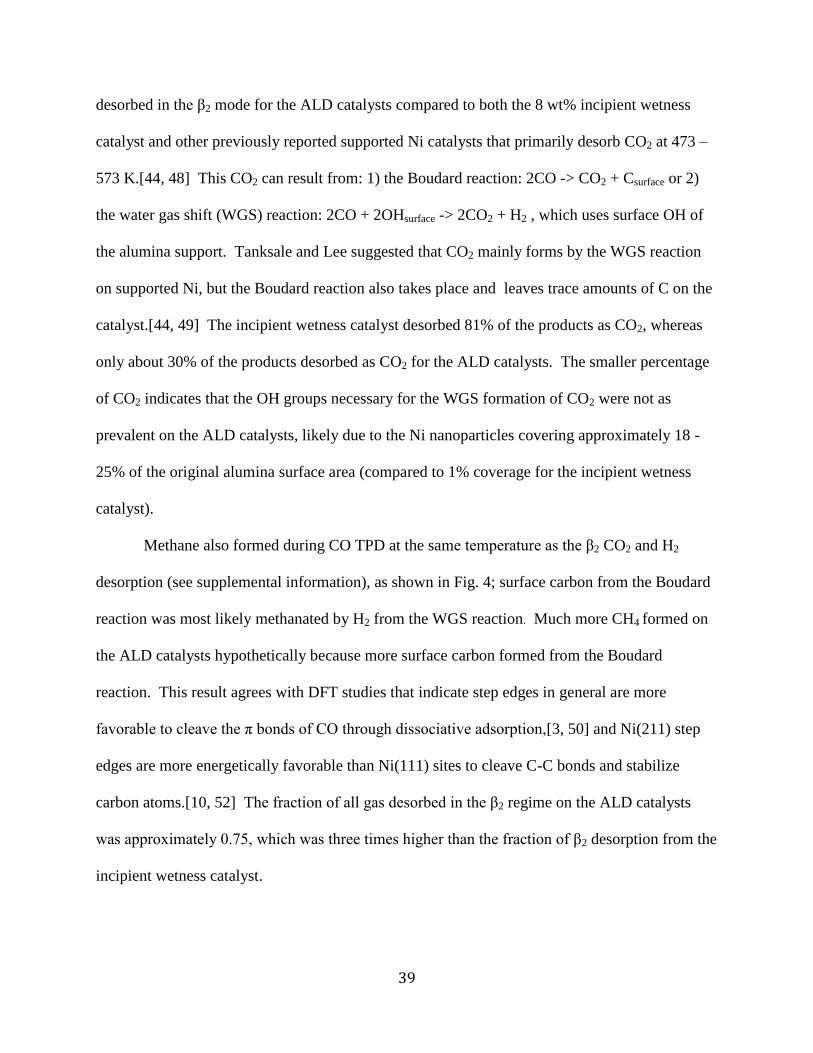
39
desorbed in the β2 mode for the ALD catalysts compared to both the 8 wt% incipient wetness
catalyst and other previously reported supported Ni catalysts that primarily desorb CO2 at 473 –
573 K.[44, 48] This CO2 can result from: 1) the Boudard reaction: 2CO -> CO2 + Csurface or 2)
the water gas shift (WGS) reaction: 2CO + 2OHsurface -> 2CO2 + H2 , which uses surface OH of
the alumina support. Tanksale and Lee suggested that CO2 mainly forms by the WGS reaction
on supported Ni, but the Boudard reaction also takes place and leaves trace amounts of C on the
catalyst.[44, 49] The incipient wetness catalyst desorbed 81% of the products as CO2, whereas
only about 30% of the products desorbed as CO2 for the ALD catalysts. The smaller percentage
of CO2 indicates that the OH groups necessary for the WGS formation of CO2 were not as
prevalent on the ALD catalysts, likely due to the Ni nanoparticles covering approximately 18 -
25% of the original alumina surface area (compared to 1% coverage for the incipient wetness
catalyst).
Methane also formed during CO TPD at the same temperature as the β2 CO2 and H2
desorption (see supplemental information), as shown in Fig. 4; surface carbon from the Boudard
reaction was most likely methanated by H2 from the WGS reaction. Much more CH4 formed on
the ALD catalysts hypothetically because more surface carbon formed from the Boudard
reaction. This result agrees with DFT studies that indicate step edges in general are more
favorable to cleave the π bonds of CO through dissociative adsorption,[3, 50] and Ni(211) step
edges are more energetically favorable than Ni(111) sites to cleave C-C bonds and stabilize
carbon atoms.[10, 52] The fraction of all gas desorbed in the β2 regime on the ALD catalysts
was approximately 0.75, which was three times higher than the fraction of β2 desorption from the
incipient wetness catalyst.
40
Figure 2.4. Carbon monoxide, CO2, and CH4 TPD spectra for CO adsorption on ALD and IW
Ni/Al2O3 catalysts

41
2.4.3. Catalytic Performance
The four catalysts had similar hydrogenation TOFs (the TOF for the one-cycle ALD
catalyst was slightly higher), but in contrast to the incipient wetness catalyst, the ALD catalysts
also exhibited significant hydrogenolysis activity, as shown in Table 2.2. Turnover frequencies
of both reactions did not vary for conversions from 10% to 70%, which were obtained by
varying the amount of catalyst in the reactor. The hydrogenolysis rate had a maximum around
498 K for the 1- and 5-cycle ALD catalysts, but the 15-cycle ALD catalyst had a maximum at
523 K. At 523 K, the selectivity to hydrogenolysis was 10.6%; the maximum hydrogenolysis
TOF was 0.39 s-1
and the hydrogenation TOF decreased to 3.3 s-1
. Hydrogenolysis was not due
to a series reaction of hydrogenation followed by hydrogenolysis, because no hydrogenolysis
products were detected on the 15-cycle catalyst under similar reaction conditions when propane
was used as a feed. Changing the number of ALD cycles from 5 to 15 increased the
hydrogenolysis rates by a factor of 5 at 498 K, and increased the hydrogenolysis rate by a factor
of at least 9 at 523 K. Hydrogenolysis TOFs of the incipient wetness catalyst were similar to the
ethane hydrogenolysis TOFs of approximately 5 x 10⁻³
s-1
at 498 K and 1.5 x 10⁻²
s-1
at 523 K
reported by Goodman for Ni(100) single crystals.[53] The ALD catalysts’ hydrogenolysis rates
were similar to those reported by Coulter et al. on model Ni catalysts deposited on SiO2 single
crystals, with ethane hydrogenolysis TOFs reaching a maximum of 0.15 s-1
at 550 K for a
particle size of 2.5 nm, then decreasing as the particles became larger or smaller.[54] The
decrease in hydrogenolysis rate for the particles smaller than 3.3 nm is likely due to a combined
effect of a decrease in ensembles of sufficient size for the hydrogenolysis reaction and a decrease
in step edge concentration.[18, 55]

42
Table 2.2. Propylene hydrogenation and hydrogenolysis turnover frequencies (TOF) at 498 K
and hydrogenolysis selectivity. Standard errors of reaction TOF are shown.
Figure 2.5. Hydrogenolysis TOF versus maximum β2 desorption rate (normalized by number of
surface sites). The line is a quadratic fit.
The surface structure and desorption behavior from CO TPD directly correlated with
hydrogenolysis rates. The ability of the ALD catalysts to cleave the C-O bond and stabilize the
carbon for hydrogen addition was a characteristic that was paralleled in the reactor studies in the
cleavage of carbon bonds for propylene hydrogenolysis. The 15-cycle catalyst, which had the
highest hydrogenolysis rate, desorbed the most CO and CO2 in the β2 desorption mode. The
hydrogenolysis rate of the different catalysts increased with the total (CO, CO2 and CH4) β2
maximum desorption rate determined from CO TPD (normalized by number of surface sites), as

43
shown in Figure 2.. A larger β2 peak indicated more step edge or kink sites on the catalyst,
which are more favorable for hydrogenolysis.[10] The 15-cycle ALD catalyst also desorbed the
largest amount of CH4, indicating the carbon and hydrogen formed CH4 on the more prevalent
step edges and kinks. Although the increase in particle size is minimal between the 1-cycle and
the 15-cycle catalysts, the amount and coordination number of active sites can vary drastically
when particle size changes only 0.5 nm in the 2- 5 nm size regime.[13, 56] Hydrogenolysis is
identified as a structure sensitive reaction that can exhibit a maximum instead of continually
increasing reaction rate as particle size decreases.[18, 50, 55, 57] This maximum arises from 1)
the inability of step edges to exist on particles smaller than 2 nm and the decrease in sufficiently
large ensembles as the particles become smaller, and 2) replacing step edges with higher-
coordinated terraces as particles become sufficiently large.[17, 18, 50, 55]
2.5. Conclusions
Atomic layer deposition formed Ni nanoparticles on Al2O3 supports when H2 and NiCp2
were used as precursors. As the number of ALD cycles increased, the particle size and number
of particles increased, but the mass of Ni deposited per cycle decreased. The dispersion of the
ALD catalysts was higher than the incipient wetness catalyst used for comparison and similar to
the highest values reported for supported Ni catalysts.
Carbon monoxide TPD indicated different desorption mode distributions for ALD
catalysts (compared to incipient wetness catalyst), suggesting that the surface structures of the
ALD nanoparticles are different from the larger incipient wetness Ni particles. The difference in
surface structure, known to be more favorable for hydrogenolysis, resulted in hydrogenolysis at
498 K for the three ALD catalysts and 11% hydrogenolysis selectivity for the 15 cycle ALD
catalyst at 523 K, whereas the incipient wetness catalyst had minimal hydrogenolysis selectivity.
44
The carbon double bond most likely cleaved on step edges and kinks, which TPD indicated were
more prevalent for the catalysts with the highest hydrogenolysis activity. The ability to vary
particle size and nanostructure by changing the number of ALD cycles allows for facile
preparation of supported nanoscale catalysts. Not only does ALD address many of the
challenges associated with commercializing nanoscale catalyst synthesis, but utilization of ALD
for catalyst fabrication may also aid other applications where specific particle sizes or structures
are required for activity or selectivity.
Acknowledgments
The work was supported through the National Science Foundation Graduate Research
Fellowship Program and NSF Grant CBET 1067800. The authors thank Fred Luizer in the
University of Colorado’s Laboratory of Environmental and Geological Studies (LEGS) for
conducting ICP-MS analysis. The authors also thank the MIT Shared Experimental Facility for
the use of their HRTEM, and the MCDB Bio3d Electron Microscopy center for the use of TEM
microscopes and sample preparation equipment. Kelly Anderson and Jake Carrier were also
extremely helpful in running the reactors for ALD synthesis, TPD experiments, and catalytic
studies.
2.6. References
[1] M. Neurock, Journal of Catalysis 216 (2003) 73-88. [2] J.K. Nørskov, T. Bligaard, A. Logadottir, S. Bahn, L.B. Hansen, M. Bollinger, H. Bengaard, B. Hammer, Z. Sljivancanin, M. Mavrikakis, Y. Xu, S. Dahl, C.J.H. Jacobsen, Journal of Catalysis 209 (2002) 275-278. [3] B. Hammer, J.K. Nørskov, H.K. Bruce C. Gates, Theoretical surface science and catalysis - calculations and concepts, in: Advances in Catalysis, Academic Press, 2000, pp. 71-129. [4] M.T. Schaal, A.C. Pickerell, C.T. Williams, J.R. Monnier, Journal of Catalysis 254 (2008) 131-143. [5] A.S. Loh, S.W. Davis, J.W. Medlin, Journal of the American Chemical Society 130 (2008) 5507-5514. [6] M.T. Schaal, M.P. Hyman, M. Rangan, S. Ma, C.T. Williams, J.R. Monnier, J.W. Medlin, Surface Science 603 (2009) 690-696.
45
[7] E. Nikolla, J. Schwank, S. Linic, Journal of the American Chemical Society 131 (2009) 2747-2754. [8] S.H. Alfons M. Molenbroek, Henrik Topsoe, Bjerne S. Clausen, Topics in Catalysis 52 (2009) 1303-1311. [9] S. Alayoglu, A.U. Nilekar, M. Mavrikakis, B. Eichhorn, Nat Mater 7 (2008) 333-338. [10] R.T. Vang, K. Honkala, S. Dahl, E.K. Vestergaard, J. Schnadt, E. Lægsgaard, B.S. Clausen, J.K. Nørskov, F. Besenbacher, Surface Science 600 (2006) 66-77. [11] F. Abild-Pedersen, J. Greeley, J. Nørskov, Catalysis Letters 105 (2005) 9-13. [12] Y. Li, G.A. Somorjai, Nano Letters 10 (2010) 2289-2295. [13] R.V. Hardeveld, F. Hartog, Advances in Catalysis 22 (1972) 75-110. [14] E.L. Hu, S.M. Davis, R. Davis, E. Scher, Applications: Catalysis by Nanostructured Materials: Nanotechnology Research Directions for Societal Needs in 2020, in, Springer Netherlands, 2011, pp. 445-466. [15] M. Haruta, Catalysis Today 36 (1997) 153-166. [16] A.T. Bell, Science 299 (2003) 1688-1691. [17] J.M. Dartigues, A. Chambellan, F.G. Gault, Journal of the American Chemical Society 98 (1976) 856-857. [18] G.C. Bond, Surface Science 156, Part 2 (1985) 966-981. [19] J.D. Aiken Iii, R.G. Finke, Journal of Molecular Catalysis A: Chemical 145 (1999) 1-44. [20] M. Gharibi, F.T. Zangeneh, F. Yaripour, S. Sahebdelfar, Applied Catalysis A: General 443-444 (2012) 8-26. [21] F. Bozon-Verduraz, F. Fiévet, J.-Y. Piquemal, R. Brayner, K. El Kabouss, Y. Soumare, G. Viau, G. Shafeev, Brazilian Journal of Physics 39 (2009) 134-140. [22] D.M. King, J.A. Spencer Ii, X. Liang, L.F. Hakim, A.W. Weimer, Surface and Coatings Technology 201 (2007) 9163-9171. [23] S.M. George, Polymer 1550 (2012) 125. [24] Y. Lei, B. Liu, J. Lu, R.J. Lobo-Lapidus, T. Wu, H. Feng, X. Xia, A.U. Mane, J.A. Libera, J.P. Greeley, J.T. Miller, J.W. Elam, Chemistry of Materials 24 (2012) 3525-3533. [25] X. Liang, L. Lyon, Y.-B. Jiang, A. Weimer, Journal of Nanoparticle Research 14 (2012) 1-12. [26] J. Li, X. Liang, D.M. King, Y.-B. Jiang, A.W. Weimer, Applied Catalysis B: Environmental 97 (2010) 220-226. [27] S.T. Christensen, H. Feng, J.L. Libera, N. Guo, J.T. Miller, P.C. Stair, J.W. Elam, Nano Letters 10 (2010) 3047-3051. [28] X. Liang, J. Li, M. Yu, C.N. McMurray, J.L. Falconer, A.W. Weimer, ACS Catalysis 1 (2011) 1162-1165. [29] J. Lu, B. Fu, M.C. Kung, G. Xiao, J.W. Elam, H.H. Kung, P.C. Stair, Science 335 (2012) 1205-1208. [30] W. Kessels, H. Knoops, S. Dielissen, A. Mackus, M. van de Sanden, Applied Physics Letters 95 (2009) 013114-013114-013113. [31] J. Bachmann, A. Zolotaryov, O. Albrecht, S. Goetze, A. Berger, D. Hesse, D. Novikov, K. Nielsch, Chemical Vapor Deposition 17 (2011) 177-180. [32] H.L. Lu, G. Scarel, C. Wiemer, M. Perego, S. Spiga, M. Fanciulli, G. Pavia, Journal of The Electrochemical Society 155 (2008) H807-H811. [33] J.R. Scheffe, M.D. Allendorf, E.N. Coker, B.W. Jacobs, A.H. McDaniel, A.W. Weimer, Chemistry of Materials 23 (2011) 2030-2038.

46
[34] J.R. Scheffe, A. Francés, D.M. King, X. Liang, B.A. Branch, A.S. Cavanagh, S.M. George, A.W. Weimer, Thin Solid Films 517 (2009) 1874-1879. [35] G.A. Ten Eyck, S. Pimanpang, H. Bakhru, T.M. Lu, G.C. Wang, Chemical Vapor Deposition 12 (2006) 290-294. [36] B.S. Lim, A. Rahtu, R.G. Gordon, Nat Mater 2 (2003) 749-754. [37] M.P. Rigney, E.F. Funkenbusch, P.W. Carr, Journal of Chromatography A 499 (1990) 291-304. [38] J.B. Peri, R.B. Hannan, The Journal of Physical Chemistry 64 (1960) 1526-1530. [39] W. Setthapun, W.D. Williams, S.M. Kim, H. Feng, J.W. Elam, F.A. Rabuffetti, K.R. Poeppelmeier, P.C. Stair, E.A. Stach, F.H. Ribeiro, J.T. Miller, C.L. Marshall, The Journal of Physical Chemistry C 114 (2010) 9758-9771. [40] E. Baumgarten, R. Wagner, C. Lentes-Wagner, Fresenius' Zeitschrift für analytische Chemie 334 (1989) 246-251. [41] Y. Chen, L. Zhang, Catalysis Letters 12 (1992) 51-62. [42] W. Qi, M. Wang, Q. Liu, Journal of Materials Science 40 (2005) 2737-2739. [43] D. Duprez, M.C. DeMicheli, P. Marecot, J. Barbier, O.A. Ferretti, E.N. Ponzi, Journal of Catalysis 124 (1990) 324-335. [44] A. Tanksale, J.N. Beltramini, J.A. Dumesic, G.Q. Lu, Journal of Catalysis 258 (2008) 366-377. [45] A.G. Boudjahem, S. Monteverdi, M. Mercy, M.M. Bettahar, Journal of Catalysis 221 (2004) 325-334. [46] C.H. Bartholomew, R.B. Pannell, Journal of Catalysis 65 (1980) 390-401. [47] W. Erley, H. Wagner, Surface Science 74 (1978) 333-341. [48] J. Zieliński, Journal of Molecular Catalysis 79 (1993) 187-198. [49] P.I. Lee, J.A. Schwarz, J.C. Heydweiller, Chemical Engineering Science 40 (1985) 509-519. [50] R.A. Van Santen, Accounts of Chemical Research 42 (2008) 57-66. [51] M. Mavrikakis, P. Stoltze, J.K. Nørskov, Catalysis Letters 64 (2000) 101-106. [52] H. Bengaard, J.K. Nørskov, J. Sehested, B.S. Clausen, L.P. Nielsen, A.M. Molenbroek, J.R. Rostrup-Nielsen, Journal of Catalysis 209 (2002) 365-384. [53] D.W. Goodman, Surface Science 123 (1982) L679-L685. [54] K. Coulter, X. Xu, D.W. Goodman, The Journal of Physical Chemistry 98 (1994) 1245-1249. [55] G.A. Martin, Journal of Catalysis 60 (1979) 345-355. [56] O.L. Pérez, D. Romeu, M.J. Yacamán, Applications of Surface Science 13 (1982) 402-413. [57] G.C. Bond, Chemical Society Reviews 20 (1991) 441-475.
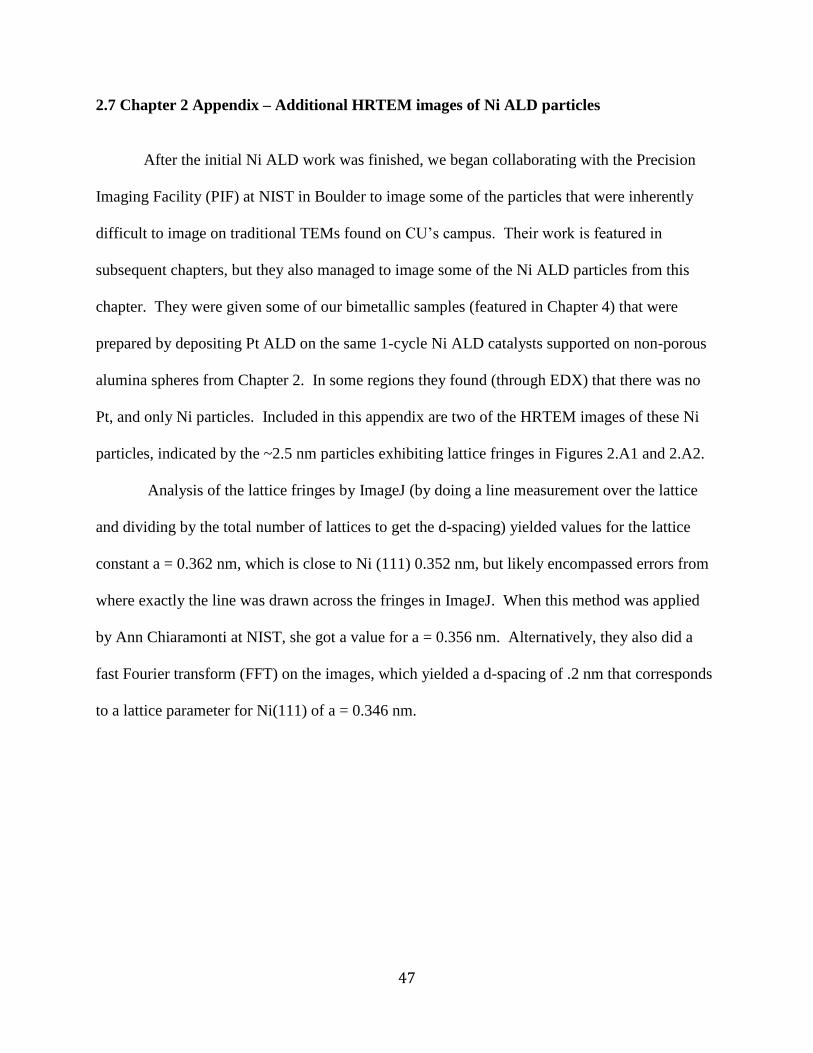
47
2.7 Chapter 2 Appendix – Additional HRTEM images of Ni ALD particles
After the initial Ni ALD work was finished, we began collaborating with the Precision
Imaging Facility (PIF) at NIST in Boulder to image some of the particles that were inherently
difficult to image on traditional TEMs found on CU’s campus. Their work is featured in
subsequent chapters, but they also managed to image some of the Ni ALD particles from this
chapter. They were given some of our bimetallic samples (featured in Chapter 4) that were
prepared by depositing Pt ALD on the same 1-cycle Ni ALD catalysts supported on non-porous
alumina spheres from Chapter 2. In some regions they found (through EDX) that there was no
Pt, and only Ni particles. Included in this appendix are two of the HRTEM images of these Ni
particles, indicated by the ~2.5 nm particles exhibiting lattice fringes in Figures 2.A1 and 2.A2.
Analysis of the lattice fringes by ImageJ (by doing a line measurement over the lattice
and dividing by the total number of lattices to get the d-spacing) yielded values for the lattice
constant a = 0.362 nm, which is close to Ni (111) 0.352 nm, but likely encompassed errors from
where exactly the line was drawn across the fringes in ImageJ. When this method was applied
by Ann Chiaramonti at NIST, she got a value for a = 0.356 nm. Alternatively, they also did a
fast Fourier transform (FFT) on the images, which yielded a d-spacing of .2 nm that corresponds
to a lattice parameter for Ni(111) of a = 0.346 nm.
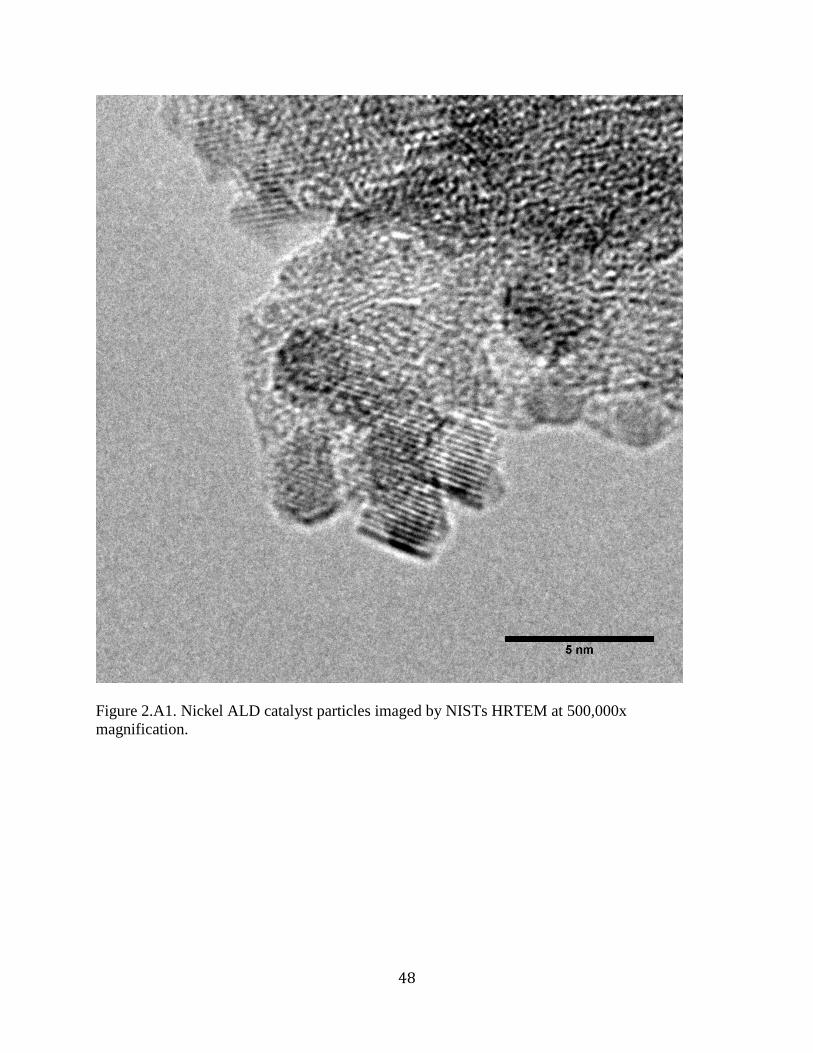
48
Figure 2.A1. Nickel ALD catalyst particles imaged by NISTs HRTEM at 500,000x
magnification.
49
Figure 2.A2. Nickel ALD particles imaged by NIST’s HRTEM at 250,000x magnification.
50
Chapter 3: Controlling nanoscale properties of supported platinum catalysts
through atomic layer deposition
3.1 Abstract
Platinum nanoparticles were grown on alumina by atomic layer deposition using either H2 or
O2 as the second half-reaction precursor. Particle diameters could be tuned between ~1 and 2 nm
by using different chemistries and by changing the number of ALD cycles. Temperature-
programmed desorption (TPD) of CO and diffuse reflectance infrared Fourier transform
spectroscopy (DRIFTS) for adsorbed CO were used to characterize site distributions on the
nanoparticles. As expected, smaller nanoparticles had sites with lower coordination numbers.
The two chemistries had different deposition mechanisms, most likely due to differences in
reaction sites of either existing Pt particles or the surface hydroxyl groups, which were
monitored via in-situ FTIR during Pt ALD. The catalysts were evaluated for oxidative
dehydrogenation of propane to propylene. The smallest particles (synthesized by 1 cycle of Pt
ALD with H2) had a C3H6 selectivity of 37% at 14% conversion, whereas the selectivity was less
than 1% for larger (3.6 nm) commercial Pt particles at 9% conversion.
3.2 Introduction
The catalysis field has been advancing towards precise control of nanometer and sub-
nanometer features in catalytic materials. These advances were made possible by new synthesis
methods, better analytical techniques to probe ultra-small features, and greater understanding of
fundamental catalytic principles at the nanoscale through theoretical investigations.[1-3] One
example of a highly sought-after reaction is oxidative dehydrogenation (ODH) of alkanes to
alkenes, which can benefit from advances in nanostructured catalysts.[4] Oxidative
51
dehydrogenation of propane (ODHP) to propylene is of particular interest. The global demand
for propylene is expected to increase by more than 20 billion kg by 2017, with global sales
currently exceeding $90 billion US.[5] Propylene is primarily produced in steam crackers, with a
smaller fraction produced in fluid catalytic cracking (FCC) units, and an even smaller fraction
produced by catalytic dehydration.[6] The cracking processes are highly endothermic, require
regeneration of the catalysts due to coking, and produce larger fractions of ethylene than
propylene.[7] Oxidative dehydrogenation, in contrast, can be operated at temperatures below
773 K and is exothermal instead of the highly endothermic catalytic non-oxidative
dehydrogenation that must typically be run at temperatures above 1073 K.[7] Currently, ODHP
catalysts do not have high enough yields to cause propylene manufacturers to adopt ODHP as a
viable alternative over traditional cracking technologies.
Oxidative dehydrogenation is known as a Type III structure sensitive reaction; i.e., the
turnover frequency increases as the particle size decreases.[8, 9] Vajda et al. used DFT to
elucidate why this reaction became more favorable on Pt clusters of 4 to 8 atoms.[9] Clusters of
this size have atoms with a coordination number (CN) of3 to 4, and their study showed that these
atoms have a lower barrier for breaking a C-H bond than for breaking a C-C bond to form CO or
CO2. Supported Pt catalysts with larger crystallite sizes and Pt (111) surfaces have shown
minimal selectivity to propylene and instead catalyze combustion, favoring C-C bond breaking
over C-H bond breaking.[10] However, size-selected Pt clusters of 8 to 10 atoms have achieved
propylene selectivities greater than 60%, but those catalysts were highly idealized and prepared
with a non-scalable technique requiring a continuous cluster beam as the Pt source.[9]
Atomic layer deposition has been used in the last decade because of its ability in some
applications to prepare relatively-small Pt nanoclusters without succumbing to the disadvantages
52
of liquid-phase synthesis techniques. Although liquid-phase catalyst preparation can achieve
more precise control over size and shape[11, 12], the solvents are often hazardous, and the
synthesis requires further steps to purify the product, cleave organic capping agents, and deposit
the separately-prepared particles on a support.[11, 13, 14] Aaltonen et al. pioneered the use of
trimethyl(methylcyclopentadienyl)platinum (Me3(MeCp)Pt) and O2 to deposit Pt films using
hundreds of Pt ALD cycles.[15] Since that time, this oxidative ALD process has been used to
deposit Pt nanoparticles using a range of number of cycles and on various metal oxide
supports.[16-19] In-situ FTIR of gas-phase ALD products and EXAFTS/XANES techniques
have been used to gain a better understanding of the ALD mechanism.[19, 20] The generally-
accepted mechanism for Pt ALD, once a sufficient amount of Pt is deposited, is as follows for
the O2 chemistry[20]:
The first half reaction, dosing the Pt precursor:
2(MeCp)PtMe3(g) + 3 O(ads) → 2(MeCp)PtMe2(ads) + CH4(g) + CO2(g) + H2O(g)
The second half-reaction, using O2:
2(MeCp)PtMe2(ads) + 24 O2(g) → 2 Pt(s) + 3 O(ads) + 16 CO2(g) + 13 H2O(g)
These reaction mechanisms are valid once Pt particles or layers are already deposited.
However, in the first few cycles, the active sites for deposition on metal oxides are OH groups.
As the number of ALD cycles increases, the Pt coverage increases until the active sites for
deposition are exclusively Pt-O.[19] Alternatively, H2 can be used as the second half-reaction
precursor instead of O2 to hydrogenate the organic groups of the Pt precursor. No Pt-O species
are formed when H2-based ALD is used, and the active sites are the OH groups on the surface of
the metal oxide.[19]
53
The focus on creating ultra-small Pt nanoparticles or nanoclusters has encouraged several
theoretical studies that investigated the mechanisms of single Pt and Pd adatom behavior on
metal oxide support surfaces. Diffusion via site-to-site transitions have been studied on gamma
alumina for both Pt and Pd atoms through DFT.[21, 22] Interestingly, hydroxyl groups adsorbed
on Al2O3 decrease the adsorption strength of Pt and Pd atoms on the support, but drastically
increase the diffusion barriers of metal atoms on these surfaces. For Pd atom diffusion, Valero et
al. showed that a hydroxylated surface caused the low-energy diffusion trajectory barrier to
increase by as much as 74 kJ/mol.[22] These OH groups may play a significant role in the Pt
ALD mechanism since they are proposed as the active site during H2 ALD but not during most
steps of O2 ALD.[19]
In the present study, the effect of the second half-reaction chemistry on particle size was
investigated with one or five ALD cycles. Changing the number of cycles and reaction chemistry
varied particle size between 1 and 2.5 nm. The difference between H2 and O2 ALD during the
deposition of Pt on alumina was investigated by in-situ FTIR characterization of the surface
hydroxyl groups. The surface structures of these catalysts were characterized by CO TPD and
CO DRIFTs, with an emphasis on characterizing low-coordinated atoms. Finally, these
catalysts were evaluated for activity and selectivity for ODHP.
3.3 Experimental Methods
3.3.1 ALD synthesis
Platinum particles were synthesized on alumina supports by ALD using either a stainless
steel fluidized bed reactor (FBR) [23, 24] (for 2-g batches) or a quartz tube FBR (6-mm inner
diameter) with a quartz glass frit of 40-μm pore size that supported the powder bed for smaller
batches. The alumina powder was fluidized in the quartz reactor at approximately 0.25-Pa

54
pressure with He carrier gas flow rates of 5 to 20 sccm. The alumina was then dried for 2 h
under vacuum at 393 K before Pt was deposited by ALD in the quartz FBR. Both porous alumina
(Albermarle MARTOXID AN/I gamma alumina) and nonporous nanosphere alumina (Aldrich
544833 gamma alumina) were used as supports. Platinum was deposited at 448 K, which is
much lower than the 573 K temperature typically used for Pt ALD with Me3(MeCp)Pt and
O2.[17, 19, 25] In this work, either H2 or O2 was used as the second reagent for Pt ALD.
3.3.2 Catalyst Characterization
The catalysts were characterized by TPD in a quartz tube reactor (6.35-mm inner
diameter) at ramp rates of 20 K/min, and the reactor effluent was analyzed with an SRS RGA
200 mass spectrometer. For CO TPD, the catalysts were reduced for 2 h at 523 K, purged with
inert, flashed to 923 K to desorb residual H2 and H2O, cooled to room temperature, dosed with
CO (100 sccm 20% CO in Ar) for 10 min, and then purged with Ar before ramping the
temperature.
Particle size estimates were obtained using Image J software to analyze images from an
FEI Tecnai 12 - Spirit Biotwin TEM and a Phillips CM-100 TEM. For even higher resolution
imaging, bright field images were taken by high-resolution TEM and dark field images were
taken by high angle annular dark field scanning tunneling electron microscopy (HAADF STEM)
at NIST’s Precision Imaging Facility (PIF) on a JEOL ARM200F microscope with a Shottky
field emission gun. Samples were electrostatically adhered to copper grids with a lacey carbon
over-layer (Ted-Pella 01895 Lacey Carbon Film grids) to avoid effects of solvents from
dropcasting. Samples prepared for imaging purposes were synthesized on the nonporous
nanosphere alumina so that the metal catalyst particles were on the surface of the spheres and
visible by TEM. The weight loadings of each sample were determined by inductively coupled

55
plasma mass spectroscopy (ICP-MS). The number of active sites was measured with a
Quantachrome AS-1 Autosorb. The catalysts were reduced at 523 K in pure H2 for 2 h before
measuring the H2 uptake.
A Nicolet 6700 FTIR spectrometer was used to measure spectra at 4 cm-1
resolution by
transmission IR for in-situ ALD experiments and diffuse reflectance infrared Fourier transform
spectroscopy (DRIFTS) for CO adsorption experiments. For the in-situ ALD measurements,
alumina nanopowder was mixed in a 1:2 ratio with KBr and pressed into a tungsten grid with a
hydraulic press at 2000 kg pressure. The sample was loaded into a vacuum chamber with IR-
transparent CaF2 windows; this chamber is described in more detail elsewhere.[26] A
thermocouple was placed within 2 mm of the tungsten grid to monitor the temperature of the
grid. The chamber was evacuated and heated to approximately 400 K and scanned before the
first Pt ALD dose. The Pt, O2, and H2 static doses were done for 30 min each; longer dose
durations showed no discernable differences. Between each dose the chamber was evacuated for
at least 30 min to remove residual precursor molecules. A blank grid loaded with KBr was
coated by 3 cycles of Pt ALD, and the KBr turned black, just as in the experiments with alumina,
but with the KBr-only sample, no distinctive IR features were observed at any point during the
deposition. The KBr’s contribution to the observed FTIR spectra was negligible because the
surface area of the KBr was 0.23 m2/g compared to 35 m
2/g for the alumina support.
The CO DRIFTS experiments were performed on a bed of catalyst powder using a closed
cell attachment (Harrick). Each sample was oxidized for 2 h at 573 K then reduced at 473 K for
2 h to ensure metallic Pt. The catalysts were then loaded into the chamber and degassed under
vacuum for several hours to desorb water from the alumina supports. Carbon monoxide was
dosed at room temperature at sequentially higher CO pressures until no further changes in IR
56
spectra were detected. For the temperature-ramp DRIFTS study, the sample was initially
saturated with CO (at a CO pressure of ~185 kPa), and then the chamber was evacuated and held
under vacuum for all CO DRIFTS measurements. The sample was heated from room
temperature to 600 K under vacuum in approximately 50 K increments, allowing at least 1 h
equilibration time before the spectra was measured for a given temperature.
3.3.3 Catalyst Evaluation
The Pt catalysts were evaluated for their activity and selectivity for ODHP. Prior to
exposure to reaction conditions, the catalysts were oxidized at 600 K for 10 min in a 20% O2
stream at 100 sccm. Then they were reduced in 100 sccm of 20% H2 for 1 h at 523 K. For most
catalytic testing, approximately 100 mg of catalyst was used, resulting in a nearly constant space
velocity of 28 s-1
, and full consumption of the O2. Reactants flowed through the same packed-
bed, quartz tube reactor described above for the TPD studies, and the reactor effluent was
measured by a SRI GC 8610c with a Haysep-D packed column. Flow rates for ODHP selectivity
studies were 12 sccm C3H8, 6 sccm O2, and 182 sccm Ar. A 5 wt% commercial Pt/Al2O3 catalyst
(Sigma) was tested for ODHP activity as a basis of comparison to larger, more Pt(111)-
terminated Pt particles. Turnover frequencies (TOF) were also measured by running the reaction
at less than full O2 conversion (~50 – 75% conversion) by using less catalyst (typically 2 mg or
less), and diluting the catalyst bed with the same alumina to 100 mg total bed weight. The same
concentration of reactants was used to determine TOFs.

57
3.4 Results and Discussion
3.4.1 Effect of second precursor and number of cycles on particle size
For one Pt ALD cycle at 448 K on the alumina supports, the Pt particles were smaller when
H2 rather than O2 was used as the second reagent. Images and size distributions are shown in
Figure 3.1. Even though the first Pt ALD half-cycle on alumina is exactly the same, using H2 in
the second half cycle produced an average Pt cluster size (measured by TEM) of 1.1 +/- 0.2 nm,
whereas using O2 produced 1.4 +/- 0.2 nm clusters. The difference in average particle size was
statistically significant according to a two sample t-test at α = 0.05. These particle sizes are
similar to those measured by EXAFS by Setthapun et al. for 1-cycle Pt ALD on spherical
alumina with O2 and H2, although they used deposition temperatures of 573 K for the O2 reaction
and 473 K for the H2 reaction. Each catalyst had essentially the same weight loading of
approximately 1.0 wt% (+/- 0.2 %) because the first ALD half-cycle, which deposits the
platinum precursor, was the same for the two preparations. The number of active sites per gram
of metal measured by chemisorption was larger for the H2-synthesized particles than O2-
synthesized particles. The average particle sizes calculated from chemisorption, listed in Table
1, were smaller than those obtained from TEM, which may not be able to detect sub-nm
particles. Additionally, Pt atoms can adsorb more than one H per active site when the average
CN of the cluster drops below 6.[27]
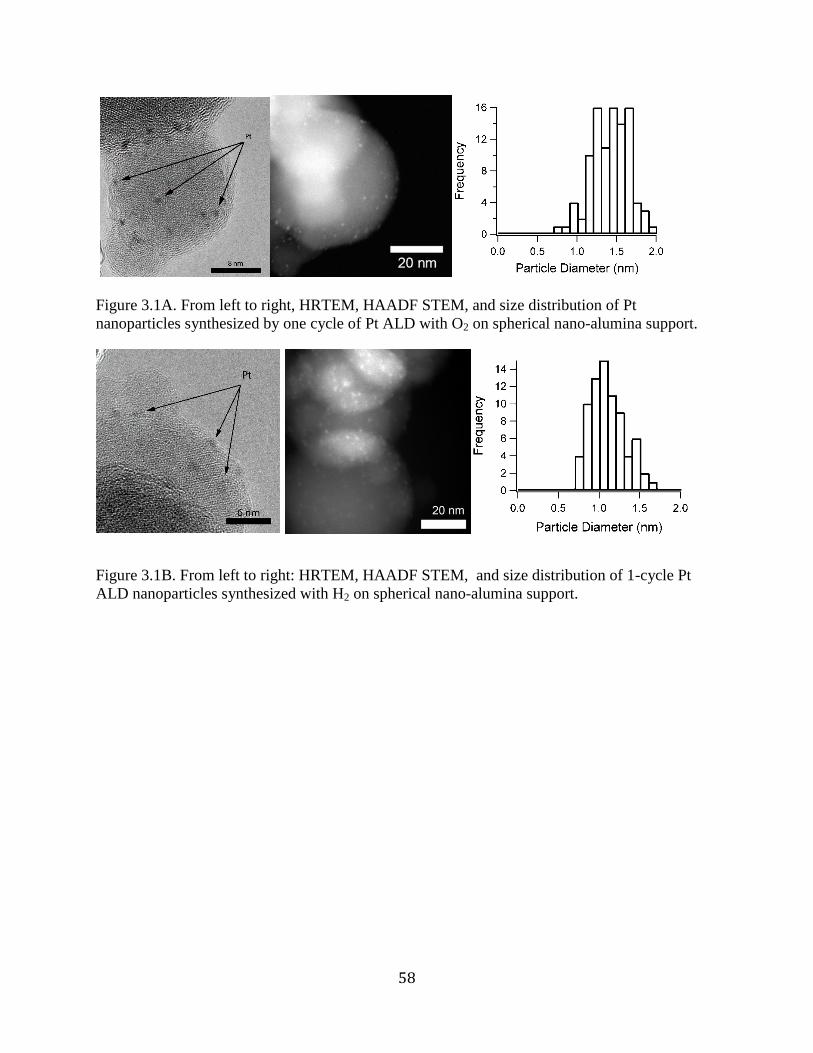
58
Figure 3.1A. From left to right, HRTEM, HAADF STEM, and size distribution of Pt
nanoparticles synthesized by one cycle of Pt ALD with O2 on spherical nano-alumina support.
Figure 3.1B. From left to right: HRTEM, HAADF STEM, and size distribution of 1-cycle Pt
ALD nanoparticles synthesized with H2 on spherical nano-alumina support.

59
We also prepared catalysts with higher Pt weight loading using five ALD cycles. As
shown in Figure 3.2, using H2 as the second precursor again resulted in smaller particle sizes (1.7
+/- 0.4 nm) compared to using O2 (2.4 +/- 0.5 nm).
Figure 3.2A. Pt ALD particle size distribution and TEM images of 5 cycles O2 Pt ALD
Figure 3.2B. Pt ALD particle size distribution and TEM image of 5 cycles H2 Pt ALD
Platinum loadings measured by ICP were identical for the two samples at approximately 4.7
wt%. Analysis by TEM revealed that some alumina support particles had no Pt nanoparticles,
indicating that the Pt particles were not uniformly distributed. Average particle size, weight
loadings, and chemisorption values are listed in Table 3.1. Controlling the particle size on an
oxide support is often difficult to achieve for particles smaller than 2.5 nm, especially for

60
techniques that do not require purification, removal of particle-stabilizing ligands, or anchoring
steps.
Table 3.1. Pt catalyst properties
Catalyst a
H2 Adsorbed
(μmol ·
gcatalyst-1
)
Pt Weight
Loading (%)
Particle Size
by TEM
(nm)
Chemisorption
Particle Size (nm)
[H:Pt ratio]
1 cycle Pt ALD with O2 26 1.2 1.4 +/- 0.2 1.3 [0.9]
1 cycle Pt ALD with H2 33 0.94 1.1 +/- 0.2 <1.1b
[1.4]
5 cycle Pt ALD with O2 74 4.7 2.4 +/- 0.5 1.8 [0.6]
5 cycle Pt ALD with H2 91 4.7 1.7 +/- 0.4 1.4 [0.8]
Commercial 5 wt% Al2O3 40 5 3.9 +/- 1.1 3.6 [0.3]
a ALD catalysts reported in this table were synthesized on non-porous nanopshere alumina
b This sample had an H:Pt ratio of 1.4, making the particle size estimate slightly smaller than
actual. The 1.1 nm size is the upper threshold (ignoring any H adsorbed beyond a H:Pt = 1)
3.4.2 In-situ ALD FTIR
The relative OH concentration during Pt ALD was measured via in-situ FTIR for both H2
and O2 ALD chemistries. Figure 3.3a shows spectra collected following each half cycle when H2
was used as the second-cycle reactant. The OH stretching band (the broad peak at ~3500 cm-1
)
did not change much after the first half-cycle. To ensure the surface was saturated, the precursor
was statically dosed into the chamber for 30 min, and further exposure (up to 3 h) did not change
the IR signal. Scans after subsequent cycles indicated more significant losses of hydroxyl
groups, as shown in Figure 3.3a. During the 3rd
Pt ALD cycle (not shown), the overall signal
dropped to less than 0.1 % transmittance because the Pt increased the opacity of the sample. The
sample grid was metallic and black after Pt ALD, whereas the original alumina/KBr powder was
completely white. Carbonaceous species (2800-2900 C-H stretching regions) were also present
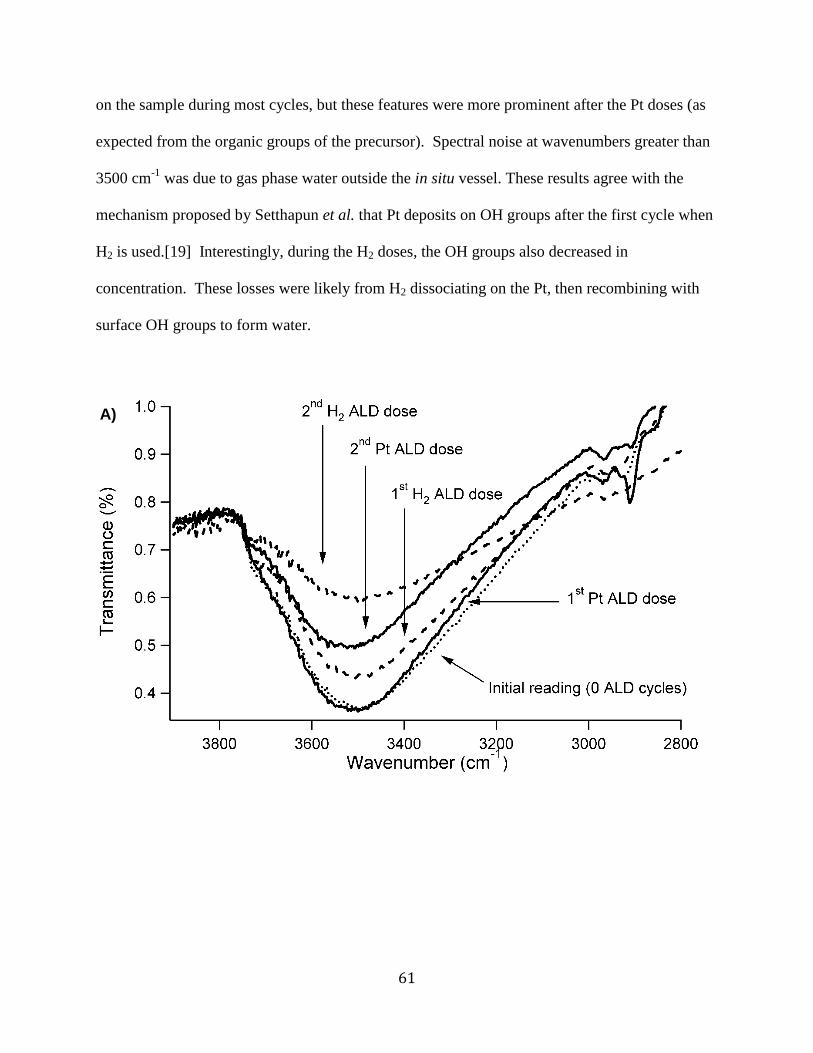
61
on the sample during most cycles, but these features were more prominent after the Pt doses (as
expected from the organic groups of the precursor). Spectral noise at wavenumbers greater than
3500 cm-1
was due to gas phase water outside the in situ vessel. These results agree with the
mechanism proposed by Setthapun et al. that Pt deposits on OH groups after the first cycle when
H2 is used.[19] Interestingly, during the H2 doses, the OH groups also decreased in
concentration. These losses were likely from H2 dissociating on the Pt, then recombining with
surface OH groups to form water.
A)

62
Figure 3.3. A) In-situ Pt ALD FTIR spectrogram with H2 used as the second precursor. B) In-situ
Pt ALD FTIR spectrogram with O2 used as the second precursor.
The presence of OH groups during each cycle indicates that only a fraction of the OH
groups reacted, and the rest remained on the surface. These residual OH groups may be
protected by steric hindrance from the organometallic precursor (the bound precursor can extend
approximately 0.7 nm away from the edge of a Pt particle), or they may be unreactive and lack
an active Lewis acid site due to the orientation of the hydroxyl groups.[28] By reacting on the
surface of the alumina, the newly-deposited Pt particles had to diffuse to form larger clusters.
We propose that these hydroxyl groups played a significant role in limiting the size of the Pt
clusters since the OH groups are known to interact with Pt or Pd atoms by reducing adsorption
strength of the metal atoms on alumina near OH groups (therby decreasing their transition to
sites near OH groups) and increasing the diffusion barrier across the alumina surface.[21, 22]
The Pt clusters were therefore more numerous and smaller when deposited with H2 instead of O2.
B)
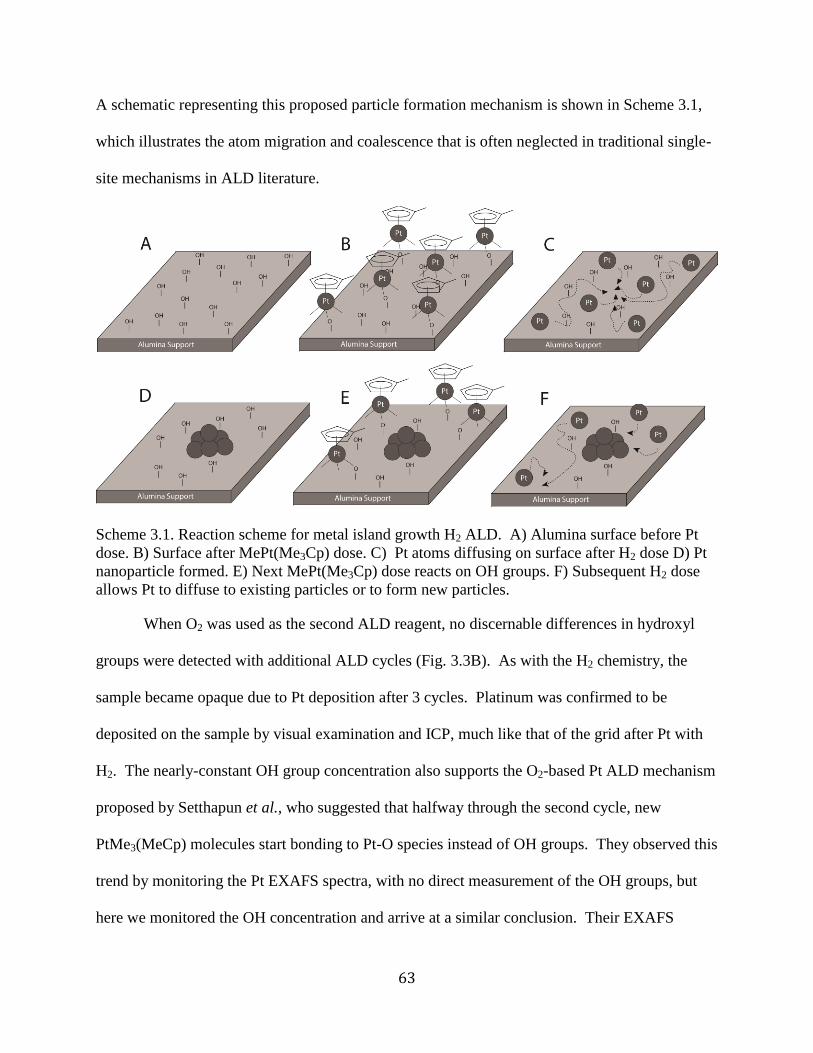
63
A schematic representing this proposed particle formation mechanism is shown in Scheme 3.1,
which illustrates the atom migration and coalescence that is often neglected in traditional single-
site mechanisms in ALD literature.
Scheme 3.1. Reaction scheme for metal island growth H2 ALD. A) Alumina surface before Pt
dose. B) Surface after MePt(Me3Cp) dose. C) Pt atoms diffusing on surface after H2 dose D) Pt
nanoparticle formed. E) Next MePt(Me3Cp) dose reacts on OH groups. F) Subsequent H2 dose
allows Pt to diffuse to existing particles or to form new particles.
When O2 was used as the second ALD reagent, no discernable differences in hydroxyl
groups were detected with additional ALD cycles (Fig. 3.3B). As with the H2 chemistry, the
sample became opaque due to Pt deposition after 3 cycles. Platinum was confirmed to be
deposited on the sample by visual examination and ICP, much like that of the grid after Pt with
H2. The nearly-constant OH group concentration also supports the O2-based Pt ALD mechanism
proposed by Setthapun et al., who suggested that halfway through the second cycle, new
PtMe3(MeCp) molecules start bonding to Pt-O species instead of OH groups. They observed this
trend by monitoring the Pt EXAFS spectra, with no direct measurement of the OH groups, but
here we monitored the OH concentration and arrive at a similar conclusion. Their EXAFS
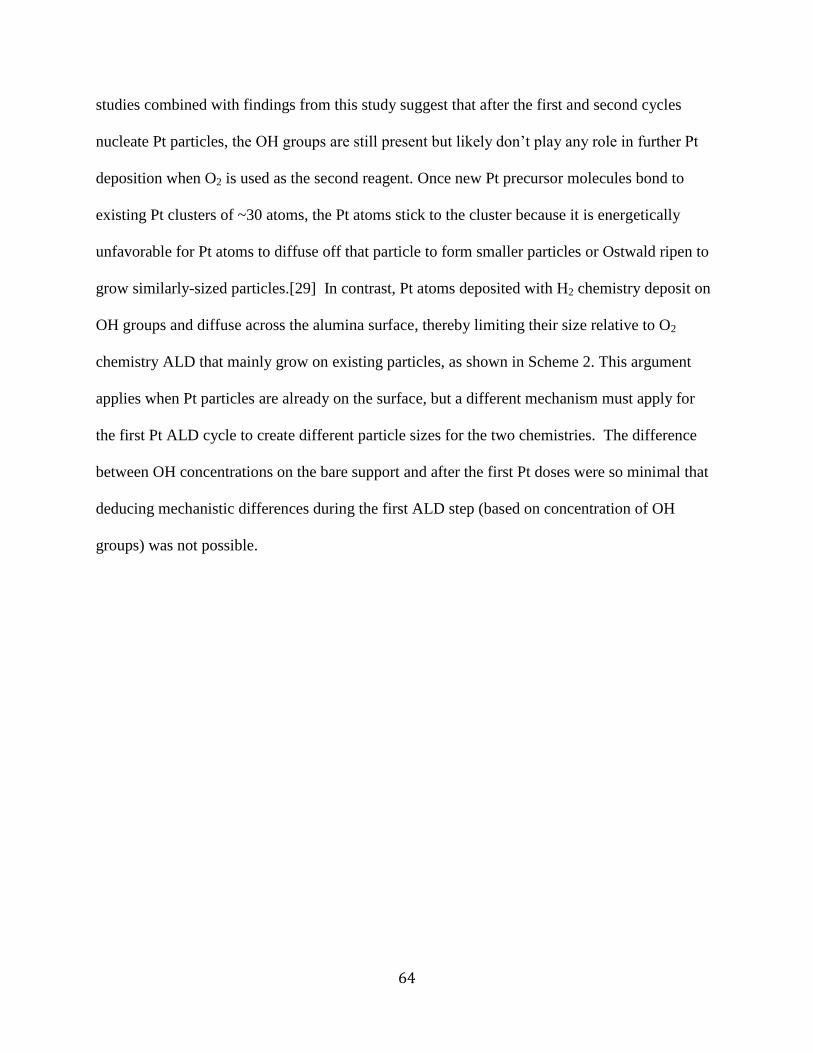
64
studies combined with findings from this study suggest that after the first and second cycles
nucleate Pt particles, the OH groups are still present but likely don’t play any role in further Pt
deposition when O2 is used as the second reagent. Once new Pt precursor molecules bond to
existing Pt clusters of ~30 atoms, the Pt atoms stick to the cluster because it is energetically
unfavorable for Pt atoms to diffuse off that particle to form smaller particles or Ostwald ripen to
grow similarly-sized particles.[29] In contrast, Pt atoms deposited with H2 chemistry deposit on
OH groups and diffuse across the alumina surface, thereby limiting their size relative to O2
chemistry ALD that mainly grow on existing particles, as shown in Scheme 2. This argument
applies when Pt particles are already on the surface, but a different mechanism must apply for
the first Pt ALD cycle to create different particle sizes for the two chemistries. The difference
between OH concentrations on the bare support and after the first Pt doses were so minimal that
deducing mechanistic differences during the first ALD step (based on concentration of OH
groups) was not possible.
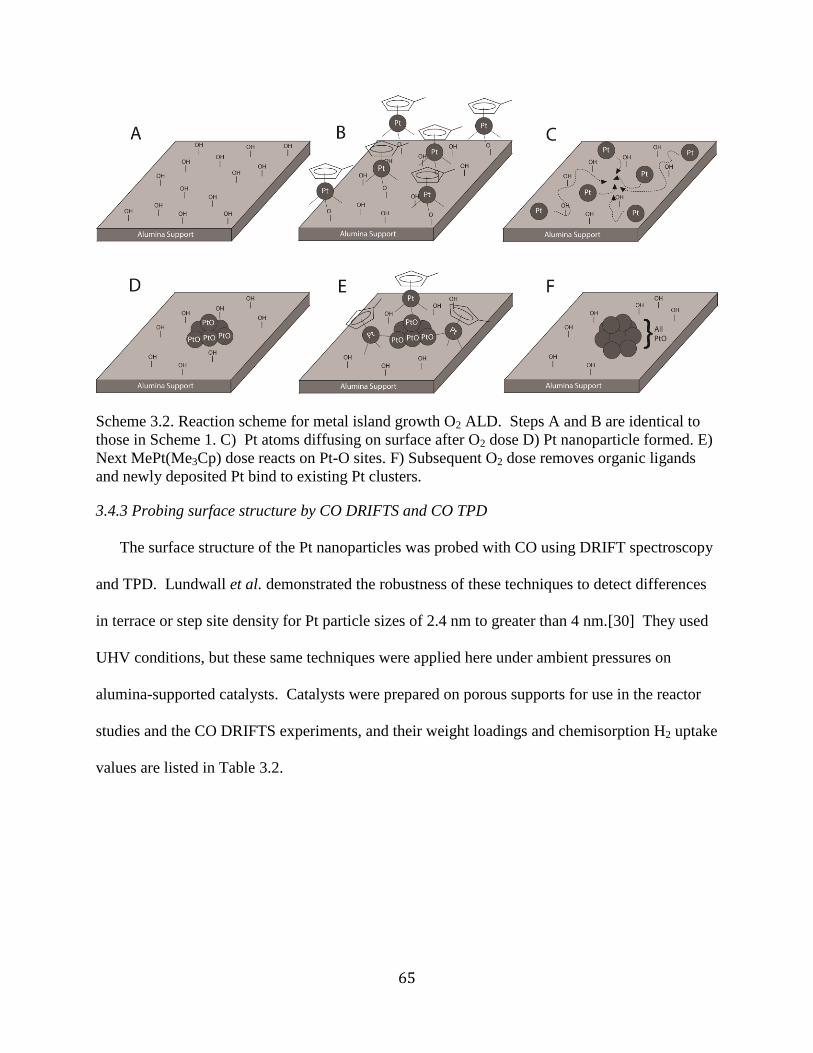
65
Scheme 3.2. Reaction scheme for metal island growth O2 ALD. Steps A and B are identical to
those in Scheme 1. C) Pt atoms diffusing on surface after O2 dose D) Pt nanoparticle formed. E)
Next MePt(Me3Cp) dose reacts on Pt-O sites. F) Subsequent O2 dose removes organic ligands
and newly deposited Pt bind to existing Pt clusters.
3.4.3 Probing surface structure by CO DRIFTS and CO TPD
The surface structure of the Pt nanoparticles was probed with CO using DRIFT spectroscopy
and TPD. Lundwall et al. demonstrated the robustness of these techniques to detect differences
in terrace or step site density for Pt particle sizes of 2.4 nm to greater than 4 nm.[30] They used
UHV conditions, but these same techniques were applied here under ambient pressures on
alumina-supported catalysts. Catalysts were prepared on porous supports for use in the reactor
studies and the CO DRIFTS experiments, and their weight loadings and chemisorption H2 uptake
values are listed in Table 3.2.

66
Table 3.2. Catalyst properties for Pt ALD deposited on porous Al2O3
Catalyst
H2 Adsorbed
(μmol · gcatalyst-1
)
Pt Weight
Loading (%)
H:Pt ratio
(mol H ·mol Pttotal-1
)
1 cycle Pt ALD with H2 62 1.4 1.7
1 cycle Pt ALD with O2 58 1.4 1.6
5 cycle Pt ALD with H2 103 3.0 1.3
5 cycle Pt ALD with O2 167 7.4 0.9
The Pt particles deposited on the porous supports were in general smaller than those prepared
on the nanosphere alumina previously mentioned. The largest particles, synthesized by 5 cycles
of Pt ALD with O2, only had Pt diameters of ~1.3 nm, but calculating particle size when the H:Pt
ratio exceeds unity results in an underestimation of particle size, and therefore was not reported
(the H:Pt ratio exceeds 1 if the particle size is below 1.1 nm). As particle size decreases, the
ability for under-coordinated Pt to adsorb more than one H atom per active site increases, and
therefore the H:Pt ratio increases with decreasing particle size.[27] The H:Pt ratio observed for
the 1-cycle Pt ALD catalyst (with H2) is in agreement with theoretical H:Pt ratios associated with
raft-type Pt clusters of ~10 atoms. The smaller particle size on the porous support than on the
non-porous nanospheres could be due to differences in OH surface concentration, curvature
effects from the nanospheres, or diffusion limitations of the Pt precursor on the porous support.
An in-depth study would need to be carried out to investigate why the particle sizes differed
between the two substrates, but the general particle size trends were the same on each substrate.
Measuring the size of these small clusters can be challenging, but CO DRIFTS can help
elucidate the average coordination number of the Pt clusters, and like H:Pt ratio, the CO
stretching frequency is related to particle size. The two main features in the CO DRIFT spectra

67
were around 1815-1850 cm-1
and 2040-2075 cm-1
(spectra are shown in Supplemental Figure
3.S1). The peaks around ~1825 cm-1
correspond to bridge-bonded CO, whereas the other feature
corresponds to CO linearly-bonded to an atop site at a step edge,[31] and linearly-bonded CO on
a terrace site typically occurs for Pt(111) around 2065 – 2100 cm-1
. The frequencies reported in
Figure 3.4 were measured at a CO pressure of ~180 Pa or higher, whereas at a pressure of 10.7
Pa, only one peak at 2017 cm-1
was observed for the 1-cycle sample, at 2042 cm-1
for the 5-cycle
sample (CO DRIFTS at several CO pressures are shown in Supplemental Figure 3.S2). These
shifts as a function of CO coverage were consistent with shifts due to dipole-coupling between
CO molecules.[32, 33] The CO stretching peak position is plotted against H:Pt ratio in Figure
3.4, The prominent step-site IR feature of the ALD catalysts indicates that the concentration
of step sites and other undercoordinated sites is high on these ~1.0 nm particles. Additionally,
the bridge-bonded CO feature (around 1850 cm-1
) was minimal for the ALD catalysts because
the particles are too small to have many sites on which CO could form a bridge conformation.
Kappers and van der Maas investigated the variation of CO frequencies with coordination of Pt
atoms, and assigned a coordination number of 5 to a CO adsorption peak at 2035 cm-1
,[34] which
is nearly identical to the peak location for the Pt catalyst produced from one ALD cycle with H2.
Additionally, the peak at 2047 cm-1
corresponds to an average coordination number of 6 for the
5-cycle ALD sample. The CO stretching frequencies for the catalysts are plotted against H:Pt
ratio in Figure 3.4, and as expected, the frequency decreases as H:Pt ratio increases as the
particles become smaller. A sample of the 5-cycle Pt ALD (O2) catalyst was intentionally
sintered to 1.6 nm (by treating in 100% H2 for 4 h at 873 K) to show the effect of a slightly larger
particle in the CO DRIFTS experiments and for catalytic evaluation.

68
Figure 3.4. Carbon monoxide stretching frequencies from DRIFTS as a function of H:Pt ratios
from chemisorption for several ALD catalysts.
The structures of the catalysts were further probed by CO-TPD. to elucidate the relative
ratios of terrace sites to step sites on these small ALD catalysts. The study by Lundwall et al.
investigated particle sizes from 2.5 nm to > 4 nm. In this study, particles with a smaller size (~1
nm) were investigated and the CO TPD profiles are shown in Figure 3.5a. The commercial 5 wt
% Pt catalyst had a broad peak that is most likely composed of two separate peaks, one near 400
K corresponding to terrace site desorption and one near 450 K corresponding to step-site
desorption. These two desorption modes were also identified by Lundwall et al for similarly-
sized Pt particles.[30] All the ALD catalysts still desorbed CO as the temperature approached
550 K (shown as the trailing edge of the desorption peak), but all the CO had desorbed by 525 K
for the commercial catalyst. The ALD catalysts made with H2 each had a low temperature peak
around 350 K that was not present for the other catalysts. The broad nature of the CO desorption
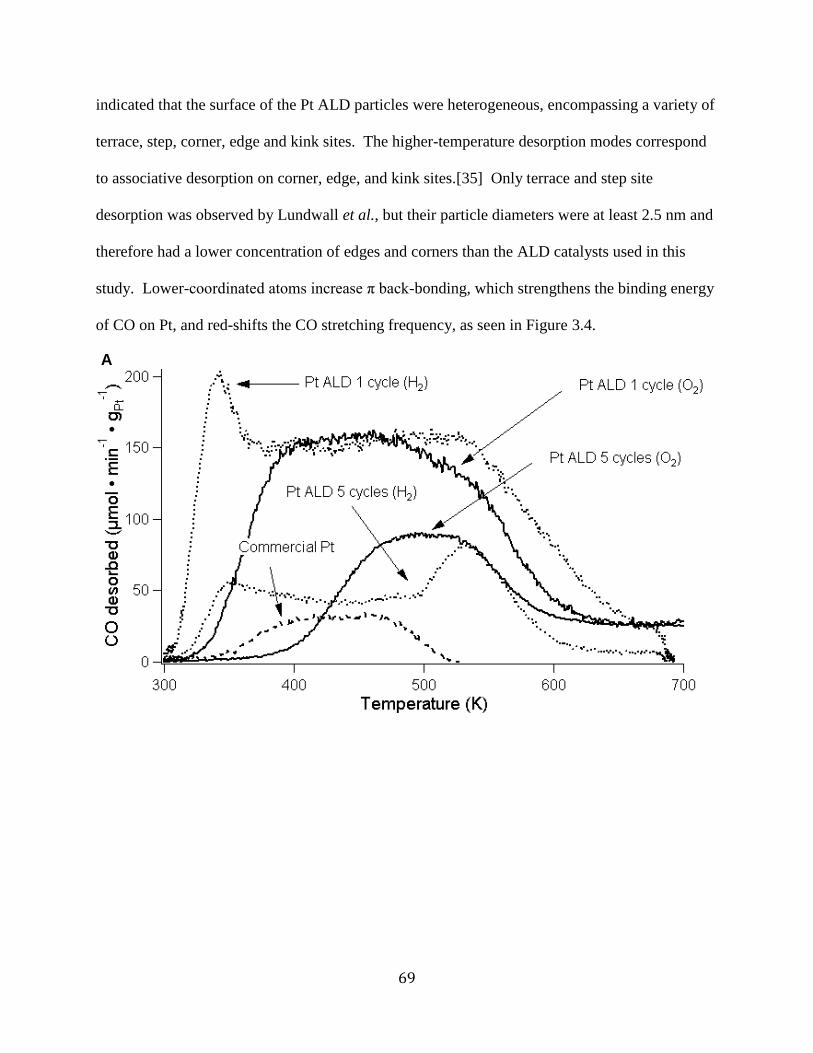
69
indicated that the surface of the Pt ALD particles were heterogeneous, encompassing a variety of
terrace, step, corner, edge and kink sites. The higher-temperature desorption modes correspond
to associative desorption on corner, edge, and kink sites.[35] Only terrace and step site
desorption was observed by Lundwall et al., but their particle diameters were at least 2.5 nm and
therefore had a lower concentration of edges and corners than the ALD catalysts used in this
study. Lower-coordinated atoms increase π back-bonding, which strengthens the binding energy
of CO on Pt, and red-shifts the CO stretching frequency, as seen in Figure 3.4.
A

70
Figure 3.5. Carbon monoxide TPD of Pt catalysts with different particle sizes: A) CO desorption,
B) CO2 desorption
The desorption temperatures of this study agree with results from CO TPD in UHV on
stepped Pt,[36, 37] and are similar to the results of CO TPD of Pt particles supported on γ-
alumina.[35, 38] The 5-cycle H2 Pt ALD sample, although it is likely slightly larger, still
exhibited many of the nanoscale features of the 1-cycle sample. This sample most likely had
some smaller particles, similar in size to the 1-cycle sample.
A significant portion of the adsorbed CO desorbed as CO2, as shown in Figure 3.5b. Carbon
dioxide can come from two reactions: 1) the water-gas shift reaction where OH groups from the
alumina support combine with CO to produce CO2 and H2 gas, and 2) the Boudard reaction in
which CO dissociates to form CO2 and surface carbon.[35, 38, 39] For all catalysts investigated,
the higher temperature CO2 desorption coincided with H2 desorption (shown in Supplemental
Figure 3.S3), indicating that the CO2 desorption proceeded through the water gas shift reaction
B
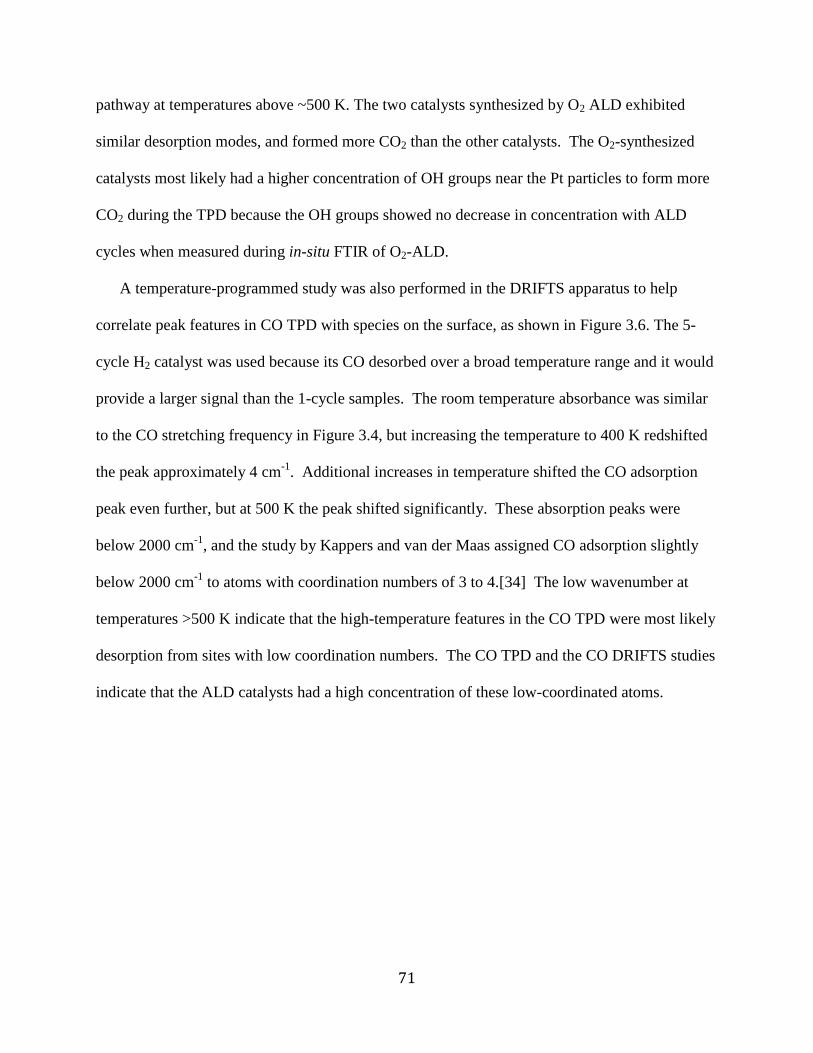
71
pathway at temperatures above ~500 K. The two catalysts synthesized by O2 ALD exhibited
similar desorption modes, and formed more CO2 than the other catalysts. The O2-synthesized
catalysts most likely had a higher concentration of OH groups near the Pt particles to form more
CO2 during the TPD because the OH groups showed no decrease in concentration with ALD
cycles when measured during in-situ FTIR of O2-ALD.
A temperature-programmed study was also performed in the DRIFTS apparatus to help
correlate peak features in CO TPD with species on the surface, as shown in Figure 3.6. The 5-
cycle H2 catalyst was used because its CO desorbed over a broad temperature range and it would
provide a larger signal than the 1-cycle samples. The room temperature absorbance was similar
to the CO stretching frequency in Figure 3.4, but increasing the temperature to 400 K redshifted
the peak approximately 4 cm-1
. Additional increases in temperature shifted the CO adsorption
peak even further, but at 500 K the peak shifted significantly. These absorption peaks were
below 2000 cm-1
, and the study by Kappers and van der Maas assigned CO adsorption slightly
below 2000 cm-1
to atoms with coordination numbers of 3 to 4.[34] The low wavenumber at
temperatures >500 K indicate that the high-temperature features in the CO TPD were most likely
desorption from sites with low coordination numbers. The CO TPD and the CO DRIFTS studies
indicate that the ALD catalysts had a high concentration of these low-coordinated atoms.
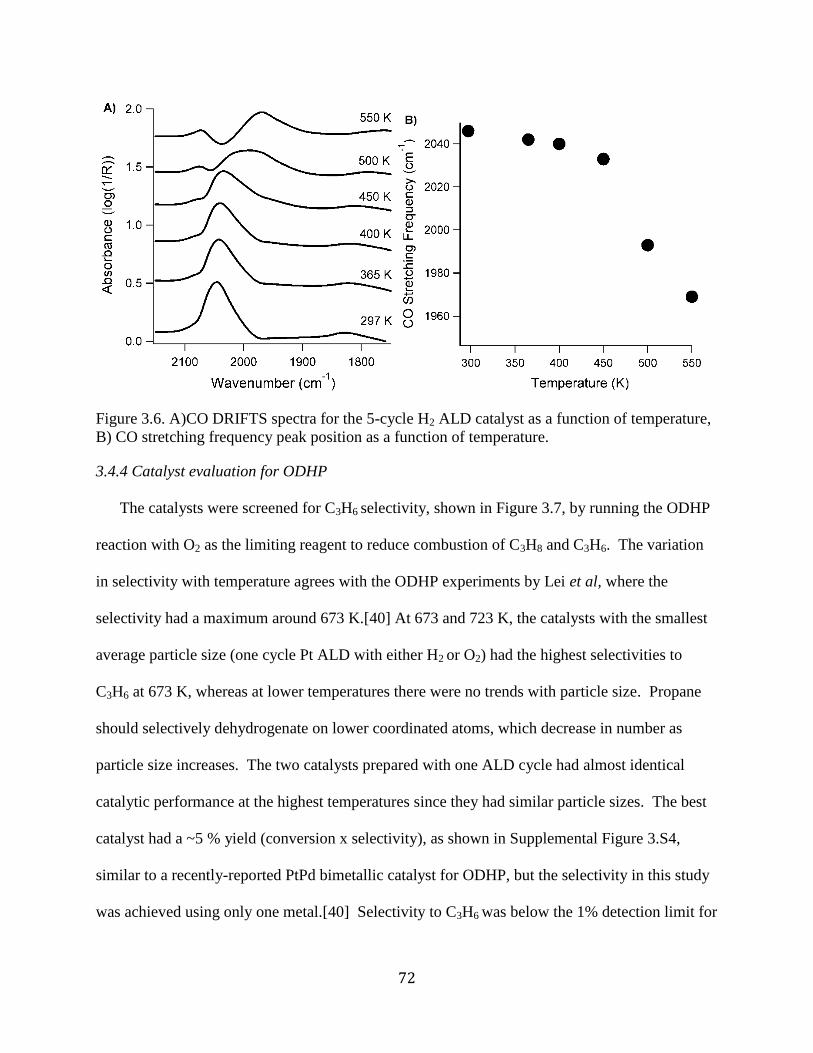
72
Figure 3.6. A)CO DRIFTS spectra for the 5-cycle H2 ALD catalyst as a function of temperature,
B) CO stretching frequency peak position as a function of temperature.
3.4.4 Catalyst evaluation for ODHP
The catalysts were screened for C3H6 selectivity, shown in Figure 3.7, by running the ODHP
reaction with O2 as the limiting reagent to reduce combustion of C3H8 and C3H6. The variation
in selectivity with temperature agrees with the ODHP experiments by Lei et al, where the
selectivity had a maximum around 673 K.[40] At 673 and 723 K, the catalysts with the smallest
average particle size (one cycle Pt ALD with either H2 or O2) had the highest selectivities to
C3H6 at 673 K, whereas at lower temperatures there were no trends with particle size. Propane
should selectively dehydrogenate on lower coordinated atoms, which decrease in number as
particle size increases. The two catalysts prepared with one ALD cycle had almost identical
catalytic performance at the highest temperatures since they had similar particle sizes. The best
catalyst had a ~5 % yield (conversion x selectivity), as shown in Supplemental Figure 3.S4,
similar to a recently-reported PtPd bimetallic catalyst for ODHP, but the selectivity in this study
was achieved using only one metal.[40] Selectivity to C3H6 was below the 1% detection limit for

73
the commercial Pt particles with an average particle size of 3.6 nm. The catalysts all stabilized
within 2 h reaction time following a temperature increase, and showed no indication of further
deactivation once at steady state. An example of the C3H6 mass signal versus time is shown in
Supplemental Figure 3.S5.
Figure 3.7. Selectivity to C3H6 vs. temperature for Pt ALD catalysts in the ODHP reaction. Error
bars represent standard deviation from multiple experiments. The same catalyst weight and
approximate space velocity were used for all measurements.
All the catalysts that had detectable ODH activity also produced H2, which could have
hydrogenated some of the C3H6 back to propane, since the O2 was entirely exhausted during the
reaction and not available to form water. Hydrogen production during ODH has been reported
recently for a variety of catalysts,[7] and can be produced from catalytic dehydrogenation further
down the catalyst bed once the O2 has been exhausted, or the H2 could come from the the water
gas shift reaction if any CO was produced. Catalytic dehydrogenation was investigated by
0
5
10
15
20
25
30
35
40
45
573 623 673 723
C3H
6S
ele
ctivity (
%)
Temperature (K)
1 cycle Pt (H2) 1 cycle Pt (O2) 5 cycles Pt (H2)
5 cycles Pt (O2) Sintered Pt 5 cycle
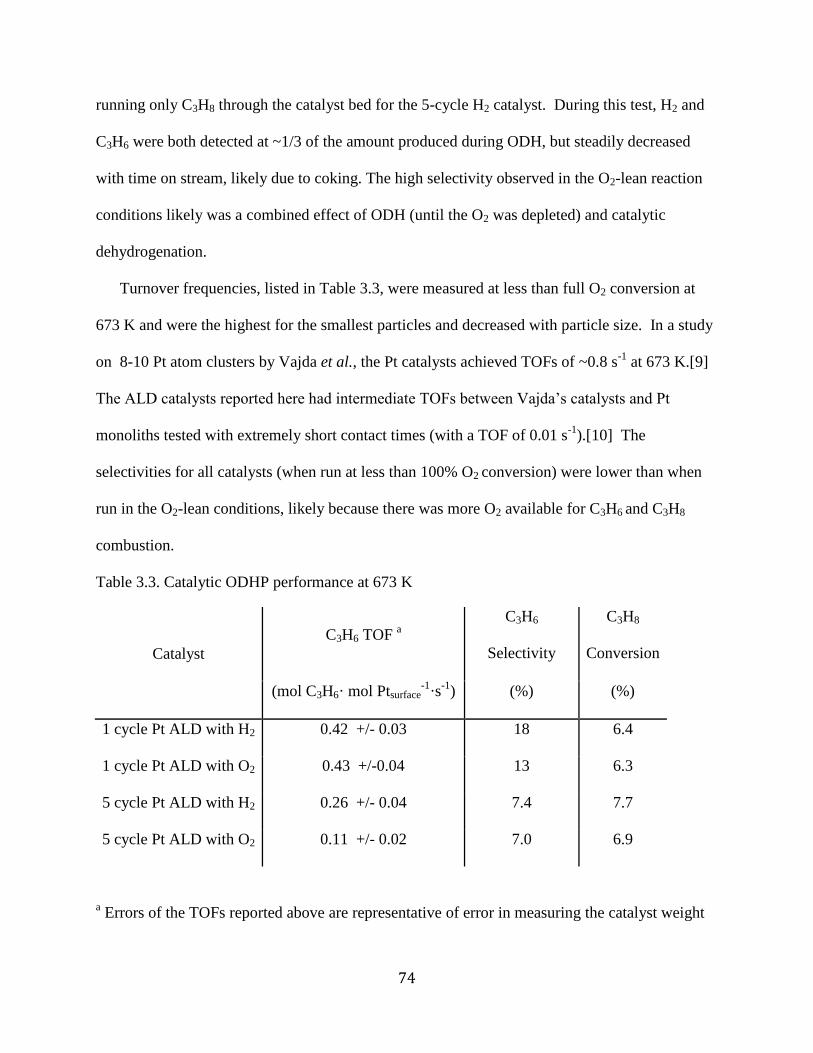
74
running only C3H8 through the catalyst bed for the 5-cycle H2 catalyst. During this test, H2 and
C3H6 were both detected at ~1/3 of the amount produced during ODH, but steadily decreased
with time on stream, likely due to coking. The high selectivity observed in the O2-lean reaction
conditions likely was a combined effect of ODH (until the O2 was depleted) and catalytic
dehydrogenation.
Turnover frequencies, listed in Table 3.3, were measured at less than full O2 conversion at
673 K and were the highest for the smallest particles and decreased with particle size. In a study
on 8-10 Pt atom clusters by Vajda et al., the Pt catalysts achieved TOFs of ~0.8 s-1
at 673 K.[9]
The ALD catalysts reported here had intermediate TOFs between Vajda’s catalysts and Pt
monoliths tested with extremely short contact times (with a TOF of 0.01 s-1
).[10] The
selectivities for all catalysts (when run at less than 100% O2 conversion) were lower than when
run in the O2-lean conditions, likely because there was more O2 available for C3H6 and C3H8
combustion.
Table 3.3. Catalytic ODHP performance at 673 K
Catalyst
C3H6 TOF a
C3H6
Selectivity
C3H8
Conversion
(mol C3H6· mol Ptsurface-1
·s-1
) (%) (%)
1 cycle Pt ALD with H2 0.42 +/- 0.03 18 6.4
1 cycle Pt ALD with O2 0.43 +/-0.04 13 6.3
5 cycle Pt ALD with H2 0.26 +/- 0.04 7.4 7.7
5 cycle Pt ALD with O2 0.11 +/- 0.02 7.0 6.9
a Errors of the TOFs reported above are representative of error in measuring the catalyst weight

75
3.5 Conclusions
Platinum nanoparticles particle could be synthesized between ~ 1 and 2.5 nm by varying the
chemistry (O2 or H2) and number of cycles used. These catalysts were selective for oxidative
dehydrogenation of propylene, with the smallest particles having the highest C3H6 TOFs , which
were about half of the values reported for 8-10 atom clusters reported in literature. The
differences between the second half-reaction chemistries used to produce these catalysts were
probed via in situ IR, which showed gradual depletion of OH groups when H2 was used, but
relatively little change when the ALD was done with O2. The type of surface atom was also
found to vary with particle size, and these features were studied by CO DRIFTS and CO TPD.
The catalyst with more lower-coordinated surface features (identified by CO DRIFTS) correlated
with higher ODHP selectivity and activity at 673 K. The smallest particle sizes had the highest
selectivity (37%) and TOF to C3H6 at ~0.42 s-1
. These small particle sizes are achievable
through the facile ALD synthesis, and these ALD catalysts had much higher TOFs than mostly
Pt (111)-terminated surfaces.
3.6 References
[1] G.A. Somorjai, H. Frei, J.Y. Park, Journal of the American Chemical Society 131 (2009)
16589-16605.
[2] G.A. Somorjai, R.L. York, D. Butcher, J.Y. Park, Physical Chemistry Chemical Physics 9
(2007) 3500-3513.
[3] Y. Li, G.A. Somorjai, Nano Letters 10 (2010) 2289-2295.
[4] E.L. Hu, S.M. Davis, R. Davis, E. Scher, Applications: Catalysis by Nanostructured
Materials: Nanotechnology Research Directions for Societal Needs in 2020, in, Springer
Netherlands, 2011, pp. 445-466.
[5] Ceresana, Market Study: Propylene (UC-1705), in, Ceresana, 2011.
[6] A. Corma, F. Melo, L. Sauvanaud, F. Ortega, Catalysis Today 107 (2005) 699-706.
[7] F. Cavani, N. Ballarini, A. Cericola, Catalysis Today 127 (2007) 113-131.
[8] R.A. Van Santen, Accounts of Chemical Research 42 (2008) 57-66.
[9] S. Vajda, M.J. Pellin, J.P. Greeley, C.L. Marshall, L.A. Curtiss, G.A. Ballentine, J.W. Elam,
S. Catillon-Mucherie, P.C. Redfern, F. Mehmood, P. Zapol, Nat Mater 8 (2009) 213-216.
[10] B. Silberova, M. Fathi, A. Holmen, Applied Catalysis A: General 276 (2004) 17-28.
76
[11] M. Gharibi, F.T. Zangeneh, F. Yaripour, S. Sahebdelfar, Applied Catalysis A: General 443-
444 (2012) 8-26.
[12] G.A. Somorjai, Y.G. Borodko, Catalysis Letters 76 (2001) 1-5.
[13] J.D. Aiken Iii, R.G. Finke, Journal of Molecular Catalysis A: Chemical 145 (1999) 1-44.
[14] F. Bozon-Verduraz, F. Fiévet, J.-Y. Piquemal, R. Brayner, K. El Kabouss, Y. Soumare, G.
Viau, G. Shafeev, Brazilian Journal of Physics 39 (2009) 134-140.
[15] T. Aaltonen, M. Ritala, T. Sajavaara, J. Keinonen, M. Leskela¨, Chemistry of Materials 15
(2003) 1924-1928.
[16] S.T. Christensen, J.W. Elam, F.A. Rabuffetti, Q. Ma, S.J. Weigand, B. Lee, S. Seifert, P.C.
Stair, K.R. Poeppelmeier, M.C. Hersam, M.J. Bedzyk, Small 5 (2009) 750-757.
[17] J. Li, X. Liang, D.M. King, Y.-B. Jiang, A.W. Weimer, Applied Catalysis B: Environmental
97 (2010) 220-226.
[18] Y. Zhou, D.M. King, X. Liang, J. Li, A.W. Weimer, Applied Catalysis B: Environmental
101 (2010) 54-60.
[19] W. Setthapun, W.D. Williams, S.M. Kim, H. Feng, J.W. Elam, F.A. Rabuffetti, K.R.
Poeppelmeier, P.C. Stair, E.A. Stach, F.H. Ribeiro, J.T. Miller, C.L. Marshall, The Journal of
Physical Chemistry C 114 (2010) 9758-9771.
[20] W. Kessels, H. Knoops, S. Dielissen, A. Mackus, M. van de Sanden, Applied Physics
Letters 95 (2009) 013114-013114-013113.
[21] N. Aaron Deskins, D. Mei, M. Dupuis, Surface Science 603 (2009) 2793-2807.
[22] M. Corral Valero, P. Raybaud, P. Sautet, The Journal of Physical Chemistry B 110 (2006)
1759-1767.
[23] D.M. King, J.A. Spencer Ii, X. Liang, L.F. Hakim, A.W. Weimer, Surface and Coatings
Technology 201 (2007) 9163-9171.
[24] T.D. Gould, A.M. Lubers, B.T. Neltner, J.V. Carrier, A.W. Weimer, J.L. Falconer, J. Will
Medlin, Journal of Catalysis 303 (2013) 9-15.
[25] A.J.M. Mackus, N. Leick, L. Baker, W.M.M. Kessels, Chemistry of Materials 24 (2012)
1752-1761.
[26] K.L. Miller, C.W. Lee, J.L. Falconer, J.W. Medlin, Journal of Catalysis 275 (2010) 294-
299.
[27] B.J. Kip, F.B.M. Duivenvoorden, D.C. Koningsberger, R. Prins, Journal of Catalysis 105
(1987) 26-38.
[28] S.D. Elliott, J.C. Greer, Journal of Materials Chemistry 14 (2004) 3246-3250.
[29] Y. Zhou, C.L. Muhich, B.T. Neltner, A.W. Weimer, C.B. Musgrave, The Journal of
Physical Chemistry C 116 (2012) 12114-12123.
[30] M.J. Lundwall, S.M. McClure, D.W. Goodman, The Journal of Physical Chemistry C 114
(2010) 7904-7912.
[31] N. Lebedeva, A. Rodes, J. Feliu, M. Koper, R. Van Santen, The Journal of Physical
Chemistry B 106 (2002) 9863-9872.
[32] C.A. Schoenbaum, D.K. Schwartz, J.W. Medlin, Journal of Catalysis 303 (2013) 92-99.
[33] R.M. Hammaker, S.A. Francis, R.P. Eischens, Spectrochimica Acta 21 (1965) 1295-1309.
[34] M.J. Kappers, J.H. Maas, Catalysis Letters 10 (1991) 365-373.
[35] A. Tanksale, J.N. Beltramini, J.A. Dumesic, G.Q. Lu, Journal of Catalysis 258 (2008) 366-
377.
[36] G.S. Zafiris, R.J. Gorte, Journal of Catalysis 140 (1993) 418-423.
[37] J. Xu, J.T. Yates Jr, Surface Science 327 (1995) 193-201.
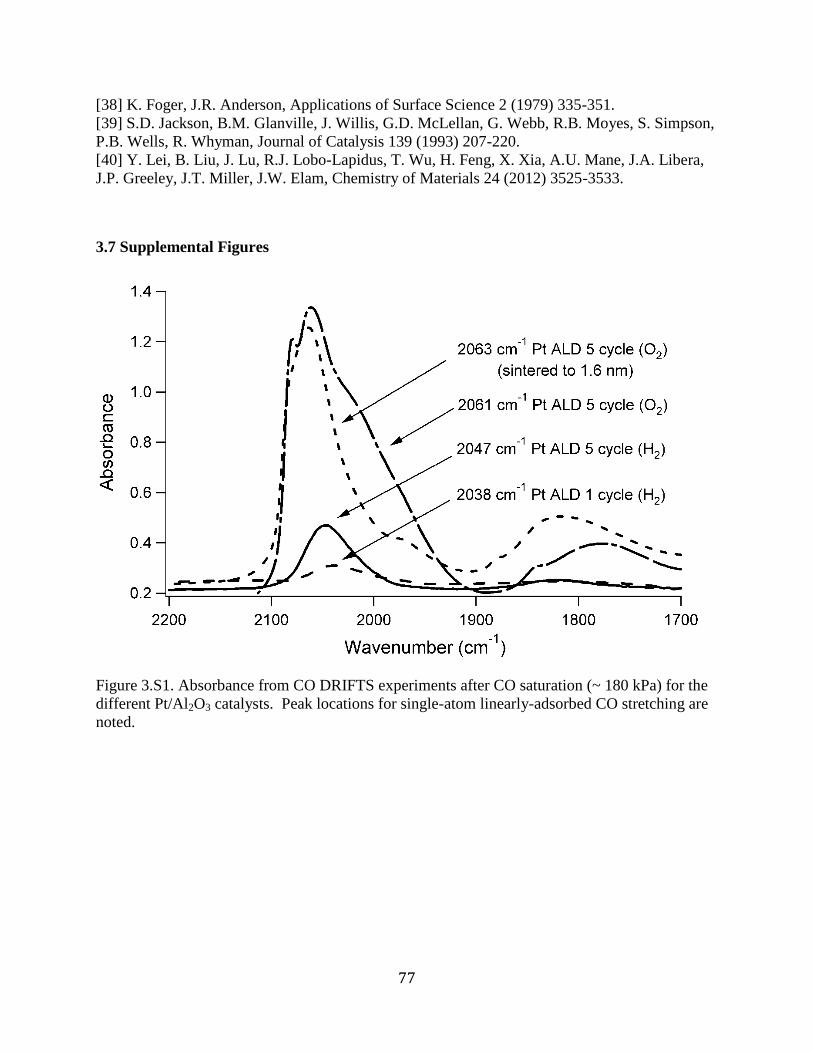
77
[38] K. Foger, J.R. Anderson, Applications of Surface Science 2 (1979) 335-351.
[39] S.D. Jackson, B.M. Glanville, J. Willis, G.D. McLellan, G. Webb, R.B. Moyes, S. Simpson,
P.B. Wells, R. Whyman, Journal of Catalysis 139 (1993) 207-220.
[40] Y. Lei, B. Liu, J. Lu, R.J. Lobo-Lapidus, T. Wu, H. Feng, X. Xia, A.U. Mane, J.A. Libera,
J.P. Greeley, J.T. Miller, J.W. Elam, Chemistry of Materials 24 (2012) 3525-3533.
3.7 Supplemental Figures
Figure 3.S1. Absorbance from CO DRIFTS experiments after CO saturation (~ 180 kPa) for the
different Pt/Al2O3 catalysts. Peak locations for single-atom linearly-adsorbed CO stretching are
noted.

78
Figure 3.S2. CO DRIFTS spectra for catalyst at varying CO pressures (different pressures are
labeled): A) 1 cycle Pt ALD (with H2), B) 5 cycles Pt ALD (with H2)
B
A
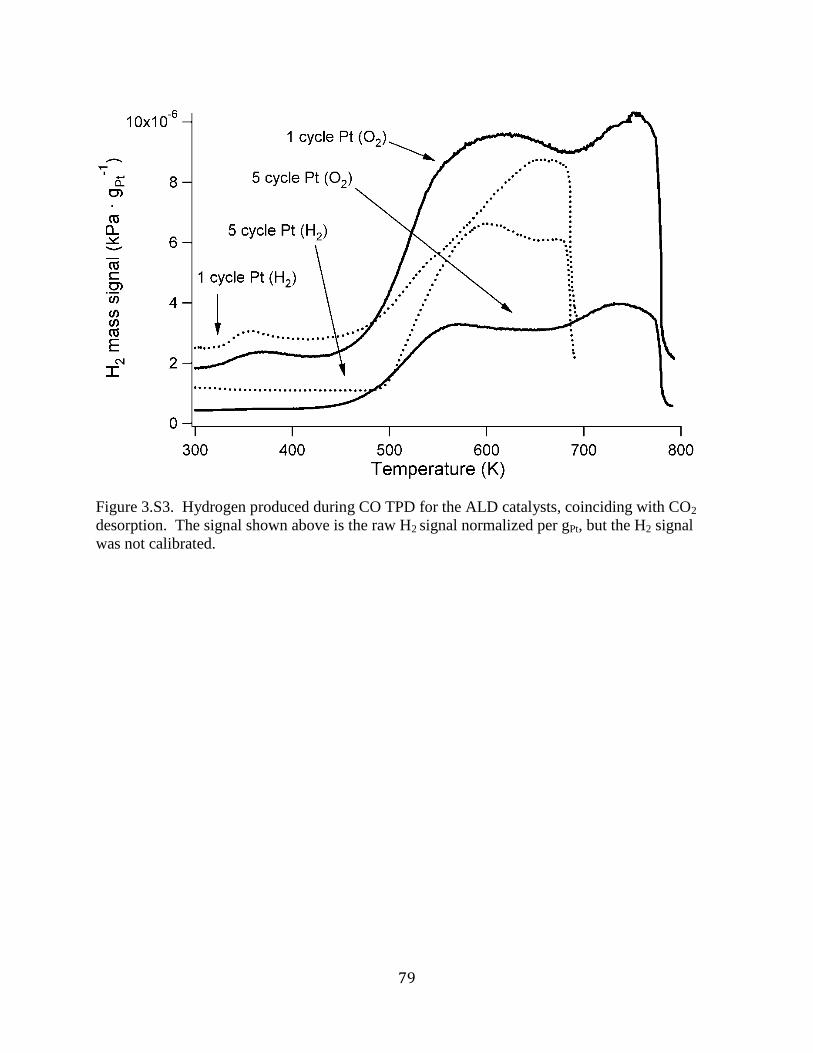
79
Figure 3.S3. Hydrogen produced during CO TPD for the ALD catalysts, coinciding with CO2
desorption. The signal shown above is the raw H2 signal normalized per gPt, but the H2 signal
was not calibrated.

80
Figure 3.S4. Yield of C3H6 during ODHP on the Pt ALD catalysts in O2-lean reaction
conditions.
Figure 3.S5. ODHP reaction vs time for three temperatures on the Pt ALD 5-cycle (H2) catalyst.
0
1
2
3
4
5
6
7
573 623 673 723
C3H
6Y
ield
(%
)
Temperature (K)
1 cycle Pt (H2) 1 cycle Pt (O2) 5 cycles Pt (H2) 5 cycles Pt (O2)
81
Chapter 4: Enhanced Dry Reforming of Methane on Ni and Ni-Pt Catalysts
Synthesized by Atomic Layer Deposition
Submitted to Journal of Catalysis (January 2014)
4.1. Abstract
Atomic layer deposition (ALD) was used to deposit Ni and Pt on alumina supports to
form monometallic and bimetallic catalysts with initial particle sizes of 1 to 2.4 nm. The ALD
catalysts were more active (per mass of metal) than catalysts prepared by incipient wetness (IW)
for dry reforming of methane (DRM), and they did not form carbon whiskers during reaction due
to their sufficiently small size. Catalysts modified by Pt ALD had higher rates of reaction per
mass of metal and inhibited coking, whereas NiPt catalysts synthesized by IW still formed
carbon whiskers. Temperature-programmed reduction of Ni catalysts modified by Pt ALD
indicated the presence of bimetallic interaction. Density functional theory calculations suggested
that under reaction conditions, the NiPt surfaces form Ni-terminated surfaces that are associated
with higher DRM rates (due to their C and O adsorption energies, as well as the CO formation
and CH4 dissociation energies).
4.2. Introduction
Recent advances in natural gas recovery and the associated drop in price of natural gas
have drawn much attention to methane steam reforming and dry reforming of methane (DRM)
with CO2. Increases in global demand for transportation grade fuels and efforts to cap the
amount of gas released or burned in blowouts have made gas to liquids (GTL) technologies more
attractive.[1] The most widely used and economically viable GTL process is Fischer-Tropsch
(F-T), which requires a syngas feed stream that is produced mainly by methane reforming.[1, 2]
82
Nickel, which is the primary catalyst used for these reforming reactions, is plagued by
deactivation due to sintering and coking.[3, 4] Sintering decreases the metal surface area, and
coking can build up enough carbon to clog or alter flow in reactors, cause overheating in tubular
reformers, and destroy catalyst particles.[3, 5] The carbon whiskers formed during coking do not
strongly affect the reforming rate initially because the carbon diffuses from the Ni active surface
to the rear of the particle where the carbon whisker is attached.[3, 6] Reforming reactions are
typically run at 973 to 1073 K to thermodynamically limit the reverse water-gas shift (RWGS)
side reaction and coking from the Boudard reaction, but these high temperatures exacerbate
sintering and are energy-intensive.[7] Promoters, such as K and Au, limit coking by acting as
step-edge site blockers or by decreasing the carbon adsorption energy to prevent carbon
nucleation on the catalyst.[5, 8] A recent density functional theory (DFT) study on graphite
formation from CH4 decomposition indicated that carbon preferentially nucleates on Ni(211)
step edges as opposed to terrace sites.[5] This study also calculated that a Ni step edge must be
longer than 2.5 nm to form a stable carbon cluster from which more carbon can grow.
Several studies have shown that adding Pt to Ni catalysts improves DRM activity and
stability at temperatures of 773 to 973 K.[9-11] Platinum can increase activity by increasing the
reducibility of NiO species in close proximity to Pt; H and CO form on Pt and spill over to
reduce NiO.[12] Additionally, Pt has been shown to limit coking, so that more active surface
area is available for reaction.[13] Islands of Pt on the Ni surface or Pt in a surface alloy decrease
the ensemble size of Ni regions and thus limit coking, which is more prevalent on larger Ni
particles. Platinum also limits the amount of carbon whisker growth due to the low solubility of
carbon in Pt and the low adsorption strength of carbon on Pt compared to Ni.[3, 14] Carbon
whiskers grow on Ni when carbon diffuses across the surface and through sub-surface layers to
83
find favorable step-edge facets from which to grow.[3] According to previous DFT calculations,
the barriers for diffusion across the surface (137 kJ/mol) and subsurface diffusion (150 kJ/mol)
are much smaller than the 225 kJ/mol barrier for carbon diffusion in bulk Ni. [15]
Typical Ni and NiPt bimetallic catalysts have been prepared by precipitation, incipient
wetness impregnation, microemulsion, or other solution-based techniques.[9, 10, 13] In the
current study, Ni and NiPt bimetallic catalysts for the DRM reaction were synthesized by atomic
layer deposition (ALD) with the goal of increasing the activity and resistance to coking over
traditionally-prepared catalysts. Aaltonen et al. first deposited Pt films by ALD using hundreds
of cycles of Me(Me3Cp)Pt and O2.[16] Since that time, much research has focused on creating
Pt nanoparticles with less than 10 cycles of Pt ALD on metal oxide supports.[17-20] Ruthenium,
Pd, RuPt, and PdPt bimetallic catalysts were also deposited on metal oxide supports using ALD
in recent years.[21-23] With the exception of one study of Pt ALD that used H2 as the second
half-cycle reagent,[19] all other noble metal nanoparticle formation by ALD used O2 or
formalin.[18, 20-24] Previous work demonstrated recently[25] that Ni ALD could also be
performed with H2.
In the present study, catalysts with approximately 2.4 nm Ni particles were synthesized
by ALD, and their performance in DRM was compared to catalysts prepared by IW
impregnation. The ALD-prepared catalysts had higher DRM rate per g-metal because of a
higher active surface area. They also exhibited enhanced coking resistance. Catalysts prepared
by ALD did not form carbon whiskers after 72 h of reaction at 873 K, whereas IW-prepared Ni
catalysts readily formed these destructive carbon whiskers. Catalysts with even higher activity,
stability, and coking resistance were prepared by adding Pt with ALD to create bimetallic
catalysts with high dispersions to maximize the bimetallic effect. We characterized the structure

84
of bimetallic NiPt ALD catalysts using temperature-programmed studies, microscopy and
specific chemisorption. Although the benefits of adding Pt to Ni DRM catalysts using methods
other than ALD are known, reasons for the enhanced performance are not well understood, and
thus DFT was used to elucidate why these structures provide enhanced DRM activity and coking
resistance.
4.3. Experimental Methods
4.3.1 Catalyst synthesis.
Nickel and Pt particles were formed on alumina supports by ALD. Two alumina
supports were used: a nonporous alumina (Aldrich 544833 gamma alumina, ∼40 m2/g BET
surface area, ~45-nm diameter spheres) and a porous gamma alumina (Albemarle MARTOXID
AN/I, ~150 m2/g BET surface area, ~75-μm particle diameters). The Ni ALD was performed in
a stainless steel fluidized bed reactor (FBR) described elsewhere.[25, 26] The Pt ALD was
performed in a quartz tube FBR (6-mm inner diameter) with a quartz glass frit of 40-μm pore
size that supported the powder bed. The powder was fluidized in this reactor at approximately
0.25-Pa pressure with He carrier gas flow rates of 5 to 20 sccm. Platinum was deposited at 448
K, which is much lower than the typical 573 K used for Pt ALD with Me3(MeCp)Pt and O2.[18,
19, 24] In this work, H2 was used as the second reagent instead of O2 for both Ni and Pt ALD.
For bimetallic Ni + Pt ALD catalysts, the Ni particles were first deposited by incipient wetness
(IW) impregnation or by ALD. Details of the IW and ALD Ni synthesis are explained in
previous work.[25] The Ni catalysts were dried for 2 h under vacuum at 939 K before Pt was
deposited by ALD in the quartz FBR. A bimetallic NiPt catalyst was also synthesized by
sequential IW impregnation (Ni followed by Pt) using the same methodology as the Ni IW
synthesis, but using H2Pt2Cl6·6H2O as the metal precursor instead of Ni(NO3) ·6H2O.
85
4.3.2 Catalyst Characterization.
The catalysts were characterized by temperature-programmed studies in a quartz tube
reactor (6.35-mm inner diameter) at ramp rates of 60K /min and the effluent from the reactor was
analyzed with an SRS RGA 200 mass spectrometer. For TPR, the catalysts were first oxidized
for 2 h at 573 K and then cooled to room temperature in inert gas. The temperature subsequently
was ramped in 50 sccm of 2.5% H2 (balance Ar) while the H2 uptake was measured with the
mass spectrometer. For CO TPD, the catalysts were reduced for 2 h at 673 K, then cooled to
room temperature, dosed with CO (50 sccm 20% CO in Ar) for 10 min, and then purged with Ar
before ramping the temperature. In the case of post-reaction CO TPD experiments, the catalysts
were reacted as normal, then cooled to room temperature before dosing CO.
Transmission electron microscopy (TEM) was used to estimate catalyst particle sizes and
determine the type of carbon deposited on the surface. Particle size estimates were obtained
using Image J software to analyze images from an FEI Tecnai 12 - Spirit Biotwin TEM and a
Phillips CM-100 TEM. Samples were electrostatically adhered to copper grids with a lacey
carbon over-layer (Ted-Pella 01895 Lacey Carbon Film grids) to avoid effects of solvents from
dropcasting. Samples prepared for imaging purposes were synthesized using the same
methodology as previously mentioned, but a nonporous nanosphere alumina (Aldrich 544833
gamma alumina) was used so that the metal catalyst was on the surface of the spheres.
The weight loadings of each sample were determined by inductively coupled plasma
mass spectroscopy (ICP-MS) of samples digested in a concentrated HF/HNO3/HCl solution for
over 24 h. The number of active sites was measured with a Quantachrome AS-1 Autosorb. The
catalysts were reduced at 873 K in pure H2 for 2 h before measuring the H2 uptake to simulate the
approximate surface area of these catalysts under reaction conditions. The active metal surface

86
area and particle diameters were not estimated for bimetallic samples because the surface
composition must be known in order to attribute chemisorbed H2 to Ni or Pt; instead the H2
uptake is reported.
4.3.3 Reaction Studies.
The catalysts were evaluated for DRM activity in a quartz tube, packed bed reactor (6.35-mm
ID). The catalysts were reduced for 2 h at 673 K in 10% H2 (balance Ar), with the exception of
the IW catalyst, which was reduced at 773 K before reaction to ensure the particles were fully
reduced after they were calcined at 773 K during synthesis. All catalysts were heated to 873 K
and held at that temperature for approximately 10 min before the reactants were introduced to the
reactor. Effluent gases were analyzed by a SRI 8610c GC with a Haysep-D packed column. Gas
flow rates were 20 sccm CH4, 20 sccm CO2, and 60 sccm Ar. The amount of catalyst in the bed
was varied (typically 50 to 200 mg) to achieve similar initial CH4 conversions (35 to 40%). The
amount of catalyst, total volumetric flow rate, and CH4 and CO2 concentrations were similar to
those used in several Ni-based DRM studies.[6, 9, 10, 13, 27, 28] Most reactions were run for 12
h, but some were run for up to 72 h. At the end of the reaction time, the reactant flow was
stopped and replaced by inert carrier gas before cooling the catalysts in order to avoid additional
carbon deposition as the reactor cooled.
4.3.4 Density Functional Theory Calculations.
All DFT calculations were performed by Matthew Montemore, and details regarding the
computational methods used for those calculations can be found elsewhere.[29] Here we present
pertinent methods to aid in understanding of the results presented in section 4.4 (this section
4.3.4 is courtesy of Matthew Montemore).[29]
87
A phase diagram was generated using atomistic thermodynamics, as described in detail in
previous work.[30, 31] Briefly, the most stable surface structure at a given set of chemical
potentials is the one that minimizes the surface energy:
( )
∑
( )
(1)
The number of each species in the surface unit cell, Ni, is defined by the surface structure, while
the chemical potentials μi(T,p) are variables that depend on the temperature and pressure:
( ) ( ) ln(
) (2)
Several simplifications were made to make the phase diagram generation tractable. First,
only two metal structures were considered: (i) a pure Pt top layer, a pure Ni subsurface layer, and
NiPt bulk layers (Pt/Ni/NiPt); or (ii) a pure Pt top layer, a pure Ni subsurface layer, and NiPt
bulk layers (Ni/Pt/NiPt). Previous work has shown that one of these two metal structures is the
most stable under most O2 chemical potentials.[31] Since these two structures have the same
number of Pt and Ni atoms, terms that depend on NPt and NNi were not included in Equation 1.
Since the transition between the surface terminations occurs at a low coverage[31] (see
Figure 4.3 below), only structures with 4/9 ML or less of combinations of C, CO, and O were
considered. Their surface chemical potentials were calculated as:
( ) ( ) ( )
( ) ( )
( ) ( ) ( )
( ) ( ) Chemical potentials denoted with an asterisk indicate surface species; all other species
are in the gas phase. Gas-phase chemical potentials are referenced to the isolated molecules. To
account for coverage effects, adsorption energies calculated at 1/3 ML were used, but otherwise
adsorbate-adsorbate interactions were ignored. Since only surface structures with a single type of
adsorbate were found to be stable in the conditions tested, this is likely to be a good
approximation.
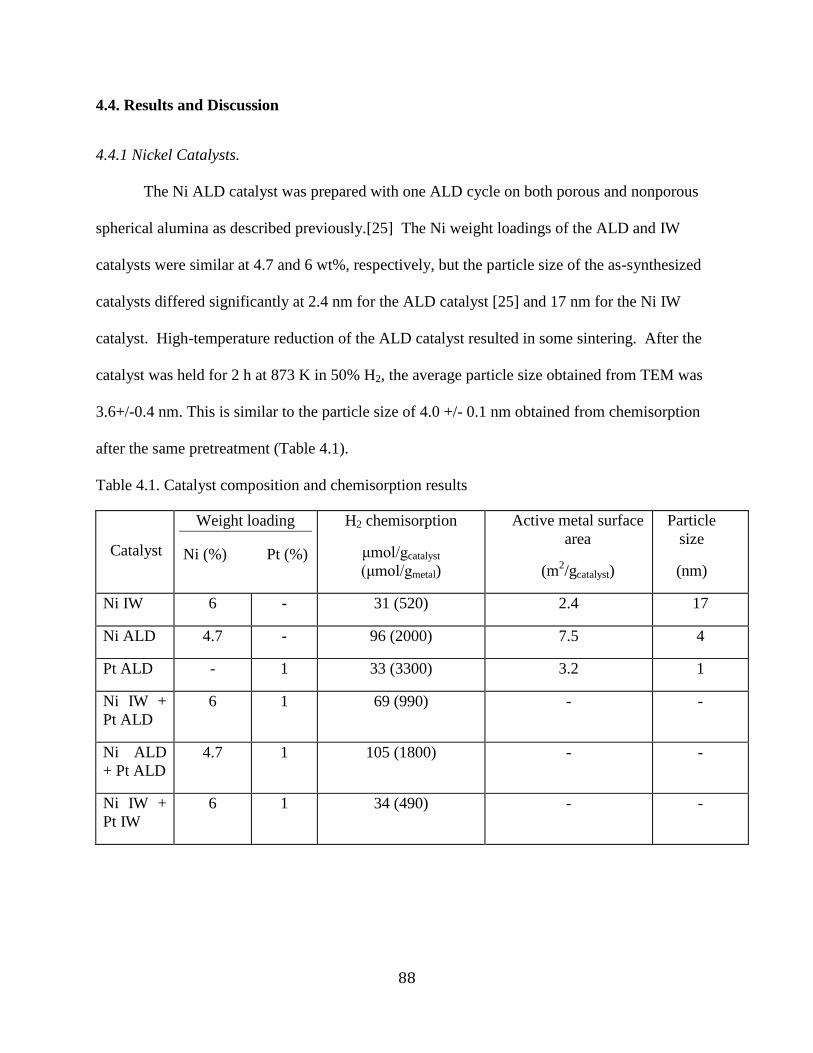
88
4.4. Results and Discussion
4.4.1 Nickel Catalysts.
The Ni ALD catalyst was prepared with one ALD cycle on both porous and nonporous
spherical alumina as described previously.[25] The Ni weight loadings of the ALD and IW
catalysts were similar at 4.7 and 6 wt%, respectively, but the particle size of the as-synthesized
catalysts differed significantly at 2.4 nm for the ALD catalyst [25] and 17 nm for the Ni IW
catalyst. High-temperature reduction of the ALD catalyst resulted in some sintering. After the
catalyst was held for 2 h at 873 K in 50% H2, the average particle size obtained from TEM was
3.6+/-0.4 nm. This is similar to the particle size of 4.0 +/- 0.1 nm obtained from chemisorption
after the same pretreatment (Table 4.1).
Table 4.1. Catalyst composition and chemisorption results
Catalyst
Weight loading
Ni (%) Pt (%)
H2 chemisorption
μmol/gcatalyst
(μmol/gmetal)
Active metal surface
area
(m2/gcatalyst)
Particle
size
(nm)
Ni IW 6 - 31 (520) 2.4 17
Ni ALD 4.7 - 96 (2000) 7.5 4
Pt ALD - 1 33 (3300) 3.2 1
Ni IW +
Pt ALD
6 1 69 (990) - -
Ni ALD
+ Pt ALD
4.7 1 105 (1800) - -
Ni IW +
Pt IW
6 1 34 (490) - -

89
Nickel catalysts synthesized by incipient wetness (IW) and ALD techniques were
evaluated for the DRM reaction. All IW-synthesized catalysts reached steady state within the
first hour, but the Ni ALD catalysts took up to 25 h to reach steady state, as shown in Figure 4.1.
The CH4 reforming rate at 873 K (normalized per gmetal) at steady state for the Ni ALD catalyst
was 1.6 times that for the IW Ni catalyst. Correspondingly, the metal surface area of the Ni
ALD catalyst (calculated using post-reaction particle size measured by TEM)[25] was
approximately 1.4 times higher than the IW catalyst surface area. Thus, the higher rate appears
to be due primarily to the higher metal surface area (calculated from post-reaction particle size).
However, comparing DRM rates normalized by surface area can over-represent the number of
surface sites when carbon blocks an indeterminable number of sites. For this reason, we
compare DRM rates normalized per gram-metal to avoid assumptions of rates normalized by
surface area.
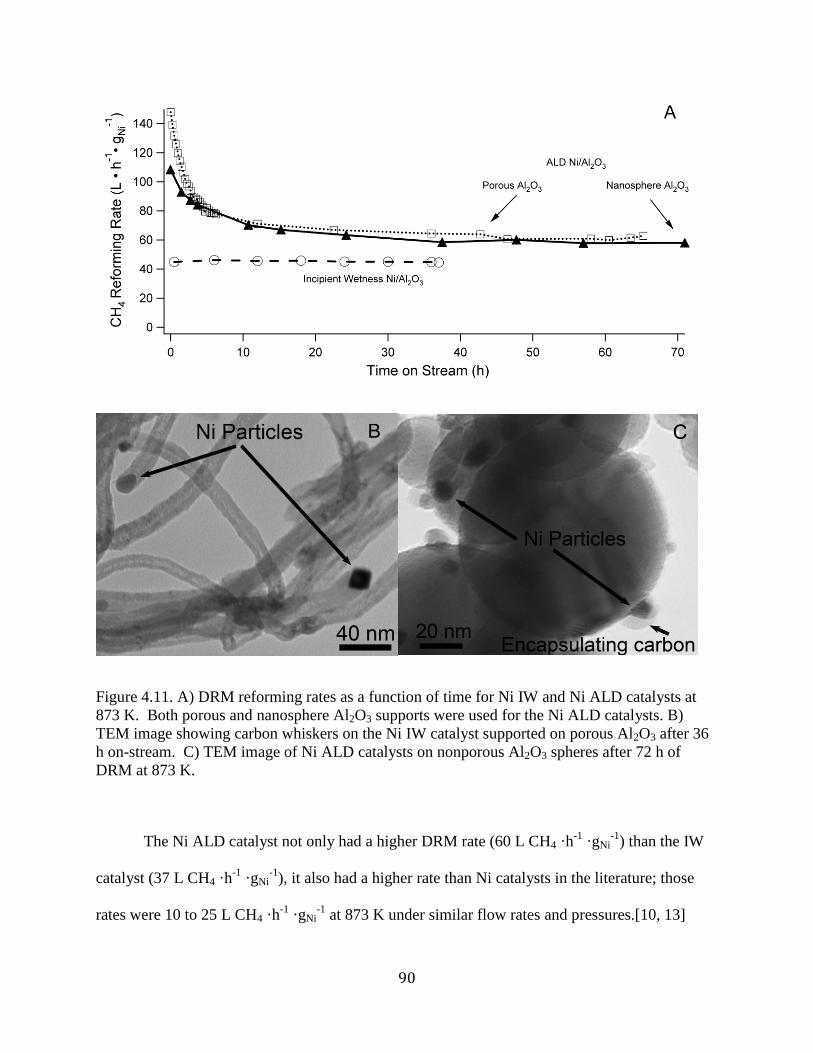
90
Figure 4.11. A) DRM reforming rates as a function of time for Ni IW and Ni ALD catalysts at
873 K. Both porous and nanosphere Al2O3 supports were used for the Ni ALD catalysts. B)
TEM image showing carbon whiskers on the Ni IW catalyst supported on porous Al2O3 after 36
h on-stream. C) TEM image of Ni ALD catalysts on nonporous Al2O3 spheres after 72 h of
DRM at 873 K.
The Ni ALD catalyst not only had a higher DRM rate (60 L CH4 ·h-1
·gNi-1
) than the IW
catalyst (37 L CH4 ·h-1
·gNi-1
), it also had a higher rate than Ni catalysts in the literature; those
rates were 10 to 25 L CH4 ·h-1
·gNi-1
at 873 K under similar flow rates and pressures.[10, 13]
91
Nickel/Al2O3 IW catalysts investigated in this study had a higher rate than other Ni/Al2O3
catalysts reported in literature due to their lower weight loading and higher dispersion. The Ni
ALD catalysts also had higher rates than a Ni/Mg(Al)O catalyst (5-6 nm Ni particles from a
hydrotalcite-derived synthesis),[32] which had reforming rates of 43 L CH4 ·h-1
·gNi-1
at similar
conditions.[28] However, the Ni ALD catalysts had lower rates than similar-sized (2 nm
initially) Ni nanoparticles of a Ni(SixOz)/CeO2 catalyst, which had a DRM rate of 270 L CO · h-1
· gNi-1
(which corresponds to ~100 to 135 L CH4 · h-1
· gNi-1
depending on the H2 to CO ratio)
after 43-h reaction time.[33] Note that the steady-state rate for the Ni ALD catalysts in Fig. 4.1a
was only reached after about 25 h, during which time the catalyst lost 59 to 67% of its activity.
The Ni ALD catalyst was then stable for up to 72 h at 873 K.
The Ni ALD activity loss during DRM at 873 Kwas smaller than that observed by
Baudouin et al. (80 to 90 %) when they used Ni/SiO2 catalysts with initial particle diameters
from 1 to 7 nm for DRM at 773 K.[27] The Ni ALD catalysts in the current study deactivated
similarly to a 2.1-nm Ni(SixOz)/CeO2 catalysts that deactivated by 55% after 43 h.[33] The ALD
catalyst particle diameters measured by TEM were 3.5 +/- 0.7 nm after 2-h reduction in 10% H2
at 673 K, and during reaction they sintered to 9.4 +/- 2.4 nm, which corresponds to a 39 to 77 %
surface area loss. The activity loss over time appeared to be characteristic of particle sintering,
so we modeled the reaction rate loss as being proportional to active surface area loss, as
described by Bartholomew.[34] The decrease in surface area of transition metals due to sintering
is known to follow power-law kinetics:
( ) ( )
(3)
where ANi is the surface area of the Ni catalyst, and k is the rate constant.[2, 34, 35] If we
assume deactivation was solely due to a change in surface area, the reaction rate data in Figure
4.1a can be fit to the above power law, yielding a value of n = 7.5. This value of n is within the
92
particle coalescence regime (n ≈ 8 or greater), as opposed to the atom migration sintering regime
(2 < n < 5).[2, 4, 34, 35]
Although the Ni ALD particles sintered, they were still smaller than the IW Ni particles
(approximately 17 nm both before and after reaction), and their small size may have limited the
amount or type of coke deposition. No carbon nanotubes (whiskers) were detected by TEM on
the Ni ALD catalyst after reaction, whereas the Ni IW catalyst had carbon nanotubes deposited
throughout the sample after 36 h of reaction, as shown in Figure 4.1b. Although the reaction rate
was stable for the IW catalyst, at longer times the carbon whiskers would be expected to
eventually plug the reactor or destroy the catalyst particles. These carbon deposition results are
similar to those found in the TGA study by Beengard et al. that showed when n-butane flowed
over Ni catalysts while the temperature was ramped, coking began at a temperature 100 K higher
and at a slower rate on 7-nm Ni particles than on 107-nm Ni particles.[5]
The Ni ALD particles shown in Figure 4.1 did not grow large enough to nucleate carbon
whiskers after 72 h of reaction, but instead had thin layers of encapsulating carbon as shown in
Figure 4.1c. This suggests that operating under reaction conditions can help limit sintering to the
critical carbon formation size, which may be related to the encapsulating carbon formed on the
particle surface. Particle migration and coalescence has been described as a surface-mediated
transport of Ni atoms and Ni-OOH complexes from one side of the particle to the other.[4, 35]
One possible explanation for not forming carbon whiskers on the Ni ALD catalyst is that once
the encapsulating carbon layer formed on the Ni, particle migration and coalescence was
effectively inhibited before reaching the critical whisker formation size. To support this
hypothesis, we pre-sintered a Ni ALD catalyst for 24 h at 873 K in 20% H2 and then ran the
DRM reaction. This pre-sintered sample formed carbon whiskers instead of encapsulating
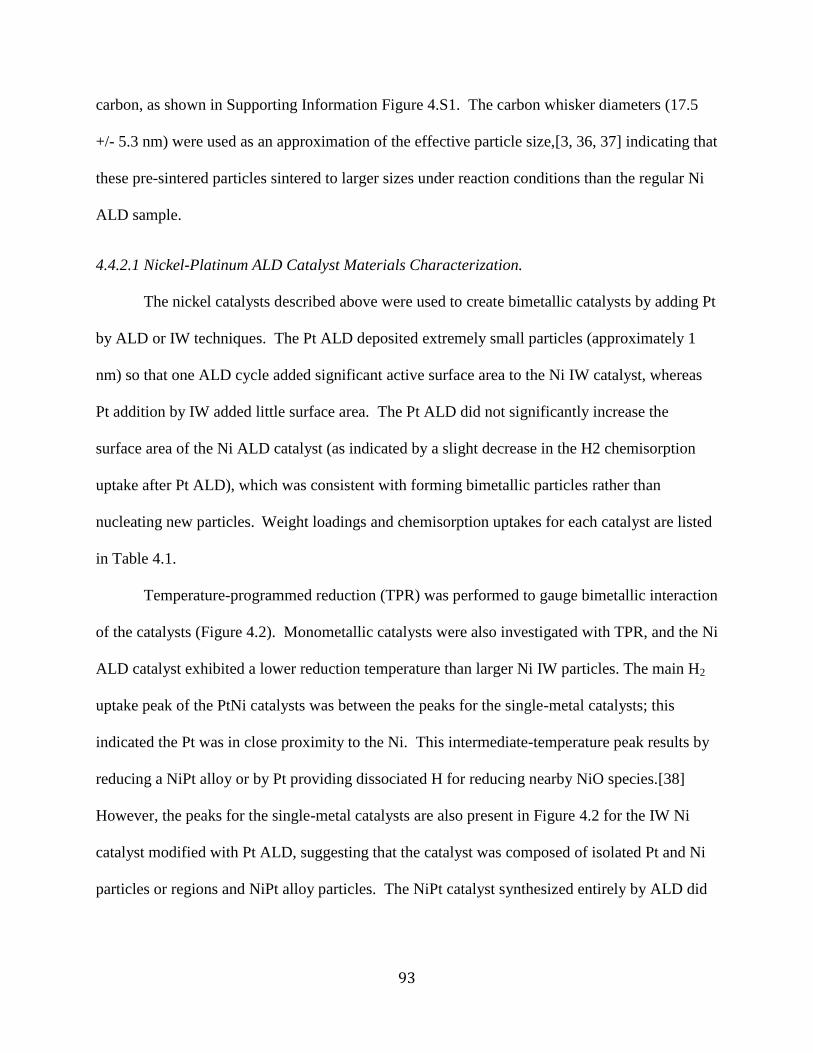
93
carbon, as shown in Supporting Information Figure 4.S1. The carbon whisker diameters (17.5
+/- 5.3 nm) were used as an approximation of the effective particle size,[3, 36, 37] indicating that
these pre-sintered particles sintered to larger sizes under reaction conditions than the regular Ni
ALD sample.
4.4.2.1 Nickel-Platinum ALD Catalyst Materials Characterization.
The nickel catalysts described above were used to create bimetallic catalysts by adding Pt
by ALD or IW techniques. The Pt ALD deposited extremely small particles (approximately 1
nm) so that one ALD cycle added significant active surface area to the Ni IW catalyst, whereas
Pt addition by IW added little surface area. The Pt ALD did not significantly increase the
surface area of the Ni ALD catalyst (as indicated by a slight decrease in the H2 chemisorption
uptake after Pt ALD), which was consistent with forming bimetallic particles rather than
nucleating new particles. Weight loadings and chemisorption uptakes for each catalyst are listed
in Table 4.1.
Temperature-programmed reduction (TPR) was performed to gauge bimetallic interaction
of the catalysts (Figure 4.2). Monometallic catalysts were also investigated with TPR, and the Ni
ALD catalyst exhibited a lower reduction temperature than larger Ni IW particles. The main H2
uptake peak of the PtNi catalysts was between the peaks for the single-metal catalysts; this
indicated the Pt was in close proximity to the Ni. This intermediate-temperature peak results by
reducing a NiPt alloy or by Pt providing dissociated H for reducing nearby NiO species.[38]
However, the peaks for the single-metal catalysts are also present in Figure 4.2 for the IW Ni
catalyst modified with Pt ALD, suggesting that the catalyst was composed of isolated Pt and Ni
particles or regions and NiPt alloy particles. The NiPt catalyst synthesized entirely by ALD did
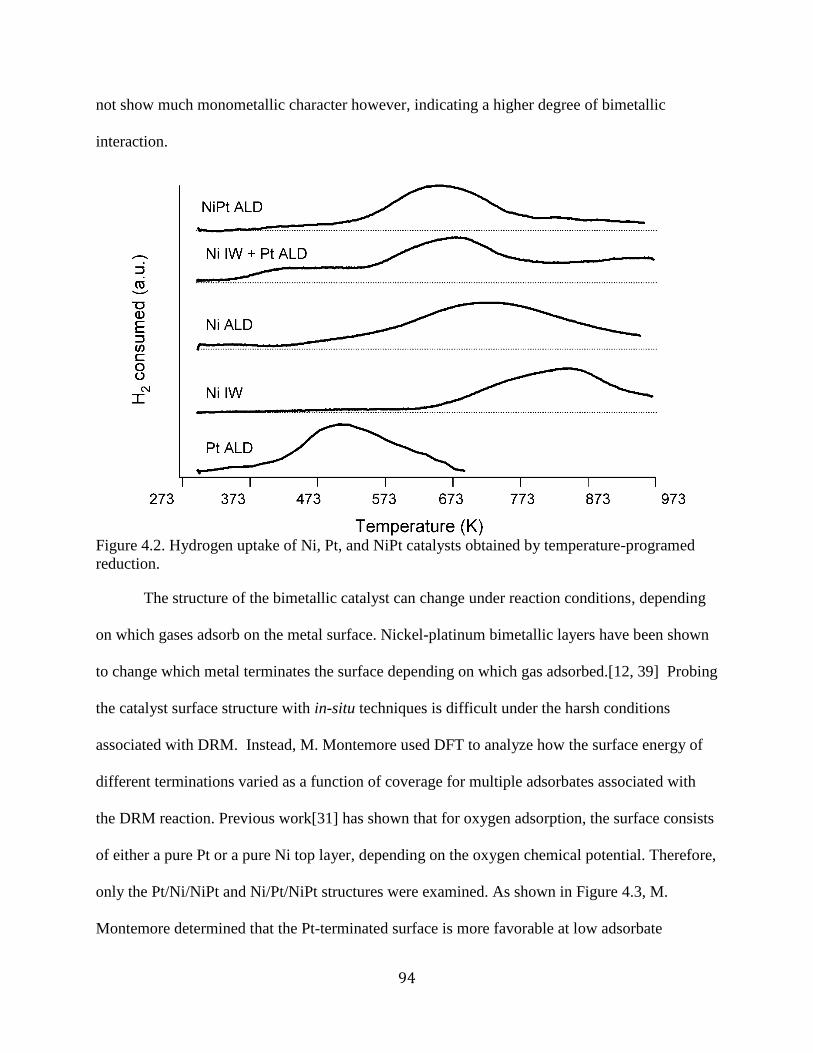
94
not show much monometallic character however, indicating a higher degree of bimetallic
interaction.
Figure 4.2. Hydrogen uptake of Ni, Pt, and NiPt catalysts obtained by temperature-programed
reduction.
The structure of the bimetallic catalyst can change under reaction conditions, depending
on which gases adsorb on the metal surface. Nickel-platinum bimetallic layers have been shown
to change which metal terminates the surface depending on which gas adsorbed.[12, 39] Probing
the catalyst surface structure with in-situ techniques is difficult under the harsh conditions
associated with DRM. Instead, M. Montemore used DFT to analyze how the surface energy of
different terminations varied as a function of coverage for multiple adsorbates associated with
the DRM reaction. Previous work[31] has shown that for oxygen adsorption, the surface consists
of either a pure Pt or a pure Ni top layer, depending on the oxygen chemical potential. Therefore,
only the Pt/Ni/NiPt and Ni/Pt/NiPt structures were examined. As shown in Figure 4.3, M.
Montemore determined that the Pt-terminated surface is more favorable at low adsorbate
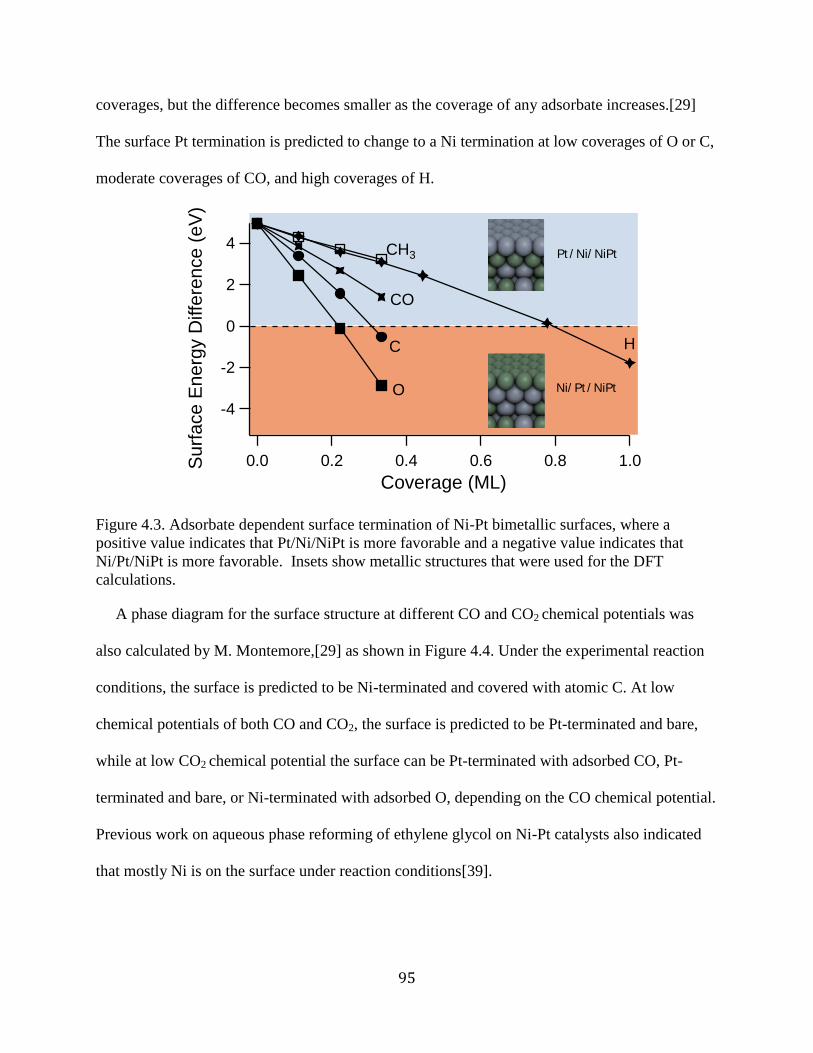
95
coverages, but the difference becomes smaller as the coverage of any adsorbate increases.[29]
The surface Pt termination is predicted to change to a Ni termination at low coverages of O or C,
moderate coverages of CO, and high coverages of H.
Figure 4.3. Adsorbate dependent surface termination of Ni-Pt bimetallic surfaces, where a
positive value indicates that Pt/Ni/NiPt is more favorable and a negative value indicates that
Ni/Pt/NiPt is more favorable. Insets show metallic structures that were used for the DFT
calculations.
A phase diagram for the surface structure at different CO and CO2 chemical potentials was
also calculated by M. Montemore,[29] as shown in Figure 4.4. Under the experimental reaction
conditions, the surface is predicted to be Ni-terminated and covered with atomic C. At low
chemical potentials of both CO and CO2, the surface is predicted to be Pt-terminated and bare,
while at low CO2 chemical potential the surface can be Pt-terminated with adsorbed CO, Pt-
terminated and bare, or Ni-terminated with adsorbed O, depending on the CO chemical potential.
Previous work on aqueous phase reforming of ethylene glycol on Ni-Pt catalysts also indicated
that mostly Ni is on the surface under reaction conditions[39].
-4
-2
0
2
4
Surf
ace E
nerg
y D
iffe
rence
(e
V)
1.00.80.60.40.20.0
Coverage (ML)
O
CH3
HC
CO
Ni/ Pt / NiPt
Pt / Ni/ NiPt
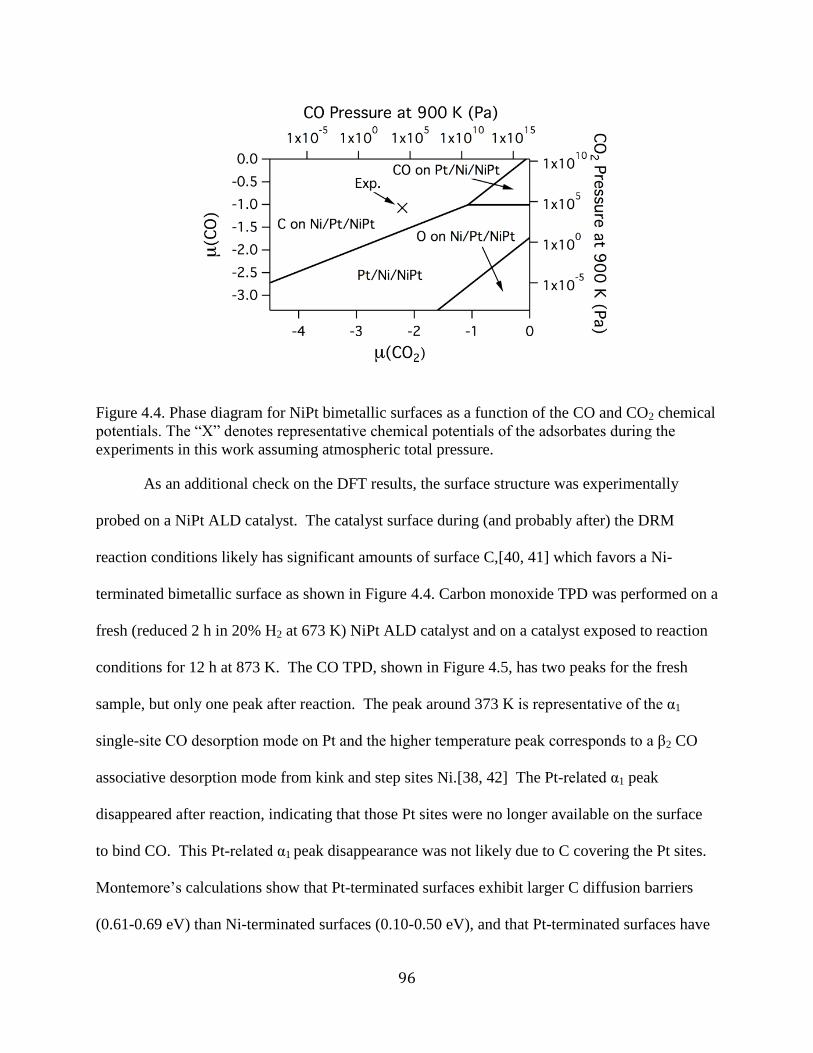
96
Figure 4.4. Phase diagram for NiPt bimetallic surfaces as a function of the CO and CO2 chemical
potentials. The “X” denotes representative chemical potentials of the adsorbates during the
experiments in this work assuming atmospheric total pressure.
As an additional check on the DFT results, the surface structure was experimentally
probed on a NiPt ALD catalyst. The catalyst surface during (and probably after) the DRM
reaction conditions likely has significant amounts of surface C,[40, 41] which favors a Ni-
terminated bimetallic surface as shown in Figure 4.4. Carbon monoxide TPD was performed on a
fresh (reduced 2 h in 20% H2 at 673 K) NiPt ALD catalyst and on a catalyst exposed to reaction
conditions for 12 h at 873 K. The CO TPD, shown in Figure 4.5, has two peaks for the fresh
sample, but only one peak after reaction. The peak around 373 K is representative of the α1
single-site CO desorption mode on Pt and the higher temperature peak corresponds to a β2 CO
associative desorption mode from kink and step sites Ni.[38, 42] The Pt-related α1 peak
disappeared after reaction, indicating that those Pt sites were no longer available on the surface
to bind CO. This Pt-related α1 peak disappearance was not likely due to C covering the Pt sites.
Montemore’s calculations show that Pt-terminated surfaces exhibit larger C diffusion barriers
(0.61-0.69 eV) than Ni-terminated surfaces (0.10-0.50 eV), and that Pt-terminated surfaces have

97
a less favorable C adsorption energies (-5.9 eV) than that of a Ni-terminated surface (-7.5 eV).
Carbon on the bimetallic samples would thus be expected to preferentially form on the Ni
regions and not diffuse to Pt metal sites or Pt-terminated bimetallic sites. Platinum weight
loading of the post-reaction sample was confirmed by ICP-MS, indicating that the Pt was still in
the sample at the original weight loading, just not on the surface. To ensure that the differences
in CO desorption were due to reactant exposure and not high temperature, a NiPt ALD catalyst
was reduced for 2 h at 673 K in 20% H2, then held at 873 K in Ar for 12 h before running the CO
TPD. This TPD showed both the low-temperature Pt peak and the high-temperature Ni peak,
indicating that the disappearance of the Pt peak was not due to thermal treatment. Surface area
loss and perhaps surface carbon were responsible for the decreased β2 desorption peak after
reaction. These TPD results agree with our findings from DFT that the surface was Ni-
terminated during reaction.
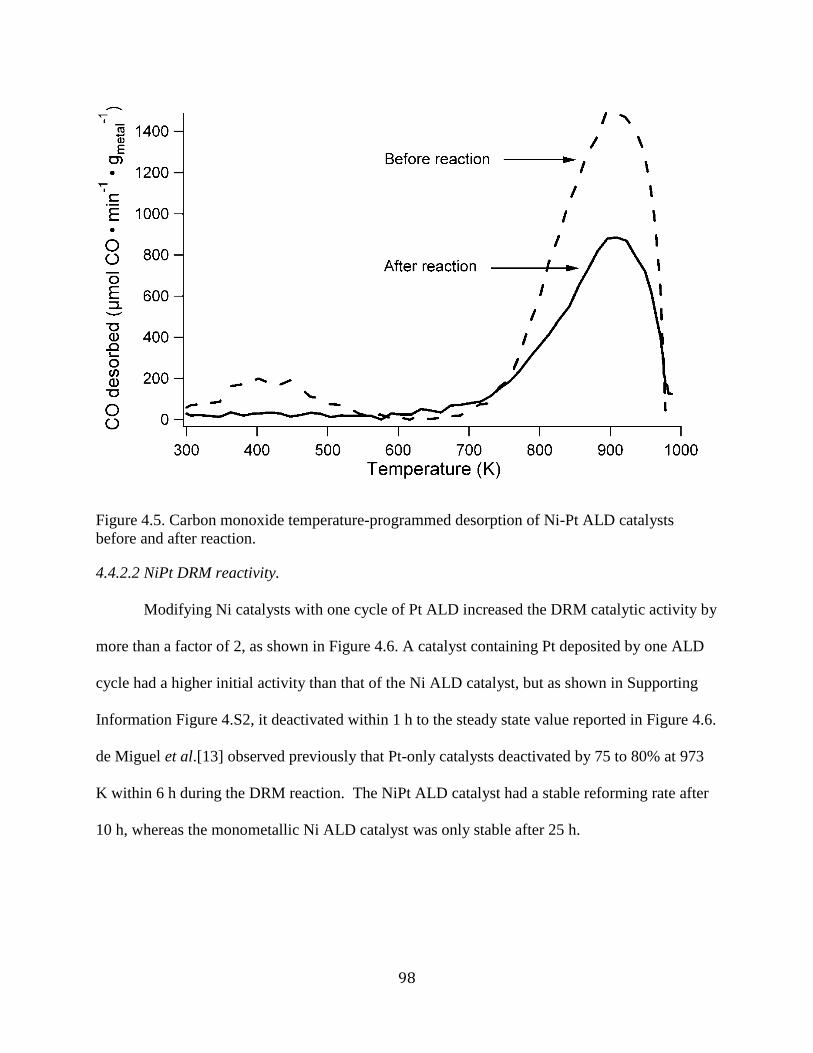
98
Figure 4.5. Carbon monoxide temperature-programmed desorption of Ni-Pt ALD catalysts
before and after reaction.
4.4.2.2 NiPt DRM reactivity.
Modifying Ni catalysts with one cycle of Pt ALD increased the DRM catalytic activity by
more than a factor of 2, as shown in Figure 4.6. A catalyst containing Pt deposited by one ALD
cycle had a higher initial activity than that of the Ni ALD catalyst, but as shown in Supporting
Information Figure 4.S2, it deactivated within 1 h to the steady state value reported in Figure 4.6.
de Miguel et al.[13] observed previously that Pt-only catalysts deactivated by 75 to 80% at 973
K within 6 h during the DRM reaction. The NiPt ALD catalyst had a stable reforming rate after
10 h, whereas the monometallic Ni ALD catalyst was only stable after 25 h.
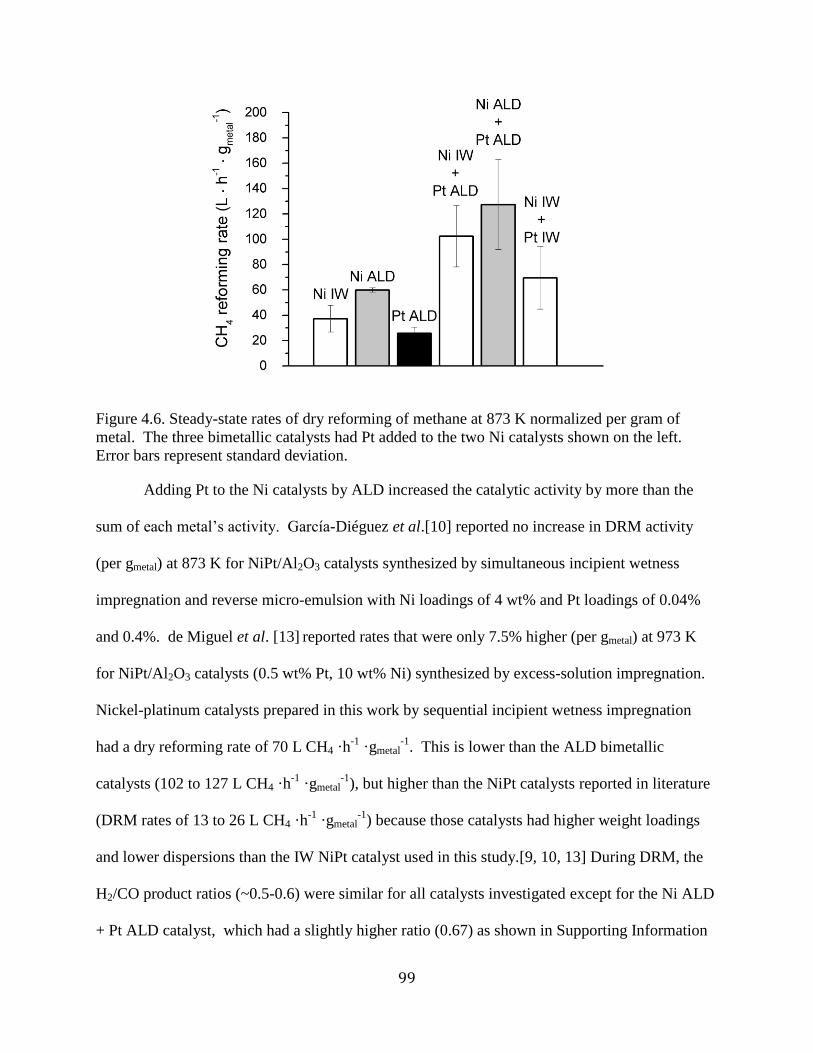
99
Figure 4.6. Steady-state rates of dry reforming of methane at 873 K normalized per gram of
metal. The three bimetallic catalysts had Pt added to the two Ni catalysts shown on the left.
Error bars represent standard deviation.
Adding Pt to the Ni catalysts by ALD increased the catalytic activity by more than the
sum of each metal’s activity. García-Diéguez et al.[10] reported no increase in DRM activity
(per gmetal) at 873 K for NiPt/Al2O3 catalysts synthesized by simultaneous incipient wetness
impregnation and reverse micro-emulsion with Ni loadings of 4 wt% and Pt loadings of 0.04%
and 0.4%. de Miguel et al. [13] reported rates that were only 7.5% higher (per gmetal) at 973 K
for NiPt/Al2O3 catalysts (0.5 wt% Pt, 10 wt% Ni) synthesized by excess-solution impregnation.
Nickel-platinum catalysts prepared in this work by sequential incipient wetness impregnation
had a dry reforming rate of 70 L CH4 ·h-1
·gmetal-1
. This is lower than the ALD bimetallic
catalysts (102 to 127 L CH4 ·h-1
·gmetal-1
), but higher than the NiPt catalysts reported in literature
(DRM rates of 13 to 26 L CH4 ·h-1
·gmetal-1
) because those catalysts had higher weight loadings
and lower dispersions than the IW NiPt catalyst used in this study.[9, 10, 13] During DRM, the
H2/CO product ratios (~0.5-0.6) were similar for all catalysts investigated except for the Ni ALD
+ Pt ALD catalyst, which had a slightly higher ratio (0.67) as shown in Supporting Information

100
Figure 4.S3. These H2:CO ratios are similar to other Ni, Pt, and NiPt catalysts reported in
literature for DRM at 873 K.[10, 43]
DFT was used by M. Montemore to understand why the bimetallic catalysts had superior
DRM rates.[29] Specifically, he investigated how bimetallic NiPt surfaces interacted with the
different adsorbates found in the DRM reaction. Recent work by Jones et al. used first principles
calculations and experimental investigations to elucidate which pure metals would be most
favorable for CH4 steam reforming.[14] They found that Ru was the best reforming metal and
that the high reforming TOFs were correlated with the C and O adsorption energies calculated
for that surface. By applying the same principles, M. Montemore used the O and C adsorption
strengths on Ru as a benchmark to gauge which bimetallic catalyst surfaces would be more
effective for dry reforming; i.e., a catalyst with C and O adsorption energies closer to those of Ru
was deemed likely to be a superior catalyst.[29] In addition to comparing the C and O
adsorption energies, the dissociative CH4 adsorption and CO formation energies were also
investigated since these are the kinetically limiting steps.[14] Four surfaces, shown in Supporting
Information Figure 4.S4, were used to model the PtNi bimetallic surfaces. As can be seen in
Figure 4.7, the Ni-terminated alloy has similar adsorption properties to Ru, and the similarity is
maintained (though lessened) if 1/3 of the atoms in the top layer of this surface are replaced with
Pt. This is in contrast to Ni, Pt, and the Pt-terminated alloy (even with 1/3 ML of Ni in the
surface), which bind O and C too weakly. As noted above, experimental investigation and
theoretical prediction indicated that the Ni-terminated surface is present under reaction
conditions.

101
Figure 4.7. A) Carbon and oxygen adsorption energies of different metal surfaces. B) CO
formation and CH4 dissociation energies of different metal surfaces.
4.4.2.3 Carbon deposition on NiPt.
The post-reaction TEM images of the NiPt ALD catalyst show the particles ranged from
approximately 3 to 20 nm (with average particle size of 9.4 +/- 4.5 nm), as shown in Figure 4.8.
The larger particles would be expected to form carbon whiskers if they were not bimetallic,
though the smaller particles could be monometallic and still not form carbon whiskers. Analysis
by TEM of post-reaction bimetallic ALD samples indicated only sparse carbon whiskers on the
samples, as shown in Figure 4.8, but the IW-prepared NiPt catalyst still had a large number of
carbon whiskers. The carbon whisker growth on the IW Ni + Pt IW catalyst was similar to that of
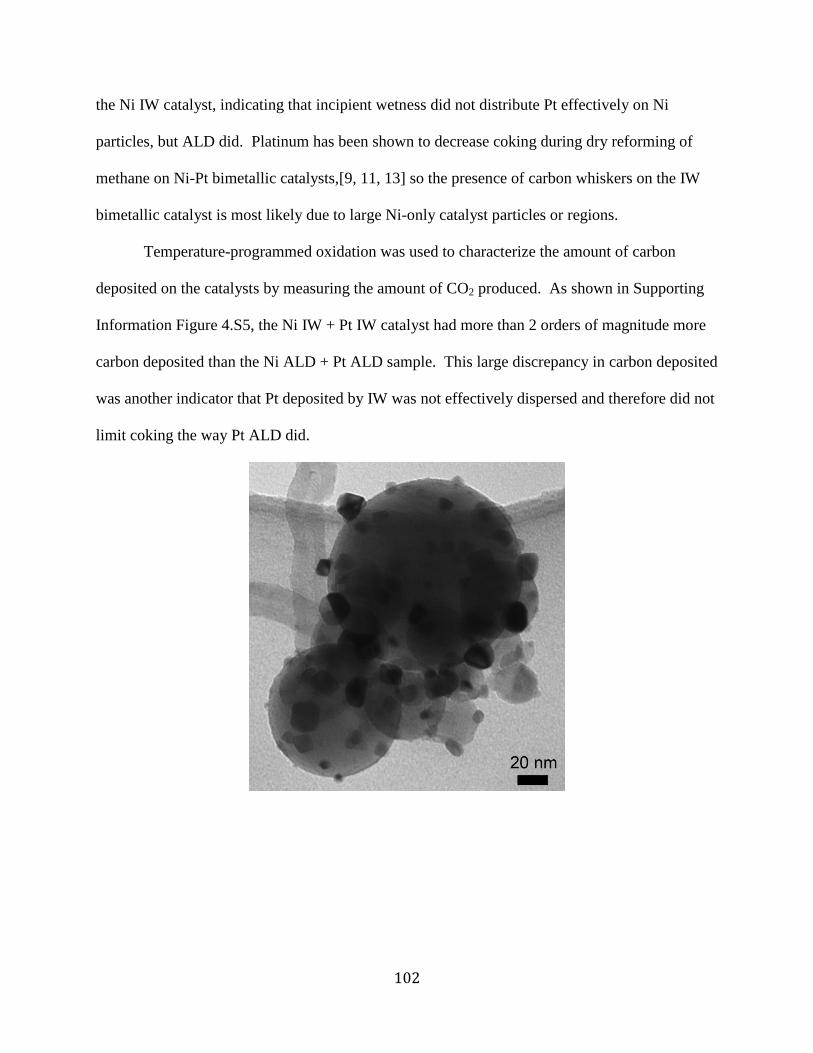
102
the Ni IW catalyst, indicating that incipient wetness did not distribute Pt effectively on Ni
particles, but ALD did. Platinum has been shown to decrease coking during dry reforming of
methane on Ni-Pt bimetallic catalysts,[9, 11, 13] so the presence of carbon whiskers on the IW
bimetallic catalyst is most likely due to large Ni-only catalyst particles or regions.
Temperature-programmed oxidation was used to characterize the amount of carbon
deposited on the catalysts by measuring the amount of CO2 produced. As shown in Supporting
Information Figure 4.S5, the Ni IW + Pt IW catalyst had more than 2 orders of magnitude more
carbon deposited than the Ni ALD + Pt ALD sample. This large discrepancy in carbon deposited
was another indicator that Pt deposited by IW was not effectively dispersed and therefore did not
limit coking the way Pt ALD did.

103
Figure 4.8. (Top) Bimetallic NiPt ALD catalyst particles after 32 h of reaction at 873 K indicate
varying particle sizes with minimal carbon whisker deposition. Metal particles (dark <20 nm)
were supported on spherical alumina supports. (Bottom) NiPt catalyst prepared by IW after 42 h
of reaction show growth of carbon whiskers.
Density functional theory was used by M. Montemore to explore possible explanations
for the amount of carbon deposition on different catalysts.[29] Importantly, whisker formation
requires a much larger ensemble of contiguous sites than methane activation, so that whereas
small quantities of surface Pt atoms would not be expected to strongly affect DRM activity, they
may affect whisker growth. M. Montemore’s DFT calculations suggest that suppression of
coking may be due to the presence of some Pt “defects” on the active surface.[29] The tendency
to coke likely depends on a number of factors, including the rate of C diffusion and the
energetics of graphitic carbon formation.[15] In particular, the activation barriers for C diffusion
have previously been used to explain the increased coke resistance of NiSn alloys.[44]
M.Montemore’s climbing-image, nudged elastic band calculations of the barrier for diffusion
from an fcc hollow to a neighboring hcp hollow on Pt gave an identical result as simply
performing an adsorption calculation in the bridge site.[29] Therefore, we used the difference in
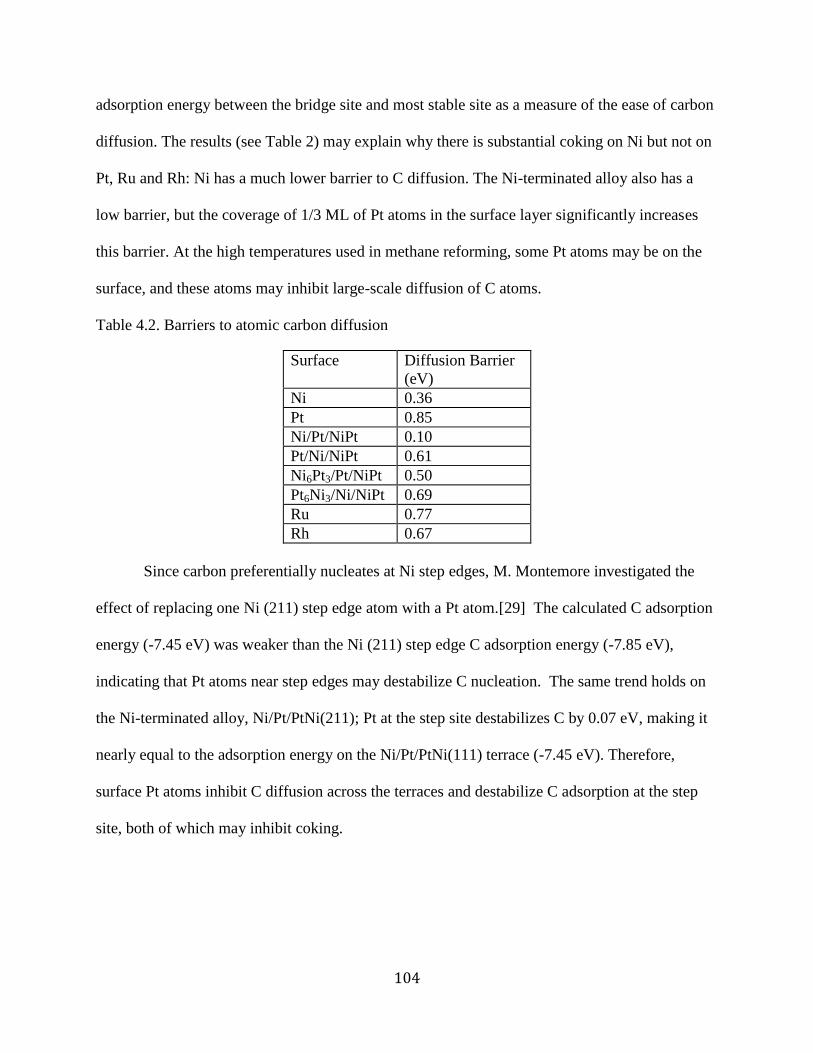
104
adsorption energy between the bridge site and most stable site as a measure of the ease of carbon
diffusion. The results (see Table 2) may explain why there is substantial coking on Ni but not on
Pt, Ru and Rh: Ni has a much lower barrier to C diffusion. The Ni-terminated alloy also has a
low barrier, but the coverage of 1/3 ML of Pt atoms in the surface layer significantly increases
this barrier. At the high temperatures used in methane reforming, some Pt atoms may be on the
surface, and these atoms may inhibit large-scale diffusion of C atoms.
Table 4.2. Barriers to atomic carbon diffusion
Surface Diffusion Barrier
(eV) Ni 0.36
Pt 0.85
Ni/Pt/NiPt 0.10
Pt/Ni/NiPt 0.61
Ni6Pt3/Pt/NiPt 0.50
Pt6Ni3/Ni/NiPt 0.69
Ru 0.77
Rh 0.67
Since carbon preferentially nucleates at Ni step edges, M. Montemore investigated the
effect of replacing one Ni (211) step edge atom with a Pt atom.[29] The calculated C adsorption
energy (-7.45 eV) was weaker than the Ni (211) step edge C adsorption energy (-7.85 eV),
indicating that Pt atoms near step edges may destabilize C nucleation. The same trend holds on
the Ni-terminated alloy, Ni/Pt/PtNi(211); Pt at the step site destabilizes C by 0.07 eV, making it
nearly equal to the adsorption energy on the Ni/Pt/PtNi(111) terrace (-7.45 eV). Therefore,
surface Pt atoms inhibit C diffusion across the terraces and destabilize C adsorption at the step
site, both of which may inhibit coking.
105
4.4 Conclusions
Nickel catalysts prepared by atomic layer deposition (ALD) had higher rates per g-metal
for dry reforming of methane (DRM) than larger Ni particles synthesized by incipient wetness.
These Ni ALD catalysts also inhibited the growth of carbon whiskers during reaction because the
Ni particles were ~ 8 nm smaller than the IW catalyst particles, even after sintering. Adding Pt
to the Ni catalysts by ALD increased the catalytic activity more than a factor of two, and the
activity of these catalysts (on a per gram metal basis) was higher than NiPt DRM catalysts
reported in the literature because of the small size of these particles. Also, less carbon deposited
on the NiPt ALD catalysts than on all other catalysts investigated. Temperature-programmed
reduction suggests these NiPt catalysts contain both bimetallic alloys and individual metal
nanoparticles. Results from DFT calculations indicated that the NiPt catalyst surface was Ni-
terminated under reaction conditions because adsorbates bring Ni to the surface. These Ni-
terminated catalysts were predicted to perform better than Pt-terminated bimetallic catalysts or
the individual metals. Bimetallic catalysts may have coked less because of the higher C
diffusion barrier on terraces and weaker C adsorption energy at step edges where Pt is present.
These ALD catalysts performed better than most DRM catalysts reported in the literature, likely
because of their nanoscale features and maximized bimetallic interaction.
Acknowledgments
The work was supported through the National Science Foundation Graduate Research
Fellowship Program and NSF Grants CBET 1067800 and CBET 0854251. The authors thank
Fred Luizer in the University of Colorado’s Laboratory of Environmental and Geological Studies
(LEGS) for conducting ICP-MS analysis. The authors also thank Tom Giddings and the MCDB
Bio3d Electron Microscopy center for the use of TEM microscopes and sample preparation
equipment. Special thanks to Sarah Gould for designing graphical art. We acknowledge
106
supercomputing time at the Center for Nanoscale Materials at Argonne National Laboratory,
supported by the U.S. Department of Energy, Office of Basic Energy Sciences, under Contract
DE-AC02-06CH11357. A portion of the research was performed using EMSL, a national
scientific user facility sponsored by the Department of Energy’s Office of Biological and
Environmental Research and located at Pacific Northwest National Laboratory.
4.5 References
[1] D.A. Wood, C. Nwaoha, B.F. Towler, Journal of Natural Gas Science and Engineering 9
(2012) 196-208.
[2] J.R. Rostrup-Nielsen, J. Sehested, J.K. Nørskov, Hydrogen and synthesis gas by steam- and
C02 reforming, in: Advances in Catalysis, Academic Press, 2002, pp. 65-139.
[3] S. Helveg, J. Sehested, J.R. Rostrup-Nielsen, Catalysis Today 178 (2011) 42-46.
[4] J. Sehested, Catalysis Today 111 (2006) 103-110.
[5] H. Bengaard, J.K. Nørskov, J. Sehested, B.S. Clausen, L.P. Nielsen, A.M. Molenbroek, J.R.
Rostrup-Nielsen, Journal of Catalysis 209 (2002) 365-384.
[6] V.C.H. Kroll, H.M. Swaan, C. Mirodatos, Journal of Catalysis 161 (1996) 409-422.
[7] S. Wang, G.Q. Lu, G.J. Millar, Energy & Fuels 10 (1996) 896-904.
[8] F. Besenbacher, I. Chorkendorff, B. Clausen, B. Hammer, A. Molenbroek, J.K. Nørskov, I.
Stensgaard, Science 279 (1998) 1913-1915.
[9] M. García-Diéguez, E. Finocchio, M.Á. Larrubia, L.J. Alemany, G. Busca, Journal of
Catalysis 274 (2010) 11-20.
[10] M. García-Diéguez, I.S. Pieta, M.C. Herrera, M.A. Larrubia, L.J. Alemany, Applied
Catalysis A: General 377 (2010) 191-199.
[11] B. Pawelec, S. Damyanova, K. Arishtirova, J.L.G. Fierro, L. Petrov, Applied Catalysis A:
General 323 (2007) 188-201.
[12] W. Yu, M.D. Porosoff, J.G. Chen, Chemical Reviews 112 (2012) 5780-5817.
[13] S.R. de Miguel, I.M.J. Vilella, S.P. Maina, D.S. José-Alonso, M.C. Román-Martínez, M.J.
Illán-Gómez, Applied Catalysis A: General (2012).
[14] G. Jones, J.G. Jakobsen, S.S. Shim, J. Kleis, M.P. Andersson, J. Rossmeisl, F. Abild-
Pedersen, T. Bligaard, S. Helveg, B. Hinnemann, J.R. Rostrup-Nielsen, I. Chorkendorff, J.
Sehested, J.K. Nørskov, Journal of Catalysis 259 (2008) 147-160.
[15] F. Abild-Pedersen, J.K. Nørskov, J.R. Rostrup-Nielsen, J. Sehested, S. Helveg, Physical
Review B 73 (2006) 115419.
[16] T. Aaltonen, M. Ritala, T. Sajavaara, J. Keinonen, M. Leskela¨, Chemistry of Materials 15
(2003) 1924-1928.
[17] Y. Zhou, D.M. King, X. Liang, J. Li, A.W. Weimer, Applied Catalysis B: Environmental
101 (2010) 54-60.
[18] J. Li, X. Liang, D.M. King, Y.-B. Jiang, A.W. Weimer, Applied Catalysis B: Environmental
97 (2010) 220-226.
107
[19] W. Setthapun, W.D. Williams, S.M. Kim, H. Feng, J.W. Elam, F.A. Rabuffetti, K.R.
Poeppelmeier, P.C. Stair, E.A. Stach, F.H. Ribeiro, J.T. Miller, C.L. Marshall, The Journal of
Physical Chemistry C 114 (2010) 9758-9771.
[20] W. Kessels, H. Knoops, S. Dielissen, A. Mackus, M. van de Sanden, Applied Physics
Letters 95 (2009) 013114-013114-013113.
[21] X. Liang, L. Lyon, Y.-B. Jiang, A. Weimer, Journal of Nanoparticle Research 14 (2012) 1-
12.
[22] S.T. Christensen, H. Feng, J.L. Libera, N. Guo, J.T. Miller, P.C. Stair, J.W. Elam, Nano
Letters 10 (2010) 3047-3051.
[23] Y. Lei, B. Liu, J. Lu, R.J. Lobo-Lapidus, T. Wu, H. Feng, X. Xia, A.U. Mane, J.A. Libera,
J.P. Greeley, J.T. Miller, J.W. Elam, Chemistry of Materials 24 (2012) 3525-3533.
[24] A.J.M. Mackus, N. Leick, L. Baker, W.M.M. Kessels, Chemistry of Materials 24 (2012)
1752-1761.
[25] T.D. Gould, A.M. Lubers, B.T. Neltner, J.V. Carrier, A.W. Weimer, J.L. Falconer, J. Will
Medlin, Journal of Catalysis 303 (2013) 9-15.
[26] D.M. King, J.A. Spencer Ii, X. Liang, L.F. Hakim, A.W. Weimer, Surface and Coatings
Technology 201 (2007) 9163-9171.
[27] D. Baudouin, U. Rodemerck, F. Krumeich, A.d. Mallmann, K.C. Szeto, H. Ménardd, L.
Veyre, J.-P. Candy, P.B. Webb, C. Thieuleux, C. Copéreta, Journal of Catalysis 297 (2013) 27-
34.
[28] A. Olafsen, C. Daniel, Y. Schuurman, L. Råberg, U. Olsbye, C. Mirodatos, Catalysis Today
115 (2006) 179-185.
[29] T.D. Gould, M.M. Montemore, A.M. Lubers, A. Weimer, J.L. Falconer, J.W. Medlin,
Submitted to Journal of Catalysis (2013).
[30] N. İnoğlu, J.R. Kitchin, Journal of Catalysis 261 (2009) 188-194.
[31] D. Sun, Y. Zhao, H. Su, W. Li, Chinese Journal of Catalysis 34 (2013) 1434-1442.
[32] A. Olafsen, Ã. Slagtern, I.M. Dahl, U. Olsbye, Y. Schuurman, C. Mirodatos, Journal of
Catalysis 229 (2005) 163-175.
[33] D. Baudouin, K.C. Szeto, P. Laurent, A. De Mallmann, B. Fenet, L. Veyre, U. Rodemerck,
C. Copéret, C. Thieuleux, Journal of the American Chemical Society 134 (2012) 20624-20627.
[34] C.H. Bartholomew, Applied Catalysis A: General 107 (1993) 1-57.
[35] J. Sehested, Journal of Catalysis 217 (2003) 417-426.
[36] R.T.K. Baker, Carbon 27 (1989) 315-323.
[37] E.F. Kukovitsky, S.G. L'Vov, N.A. Sainov, V.A. Shustov, L.A. Chernozatonskii, Chemical
Physics Letters 355 (2002) 497-503.
[38] A. Tanksale, J.N. Beltramini, J.A. Dumesic, G.Q. Lu, Journal of Catalysis 258 (2008) 366-
377.
[39] S.A. Tupy, A.M. Karim, C. Bagia, W. Deng, Y. Huang, D.G. Vlachos, J.G. Chen, ACS
Catalysis 2 (2012) 2290-2296.
[40] L.M. Aparicio, Journal of Catalysis 165 (1997) 262-274.
[41] A.K. Avetisov, J.R. Rostrup-Nielsen, V.L. Kuchaev, J.H. Bak Hansen, A.G. Zyskin, E.N.
Shapatina, Journal of Molecular Catalysis A: Chemical 315 (2010) 155-162.
[42] W. Erley, H. Wagner, Surface Science 74 (1978) 333-341.
[43] F. Pompeo, N.N. Nichio, M.M. Souza, D.V. Cesar, O.A. Ferretti, M. Schmal, Applied
Catalysis A: General 316 (2007) 175-183.
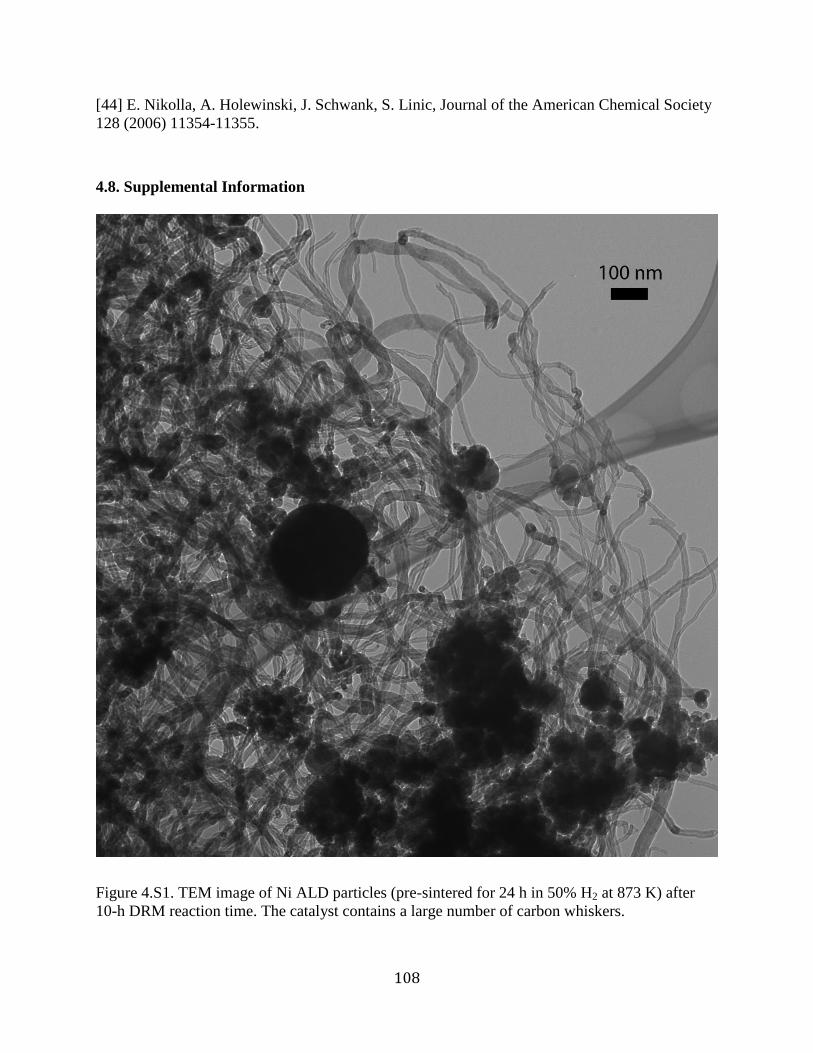
108
[44] E. Nikolla, A. Holewinski, J. Schwank, S. Linic, Journal of the American Chemical Society
128 (2006) 11354-11355.
4.8. Supplemental Information
Figure 4.S1. TEM image of Ni ALD particles (pre-sintered for 24 h in 50% H2 at 873 K) after
10-h DRM reaction time. The catalyst contains a large number of carbon whiskers.

109
Figure 4.S2. Dry reforming rates at 873 K during first 10 h of reaction for all catalysts
investigated.
Figure 4.S3. Steady-state H2:CO ratios for all catalysts investigated during DRM at 873 K.
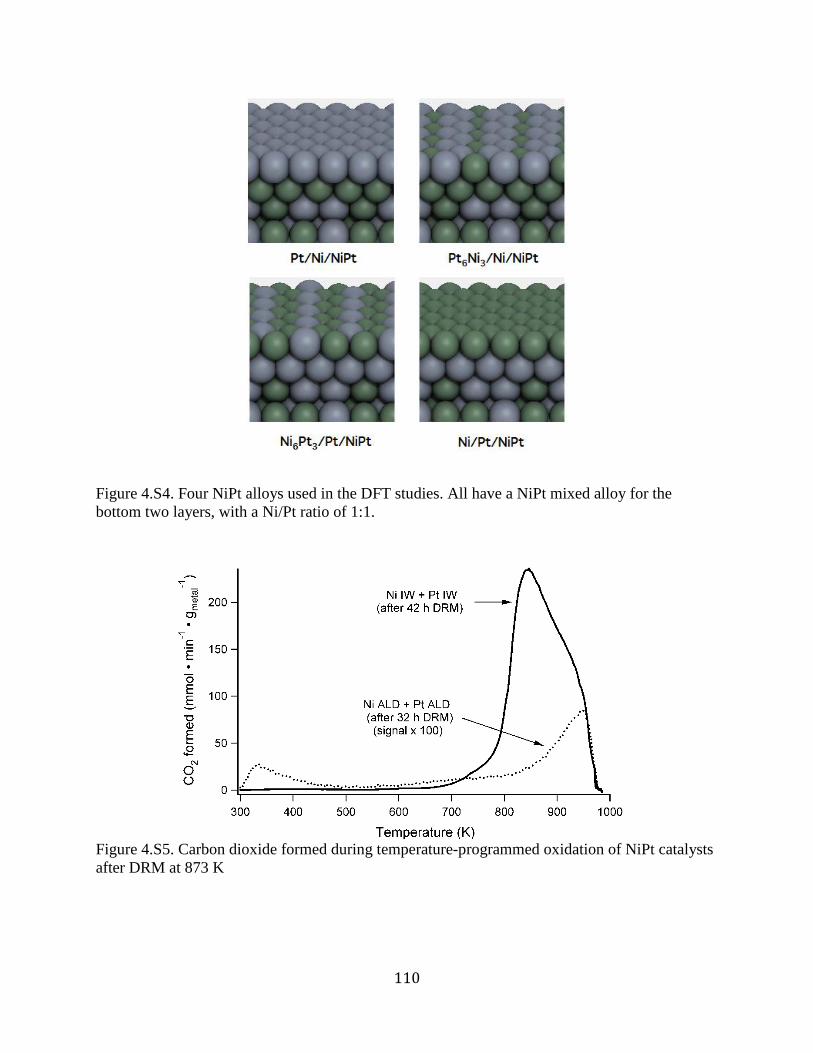
110
Figure 4.S4. Four NiPt alloys used in the DFT studies. All have a NiPt mixed alloy for the
bottom two layers, with a Ni/Pt ratio of 1:1.
Figure 4.S5. Carbon dioxide formed during temperature-programmed oxidation of NiPt catalysts
after DRM at 873 K

111
5. Stabilizing Ni Catalysts by Molecular Layer Deposition of Porous
Aluminum Oxide
5.1. Abstract
Sintering is a major problem for catalysts used in dry reforming of methane (DRM). This
study inhibited sintering of ~ 2 – 5 nm Ni particles synthesized via atomic layer deposition
(ALD) by stabilizing the catalysts with an alucone molecular layer deposition (MLD) coating.
This coating was synthesized using a three-step “ABC” reaction of trimethyl aluminum (TMA),
ethyl amine (EA), and maleic anhydride (MA). The particles were coated with 5, 10 or 15 cycles
of MLD and then calcined to form a porous alumina over-layer. Calcining the catalysts at 773 K
produced a stable catalyst, but the catalyst calcined at 673 K rapidly deactivated during dry
reforming of methane (DRM). The catalysts’ stability during DRM at 973 K was measured, and
the particle sizes were measured after reaction by TEM. The uncoated catalyst continuously
deactivated with time on stream, whereas for the MLD-coated catalysts, the DRM rates increased
during the first few hours on-stream before stabilizing, apparently because the nickel surface area
increased. Active metal surface area increased with higher reduction temperature for the MLD-
modified catalysts, whereas the nickel surface area decreased for uncoated catalysts due to
sintering. Particle sizes measured by TEM after reaction were smaller for the MLD-modified
catalysts. After repeated DRM at 973 K, calcination, and reduction in H2, the 10-cycle MLD
catalyst returned to the same steady-state DRM rate. Coking on the 5-cycle MLD-coated
catalyst from the DRM reaction was approximately half that of the uncoated catalyst.
112
5.2. Introduction
Methane reforming has received much attention in the last decade due to increased
recovery of shale gas from enhanced fracking technologies. The current surplus of natural gas
has provided motivation for using CH4 for chemical synthesis of fuels and chemicals, in addition
to using CH4 for electricity and heat production, especially in the case of “stranded” gas-fields at
remote wells.[1] The primary chemical process utilizing CH4 is methane steam reforming
(MSR), and in 2012 it produced 95% of the US H2 supply.[2] Another reforming reaction, dry
reforming of methane (DRM): CO2 + CH4 2CO + 2H2, is used much less due to its lower
H2:CO ratio (typically less than 1) and exacerbated problems with deactivation from coking in
the absence of steam.[3-5] However, with the growth of synthetic fuel production through
Fischer-Tropsch (FT) synthesis of syngas,[6] DRM can prove a valuable reaction to blend
streams with those from MSR to produce syngas feed streams with desired H2:CO ratios.[3, 5, 7]
Supported Ni, which is the primary catalyst used for CH4 reforming, deactivates due to
coking and sintering.[4, 7-9] Coke formation can be thermodynamically limited by running the
reactions at high temperatures,[3] but high-temperature operation is energy intensive and also
sinters the catalyst, which reduces activity. Catalyst coking can be decreased without high
temperatures by incorporating promoters or a second catalytic metal. Bengaard et al.
demonstrated that K, S, and Au preferentially bind to Ni step edges to act as site blockers for
carbon nucleation.[10] Bimetallic Ni-Pt catalysts also have higher coking resistance than
monometallic Ni catalysts,[11-13] due to the lower solubility of C in Pt, higher C diffusion
barriers on bimetallic surfaces, and weaker C adsorption energies at bimetallic step sites.[14, 15]
Coking can also be decreased by using smaller Ni particles because their step edges are small
enough to limit carbon nucleation and subsequent growth.[10] Maintaining small particles

113
during the DRM reaction is difficult, however, because reforming conditions readily sinter Ni
particles.
Approaches for mitigating catalyst nanoparticle sintering have received much attention in
recent years for a variety of catalysts. Atomic layer deposition (ALD) has been used to create
barriers that inhibit diffusion of supported catalyst particles.[16] Alumina ALD was used as an
overcoating to protect Pd nanoparticles, by either depositing less than a monolayer (less than 16
alumina ALD cycles) on the Pd catalyst,[17] or by depositing a thicker coating (8 nm with 40
ALD cycles), which was then cracked to create pores.[18] The cracked-alumina ALD layers
prevented sintering at 948 K for 28.3 h during oxidative dehydrogenation of ethylene. Both the
porous sub-monolayer alumina and the cracked alumina layers blocked step and defect sites on
the Pd catalysts. Site-blocking can shut down unfavorable reactions that occur on those
sites,[18] but it would also decrease the DRM activity because those step sites dominate the
reaction rate.[10, 15] Bengaard et al. showed that when step sites were blocked by K on a
Ni/MgAl2O4 catalyst, the activation energy for dissociative CH4 adsorption was 36.1 kJ/mol
higher than the normal Ni/Mg/Al2O4 catalyst, and their theoretical calculations showed the CH4
activation energy was 19 kJ/mol higher on Ni(111) than Ni(211).[10] Alternatively, metal ALD
can be augmented with a third chemistry to deposit inert material around catalyst particles in a
three-step ALD process. This “ABC” ALD utilizes protecting ligands (e.g., alkanethiols,
ethylenediamine, acetonitrile) on the metal particles while a stabilizing metal oxide is deposited
around the particle.[16, 19] The protecting ligands are then removed and the metal particles are
trapped by the oxide, which can limit coalescence during particle synthesis. However, this
technique has not been shown to stabilize catalyst particles under reaction conditions or at high
temperatures, but only limit the size of the particles deposited.
114
Catalysts can also be stabilized by molecular layer deposition (MLD), which is analogous
to ALD, but it deposits hybrid polymer-metal thin films in sequential self-limiting reactions.
These hybrid layers are then calcined (or water-etched) to remove the organic component and
leave a residual porous inorganic framework. An example of an MLD layer is aluminum
alkoxide (alucone), which is deposited by alternating half-cycles of trimethyl aluminum (TMA)
and ethylene glycol (EG). Liang et al. used this “AB” alucone MLD layer to stabilize Pt-ALD
catalyst nanoparticles.[20] They reported that when the polymeric layer was calcined, the
resultant porous matrix had 0.6-nm diameter pores. These porous layers inhibited sintering of
the Pt particles during calcination at 673, 873, and 1073 K for 4 h. Although the MLD layers
inhibited sintering, they also decreased the Pt surface area and therefore decreased the catalytic
activity for CO oxidation. The decreased activity was also likely due to mass transfer limitations
in the 0.6-nm pores, and possibly due to restructuring of the porous matrix to crystalline alumina
in the sample that was calcined at 1073 K.[20, 21]
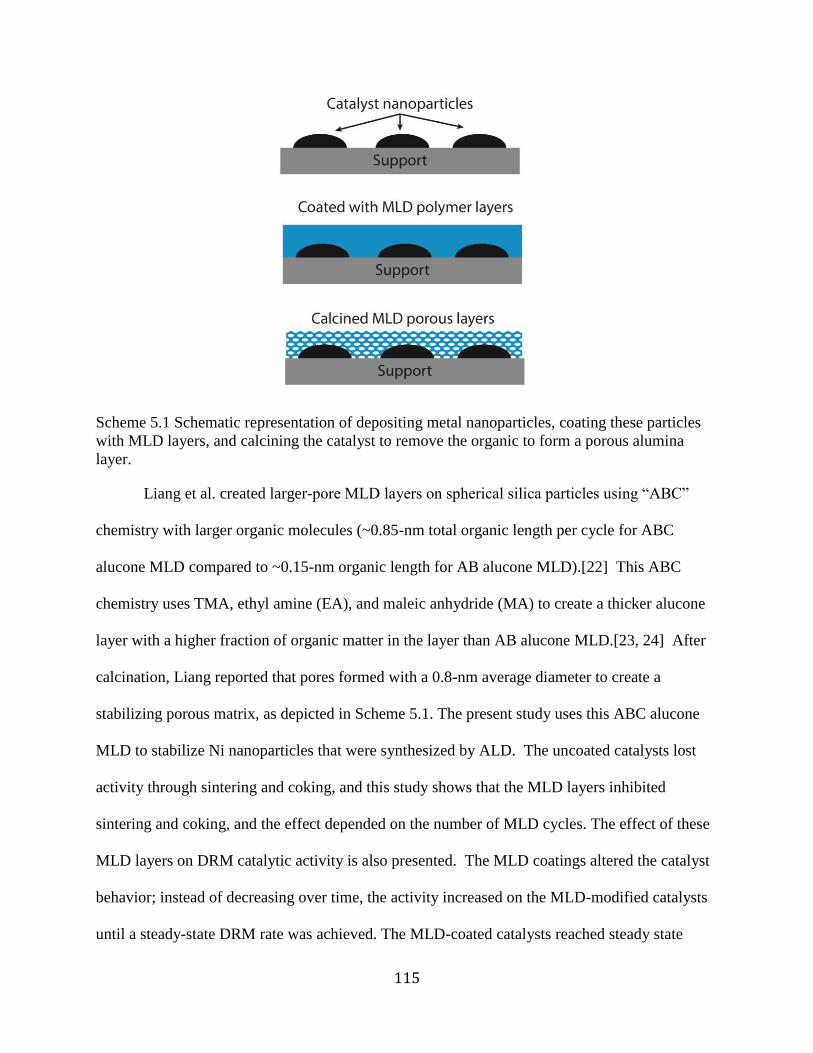
115
Scheme 5.1 Schematic representation of depositing metal nanoparticles, coating these particles
with MLD layers, and calcining the catalyst to remove the organic to form a porous alumina
layer.
Liang et al. created larger-pore MLD layers on spherical silica particles using “ABC”
chemistry with larger organic molecules (~0.85-nm total organic length per cycle for ABC
alucone MLD compared to ~0.15-nm organic length for AB alucone MLD).[22] This ABC
chemistry uses TMA, ethyl amine (EA), and maleic anhydride (MA) to create a thicker alucone
layer with a higher fraction of organic matter in the layer than AB alucone MLD.[23, 24] After
calcination, Liang reported that pores formed with a 0.8-nm average diameter to create a
stabilizing porous matrix, as depicted in Scheme 5.1. The present study uses this ABC alucone
MLD to stabilize Ni nanoparticles that were synthesized by ALD. The uncoated catalysts lost
activity through sintering and coking, and this study shows that the MLD layers inhibited
sintering and coking, and the effect depended on the number of MLD cycles. The effect of these
MLD layers on DRM catalytic activity is also presented. The MLD coatings altered the catalyst
behavior; instead of decreasing over time, the activity increased on the MLD-modified catalysts
until a steady-state DRM rate was achieved. The MLD-coated catalysts reached steady state
116
faster than the uncoated catalyst, had less coke deposition during the reaction, and in the case of
5-MLD cycles, had a higher DRM rate than the uncoated sample. The MLD layers stabilized the
Ni particles, which sintered less than the uncoated catalyst.
5.3. Experimental Methods
5.3.1 Catalyst preparation
The Ni catalyst nanoparticles were deposited by ALD at 673 K in a fluidized-bed reactor
(FBR) as described previously,[25] but using approximately 0.25 g of the Ni precursor (NiCp2)
to deposit less Ni. Approximately 2 g of precursor are needed to react with all available active
sites on the support. This would deposit the maximum amount of Ni metal in one ALD cycle, but
here less precursor was used in order to obtain a lower Ni weight loading. Nitrogen flowed over
the solid Ni ALD precursor and transported the precursor vapor to the FBR. Alumina
nanoparticles (< 50-nm γ-alumina spheres, ~ 37 m2•g
-1 surface area, Aldrich 544833) were used
as the catalyst support because alumina is a common support for DRM reactions, and because
imaging nanoparticles by TEM on these supports required no cross-sectioning or dispersion on
the TEM grids (aside from electrostatic adherence). All the catalysts were synthesized from the
same 5-g batch of ALD catalyst. Approximately 1 g was removed from the batch for
characterization of the uncoated catalyst and the rest was coated with MLD layers. After each
set of 5 MLD coatings, 1 g of the sample was removed from the FBR, and the remaining sample
was left in the reactor for further MLD coating. The catalyst was coated by alucone MLD at 450
K with ABC chemistry (TMA, EA, MA).[22] Each MLD cycle consisted of a 30- to 60-min
precursor dose, followed by a 30-min purge with N2 and a 30-min evacuation between precursor
doses (repeated for each of the ABC precursors).
117
5.3.2 Catalyst characterization
The weight loadings of each sample were determined by inductively coupled plasma
mass spectroscopy (ICP-MS) after the samples were dissolved in an HF/HNO3/HCl solution for
approximately 24 h. The number of active sites was measured by H2 uptake with a
Quantachrome AS-1 Autosorb. The catalysts were calcined in air at 773 K for 1 h in a tubular
furnace (Lindberg heavy duty type 59754), then reduced at 773 K (unless otherwise specified) in
pure H2 for 1 h in the Autosorb before measuring the H2 uptake. Transmission electron
microscopy (TEM) was used to estimate Ni particle sizes. Particles were measured using Image
J software to analyze images from an FEI Tecnai 12 - Spirit Biotwin TEM and a Phillips CM-
100 TEM. Samples were electrostatically adhered to copper grids with a lacey carbon over-layer
(Ted-Pella 01895 Lacey Carbon Film grids) to avoid effects of solvents from dropcasting.
The catalysts were characterized by temperature-programmed oxidation (TPO) in a
quartz tube reactor (6.35-mm inner diameter) at ramp rates of 60 K/min, and the effluent from
the reactor was analyzed with an SRS RGA 200 mass spectrometer. The catalysts were cooled
to room temperature from 973 K under Ar flow after the DRM reaction was stopped, and then a
stream of 10 sccm O2 and 40 sccm Ar was flowed over the catalyst at room temperature. The
temperature was then ramped while the CO2 production rate was measured with the mass
spectrometer.
5.3.3 Reaction studies
The catalysts were evaluated for DRM activity in a quartz tube, packed bed reactor (6.35-
mm ID). The catalysts were first oxidized for 1 h at 773 K in 100 sccm 20% O2 (balance Ar) to
remove the organic components of the MLD layer and create a porous alumina matrix as
depicted in Schematic 5.1. The uncoated catalysts were also oxidized so that all catalysts went
118
through the same pretreatment procedure. The catalysts were then reduced at 773 K for 1 h in
100 sccm 20% H2 (balance Ar). All catalysts were heated to 973 K and held at that temperature
for approximately 10 min before the reactants were introduced to the reactor. Effluent gases
were analyzed by a SRI 8610c GC with a Haysep-D packed column. Gas flow rates were 20
sccm CH4, 20 sccm CO2, and 60 sccm Ar. Approximately 80 mg of catalyst was used for
catalytic testing. At the end of the reaction time, the reactant flow was stopped and replaced by
inert carrier gas before cooling the catalysts in order to avoid additional carbon deposition as the
reactor cooled.
5.4. Results and Discussion
5.4.1. MLD Layer Deposition & Preparation
Nickel nanoparticles were deposited by ALD on an alumina support for testing the
effectiveness of MLD layers at preventing sintering. One ALD cycle was used to create small
metal particles. The weight loadings of the catalysts were kept below 0.8 Ni wt% to limit
sintering. The average Ni particle size was difficult to accurately measure by TEM due to their
small size (~2 to 5 nm, see Figure 5.1), but H2 chemisorption estimated the average uncoated Ni
particle diameter to be ~5.3 nm (after 1-h calcination at 773 K followed by 1-h reduction at 773
K, which likely induced some sintering).

119
Figure 5.1. A) Ni nanoparticles (~2-5 nm dark particles) deposited on spherical alumina;
Ni/Al2O3 nanoparticles coated by B) 5-MLD cycles, C) 10-MLD cycles, D) 15-MLD cycles,
where the hybrid polymer-inorganic MLD layer is the lighter layer encompassing the spheres in
B-D.
The ALD catalysts were coated with alucone using 5, 10 and 15 ABC MLD cycles. As
shown in Figure 5.1, these coatings did not significantly change the Ni particle size, and ICP-MS
indicated that the alumina MLD layers did not significantly alter the metal weight loadings. The
coating measured by TEM for 15-MLD cycles was thicker (3.5 +/- 0.5 nm) than the 10-cycle
layer (2.4 +/- 0.5 nm), as expected, but the 5-MLD cycle layer was too thin to measure.
C D
B A

120
Chemisorption measurements were initially performed after pretreating the catalysts (which were
previously calcined at 773 K) by reducing the samples for 1 h in pure H2 at 773 K. Hydrogen
uptake (Figure 5.2) was then measured for the same catalyst samples after reduction at 873 K
and 973 K. As expected, the uncoated catalyst lost surface area (due to sintering) with
successive reductions at higher temperatures. In contrast, the MLD-coated catalysts increased H2
uptake with increasing reduction temperature. The increase in active metal with reduction
temperature is atypical, and is likely due to both reduction of NiO under the MLD film, and pore
expansion within the MLD film so as to uncover more metal surface area. Further reduction of
the 10 and 15 MLD-cycle catalysts at 973 K did not increase the H2 uptake (Figure 5.2), but
further reduction (two 1-h treatments at 973 K) increased the H2 uptake of the 5-MLD sample
from 6.0 +/- 0.5 to 8.1 +/- 0.2 μmol H2 • gcat-1. The 10 and 15 MLD-cycle samples had similar
H2 uptake after reduction at 973 K (i.e., once the maximum number of sites were made
available), which indicates that adding more MLD cycles to the 10-MLD cycle catalyst did not
block additional sites once the catalysts had been reduced at 973 K. In contrast, increasing from
5 to 10-MLD cycles increased the number of sites blocked by the MLD layer, even after
reduction at 975 K. Although the 15-MLD cycle catalyst had an unexpected higher H2 uptake at
lower temperatures than the 10-MLD cycle catalyst, this difference most likely came from the
15-MLD cycle sample being left in ambient conditions for 1 month longer than the other samples
(water vapor is known to start opening pores in uncalcined MLD layers[22]).
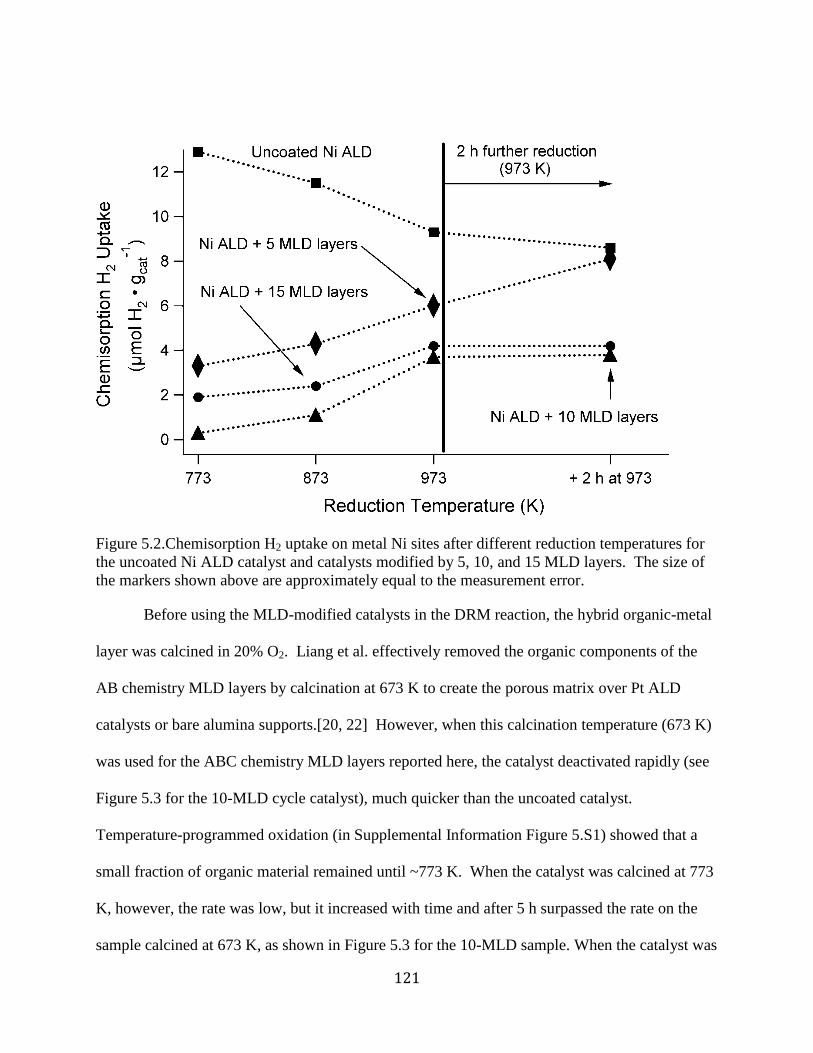
121
Figure 5.2.Chemisorption H2 uptake on metal Ni sites after different reduction temperatures for
the uncoated Ni ALD catalyst and catalysts modified by 5, 10, and 15 MLD layers. The size of
the markers shown above are approximately equal to the measurement error.
Before using the MLD-modified catalysts in the DRM reaction, the hybrid organic-metal
layer was calcined in 20% O2. Liang et al. effectively removed the organic components of the
AB chemistry MLD layers by calcination at 673 K to create the porous matrix over Pt ALD
catalysts or bare alumina supports.[20, 22] However, when this calcination temperature (673 K)
was used for the ABC chemistry MLD layers reported here, the catalyst deactivated rapidly (see
Figure 5.3 for the 10-MLD cycle catalyst), much quicker than the uncoated catalyst.
Temperature-programmed oxidation (in Supplemental Information Figure 5.S1) showed that a
small fraction of organic material remained until ~773 K. When the catalyst was calcined at 773
K, however, the rate was low, but it increased with time and after 5 h surpassed the rate on the
sample calcined at 673 K, as shown in Figure 5.3 for the 10-MLD sample. When the catalyst was

122
calcined at 673 K, the Ni metal was likely more reduced initially, and thus had a higher DRM
rate initially. However, organic components remained in the MLD layer because of the milder
oxidation temperature and likely blocked pores and may have coked the catalyst surface more
than normal reaction conditions. Calcining at 773 K yielded approximately the same steady-state
DRM rate as a TPO up to 973 K, so for all subsequent reactions, the organic components of the
MLD layer were removed by calcination at 773 K.
Figure 5.3. Methane dry reforming rate of the Ni ALD catalyst modified with 10 ABC MLD
layers for varying calcination treatments used to remove the organic components from the MLD
layers.
5.4.2. Catalyst evaluation for DRM stability and activity
The catalysts were evaluated for dry reforming activity and stability to gauge the
effectiveness of the MLD layers at reducing sintering and maintaining catalytic activity. The
DRM rates increased over time when the catalysts were modified with MLD layers (Figure 5.3),

123
but the uncoated catalyst activity decreased over time (Figure 5.4) due to sintering and coking
(which is typically observed for catalysts of this size during DRM at these temperatures [26,
27]). The DRM reaction was run at 973 K to increase sintering and to determine the
effectiveness of MLD at preventing sintering.
Figure 5.4. Dry reforming rates at 973 K for uncoated Ni ALD catalyst, and the same catalyst
coated with 5, 10, and 15 MLD layers.
A shown in Figure 5.4, the catalyst with 5-MLD layers reached steady state fastest, and
the steady-state DRM rate decreased as the number of MLD cycles increased. Adding 5 MLD
layers not only stabilized the catalyst, but its steady-state rate was higher than that of the
uncoated catalyst after 6 h. The rate most likely increased with time because the Ni surface area
increased, either due to expansion of the alumina pores or reduction of NiO. To determine if
surface area increased solely from pore expansion, a previously-calcined, 10-cycle MLD sample
(1 h at 773 K) was reduced at 773 K for 1 h. The H2 uptake for this sample was below the
124
detection limit. The catalyst was then held at 973 K in He for 4 h to potentially open more pores,
but after reducing again at 773 K, this sample had negligible H2 uptake. Holding the porous
layer at high temperature alone could not account for the surface area increase, and therefore the
surface area likely increased because the NiO (or NiAl2O4) was reduced at higher temperatures,
or by reducing the catalyst with simultaneous pore expansion.
The DRM rate increased with time when the 10-MLD layer catalyst was oxidized and
reduced at 773 K the first time, but when that same catalyst was oxidized and reduced again (1 h
each treatment at 773 K), the opposite behavior was observed; the rate decreased with time
(likely due to coking) before stabilizing at the same rate as before. Subsequent calcination and
reduction of the catalyst yielded the same result, indicating that the 10-MLD layer catalyst could
be regenerated and was stable for DRM. The 10-MLD cycle catalyst was also reduced at 973 K,
instead of 773 K, before running the DRM reaction to determine if the activation period could be
bypassed by reducing at a higher temperature. The DRM rate, shown in Supplemental
Information Figure 5.S2, was similar to that of the regenerated 10-MLD cycle catalyst; the
reaction rate decreased over time before stabilizing. The rate also decreased with time when the
5-MLD cycle catalyst was calcined and reduced again, as shown in Figure 5.5, but the steady-
state rate was 22% lower than the fresh catalyst. Moreover, a second calcination and reduction
resulted in a slightly lower rate. Although this sample was stable and more active for the DRM
reaction after the initial pretreatment, the thinner MLD layer likely decomposed further during
calcination and reduction so that the Ni particles sintered further. The twice-regenerated 5-MLD
cycle catalyst had an average Ni particle size of 8.4 +/- 2.9 nm, which was larger than the 6.8 +/-
2.1 nm average particle size of the fresh catalyst after 24 h of reaction.
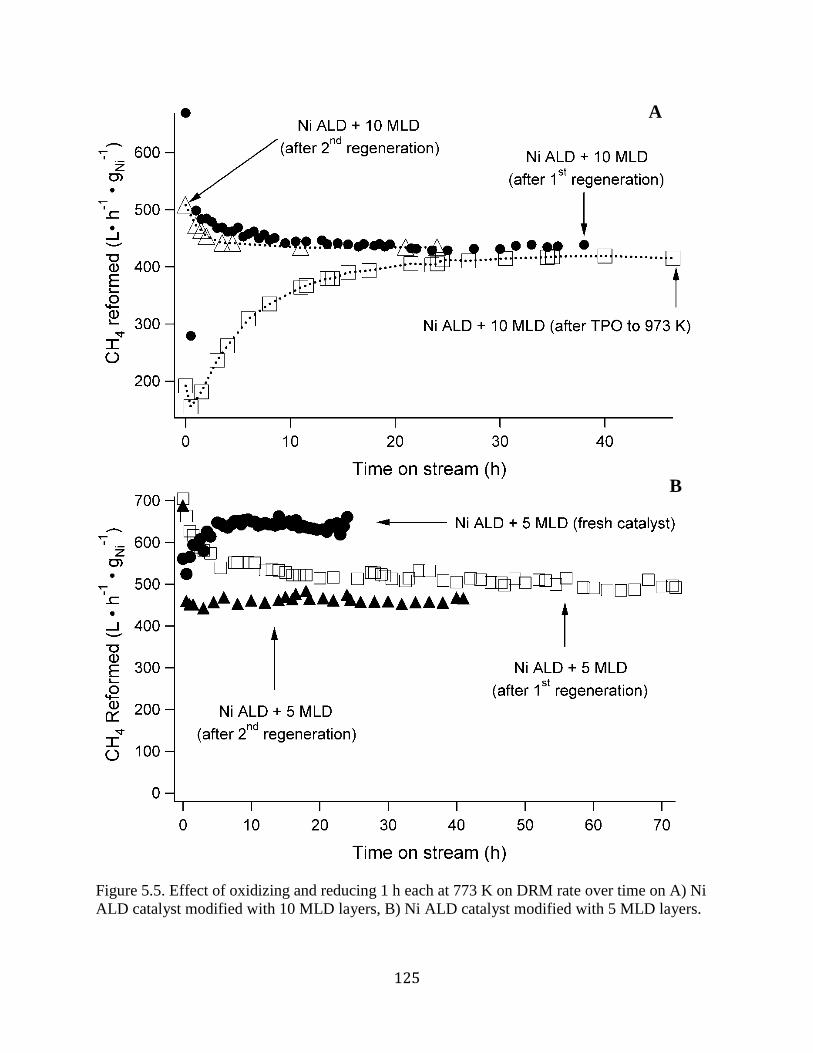
125
Figure 5.5. Effect of oxidizing and reducing 1 h each at 773 K on DRM rate over time on A) Ni
ALD catalyst modified with 10 MLD layers, B) Ni ALD catalyst modified with 5 MLD layers.
A
B

126
The Ni particles sintered during DRM, as measured by TEM (Figure 5.6), but the
uncoated catalyst sintered the most; it had a post-reaction particle size of 9.7 +/- 3.9 nm after 82
h of reaction. Coating the catalysts with 5-MLD cycles reduced sintering (Ni particle size after
24 h of reaction was 6.8 +/- 2.1 nm and after 2 regenerations was 8.4 +/- 2.9 nm). The 10-cycle
catalyst sintered the least (Ni particle size after 108-h total reaction time and 2 regenerations was
7.8 +/- 3.5 nm). The standard deviation of particle size was also smaller for the 5 and 10-cycle
catalysts, and the distribution of particle sizes (Supplemental Figure 5.S3) showed more particles
in the sub 5-nm range than the uncoated catalyst and fewer particles that were > 15 nm. The
wider range of particle sizes in the uncoated sample is likely due to a higher degree of Ostwald
ripening, where metal atoms desorb from smaller particles and then adsorb on larger particles to
minimize particle surface energy. Measuring the size of particles on the 15-MLD cycle sample
after reaction was difficult because of difficulties distinguishing the calcined MLD layer from
individual Ni particles.
Figure 5.6. TEM images of post-reaction Ni catalysts on spherical alumina supports: (A)
uncoated sample after 82-h DRM reaction, (B) coated with 5-MLD layers after 24-h reaction, (C)
coated with 10-MLD cycles after 108-h total time on stream and 2 regenerations
Although reduced sintering was the main focus of this study, another benefit of small
particle size is less coking.[10] Bengaard et al. showed, using thermogravimetric analysis, that
7-nm Ni particles had a 100-K higher coking onset temperature than ~100-nm Ni particles and
A B C
127
the smaller Ni particles coked at a much slower rate.[10] Previous work on a 6 wt% Ni IW
catalyst (~17-nm particles)[28] and other studies have shown that the large Ni particles readily
form carbon whiskers [14, 25], whereas carbon whiskers were not detected for any of the ALD
catalysts used in this study. The amount of carbon deposited during DRM reactions was
measured by TPO. The Ni ALD particles are less susceptible to coking than most Ni catalysts
due to their small size, but as shown in Figure 5.7, adding MLD layers to the catalyst decreases
coking during DRM. Not only does the MLD layer prevent sintering, but maintaining the small
particle size also inhibits coke deposition. The CO2 formed at a much lower temperature on the
15-cycle catalyst than the other two. This lower temperature peak is indicative of a less-stable
carbon type, which could be due to a smaller available Ni ensemble size caused by the more-
complete MLD layer. Olafsen et al. showed a similar lower-temperature peak during
temperature-programmed hydrogenation of carbon that formed during dry reforming on Ni
catalysts.[29] They attributed this peark to a less stable (and less harmful) carbon type.[29]
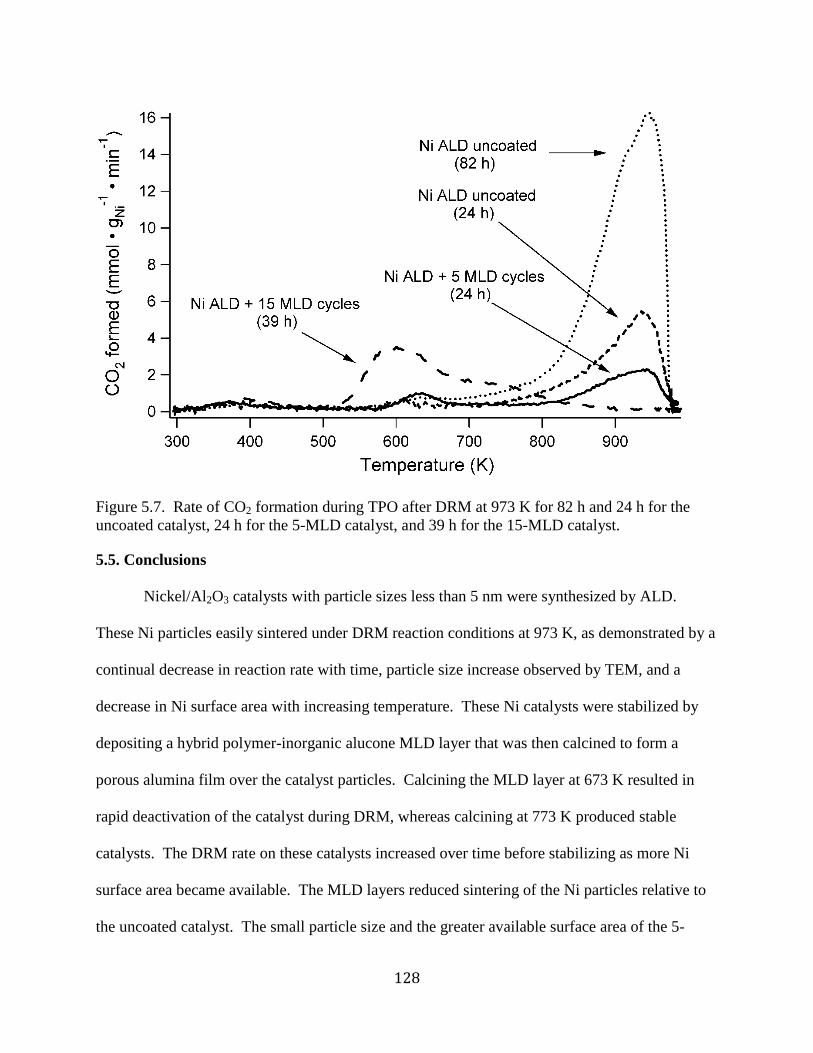
128
Figure 5.7. Rate of CO2 formation during TPO after DRM at 973 K for 82 h and 24 h for the
uncoated catalyst, 24 h for the 5-MLD catalyst, and 39 h for the 15-MLD catalyst.
5.5. Conclusions
Nickel/Al2O3 catalysts with particle sizes less than 5 nm were synthesized by ALD.
These Ni particles easily sintered under DRM reaction conditions at 973 K, as demonstrated by a
continual decrease in reaction rate with time, particle size increase observed by TEM, and a
decrease in Ni surface area with increasing temperature. These Ni catalysts were stabilized by
depositing a hybrid polymer-inorganic alucone MLD layer that was then calcined to form a
porous alumina film over the catalyst particles. Calcining the MLD layer at 673 K resulted in
rapid deactivation of the catalyst during DRM, whereas calcining at 773 K produced stable
catalysts. The DRM rate on these catalysts increased over time before stabilizing as more Ni
surface area became available. The MLD layers reduced sintering of the Ni particles relative to
the uncoated catalyst. The small particle size and the greater available surface area of the 5-

129
MLD cycle catalyst caused that sample to have the highest steady-state DRM rate (even higher
than the uncoated catalyst after 6 h). The 10-MLD cycle catalyst, even though it had a lower
DRM rate, was stable even after repeated calcinations and reductions. Coating the catalysts with
alumina MLD layers reduced coking during DRM compared to uncoated Ni.
Acknowledgments
We acknowledge financial support from NSF grant CBET 1067800.
5.6. References
[1] E.J. Moniz, H.D. Jacoby, A. Meggs, R. Armtrong, D. Cohn, S. Connors, J. Deutch, Q. Ejaz,
J. Hezir, G. Kaufman, The future of natural gas, in, Cambridge, MA: MIT Press, 2011.
[2] Natural Gas Reforming, in: U.S.D.o. Energy (Ed.), U.S. Department of Energy, 2013.
[3] J.R. Rostrup-Nielsen, J. Sehested, J.K. Nørskov, Hydrogen and synthesis gas by steam- and
C02 reforming, in: Advances in Catalysis, Academic Press, 2002, pp. 65-139.
[4] J. Rostrupnielsen, J.B. Hansen, Journal of Catalysis 144 (1993) 38-49.
[5] J.H. Edwards, A.M. Maitra, Fuel Processing Technology 42 (1995) 269-289.
[6] D.A. Wood, C. Nwaoha, B.F. Towler, Journal of Natural Gas Science and Engineering 9
(2012) 196-208.
[7] M. Gharibi, F.T. Zangeneh, F. Yaripour, S. Sahebdelfar, Applied Catalysis A: General 443-
444 (2012) 8-26.
[8] J. Sehested, Catalysis Today 111 (2006) 103-110.
[9] J. Sehested, Journal of Catalysis 217 (2003) 417-426.
[10] H. Bengaard, J.K. Nørskov, J. Sehested, B.S. Clausen, L.P. Nielsen, A.M. Molenbroek, J.R.
Rostrup-Nielsen, Journal of Catalysis 209 (2002) 365-384.
[11] S.R. de Miguel, I.M.J. Vilella, S.P. Maina, D.S. José-Alonso, M.C. Román-Martínez, M.J.
Illán-Gómez, Applied Catalysis A: General (2012).
[12] M. García-Diéguez, E. Finocchio, M.Á. Larrubia, L.J. Alemany, G. Busca, Journal of
Catalysis 274 (2010) 11-20.
[13] M. García-Diéguez, I.S. Pieta, M.C. Herrera, M.A. Larrubia, L.J. Alemany, Applied
Catalysis A: General 377 (2010) 191-199.
[14] S. Helveg, J. Sehested, J.R. Rostrup-Nielsen, Catalysis Today 178 (2011) 42-46.
[15] G. Jones, J.G. Jakobsen, S.S. Shim, J. Kleis, M.P. Andersson, J. Rossmeisl, F. Abild-
Pedersen, T. Bligaard, S. Helveg, B. Hinnemann, J.R. Rostrup-Nielsen, I. Chorkendorff, J.
Sehested, J.K. Nørskov, Journal of Catalysis 259 (2008) 147-160.
[16] J. Lu, J.W. Elam, P.C. Stair, Accounts of Chemical Research (2013).
[17] H. Feng, J. Lu, P. Stair, J. Elam, Catalysis Letters 141 (2011) 512-517.
[18] J. Lu, B. Fu, M.C. Kung, G. Xiao, J.W. Elam, H.H. Kung, P.C. Stair, Science 335 (2012)
1205-1208.
[19] J. Lu, P.C. Stair, Angewandte Chemie International Edition 49 (2010) 2547-2551.
130
[20] X. Liang, J. Li, M. Yu, C.N. McMurray, J.L. Falconer, A.W. Weimer, ACS Catalysis 1
(2011) 1162-1165.
[21] N. Suzuki, Y. Yamauchi, Journal of sol-gel science and technology 53 (2010) 428-433.
[22] X. Liang, B. W Evanko, A. Izar, D. M King, Y.-B. Jiang, A.W. Weimer, Microporous and
Mesoporous Materials (2012).
[23] A.A. Dameron, D. Seghete, B.B. Burton, S.D. Davidson, A.S. Cavanagh, J.A. Bertrand,
S.M. George, Chemistry of Materials 20 (2008) 3315-3326.
[24] B. Yoon, D. Seghete, A.S. Cavanagh, S.M. George, Chemistry of Materials 21 (2009) 5365-
5374.
[25] T.D. Gould, A.M. Lubers, B.T. Neltner, J.V. Carrier, A.W. Weimer, J.L. Falconer, J. Will
Medlin, Journal of Catalysis 303 (2013) 9-15.
[26] D. Baudouin, U. Rodemerck, F. Krumeich, A.d. Mallmann, K.C. Szeto, H. Ménardd, L.
Veyre, J.-P. Candy, P.B. Webb, C. Thieuleux, C. Copéreta, Journal of Catalysis 297 (2013) 27-
34.
[27] D. Baudouin, K.C. Szeto, P. Laurent, A. De Mallmann, B. Fenet, L. Veyre, U. Rodemerck,
C. Copéret, C. Thieuleux, Journal of the American Chemical Society 134 (2012) 20624-20627.
[28] T.D. Gould, M.M. Montemore, A.M. Lubers, A. Weimer, J.L. Falconer, J.W. Medlin,
Submitted to Journal of Catalysis (2013).
[29] A. Olafsen, C. Daniel, Y. Schuurman, L. RÃ¥berg, U. Olsbye, C. Mirodatos, Catalysis
Today 115 (2006) 179-185.
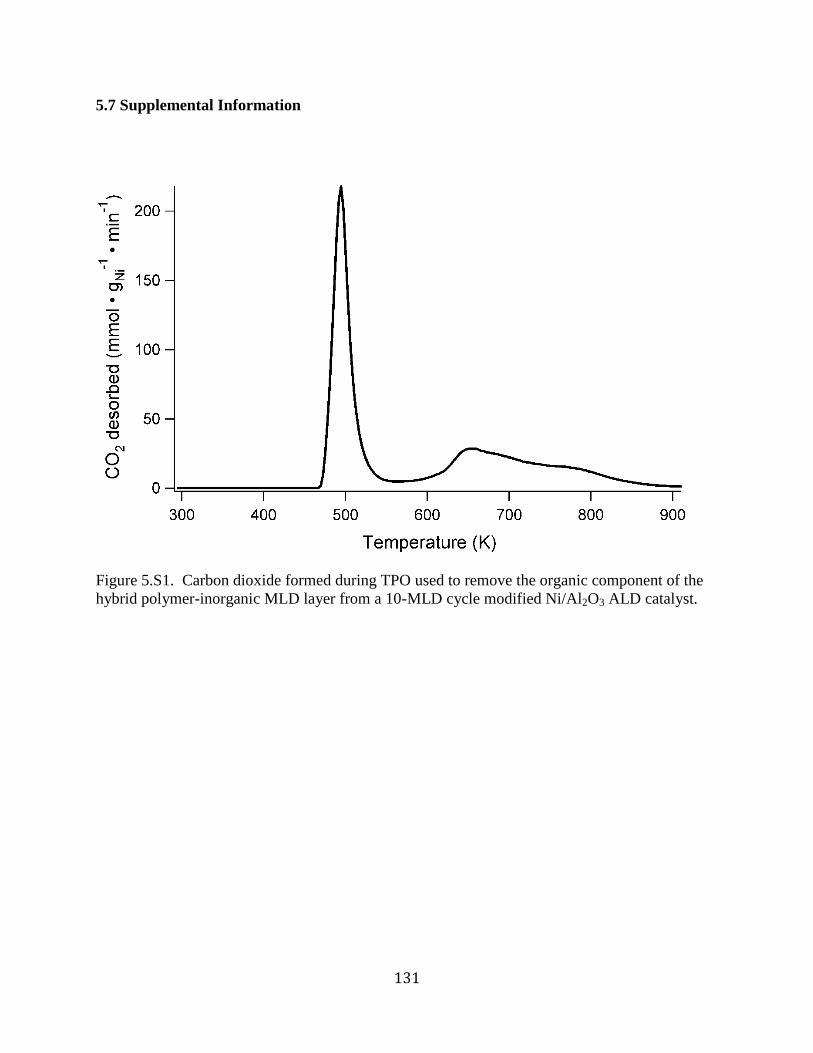
131
5.7 Supplemental Information
Figure 5.S1. Carbon dioxide formed during TPO used to remove the organic component of the
hybrid polymer-inorganic MLD layer from a 10-MLD cycle modified Ni/Al2O3 ALD catalyst.
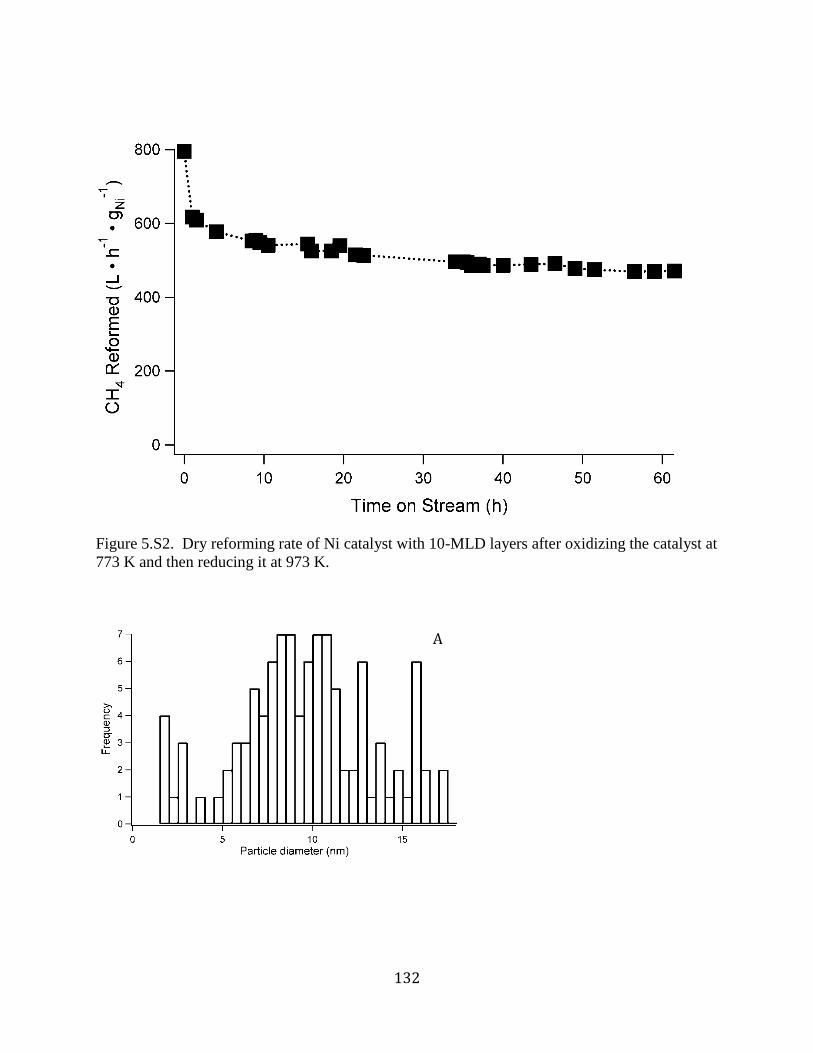
132
Figure 5.S2. Dry reforming rate of Ni catalyst with 10-MLD layers after oxidizing the catalyst at
773 K and then reducing it at 973 K.
A

133
Figure 5.S3. Nickel particle size distributions of A) Ni ALD uncoated catalyst after 82-h DRM,
B) Ni ALD catalyst with 5-MLD layers after 2 regenerations and 138-h total DRM time, C) Ni
ALD catalyst with 10-MLD layers after 2 regenerations and 108-h DRM.
C
B
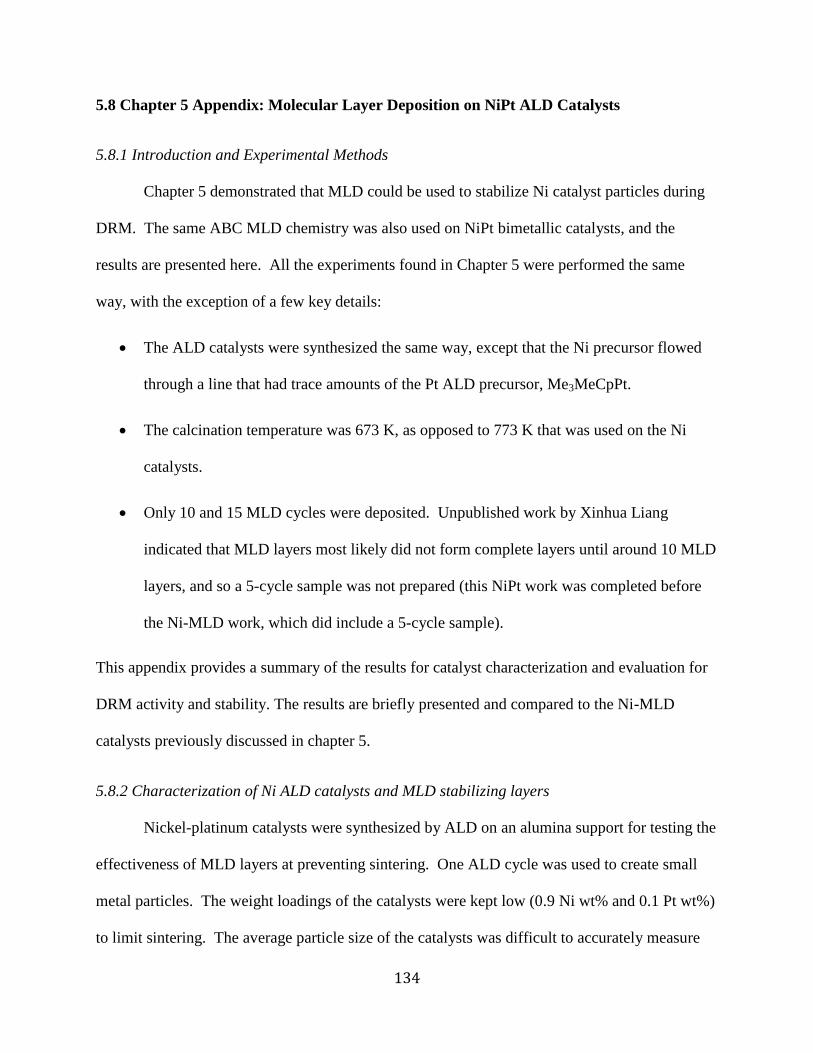
134
5.8 Chapter 5 Appendix: Molecular Layer Deposition on NiPt ALD Catalysts
5.8.1 Introduction and Experimental Methods
Chapter 5 demonstrated that MLD could be used to stabilize Ni catalyst particles during
DRM. The same ABC MLD chemistry was also used on NiPt bimetallic catalysts, and the
results are presented here. All the experiments found in Chapter 5 were performed the same
way, with the exception of a few key details:
The ALD catalysts were synthesized the same way, except that the Ni precursor flowed
through a line that had trace amounts of the Pt ALD precursor, Me3MeCpPt.
The calcination temperature was 673 K, as opposed to 773 K that was used on the Ni
catalysts.
Only 10 and 15 MLD cycles were deposited. Unpublished work by Xinhua Liang
indicated that MLD layers most likely did not form complete layers until around 10 MLD
layers, and so a 5-cycle sample was not prepared (this NiPt work was completed before
the Ni-MLD work, which did include a 5-cycle sample).
This appendix provides a summary of the results for catalyst characterization and evaluation for
DRM activity and stability. The results are briefly presented and compared to the Ni-MLD
catalysts previously discussed in chapter 5.
5.8.2 Characterization of Ni ALD catalysts and MLD stabilizing layers
Nickel-platinum catalysts were synthesized by ALD on an alumina support for testing the
effectiveness of MLD layers at preventing sintering. One ALD cycle was used to create small
metal particles. The weight loadings of the catalysts were kept low (0.9 Ni wt% and 0.1 Pt wt%)
to limit sintering. The average particle size of the catalysts was difficult to accurately measure

135
by TEM due to their small size, which was estimated to be 4.8 nm by H2 chemisorption. Images
of these catalysts are shown in Figure 5.A1.
Figure 5.A1. NiPt nanoparticles (~1-2 nm dark particles) deposited on spherical alumina, B) NiPt
nanoparticles coated by 10-MLD cycles, C) NiPt nanoparticles coated by 15-MLD cycles.
The ALD catalysts were coated with 10 and 15 ABC MLD cycles. As shown in Figure
5.A1, these coatings did not significantly change the Ni particle size, and ICP-MS indicated that
the MLD layers did not significantly alter the metal weight loadings. The coating measured by
TEM for 15-MLD cycles was thicker (2.9 +/- 0.5 nm) than the 10-cycle layer (2.1 +/- 0.2 nm), as
expected. After calcination, the MLD coating was not detected by TEM for the 10-MLD cycles
catalyst, but the collapsed porous layer was still visible for the 15-cycle MLD layer, as shown in
Figure 5.A2.
A B
C
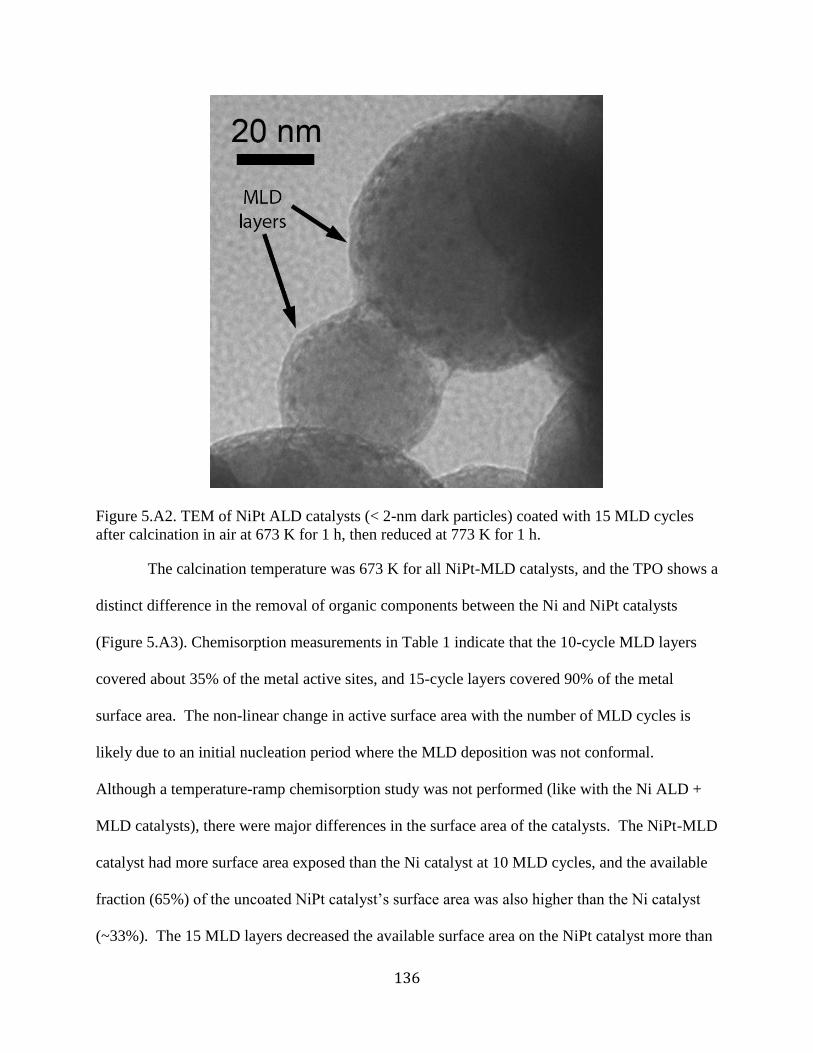
136
Figure 5.A2. TEM of NiPt ALD catalysts (< 2-nm dark particles) coated with 15 MLD cycles
after calcination in air at 673 K for 1 h, then reduced at 773 K for 1 h.
The calcination temperature was 673 K for all NiPt-MLD catalysts, and the TPO shows a
distinct difference in the removal of organic components between the Ni and NiPt catalysts
(Figure 5.A3). Chemisorption measurements in Table 1 indicate that the 10-cycle MLD layers
covered about 35% of the metal active sites, and 15-cycle layers covered 90% of the metal
surface area. The non-linear change in active surface area with the number of MLD cycles is
likely due to an initial nucleation period where the MLD deposition was not conformal.
Although a temperature-ramp chemisorption study was not performed (like with the Ni ALD +
MLD catalysts), there were major differences in the surface area of the catalysts. The NiPt-MLD
catalyst had more surface area exposed than the Ni catalyst at 10 MLD cycles, and the available
fraction (65%) of the uncoated NiPt catalyst’s surface area was also higher than the Ni catalyst
(~33%). The 15 MLD layers decreased the available surface area on the NiPt catalyst more than
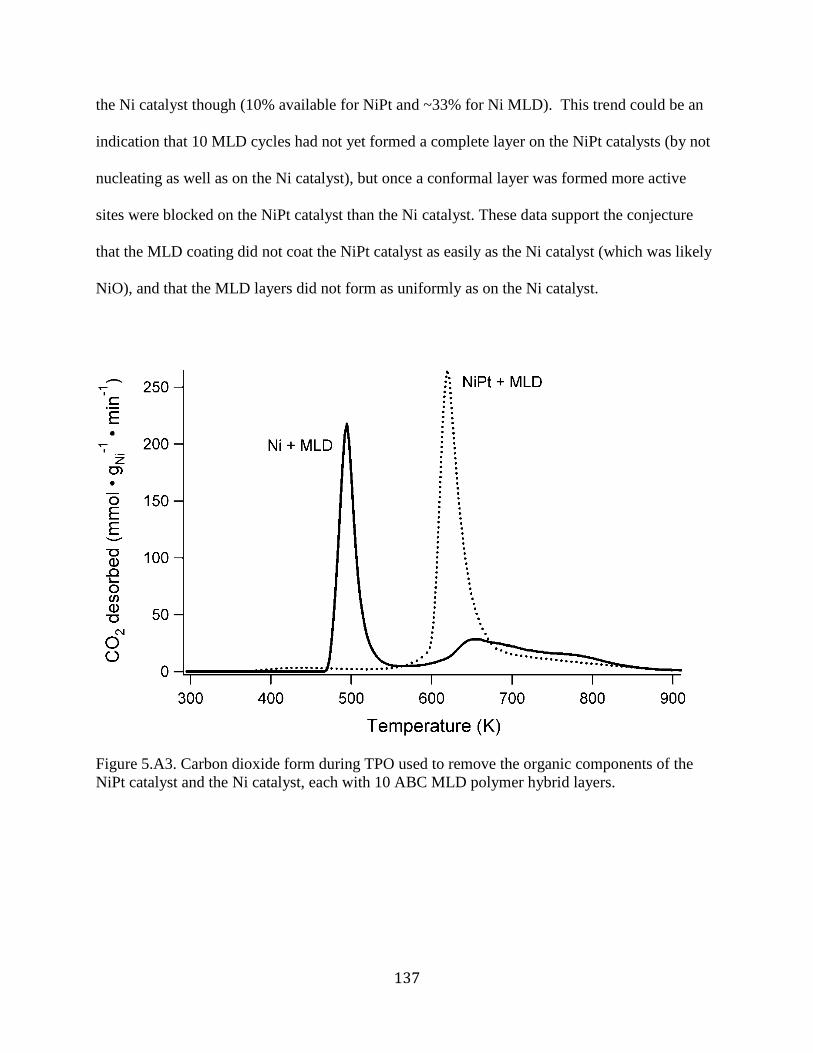
137
the Ni catalyst though (10% available for NiPt and ~33% for Ni MLD). This trend could be an
indication that 10 MLD cycles had not yet formed a complete layer on the NiPt catalysts (by not
nucleating as well as on the Ni catalyst), but once a conformal layer was formed more active
sites were blocked on the NiPt catalyst than the Ni catalyst. These data support the conjecture
that the MLD coating did not coat the NiPt catalyst as easily as the Ni catalyst (which was likely
NiO), and that the MLD layers did not form as uniformly as on the Ni catalyst.
Figure 5.A3. Carbon dioxide form during TPO used to remove the organic components of the
NiPt catalyst and the Ni catalyst, each with 10 ABC MLD polymer hybrid layers.
138
Table 5.A3. Catalyst properties and DRM activity
MLD
cycles
H2 adsorbed
(μmol·gcatalyst-1
)
Time
on
stream
(h)
Initial DRM
activitya
(L CH4 ·h-1
·gmetal-1
)
Final DRM
activity
(L CH4 ·h-1
·gmetal-1
)
Particle size
after reaction
(nm)
0 20 220 720 460 6.0 +/- 4.2
10 13 12 710 520 4.8 +/- 1.4
15 2.0 172 540 390 3.4 +/- 1.0
a The maximum rate within the first few hours, ignoring the initial data point.
5.8.3 Dry reforming activity and stability
The catalysts were evaluated for dry reforming activity and stability to gauge the
effectiveness of the MLD layers at preventing sintering. All of the DRM rates decreased over
time (Figure 5.A4), but the percent activity lost decreased when the catalysts were coated by 15
MLD cycles. The initial DRM rate per gram of metal for the 10-cycle MLD catalyst was similar
to the uncoated catalyst, and the initial rate for 15-cycle MLD sample was ~25% lower than the
uncoated catalyst. The ratio of initial rates for the MLD catalysts to the uncoated catalyst was
much larger than the ratio of their active surface areas measured by chemisorption. These
discrepancies were likely due to partial uncovering of metal sites at reaction conditions, since the
catalysts were reacted at 973 K but only heated to 773 K before chemisorption. The thermal
stresses from the high temperature likely caused the small pores in the alumina layer open up
more to expose additional sites on the catalysts. Suzuki and Yamauchi also observed similar
behavior in their porous alumina structures synthesized by a single-step sol-gel technique.[1]
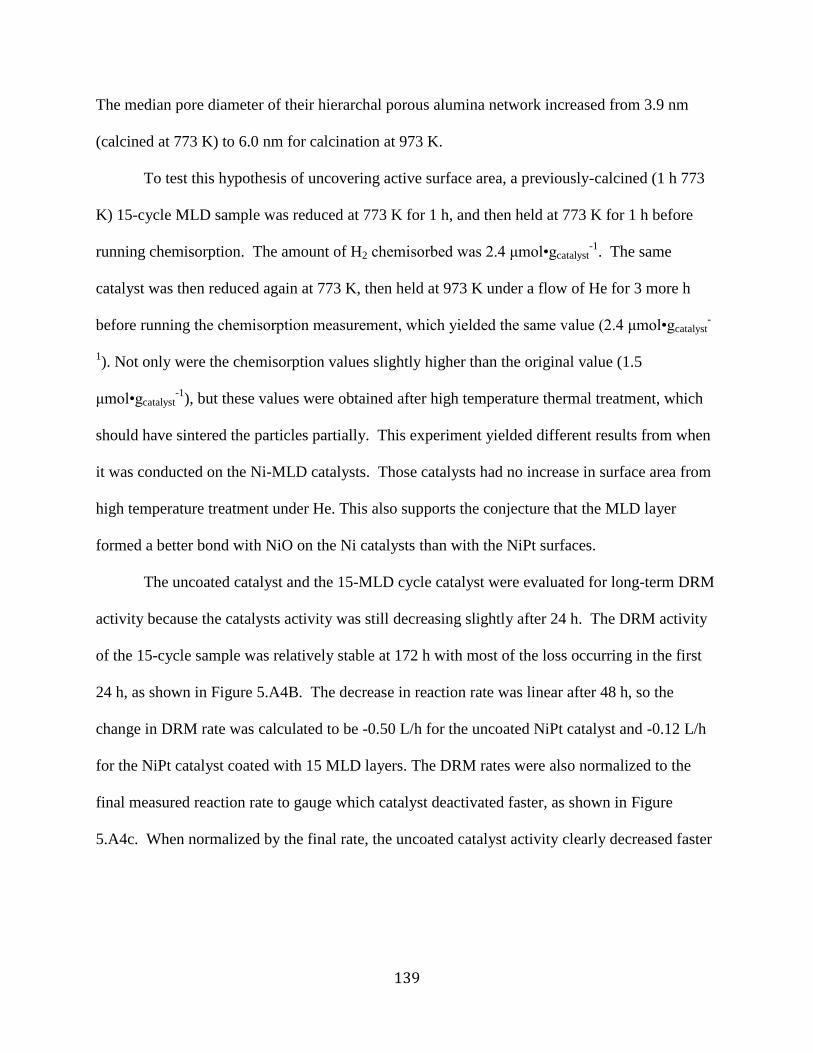
139
The median pore diameter of their hierarchal porous alumina network increased from 3.9 nm
(calcined at 773 K) to 6.0 nm for calcination at 973 K.
To test this hypothesis of uncovering active surface area, a previously-calcined (1 h 773
K) 15-cycle MLD sample was reduced at 773 K for 1 h, and then held at 773 K for 1 h before
running chemisorption. The amount of H2 chemisorbed was 2.4 μmol•gcatalyst-1
. The same
catalyst was then reduced again at 773 K, then held at 973 K under a flow of He for 3 more h
before running the chemisorption measurement, which yielded the same value (2.4 μmol•gcatalyst-
1). Not only were the chemisorption values slightly higher than the original value (1.5
μmol•gcatalyst-1
), but these values were obtained after high temperature thermal treatment, which
should have sintered the particles partially. This experiment yielded different results from when
it was conducted on the Ni-MLD catalysts. Those catalysts had no increase in surface area from
high temperature treatment under He. This also supports the conjecture that the MLD layer
formed a better bond with NiO on the Ni catalysts than with the NiPt surfaces.
The uncoated catalyst and the 15-MLD cycle catalyst were evaluated for long-term DRM
activity because the catalysts activity was still decreasing slightly after 24 h. The DRM activity
of the 15-cycle sample was relatively stable at 172 h with most of the loss occurring in the first
24 h, as shown in Figure 5.A4B. The decrease in reaction rate was linear after 48 h, so the
change in DRM rate was calculated to be -0.50 L/h for the uncoated NiPt catalyst and -0.12 L/h
for the NiPt catalyst coated with 15 MLD layers. The DRM rates were also normalized to the
final measured reaction rate to gauge which catalyst deactivated faster, as shown in Figure
5.A4c. When normalized by the final rate, the uncoated catalyst activity clearly decreased faster

140
and lost much more of its activity compared to the 15-MLD coated catalyst.
141
Figure 5.A4. Dry reforming rates at 973 K: A) first 24 h for uncoated NiPt ALD catalyst, and the
same catalysts coated with 10 and 15 MLD layers. B) Long term DRM rates for uncoated and
15-MLD catalyst. C) DRM Rates normalized to final observed DRM rate for uncoated NiPt and
15-MLD NiPt catalysts.
The metal particles sintered during DRM, as measured by TEM (Figure 5.A5), but the
uncoated catalyst sintered the most; it had a post-reaction particle size of 6.3 +/- 2.4 nm after 24
h and 6.0 +/- 4.4 nm after 220 h. Coating the catalysts with 10-MLD cycles reduced sintering
(particle size after 12 hours of reaction was 4.8 +/- 1.4 nm), and the 15-cycle catalyst sintered the
least (particle size after 172 h of reaction was 3.4 +/- 1.0 nm). The standard deviation of particle
size was also smaller for the 15-cycle catalyst. The wider range of particle sizes in the uncoated
sample is likely due to Ostwald ripening, where smaller particles desorb atoms, which then
adsorb on larger particles to minimize particle surface energy.

142
Figure 5.A5. TEM images of post-reaction NiPt catalysts on spherical alumina supports: (A)
uncoated sample, after 24 h reaction, (B) coated with 10 MLD layers, after 12 h reaction, (C)
coated with 15 MLD cycles, after 172 h reaction
Although sintering prevention was the main focus of this study, another benefit of
maintaining small particle size is inhibiting coking. The MLD-treated sample accumulated less
carbon in 172 h than uncoated catalyst (after 220 h), as shown in Figure 5.A6. The extra reaction
time on the uncoated catalyst likely did not significantly increase the sintering of the particles or
the amount of coke. The broadness of the peak for the NiPt catalyst indicates that carbon
deposited on that sample had varying degrees of stability. The amount of the carbon removed
during the TPO on the NiPt catalysts was 10-20% of that removed from the post-reaction Ni
ALD and Ni-MLD catalysts. The lower carbon deposition is not surprising, since the NiPt
particles did not sinter as much (which would prevent carbon deposition on its own) and NiPt
catalysts are less prone to coking in general.
A B C

143
Figure 5.A6. Rate of CO2 formation during temperature-programmed oxidation, after dry
reforming of methane for the times indicated, of an alumina-supported NiPt ALD catalyst and
the NiPt ALD catalyst with 15 MLD cycles
5.8.4. Conclusions
Bimetallic NiPt catalysts were synthesized by ALD with small particle sizes, which make
them prone to sintering. These catalysts were modified with a porous alumina stabilization layer
by MLD, but the DRM rate still decreased over time. Most of the surface area (~90%) was
covered by 15-MLD layers, which may have helped limit sintering. The catalyst with 15-MLD
cycles was stable up to 172 h during DRM at 973 K, and only sintered to 3.4 nm after 172 h,
whereas the uncoated catalyst sintered to 6.4 nm after 24 h. Additionally, the MLD coating
reduced the amount of coking on the catalysts because the small particle sizes were maintained
or the catalysts sites were covered by the MLD layer. The MLD coatings were an effective
method of limiting sintering of the NiPt nanoparticles under DRM conditions, but at the expense
144
of covering surface area. Using MLD to modify NiPt catalysts was not as effective at
maintaining a high (and stable) DRM rate like the Ni-MLD catalysts mentioned earlier.
References
[1] N. Suzuki, Y. Yamauchi, Journal of sol-gel science and technology 53 (2010) 428-433.
[2] S. Helveg, J. Sehested, J.R. Rostrup-Nielsen, Catalysis Today 178 (2011) 42-46.
[3] T.D. Gould, A.M. Lubers, B.T. Neltner, J.V. Carrier, A.W. Weimer, J.L. Falconer, J. Will
Medlin, Journal of Catalysis 303 (2013) 9-15.
145
Chapter 6: Conclusions and Recommendations
6.1 Conclusions
This work demonstrated synthesis of Ni, Pt, and NiPt supported catalysts by ALD in the
size range where catalytic behavior becomes particularly interesting and much different than
what is observed on larger metal catalyst particles. The four main objectives of this thesis are
concluded in detail at the end of their perspective chapters. Here we review the general findings
of these studies.
Nickel ALD shows that nanoparticle ALD is possible for more than noble metals. Work
over the past 10 years on ALD synthesis of catalysts particles has been dominated almost
entirely by Pt and Pd ALD. While these systems are of great interest due to the catalytic
properties of these < 2 nm particles, the practicality of using this technology is greatly
diminished since Pt and Pd are often cost-prohibitive; especially once the costs of performing
ALD are included. This thesis demonstrated the synthesis of the first non-noble metal
nanoparticle catalysts by ALD. Depositing Ni particles by ALD allows for variation in particle
size and weight loading at a size-scale that is often difficult to achieve with other Ni deposition
techniques. These Ni ALD nanoparticles are among the smallest sizes reported, and so they have
broad-reaching applications in many reactions that demand small particle size. The lower cost of
Ni and the enhanced nanoscale properties of these ALD catalysts suggest that they could be used
in place of more expensive metals, or be combined with them (i.e., Ni-bimetallics) to reduce
cost, and in some cases improve catalytic performance.
Structure-sensitive reactions benefit from ALD. With the exception of hydrogenolysis of
propylene on Ni ALD catalysts, the other example reactions in this thesis benefit from small
particle sizes. This benefit depends entirely on the type of reaction though, and what kind of
146
structure-sensitivity that reaction imparts. Smaller particles in DRM reactions inhibit coking
more and have greater activity per gram of metal. In the case of bimetallic catalysts, the amount
of bimetallic interaction is maximized when more of each metal is in close contact with each
other, which is inherently true when the particle size is small. The Pt ALD catalysts used for
ODHP reactions maximized selectivity for propylene when the catalysts were the smallest (and
therefore had the least coordinated atoms on the surface). Additionallly, for the case of any
metal catalyst, maximizing active metal surface area per g-metal reduces the required mass of
catalyst and therefore ultimately reduces the cost of using the catalyst.
Pristine nanoscale catalysts change under reaction conditions. This thesis demonstrated the
synthesis of extremely small nanoparticles, with diameters even reaching sub-nm for the Pt
catalysts. Once small nanoparticles are introduced to reaction conditions, they often sinter,
sometimes considerably. In the case of the DRM reactions, whose conditions are particularly
harsh for catalyst sintering, the Ni and NiPt nanoparticles sintered, but not to sizes that cause
problems with coking. Starting with a catalyst with larger metal particles (even a pre-sintered
version of the Ni ALD catalyst) introduced complications with carbon whisker formation.
Chapter 5 showed that MLD layers can be used to mitigate sintering and stabilize catalytic
performance, which has broad-reaching implications for a variety of applications if other
catalysts (synthesized by ALD or other techniques) can be stabilized to such a degree.
147
6.2 Future Directions and Recommendations
Atomic layer deposition is still a relatively new technology for applications in catalyst
synthesis, and therefore still has much unexplored potential in the field of catalysis. This chapter
presents discussion and preliminary data for findings that were not studied in detail but showed
interesting preliminary results. Recommendations for future work are also presented to take
advantage of the versatility and nanoscale properties of ALD catalytic materials.
6.2.1 Investigating MLD-coated DRM catalysts
Chapter 5 had several interesting results associated with the properties of the MLD layer
on Ni that should be explored further. Understanding why the MLD layer was so beneficial
could have far-reaching implications for other catalyst stabilization, or could lead to an even
better performance for Ni ALD-MLD catalysts than what was reported in this thesis. Aspects
that should be studied further include:
1) Determining the effect of pretreatment on the MLD layer structure.
2) Understanding why MLD coatings were different for Ni and Pt
3) Optimizing the number of MLD cycles for the Ni + MLD catalysts
Although the type of pretreatment is known to affect the properties of the porous MLD
alumina layer,[1] the work in chapter 5 showed a dramatic effect of calcination temperature on
DRM behavior. This thesis showed no difference in “extreme” calcination (by TPO to 973 K)
and calcination at 773 K, but these results are still different from calcinations reported in
literature for ABC MLD alucone layers on alumina,[1] and AB MLD alucone layers on
Pt/SiO2.[2] In-depth studies on the pore structure of the Ni ALD/MLD catalysts should be
carried out to compare with previous studies on the MLD layers reported in literature. However,
because the work in chapter 5 used a low number of MLD cycles, low Ni weight loading, and a
148
low surface area support, gas-phase characterization (such as micropore analysis, or differences
in surface area) were not possible. Future studies aimed at specifically measuring properties of
the MLD layers on Ni catalysts should synthesize catalysts with more Ni surface area (similar to
the 15 cycle Ni ALD sample from Chapter 2) and a higher surface area support (to accommodate
more catalyst). Additionally, the deactivation observed in Chapter 5 after calcining at 673 K
could be further characterized to determine if the mechanism of deactivation was associated with
coking, and whether subsequent calcination at 773 K would improve the catalyst. Temperature-
programmed oxidation could be used after the catalyst was oxidized at 673 K (before reaction),
and then again after reaction to probe whether this calcination temperature led to more carbon
formation than normal.
More in-depth studies are needed to determine the differences between MLD on Ni, NiPt,
or Pt. Temperature-programmed oxidation showed that removal of organic components from the
MLD polymer hybrid layer was dramatically different for the Ni and NiPt catalysts. In addition,
many catalytic properties of the MLD-NiPt system deviated from those of the Ni-MLD system.
Nickel may be exhibiting unique properties since it readily forms an oxide, which may be more
ideal for MLD coatings. While Pt can also have an oxide layer, this oxide can be easily reduced
by dosing TMA. This work suggests that the first few cycles of MLD are crucial, and are most
likely different on the two metals. Feng et al. showed that TMA preferentially binds to defect
sites on Pt, but this may not happen on pure Ni, or especially NiO.[3] The Ni catalyst in Chapter
5 had MLD layers deposited on catalysts that were exposed to the atmosphere (and thus
oxidized). Performing MLD immediately following ALD (in the same reactor), or by first
reducing the Ni catalyst would likely yield a different result and could highlight the effect of
having a metal oxide as the active site for MLD rather than metal.
149
One method for probing differences in the MLD layer on each of these metals is in situ
FTIR of the MLD layers. The development of the ABC MLD chemistry by the George group
was aided by in situ FTIR of the organic components of the MLD layer as it was being grown.[4]
If the organic components are assembling differently in each catalyst system, then monitoring the
MLD hybrid organic-inorganic layer during the first few cycles of growth should elucidate
differences, and could be compared to FTIR data from previous studies by the George group
when the ABC MLD chemistry was grown on metal oxides like alumina.[4] Performing FTIR in
situ can often prove difficult, so even doing DRIFTS on Ni and Pt catalysts coated with MLD
could indicate major differences in the organic layer.
Finally, more work should be done to optimize the number of MLD cycles. The work in
this thesis only used 5, 10 and 15 cycles to coat the catalysts. Adding more than 15 cycles likely
would show no benefit and only decrease catalytic activity by increasing mass-transfer issues.
However, doing fewer than 5 could show even higher DRM activity, but potentially less
stability. An intermediate number of cycles between 5 and 10 could reach an ideal case that
combines the stability observed on the 10-MLD sample with the high activity of the 5-MLD
sample. For the lower number of cycles (less than 5), the MLD layer is likely not covering the
catalyst entirely, but determining this amount covered would be beneficial. Techniques like
chemisorption cannot distinguish between a completely open metal site and one covered by a
porous layer. Other surface-sensitive techniques such as XPS should be employed to determine
how much of the surface is covered by these MLD layers at varying number of cycles.
6.2.2 Investigating other metal ALD chemistries for nanoparticle deposition with H2.
The Weimer group had previously demonstrated the synthesis of Fe nanoparticles by
ALD, but these were achieved by first depositing Fe2O3 ALD (using ferrocene and O2), then

150
reducing the catalysts at excessively high temperatures (close to 1173 K) to form the
nanoparticles. Instead, avoiding formation of the oxide by depositing metallic Fe would be
desirable. The Fe ALD precursor, ferrocene, is almost identical to the Ni ALD precursor
nickelocene (which also forms an oxide film when deposited with O2). We hypothesize that by
using H2 gas as the second half-reaction reagent, metallic Fe nanoparticles should be deposited
by ALD, much like the case with Ni ALD.
A test-run of this chemistry was performed in a fluidized bed reactor (specifically the
cobalt-ferrite reactor in the Weimer lab). The ALD deposition temperature for Fe (673 K) was
higher than the Ni ALD deposition temperature (573 K) since the Fe precursor is slightly more
stable than the Ni precursor. Only one cycle was performed to deposit small nanoparticles. The
sample was a grey color when pulled out of the FBR, but analysis by TEM remains inconclusive
due to minimal contrast from these small Fe (or most likely Fe2O3) nanoparticles with the
alumina substrate (Figure 6.). The Fe weight loading, determined by ICP-MS, was 0.6 wt% Fe.
A sample with more cycles (2-5) should be prepared to confirm that ALD can actually deposit Fe
crystallites. After 5 cycles, the catalyst particles should be sufficiently large to have a decent
contrast with the substrate, and may also have visible lattice fringes that can be analyzed for the
correct d-spacing corresponding to Fe or Fe2O3.

151
Figure 6.1. Possible Fe nanoparticles deposited by ALD with ferrocene and H2 at 673 K.
With the success of Ni ALD, and with the likelihood that Fe nanoparticles were also
deposited, Co metal nanoparticles might also be deposited by ALD with cobaltocene and H2.
Using H2 could have far-reaching implications for other metals that have been demonstrated by
metal oxide ALD, if these metal oxides could instead be deposited as metals. For example,
future work using TiO2 ALD to coat Ag nanoparticles could potentially benefit from using H2
instead of the typical second half-reaction precursors O2, H2O, or ozone. Reduction of TiO2 is
inherently difficult since Ti is even more oxophillic than Ni or Fe, so eliminating a high
temperature reduction step could be crucial in actually forming a bimetallic catalyst with a
surface Ti layer.
Bimetallic catalysts created by ALD in this work had superior catalytic performance, but
much work is needed to study bimetallic nanoparticle synthesis by ALD. Studies have shown
that changing the order when metals are deposited sequentially or doing simultaneous deposition
often creates catalysts with different material and catalytic properties.[5, 6] The work in this
thesis used one cycle of Ni ALD, followed by one cycle of Pt ALD. If the metals were deposited

152
in reverse order, the ratio of metals would likely be different, and the size of the particles would
likely be different as well. Simultaneous metal deposition should also be employed with ALD, by co-
feeding two different precursors to study the effect of catalytic and material properties when they
are deposited at the same time instead of sequentially. Co-dosing ALD precursors may be
limited to dosing similar molecules, such as nickelocene and ferrocene, to reduce the potential
for gas phase reaction between the precursor (which would result in CVD not ALD). Ferrocene
and cobaltocene could also be ideal precursors for co-feeding to make bimetallic CoFe catalysts
for the Fischer-Tropsch reaction.
6.2.3 Nickel oxide ALD as base-layer for Pt ALD.
The effect of H2 or O2 on Pt ALD particle size was originally observed on an alumina
nanosphere that was coated with approximately 30 NiO ALD cycles. This substrate was used to
take advantage of the surface energy difference between Pt and NiO in order to force the
nanoparticles to spread out on the surface more, potentially creating a Pt film with a low number
of ALD cycles. Twenty cycles of Pt ALD was performed on these NiO layers in order to
exacerbate differences in particle size with the second half-reaction chemistry. As shown in
Figure 6., the Pt particles synthesized with O2 were relatively large (for ALD catalysts) at sizes
greater than 5 nm.

153
Figure 6.2. HRTEM of 20 cycles Pt ALD (done with O2) on NiO ALD layer on top of alumina
nanosphere support.

154
Figure 6.3. HRTEM of 20 cycles Pt ALD (with H2) on NiO ALD layer on top of Al2O3.
Interestingly, the Pt ALD done with H2 produced extremely small nanoparticles (Figure
6.), some in the sub-nm range even after 20 cycles. Why this happened is unclear, but could be
due to 1) substrate effects from the NiO causing the Pt nanoparticles to form smaller particles
than normally done on alumina or 2) limiting the amount of nucleation that occurs on the NiO,

155
therefore shutting down further depositions after all the active sites were depleted (i.e., the 20
cycles of Pt ALD may have only deposited Pt during the first 10 or so cycles). Even if the
second hypothesis is true, these particles were still about the same size as those created by 5
cycles of Pt ALD with H2 on alumina, and those particles were deposited at a much lower
temperature. Further investigation into the cause for this phenomenon would need to analyze if
this effect occurred on the NiO for a fewer number of cycles (1 and 5 at least), which could lead
to even smaller sub-nm particles.
These catalysts should also be evaluated for ODHP activity, especially in the case that
one Pt ALD cycle is performed on a NiO ALD layer. Not only could these catalysts be more
active than the catalysts in Chapter 2 because of a smaller catalyst size, but NiO has also shown
promising yields for ODHP.[7] The NiO/Al2O3 catalysts in literature take advantage of forming
a Ni-aluminate with a NiO over-layer, which is more favorable for ODHP, especially when
doped with certain additives (such as V, Mo, Co, Nb, and Ta).[7]
6.2.4 ALD catalysts for hydrodeoxygenation of furfural
In the second chapter of this thesis, Ni ALD particles were synthesized and tested with a
probe reaction of propylene hydrogenolysis. The eventual goal of this catalyst was to do
hydrogenolysis on larger molecules commonly found in biorefineries, such fatty acids or
compounds such as furfural, but these molecules were not investigated in this thesis.
Hydrodeoxygenation (HDO) of furfural to form the higher-value products furfuryl alcohol and
methylfuran have used Ni catalysts, but they impart high selectivity towards the unfavorable
decarbonylation pathway to form furan. Other metals such as Cu can help direct this reaction
pathway towards furfuryl alcohol.[8] Previous efforts in the Medlin research group have utilized
organic-thiol self-assembled monolayers to selectively shut down the unfavorable
156
decarbonylation reaction, thereby increasing selectivity to furfuryl alcohol and methylfuran.[9]
While they showed enhancements to selectivity, the reaction rate was rather low. Using Ni ALD
catalysts may be a way of enhancing the activity of these catalysts because 1) ALD catalysts
have a higher active surface area per gram, and 2) the ALD catalysts have a higher concentration
of step edges (which are more favorable for hydrogenolysis, or hydrodeoxygenation). The
increased amount of step edges on these catalysts could enhance the HDO rate, or they could
potentially cleave bonds unselectively. Also, since decarbonylation seems to require terrace
sites, the small Ni particles likely don’t have large enough sites for this reaction to occur, and
could potentially favor an upright binding of furfural (which would lead to better selectivity for
HDO).
6.2.5 References
[1] X. Liang, B. W Evanko, A. Izar, D. M King, Y.-B. Jiang, A.W. Weimer, Microporous and Mesoporous Materials (2012). [2] X. Liang, J. Li, M. Yu, C.N. McMurray, J.L. Falconer, A.W. Weimer, ACS Catalysis 1 (2011) 1162-1165. [3] H. Feng, J. Lu, P. Stair, J. Elam, Catalysis Letters 141 (2011) 512-517. [4] B. Yoon, D. Seghete, A.S. Cavanagh, S.M. George, Chemistry of Materials 21 (2009) 5365-5374. [5] M. Heemeier, A.F. Carlsson, M. Naschitzki, M. Schmal, M. Bäumer, H.-J. Freund, Angewandte Chemie International Edition 41 (2002) 4073-4076. [6] B. Coq, F. Figueras, Journal of Molecular Catalysis A: Chemical 173 (2001) 117-134. [7] F. Cavani, N. Ballarini, A. Cericola, Catalysis Today 127 (2007) 113-131. [8] S. Sitthisa, D.E. Resasco, Catalysis Letters 141 (2011) 784-791. [9] S.H. Pang, C.A. Schoenbaum, D.K. Schwartz, J.W. Medlin, Nature communications 4 (2013).
157
Chapter 7: Bibliography
1. Natural Gas Reforming.
http://www1.eere.energy.gov/hydrogenandfuelcells/production/natural_gas.html
(accessed 12-12-13).
2. Current Metal Prices. http://www.icmj.com/current-metal-prices.php (accessed 12-14-
13).
3. Aaltonen, T.; Ritala, M.; Sajavaara, T.; Keinonen, J.; Leskela¨, M., Chemistry of
Materials 2003, 15 (9), 1924-1928.
4. Aaron Deskins, N.; Mei, D.; Dupuis, M., Surface Science 2009, 603 (17), 2793-2807.
5. Abild-Pedersen, F.; Greeley, J.; Nørskov, J., Catalysis Letters 2005, 105 (1), 9-13.
6. Abild-Pedersen, F.; Nørskov, J. K.; Rostrup-Nielsen, J. R.; Sehested, J.; Helveg, S.,
Physical Review B 2006, 73 (11), 115419.
7. Aiken Iii, J. D.; Finke, R. G., Journal of Molecular Catalysis A: Chemical 1999, 145 (1-
2), 1-44.
8. Alayoglu, S.; Nilekar, A. U.; Mavrikakis, M.; Eichhorn, B., Nat Mater 2008, 7 (4), 333-
338.
9. Alfons M. Molenbroek, S. H., Henrik Topsoe, Bjerne S. Clausen, Topics in Catalysis
2009, 52, 1303-1311.
10. Aparicio, L. M., Journal of Catalysis 1997, 165 (2), 262-274.
11. Armor, J. N., Catalysis Today 2011, 163 (1), 3-9.
12. Avetisov, A. K.; Rostrup-Nielsen, J. R.; Kuchaev, V. L.; Bak Hansen, J. H.; Zyskin, A.
G.; Shapatina, E. N., Journal of Molecular Catalysis A: Chemical 2010, 315 (2), 155-162.
13. Bachmann, J.; Zolotaryov, A.; Albrecht, O.; Goetze, S.; Berger, A.; Hesse, D.; Novikov,
D.; Nielsch, K., Chemical Vapor Deposition 2011, 17 (7-9), 177-180.
14. Baker, R. T. K., Carbon 1989, 27 (3), 315-323.
15. Bartholomew, C. H., Applied Catalysis A: General 1993, 107 (1), 1-57.
16. Bartholomew, C. H., Applied Catalysis A: General 2001, 212 (1-2), 17-60.
17. Bartholomew, C. H.; Pannell, R. B., Journal of Catalysis 1980, 65 (2), 390-401.
158
18. Baudouin, D.; Rodemerck, U.; Krumeich, F.; Mallmann, A. d.; Szeto, K. C.; Ménardd,
H.; Veyre, L.; Candy, J.-P.; Webb, P. B.; Thieuleux, C.; Copéreta, C., Journal of
Catalysis 2013, 297 (0), 27-34.
19. Baudouin, D.; Szeto, K. C.; Laurent, P.; De Mallmann, A.; Fenet, B.; Veyre, L.;
Rodemerck, U.; Copéret, C.; Thieuleux, C., Journal of the American Chemical Society
2012, 134 (51), 20624-20627.
20. Baumgarten, E.; Wagner, R.; Lentes-Wagner, C., Fresenius' Zeitschrift für analytische
Chemie 1989, 334 (3), 246-251.
21. Bell, A. T., Science 2003, 299 (5613), 1688-1691.
22. Bengaard, H.; Nørskov, J. K.; Sehested, J.; Clausen, B. S.; Nielsen, L. P.; Molenbroek, A.
M.; Rostrup-Nielsen, J. R., Journal of Catalysis 2002, 209 (2), 365-384.
23. Besenbacher, F.; Chorkendorff, I.; Clausen, B.; Hammer, B.; Molenbroek, A.; Nørskov,
J. K.; Stensgaard, I., Science 1998, 279 (5358), 1913-1915.
24. Bjørgen, M.; Joensen, F.; Spangsberg Holm, M.; Olsbye, U.; Lillerud, K.-P.; Svelle, S.,
Applied Catalysis A: General 2008, 345 (1), 43-50.
25. Bjørgen, M.; Svelle, S.; Joensen, F.; Nerlov, J.; Kolboe, S.; Bonino, F.; Palumbo, L.;
Bordiga, S.; Olsbye, U., Journal of Catalysis 2007, 249 (2), 195-207.
26. Blöchl, P. E., Physical Review B 1994, 50 (24), 17953.
27. Blyholder, G., The Journal of Physical Chemistry 1964, 68 (10), 2772-2777.
28. Bond, G. C., Surface Science 1985, 156, Part 2 (0), 966-981.
29. Bond, G. C., Chemical Society Reviews 1991, 20 (4), 441-475.
30. Boudjahem, A. G.; Monteverdi, S.; Mercy, M.; Bettahar, M. M., Journal of Catalysis
2004, 221 (2), 325-334.
31. Bozon-Verduraz, F.; Fiévet, F.; Piquemal, J.-Y.; Brayner, R.; El Kabouss, K.; Soumare,
Y.; Viau, G.; Shafeev, G., Brazilian Journal of Physics 2009, 39, 134-140.
32. Briquet, L. G. V.; Catlow, C. R. A.; French, S. A., The Journal of Physical Chemistry C
2010, 114 (50), 22155-22158.
33. Carenco, S.; Boissière, C.; Nicole, L.; Sanchez, C.; Le Floch, P.; Mézailles, N.,
Chemistry of Materials 22 (4), 1340-1349.
34. Cavani, F.; Ballarini, N.; Cericola, A., Catalysis Today 2007, 127 (1), 113-131.

159
35. Ceresana Market Study: Propylene (UC-1705). http://www.ceresana.com/en/market-
studies/chemicals/propylene/propylene-market-share-capacity-demand-supply-forecast-
innovation-application-growth-production-size-industry.html (accessed 12-13-13).
36. Chen, Y.; Zhang, L., Catalysis Letters 1992, 12 (1), 51-62.
37. Chorkendorff, I.; Niemantsverdriet, J. W., Wiley. com: 2006.
38. Christensen, S. T.; Elam, J. W.; Rabuffetti, F. A.; Ma, Q.; Weigand, S. J.; Lee, B.;
Seifert, S.; Stair, P. C.; Poeppelmeier, K. R.; Hersam, M. C.; Bedzyk, M. J., Small 2009,
5 (6), 750-757.
39. Christensen, S. T.; Feng, H.; Libera, J. L.; Guo, N.; Miller, J. T.; Stair, P. C.; Elam, J. W.,
Nano Letters 2010, 10 (8), 3047-3051.
40. Coq, B.; Figueras, F., Journal of Molecular Catalysis A: Chemical 2001, 173 (1-2), 117-
134.
41. Corma, A.; Melo, F.; Sauvanaud, L.; Ortega, F., Catalysis Today 2005, 107, 699-706.
42. Corral Valero, M.; Raybaud, P.; Sautet, P., The Journal of Physical Chemistry B 2006,
110 (4), 1759-1767.
43. Coulter, K.; Xu, X.; Goodman, D. W., The Journal of Physical Chemistry 1994, 98 (4),
1245-1249.
44. Dameron, A. A.; Seghete, D.; Burton, B. B.; Davidson, S. D.; Cavanagh, A. S.; Bertrand,
J. A.; George, S. M., Chemistry of Materials 2008, 20 (10), 3315-3326.
45. Dartigues, J. M.; Chambellan, A.; Gault, F. G., Journal of the American Chemical
Society 1976, 98 (3), 856-857.
46. de Miguel, S. R.; Vilella, I. M. J.; Maina, S. P.; José-Alonso, D. S.; Román-Martínez, M.
C.; Illán-Gómez, M. J., Applied Catalysis A: General 2012.
47. Duprez, D.; DeMicheli, M. C.; Marecot, P.; Barbier, J.; Ferretti, O. A.; Ponzi, E. N.,
Journal of Catalysis 1990, 124 (2), 324-335.
48. Edwards, J. H.; Maitra, A. M., Fuel Processing Technology 1995, 42 (2-3), 269-289.
49. Elam, J.; Routkevitch, D.; Mardilovich, P.; George, S., Chemistry of Materials 2003, 15
(18), 3507-3517.
50. Elliott, S. D.; Greer, J. C., Journal of Materials Chemistry 2004, 14 (21), 3246-3250.
51. Erley, W.; Wagner, H., Surface Science 1978, 74 (2), 333-341.
52. Feng, H.; Libera, J. A.; Stair, P. C.; Miller, J. T.; Elam, J. W., ACS Catalysis 2011, 1 (6),
665-673.
160
53. Feng, H.; Lu, J.; Stair, P.; Elam, J., Catalysis Letters 2011, 141 (4), 512-517.
54. Foger, K.; Anderson, J. R., Applications of Surface Science 1979, 2 (3), 335-351.
55. Gafner, S.; Redel’, L.; Gafner, Y., The Physics of Metals and Metallography 2007, 104
(2), 180-186.
56. Gallezot, P.; Richard, D., Catalysis Reviews 1998, 40 (1-2), 81-126.
57. García-Diéguez, M.; Finocchio, E.; Larrubia, M. Á.; Alemany, L. J.; Busca, G., Journal
of Catalysis 2010, 274 (1), 11-20.
58. García-Diéguez, M.; Pieta, I. S.; Herrera, M. C.; Larrubia, M. A.; Alemany, L. J.,
Applied Catalysis A: General 2010, 377 (1-2), 191-199.
59. Gasser, R. P. H.; Ehrlich, G., Physics Today 1987, 40, 128.
60. George, S. M., Polymer 2012, 1550, 125.
61. Gharibi, M.; Zangeneh, F. T.; Yaripour, F.; Sahebdelfar, S., Applied Catalysis A: General
2012, 443-444 (0), 8-26.
62. Goodman, D. W., Surface Science 1982, 123 (1), L679-L685.
63. Gould, T. D.; Lubers, A. M.; Neltner, B. T.; Carrier, J. V.; Weimer, A. W.; Falconer, J.
L.; Will Medlin, J., Journal of Catalysis 2013, 303, 9-15.
64. Gould, T. D.; Montemore, M. M.; Lubers, A. M.; Weimer, A.; Falconer, J. L.; Medlin, J.
W., Submitted to Journal of Catalysis 2013.
65. Gracia, F.; Bollmann, L.; Wolf, E.; Miller, J.; Kropf, A., Journal of Catalysis 2003, 220
(2), 382-391.
66. Greeley, J.; Mavrikakis, M., Nature materials 2004, 3 (11), 810-815.
67. Ha, L.; Mao, J.; Zhou, J.; Zhang, Z. C.; Zhang, S., Applied Catalysis A: General 2008, In
Press, Accepted Manuscript.
68. Hammaker, R. M.; Francis, S. A.; Eischens, R. P., Spectrochimica Acta 1965, 21 (7),
1295-1309.
69. Hammer, B.; Nørskov, J. K.; Bruce C. Gates, H. K., Theoretical surface science and
catalysis - calculations and concepts. In Advances in Catalysis, Academic Press: 2000;
Vol. Volume 45, pp 71-129.
70. Hardeveld, R. V.; Hartog, F., Advances in Catalysis 1972, 22, 75-110.
71. Haruta, M., Catalysis Today 1997, 36 (1), 153-166.

161
72. He, Y.; Li, X.; Swihart, M. T., Chemistry of Materials 2005, 17 (5), 1017-1026.
73. Heemeier, M.; Carlsson, A. F.; Naschitzki, M.; Schmal, M.; Bäumer, M.; Freund, H.-J.,
Angewandte Chemie International Edition 2002, 41 (21), 4073-4076.
74. Helveg, S.; Sehested, J.; Rostrup-Nielsen, J. R., Catalysis Today 2011, 178 (1), 42-46.
75. Hou, Y.; Gao, S., Journal of Materials Chemistry 2003, 13 (7), 1510-1512.
76. Hu, E. L.; Davis, S. M.; Davis, R.; Scher, E., Applications: Catalysis by Nanostructured
Materials: Nanotechnology Research Directions for Societal Needs in 2020. Springer
Netherlands: 2011; Vol. 1, pp 445-466.
77. Humbert, M. P.; Chen, J. G., Journal of Catalysis 2008, 257 (2), 297-306.
78. İnoğlu, N.; Kitchin, J. R., Journal of Catalysis 2009, 261 (2), 188-194.
79. Jackson, S. D.; Glanville, B. M.; Willis, J.; McLellan, G. D.; Webb, G.; Moyes, R. B.;
Simpson, S.; Wells, P. B.; Whyman, R., Journal of Catalysis 1993, 139 (1), 207-220.
80. Jin, Y.; Asaoka, S.; Li, X.; Asami, K.; Fujimoto, K., Fuel Processing Technology 2004,
85 (8-10), 1151-1164.
81. Jones, C. W.; Zones, S. I.; E. Davis, M., Applied Catalysis A: General 1999, 181 (2),
289-303.
82. Jones, G.; Jakobsen, J. G.; Shim, S. S.; Kleis, J.; Andersson, M. P.; Rossmeisl, J.; Abild-
Pedersen, F.; Bligaard, T.; Helveg, S.; Hinnemann, B.; Rostrup-Nielsen, J. R.;
Chorkendorff, I.; Sehested, J.; Nørskov, J. K., Journal of Catalysis 2008, 259 (1), 147-
160.
83. Kahsar, K. R.; Schwartz, D. K.; Medlin, J. W., Journal of the American Chemical Society
2013.
84. Kappers, M. J.; Maas, J. H., Catalysis Letters 1991, 10 (5-6), 365-373.
85. Kessels, W.; Knoops, H.; Dielissen, S.; Mackus, A.; van de Sanden, M., Applied Physics
Letters 2009, 95 (1), 013114-013114-3.
86. King, D. M.; Liang, X.; Weimer, A. W., Powder Technology 2012, 221 (0), 13-25.
87. King, D. M.; Spencer Ii, J. A.; Liang, X.; Hakim, L. F.; Weimer, A. W., Surface and
Coatings Technology 2007, 201 (22-23), 9163-9171.
88. Kip, B. J.; Duivenvoorden, F. B. M.; Koningsberger, D. C.; Prins, R., Journal of Catalysis
1987, 105 (1), 26-38.
89. Kondratenko, E. V.; Cherian, M.; Baerns, M., Catalysis Today 2005, 99 (1-2), 59-67.

162
90. Koningsberger, D.; Prins, R., 1987.
91. Kresse, G.; Furthmüller, J. r., Computational Materials Science 1996, 6 (1), 15-50.
92. Kresse, G.; Hafner, J. r., Physical Review B 1993, 47 (1), 558.
93. Kresse, G.; Joubert, D., Physical Review B 1999, 59 (3), 1758.
94. Kristyán, S.; Timmons, R. B., Journal of Catalysis 1986, 101 (2), 331-341.
95. Kroll, V. C. H.; Swaan, H. M.; Mirodatos, C., Journal of Catalysis 1996, 161 (1), 409-
422.
96. Kukovitsky, E. F.; L'Vov, S. G.; Sainov, N. A.; Shustov, V. A.; Chernozatonskii, L. A.,
Chemical Physics Letters 2002, 355 (5-6), 497-503.
97. LaGrow, A. P.; Ingham, B.; Cheong, S.; Williams, G. V. M.; Dotzler, C.; Toney, M. F.;
Jefferson, D. A.; Corbos, E. C.; Bishop, P. T.; Cookson, J.; Tilley, R. D., Journal of the
American Chemical Society 2011, 134 (2), 855-858.
98. Lamber, R.; Wetjen, S.; Jaeger, N. I., Physical Review B 1995, 51 (16), 10968-10971.
99. Lebedeva, N.; Rodes, A.; Feliu, J.; Koper, M.; Van Santen, R., The Journal of Physical
Chemistry B 2002, 106 (38), 9863-9872.
100. Lee, P. I.; Schwarz, J. A.; Heydweiller, J. C., Chemical Engineering Science 1985, 40 (3),
509-519.
101. Lei, Y.; Liu, B.; Lu, J.; Lobo-Lapidus, R. J.; Wu, T.; Feng, H.; Xia, X.; Mane, A. U.;
Libera, J. A.; Greeley, J. P.; Miller, J. T.; Elam, J. W., Chemistry of Materials 2012, 24
(18), 3525-3533.
102. Li, D.; Nakagawa, Y.; Tomishige, K., Applied Catalysis A: General 2011, 408 (1-2), 1-
24.
103. Li, J.; Liang, X.; King, D. M.; Jiang, Y.-B.; Weimer, A. W., Applied Catalysis B:
Environmental 2010, 97 (1-2), 220-226.
104. Li, Y.; Somorjai, G. A., Nano Letters 2010, 10 (7), 2289-2295.
105. Liang, X.; Li, J.; Yu, M.; McMurray, C. N.; Falconer, J. L.; Weimer, A. W., ACS
Catalysis 2011, 1 (10), 1162-1165.
106. Liang, X.; Lyon, L.; Jiang, Y.-B.; Weimer, A., Journal of Nanoparticle Research 2012, 14
(6), 1-12.
107. Liang, X.; W Evanko, B.; Izar, A.; M King, D.; Jiang, Y.-B.; Weimer, A. W.,
Microporous and Mesoporous Materials 2012.
163
108. Lim, B. S.; Rahtu, A.; Gordon, R. G., Nat Mater 2003, 2 (11), 749-754.
109. Loh, A. S.; Davis, S. W.; Medlin, J. W., Journal of the American Chemical Society 2008,
130 (16), 5507-5514.
110. Lu, H. L.; Scarel, G.; Wiemer, C.; Perego, M.; Spiga, S.; Fanciulli, M.; Pavia, G., Journal
of The Electrochemical Society 2008, 155 (10), H807-H811.
111. Lu, J.; Elam, J. W.; Stair, P. C., Accounts of Chemical Research 2013.
112. Lu, J.; Fu, B.; Kung, M. C.; Xiao, G.; Elam, J. W.; Kung, H. H.; Stair, P. C., Science
2012, 335 (6073), 1205-1208.
113. Lu, J.; Stair, P. C., Angewandte Chemie International Edition 2010, 49 (14), 2547-2551.
114. Lundwall, M. J.; McClure, S. M.; Goodman, D. W., The Journal of Physical Chemistry C
2010, 114 (17), 7904-7912.
115. Mackus, A. J. M.; Leick, N.; Baker, L.; Kessels, W. M. M., Chemistry of Materials 2012,
24 (10), 1752-1761.
116. Martin, G. A., Journal of Catalysis 1979, 60 (3), 345-355.
117. Mavrikakis, M.; Hammer, B.; Nørskov, J. K., Physical Review Letters 1998, 81 (13),
2819-2822.
118. Mavrikakis, M.; Stoltze, P.; Nørskov, J. K., Catalysis Letters 2000, 64 (2-4), 101-106.
119. Medasani, B.; Park, Y. H.; Vasiliev, I., Physical Review B 2007, 75 (23), 235436.
120. Miller, K. L.; Lee, C. W.; Falconer, J. L.; Medlin, J. W., Journal of Catalysis 2010, 275
(2), 294-299.
121. Moniz, E. J.; Jacoby, H. D.; Meggs, A.; Armtrong, R.; Cohn, D.; Connors, S.; Deutch, J.;
Ejaz, Q.; Hezir, J.; Kaufman, G., The future of natural gas. Cambridge, MA: MIT Press:
2011.
122. Montemore, M. M.; Medlin, J. W., The Journal of Physical Chemistry C 2013, 117 (39),
20078-20088.
123. Moon, D. Y.; Kim, W. S.; Kim, T. S.; Kang, B. W.; Park, J. W.; Yeom, S. J.; Kim, J. H.
In Atomic Layer Deposition of Copper Seed Layers from a (hfac)Cu(VTMOS) Precursor,
Korean Physical Soc: 2009; pp 1330-1333.
124. Moradi, G. R.; Nazari, M.; Yaripour, F., Fuel Processing Technology 2008, 89 (12),
1287-1296.
125. Mustard, D. G.; Bartholomew, C. H., Journal of Catalysis 1981, 67 (1), 186-206.
164
126. Neurock, M., Journal of Catalysis 2003, 216 (1-2), 73-88.
127. Nikolla, E.; Holewinski, A.; Schwank, J.; Linic, S., Journal of the American Chemical
Society 2006, 128 (35), 11354-11355.
128. Nikolla, E.; Schwank, J.; Linic, S., Journal of the American Chemical Society 2009, 131
(7), 2747-2754.
129. Nørskov, J. K.; Bligaard, T.; Logadottir, A.; Bahn, S.; Hansen, L. B.; Bollinger, M.;
Bengaard, H.; Hammer, B.; Sljivancanin, Z.; Mavrikakis, M.; Xu, Y.; Dahl, S.; Jacobsen,
C. J. H., Journal of Catalysis 2002, 209 (2), 275-278.
130. Olafsen, A.; Daniel, C.; Schuurman, Y.; Råberg, L.; Olsbye, U.; Mirodatos, C., Catalysis
Today 2006, 115 (1), 179-185.
131. Olafsen, A.; Slagtern, Ã.; Dahl, I. M.; Olsbye, U.; Schuurman, Y.; Mirodatos, C., Journal
of Catalysis 2005, 229 (1), 163-175.
132. Pang, S. H.; Schoenbaum, C. A.; Schwartz, D. K.; Medlin, J. W., Nature communications
2013, 4.
133. Park, J.; Kang, E.; Son, S. U.; Park, H. M.; Lee, M. K.; Kim, J.; Kim, K. W.; Noh, H. J.;
Park, J. H.; Bae, C. J.; Park, J. G.; Hyeon, T., Advanced Materials 2005, 17 (4), 429-434.
134. Park, S. K.; Kanjolia, R.; Anthis, J.; Odedra, R.; Boag, N.; Wielunski, L.; Chabal, Y. J.,
Chemistry of Materials 2010, 22 (17), 4867-4878.
135. Pawelec, B.; Damyanova, S.; Arishtirova, K.; Fierro, J. L. G.; Petrov, L., Applied
Catalysis A: General 2007, 323 (0), 188-201.
136. Pérez, O. L.; Romeu, D.; Yacamán, M. J., Applications of Surface Science 1982, 13 (3-
4), 402-413.
137. Peri, J. B.; Hannan, R. B., The Journal of Physical Chemistry 1960, 64 (10), 1526-1530.
138. Pompeo, F.; Nichio, N. N.; Souza, M. M.; Cesar, D. V.; Ferretti, O. A.; Schmal, M.,
Applied Catalysis A: General 2007, 316 (2), 175-183.
139. Puurunen, R. L., Journal of applied physics 2005, 97 (12), 121301-121301-52.
140. Qi, W.; Wang, M.; Liu, Q., Journal of Materials Science 2005, 40 (9), 2737-2739.
141. Qi, W. H.; Wang, M. P., Journal of Nanoparticle Research 2005, 7 (1), 51-57.
142. Reuter, K.; Scheffler, M., Physical Review B 2001, 65 (3), 035406.
143. Rigney, M. P.; Funkenbusch, E. F.; Carr, P. W., Journal of Chromatography A 1990, 499
(0), 291-304.

165
144. Rostrupnielsen, J.; Hansen, J. B., Journal of Catalysis 1993, 144 (1), 38-49.
145. Rostrup-Nielsen, J.; Nørskov, J., Topics in Catalysis 2006, 40 (1), 45-48.
146. Rostrup-Nielsen, J.; Nørskov, J., Topics in Catalysis 2006, 40 (1), 45-48.
147. Rostrup-Nielsen, J. R.; Sehested, J.; Nørskov, J. K., Hydrogen and synthesis gas by
steam- and C02 reforming. In Advances in Catalysis, Academic Press: 2002; Vol.
Volume 47, pp 65-139.
148. Satterfield, C. N., McGraw-Hill New York: 1980; Vol. 416.
149. Schaal, M. T.; Hyman, M. P.; Rangan, M.; Ma, S.; Williams, C. T.; Monnier, J. R.;
Medlin, J. W., Surface Science 2009, 603 (4), 690-696.
150. Schaal, M. T.; Pickerell, A. C.; Williams, C. T.; Monnier, J. R., Journal of Catalysis
2008, 254 (1), 131-143.
151. Scheffe, J. R.; Allendorf, M. D.; Coker, E. N.; Jacobs, B. W.; McDaniel, A. H.; Weimer,
A. W., Chemistry of Materials 2011, 23 (8), 2030-2038.
152. Scheffe, J. R.; Francés, A.; King, D. M.; Liang, X.; Branch, B. A.; Cavanagh, A. S.;
George, S. M.; Weimer, A. W., Thin Solid Films 2009, 517 (6), 1874-1879.
153. Schoenbaum, C. A.; Schwartz, D. K.; Medlin, J. W., Journal of Catalysis 2013, 303 (0),
92-99.
154. Sehested, J., Journal of Catalysis 2003, 217 (2), 417-426.
155. Sehested, J., Catalysis Today 2006, 111 (1), 103-110.
156. Setthapun, W.; Williams, W. D.; Kim, S. M.; Feng, H.; Elam, J. W.; Rabuffetti, F. A.;
Poeppelmeier, K. R.; Stair, P. C.; Stach, E. A.; Ribeiro, F. H.; Miller, J. T.; Marshall, C.
L., The Journal of Physical Chemistry C 2010, 114 (21), 9758-9771.
157. Sheng, J.; Welzel, U.; Mittemeijer, E. J., Applied Physics Letters 2010, 97 (153109), 1-3.
158. Silberova, B.; Fathi, M.; Holmen, A., Applied Catalysis A: General 2004, 276 (1), 17-28.
159. Sitthisa, S.; Resasco, D. E., Catalysis Letters 2011, 141 (6), 784-791.
160. Skoplyak, O.; Barteau, M. A.; Chen, J. G., The Journal of Physical Chemistry B 2006,
110 (4), 1686-1694.
161. Somorjai, G. A.; Borodko, Y. G., Catalysis Letters 2001, 76 (1-2), 1-5.
162. Somorjai, G. A.; Frei, H.; Park, J. Y., Journal of the American Chemical Society 2009,
131 (46), 16589-16605.
166
163. Somorjai, G. A.; Li, Y., John Wiley & Sons: 2010.
164. Somorjai, G. A.; York, R. L.; Butcher, D.; Park, J. Y., Physical Chemistry Chemical
Physics 2007, 9 (27), 3500-3513.
165. Song, H. J.; Jia, X. H.; Yang, X. F.; Tang, H.; Li, Y.; Su, Y. T., CrystEngComm 2011.
166. Stair, P., Topics in Catalysis 2012, 55 (1-2), 93-98.
167. Studt, F.; Abild-Pedersen, F.; Bligaard, T.; Sørensen, R. Z.; Christensen, C. H.; Nørskov,
J. K., Science 2008, 320 (5881), 1320-1322.
168. Sun, D.; Zhao, Y.; Su, H.; Li, W., Chinese Journal of Catalysis 2013, 34 (7), 1434-1442.
169. Suzuki, N.; Yamauchi, Y., Journal of sol-gel science and technology 2010, 53 (2), 428-
433.
170. Tanksale, A.; Beltramini, J. N.; Dumesic, J. A.; Lu, G. Q., Journal of Catalysis 2008, 258
(2), 366-377.
171. Ten Eyck, G. A.; Pimanpang, S.; Bakhru, H.; Lu, T. M.; Wang, G. C., Chemical Vapor
Deposition 2006, 12 (5), 290-294.
172. Teo, B. K., Springer-Verlag Berlin: 1986; Vol. 9.
173. Tupy, S. A.; Karim, A. M.; Bagia, C.; Deng, W.; Huang, Y.; Vlachos, D. G.; Chen, J. G.,
ACS Catalysis 2012, 2 (11), 2290-2296.
174. Vajda, S.; Pellin, M. J.; Greeley, J. P.; Marshall, C. L.; Curtiss, L. A.; Ballentine, G. A.;
Elam, J. W.; Catillon-Mucherie, S.; Redfern, P. C.; Mehmood, F.; Zapol, P., Nat Mater
2009, 8 (3), 213-216.
175. Van Hardeveld, R.; Van Montfoort, A., Surface Science 1966, 4 (4), 396-430.
176. Van Santen, R. A., Accounts of Chemical Research 2008, 42 (1), 57-66.
177. Vang, R. T.; Honkala, K.; Dahl, S.; Vestergaard, E. K.; Schnadt, J.; Lægsgaard, E.;
Clausen, B. S.; Nørskov, J. K.; Besenbacher, F., Surface Science 2006, 600 (1), 66-77.
178. Velasco, A.; Mitsuji, H.; Minami, W.; Lee, J. K.; Komiyama, H.; Kim, H.-j., Journal of
Crystal Growth 2008, 310 (16), 3837-3842.
179. Velu, S.; Gangwal, S. K., Solid State Ionics 2006, 177 (7–8), 803-811.
180. Wang, H.; Kou, X.; Zhang, L.; Li, J., Materials Research Bulletin 2008, 43 (12), 3529-
3536.
181. Wang, S.; Lu, G. Q.; Millar, G. J., Energy & Fuels 1996, 10 (4), 896-904.
167
182. Watts, J. F.; Wolstenholme, J., An Introduction to Surface Analysis by XPS and AES, by
John F. Watts, John Wolstenholme, pp. 224. ISBN 0-470-84713-1. Wiley-VCH, May
2003. 2003, 1.
183. Weitkamp, J., Solid State Ionics 2000, 131 (1), 175-188.
184. Werpy, T.; Petersen, G.; Aden, A.; Bozell, J.; Holladay, J.; White, J.; Manheim, A.; Eliot,
D.; Lasure, L.; Jones, S. Top Value-Added Chemicals from Biomass. Volume I: Results
of Screening for Potential Candidates from Sugars and Synthesis Gas; Department of
Energy: Washington, D.C., 2004.
185. Wolfe, D. W., Basic Books: 2001.
186. Wood, D. A.; Nwaoha, C.; Towler, B. F., Journal of Natural Gas Science and
Engineering 2012, 9 (0), 196-208.
187. Xiao, L.; Wang, L., The Journal of Physical Chemistry B 2007, 111 (7), 1657-1663.
188. Xu, J.; Yates Jr, J. T., Surface Science 1995, 327 (3), 193-201.
189. Yoon, B.; Seghete, D.; Cavanagh, A. S.; George, S. M., Chemistry of Materials 2009, 21
(22), 5365-5374.
190. Yu, W.; Porosoff, M. D.; Chen, J. G., Chemical Reviews 2012, 112 (11), 5780-5817.
191. Zafiris, G. S.; Gorte, R. J., Journal of Catalysis 1993, 140 (2), 418-423.
192. Zhou, Y.; King, D. M.; Liang, X.; Li, J.; Weimer, A. W., Applied Catalysis B:
Environmental 2010, 101 (1-2), 54-60.
193. Zhou, Y.; Muhich, C. L.; Neltner, B. T.; Weimer, A. W.; Musgrave, C. B., The Journal of
Physical Chemistry C 2012, 116 (22), 12114-12123.
194. Zieliński, J., Journal of Molecular Catalysis 1993, 79 (1-3), 187-198.