preparation of spherical activated carbon and their ... 2009 preparation of spherical activated...
TRANSCRIPT

Journal of the Korean Ceramic Society
Vol. 46, No. 6, pp. 568~573, 2009.
− 568 −
ReviewDOI:10.4191/KCERS.2009.46.6.568
†Corresponding author : Won-Chun Oh
E-mail : [email protected]
Tel : +82-41-660-1337 Fax : +82-41-688-3352
Preparation of Spherical Activated Carbon and TheirPhysicochemical Properties
Won-Chun Oh*†, Jong-Gyu Kim***, Hyuk Kim***, Ming-Liang Chen*, Feng-Jun Zhang*,
**, Kan Zhang
*, and Ze-Da Meng*
*Department of Advanced Materials & Science Engineering, Hanseo University, Chungnam 356-706, Korea**Anhui Key Laboratory of Advanced Building Materials, Anhui University of Architecture, Anhui Hefei, 230022, China
***Hanil Green Tech Co. Ltd., Chungnam 323-824, Korea
(Received August 9, 2009; Revised August 22, 2009; Accepted August 25, 2009)
ABSTRACT
In this study, we used coal based activated carbons as starting material and phenolic resin (PR) as a bonding agent to prepare
spherical shaped activated carbons. The textural properties of SAC were characterized by BET surface area, XRD, SEM, iodine
adsorption, strength intensity and pressure drop. According to the results, the spherical activated carbon prepared with activated
carbon and PR at a ratio of 60:40 was found to have the best formation of spherical shape, which was found in sample SAC40.
After activation, SAC40 has high BET surface area, iodine adsorption capability and strength value, and lowest pressure drop.
Key words : Spherical activated carbon, BET surface area, Iodine adsorption
1. Introduction
n recent years, carbon materials have found many
new applications such as catalyst supports, battery
electrodes, double layer capacitors, elements in gas storage,
components in biomedical engineering, and adsorbents for
bulky molecules.1–6) Carbon materials of such applications
usually possess high mesoporosity (2~50 nm), thereby
allowing efficient adsorption of molecules and ions that are
too large to enter micropores. It has been reported that the
pore size and pore size distributions of activated carbons
have a strong effect on the adsorption of organic com-
pounds.7) Mesopores are generally required for activated
carbons applied in liquid-phase adsorption due to the larger
size of liquid molecules. These mesopores not only contrib-
ute significantly to adsorption via the mechanism of capil-
lary condensation, but also alleviate pore obstruction and
maintain a fast kinetic adsorption rate as the main trans-
port arteries for the adsorbate.7-9) As a result, the presence
of mesopores in the activated carbon can significantly
enhance adsorption capacities, especially for large adsor-
bates.7,10-13)
Activated carbons have been applied in several fields,
including water treatment, chromatography and natural
gas storage.14) Some of these applications do not require rig-
orous control of their physical–chemical properties, regard-
ing purity, particle shapes, mechanical, esistance, homo-
geneity and specific surface area. On the other hand, these
properties are required when activated carbon is used as
catalytic support or as catalyst. Therefore, extensive
research has been carried out in recent years aiming at the
production of activated carbon from routes that allow the
control of these properties.
The adsorption capacity of activated carbon depends on
various factors such as the surface area, pore volume, pore-
size distribution and surface chemistry.15–18) Activated car-
bon fibers (ACFs) and granular activated carbons (GACs)
are two kinds of the most widely used activated carbon
materials. However, spherical activated carbons (SACs)
have received considerable recent attention for their various
potential advantages over ACFs and GACs such as
extremely low resistance to liquid diffusion, higher adsorp-
tion efficiency, better mechanical properties, and more
resistance to abrasion.19) Pitch,20) oil agglomerated bitumi-
nous coals,21) phenolic resin,19) ion exchange resin,22, 23) sty-
rene-divinylbenzene copolymers,24) and acrylonitrile-diviny-
lbenzene copolymer25) have been used to prepare SACs by
physical activation or catalytic activation.
The aim of the present work was to prepare activated car-
bons of spherical shape from coal based activated carbon.
The preparation conditions affecting the yield and textural
properties were investigated. The textural properties of
SACs were characterized by BET surface area, XRD, SEM,
iodine adsorption, strength intensity and pressure drop.
2. Experimental
2.1. Materials
The main material was coal based activated carbon with
I
569 Journal of the Korean Ceramic Society - Won-Chun Oh et al. Vol. 46, No. 6
size of 100~400 mesh, which was provided by Hanil Green
Tech (Korean). Phenolic rosin (PR) was used as a bonding
agent, and was purchased from KangNam Chemical Co.,
Ltd (Korean). Alcohol (95%) was used as a dispersing agent,
and was purchased from SamChun Pure Chemical Co., Ltd
(Korean). For preparing and forming the spherical activated
carbons, shaped mould, shaker sieve and shaker were also
used, which we made by ourselves. The appearances of
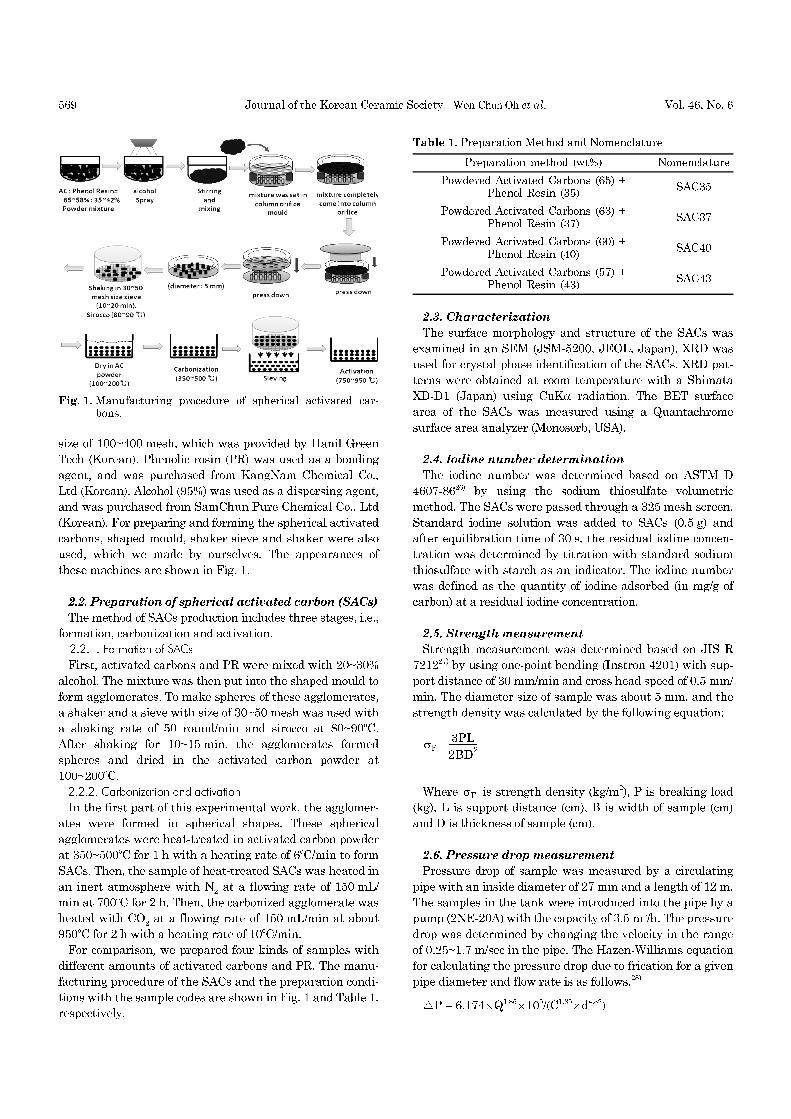
these machines are shown in Fig. 1.
2.2. Preparation of spherical activated carbon (SACs)
The method of SACs production includes three stages, i.e.,
formation, carbonization and activation.
2.2.1. Formation of SACs
First, activated carbons and PR were mixed with 20~30%
alcohol. The mixture was then put into the shaped mould to
form agglomerates. To make spheres of these agglomerates,
a shaker and a sieve with size of 30~50 mesh was used with
a shaking rate of 50 round/min and sirocco at 80~90oC.
After shaking for 10~15 min, the agglomerates formed
spheres and dried in the activated carbon powder at
100~200oC.
2.2.2. Carbonization and activation
In the first part of this experimental work, the agglomer-
ates were formed in spherical shapes. These spherical
agglomerates were heat-treated in activated carbon powder
at 350~500oC for 1 h with a heating rate of 6oC/min to form
SACs. Then, the sample of heat-treated SACs was heated in
an inert atmosphere with N2 at a flowing rate of 150 mL/
min at 700oC for 2 h. Then, the carbonized agglomerate was
heated with CO2 at a flowing rate of 150 mL/min at about
950oC for 2 h with a heating rate of 10oC/min.
For comparison, we prepared four kinds of samples with
different amounts of activated carbons and PR. The manu-
facturing procedure of the SACs and the preparation condi-
tions with the sample codes are shown in Fig. 1 and Table 1,
respectively.
2.3. Characterization
The surface morphology and structure of the SACs was
examined in an SEM (JSM-5200, JEOL, Japan). XRD was
used for crystal phase identification of the SACs. XRD pat-
terns were obtained at room temperature with a Shimata
XD-D1 (Japan) using CuKα radiation. The BET surface
area of the SACs was measured using a Quantachrome
surface area analyzer (Monosorb, USA).
2.4. Iodine number determination
The iodine number was determined based on ASTM D
4607-8626) by using the sodium thiosulfate volumetric
method. The SACs were passed through a 325 mesh screen.
Standard iodine solution was added to SACs (0.5 g) and
after equilibration time of 30 s, the residual iodine concen-
tration was determined by titration with standard sodium
thiosulfate with starch as an indicator. The iodine number
was defined as the quantity of iodine adsorbed (in mg/g of
carbon) at a residual iodine concentration.
2.5. Strength measurement
Strength measurement was determined based on JIS R
721227) by using one-point bending (Instron 4201) with sup-
port distance of 30 mm/min and cross head speed of 0.5 mm/
min. The diameter size of sample was about 5 mm, and the
strength density was calculated by the following equation:
Where is strength density (kg/m2), P is breaking load
(kg), L is support distance (cm), B is width of sample (cm)
and D is thickness of sample (cm).
2.6. Pressure drop measurement
Pressure drop of sample was measured by a circulating
pipe with an inside diameter of 27 mm and a length of 12 m.
The samples in the tank were introduced into the pipe by a
pump (2NE-20A) with the capacity of 3.5 m3/h. The pressure
drop was determined by changing the velocity in the range
of 0.25~1.7 m/sec in the pipe. The Hazen-Williams equation
for calculating the pressure drop due to frication for a given
pipe diameter and flow rate is as follows.28)
△P = 6.174×Q1.85×105/(C1.85
×d4.87)
σF
3PL
2BD2
--------------=
σF
Fig. 1. Manufacturing procedure of spherical activated car-bons.
Table 1. Preparation Method and Nomenclature
Preparation method (wt%) Nomenclature
Powdered Activated Carbons (65) +Phenol Resin (35)
SAC35
Powdered Activated Carbons (63) +Phenol Resin (37)
SAC37
Powdered Activated Carbons (60) +Phenol Resin (40)
SAC40
Powdered Activated Carbons (57) +Phenol Resin (43)
SAC43
November 2009 Preparation of Spherical Activated Carbon and Their Physicochemical Properties 570
Where, P = frictional pressure drop, kg/cm2
Q = flow rate, L/min
D = pipe inside diameter, mm
C = Hanzen-Williams C factor, dimensionaless (120)
3. Results and discussion
3.1. Textural characterization of SACs
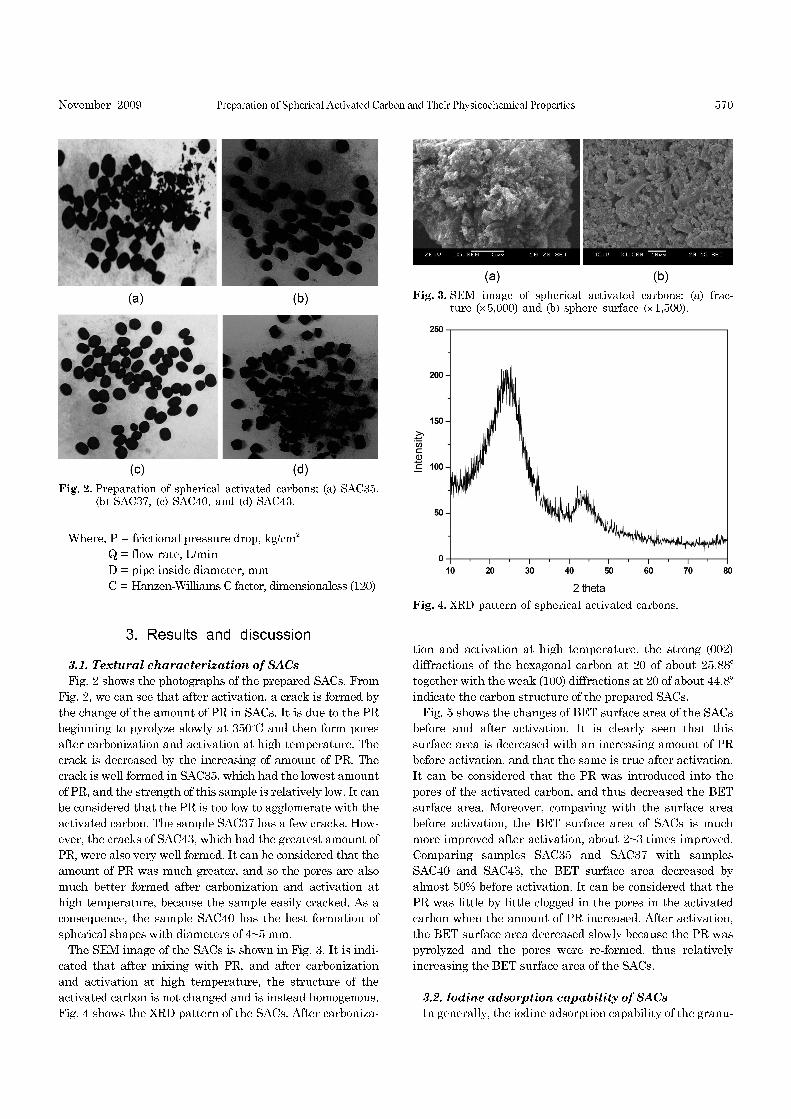
Fig. 2 shows the photographs of the prepared SACs. From
Fig. 2, we can see that after activation, a crack is formed by
the change of the amount of PR in SACs. It is due to the PR
beginning to pyrolyze slowly at 350oC and then form pores
after carbonization and activation at high temperature. The
crack is decreased by the increasing of amount of PR. The
crack is well formed in SAC35, which had the lowest amount
of PR, and the strength of this sample is relatively low. It can
be considered that the PR is too low to agglomerate with the
activated carbon. The sample SAC37 has a few cracks. How-
ever, the cracks of SAC43, which had the greatest amount of
PR, were also very well formed. It can be considered that the
amount of PR was much greater, and so the pores are also
much better formed after carbonization and activation at
high temperature, because the sample easily cracked. As a
consequence, the sample SAC40 has the best formation of
spherical shapes with diameters of 4~5 mm.
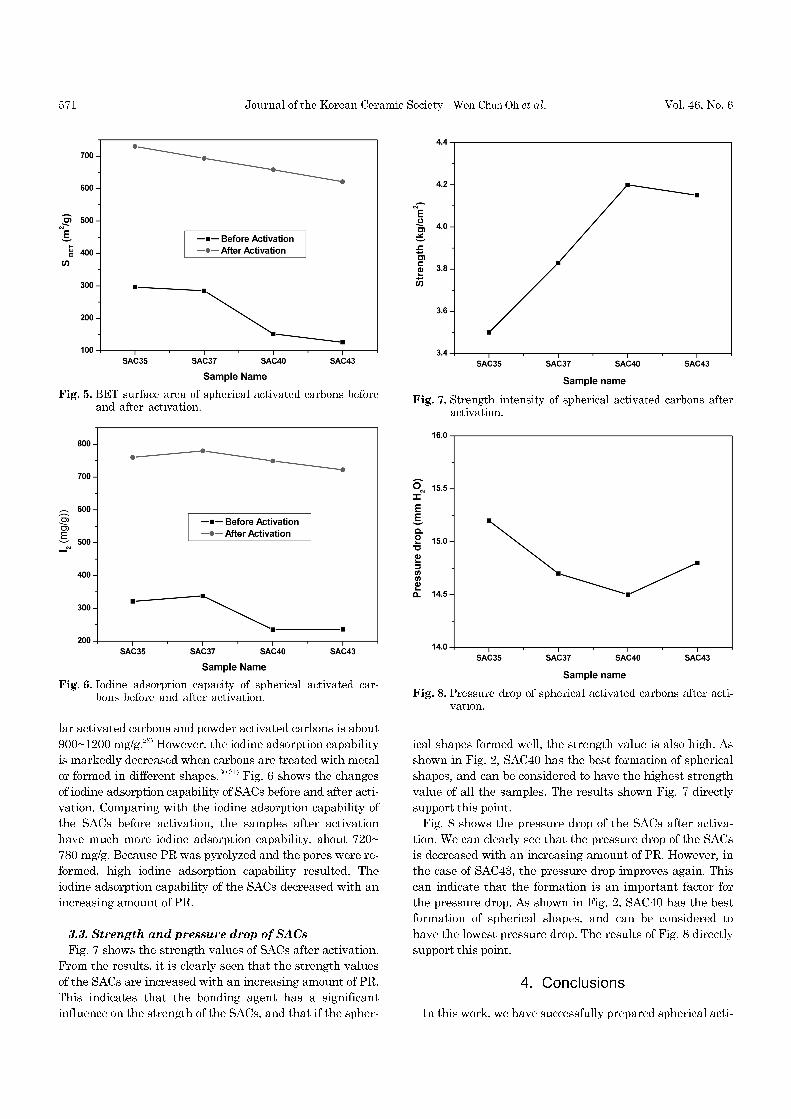
The SEM image of the SACs is shown in Fig. 3. It is indi-
cated that after mixing with PR, and after carbonization
and activation at high temperature, the structure of the
activated carbon is not changed and is instead homogenous.
Fig. 4 shows the XRD pattern of the SACs. After carboniza-
tion and activation at high temperature, the strong (002)
diffractions of the hexagonal carbon at 2θ of about 25.88c
together with the weak (100) diffractions at 2θ of about 44.8o
indicate the carbon structure of the prepared SACs.
Fig. 5 shows the changes of BET surface area of the SACs
before and after activation. It is clearly seen that this
surface area is decreased with an increasing amount of PR
before activation, and that the same is true after activation.
It can be considered that the PR was introduced into the
pores of the activated carbon, and thus decreased the BET
surface area. Moreover, comparing with the surface area
before activation, the BET surface area of SACs is much
more improved after activation, about 2~3 times improved.
Comparing samples SAC35 and SAC37 with samples
SAC40 and SAC43, the BET surface area decreased by
almost 50% before activation. It can be considered that the
PR was little by little clogged in the pores in the activated
carbon when the amount of PR increased. After activation,
the BET surface area decreased slowly because the PR was
pyrolyzed and the pores were re-formed, thus relatively
increasing the BET surface area of the SACs.
3.2. Iodine adsorption capability of SACs
In generally, the iodine adsorption capability of the granu-
Fig. 2. Preparation of spherical activated carbons; (a) SAC35,(b) SAC37, (c) SAC40, and (d) SAC43.
Fig. 3. SEM image of spherical activated carbons: (a) frac-ture (×5,000) and (b) sphere surface (×1,500).
Fig. 4. XRD pattern of spherical activated carbons.
571 Journal of the Korean Ceramic Society - Won-Chun Oh et al. Vol. 46, No. 6
lar activated carbons and powder activated carbons is about
900~1200 mg/g.29) However, the iodine adsorption capability
is markedly decreased when carbons are treated with metal
or formed in different shapes.30,31) Fig. 6 shows the changes
of iodine adsorption capability of SACs before and after acti-
vation. Comparing with the iodine adsorption capability of
the SACs before activation, the samples after activation
have much more iodine adsorption capability, about 720~
780 mg/g. Because PR was pyrolyzed and the pores were re-
formed, high iodine adsorption capability resulted. The
iodine adsorption capability of the SACs decreased with an
increasing amount of PR.
3.3. Strength and pressure drop of SACs
Fig. 7 shows the strength values of SACs after activation.
From the results, it is clearly seen that the strength values
of the SACs are increased with an increasing amount of PR.
This indicates that the bonding agent has a significant
influence on the strength of the SACs, and that if the spher-
ical shapes formed well, the strength value is also high. As
shown in Fig. 2, SAC40 has the best formation of spherical
shapes, and can be considered to have the highest strength
value of all the samples. The results shown Fig. 7 directly
support this point.
Fig. 8 shows the pressure drop of the SACs after activa-
tion. We can clearly see that the pressure drop of the SACs
is decreased with an increasing amount of PR. However, in
the case of SAC43, the pressure drop improves again. This
can indicate that the formation is an important factor for
the pressure drop. As shown in Fig. 2, SAC40 has the best
formation of spherical shapes, and can be considered to
have the lowest pressure drop. The results of Fig. 8 directly
support this point.
4. Conclusions
In this work, we have successfully prepared spherical acti-
Fig. 5. BET surface area of spherical activated carbons beforeand after activation.
Fig. 6. Iodine adsorption capacity of spherical activated car-bons before and after activation.
Fig. 7. Strength intensity of spherical activated carbons afteractivation.
Fig. 8. Pressure drop of spherical activated carbons after acti-vation.

November 2009 Preparation of Spherical Activated Carbon and Their Physicochemical Properties 572
vated carbon from coal based activated carbon with phenolic
resin as a bonding agent. Among the prepared SACs, the
sample SAC40 has the best formation of spherical shapes.
From the SEM image, the structure of the SACs is found to
be homogenous after mixing with PR and after carboniza-
tion and activation at high temperature. From the XRD pat-
tern of the SACs, the strong (002) diffractions of the
hexagonal carbon at 2θ of about 25.88o together with the
weak (100) diffractions at 2θ of about 44.8o indicate the car-
bon structure. The BET surface area of the SACs decreased
with an increasing amount of PR before activation, the
same as was found after activation. Comparing with the
surface area before activation, the BET surface area of the
SACs is much improved after activation, by about 2~3 times.
Comparing with the iodine adsorption capability of the
SACs before activation, the samples after activation have
much more iodine adsorption capability, which was about
720~780 mg/g. The strength and pressure drop values of the
SACs increased with an increasing amount of PR. In conclu-
sion, the spherical activated carbon prepared with activated
carbon and PR at a ratio of 60 :40 has the best formation of
spherical shapes, which was found in sample SAC40. After
activation, SAC40 has the highest BET surface area, iodine
adsorption capability and strength value, and the lowest
pressure drop.
Acknowledgment
본 연구는 2008년도 중소기업청 주관 산학공동기술 개발지
원사업에 의거하여 이루어졌으며, 이에 감사드립니다.
REFERENCES
1. S. H. Joo, S. J. Choi, I. Oh, J. Wak, Z. Liu, O. Terasaki, and
R. Ryoo, “Ordered Nanoporous Arrays of Carbon Support-
ing High Dispersions of Platinum Nanoparticles,” Nature,
412 169-72 (2001).
2. E. Frackowiak, “Carbon Materials for Supercapacitor
Application,” Phys. Chem. Chem. Phys., 9 1774-85 (2007).
3. M. A. de la Casa-Lillo, F. Lamari-Darkrim, D. Cazorla-
Amoros, and A. Linares-Solano, “Hydrogen Storage in Acti-
vated Carbons and Activated Carbon Fibers,” J. Phys.
Chem. B, 106 10930-34 (2002).
4. Y. R. Lin and H. Teng, “A Novel Method for Carbon Modifi-
cation with Minute Polyaniline Deposition to Enhance the
Capacitance of Porous Carbon Electrodes,” Carbon, 41
2865-71 (2003).
5. J. Lee, S. Yoon, T. Hyeon, S. M. Oh, and K. B. Kim, “Syn-
thesis of a New Mesoporous Carbon and Its Application to
Electrochemical Double-layer Capacitors,” Chem. Commun.,
21 2177-78 (1999).
6. A. Vinu, C. Streb, V. Murugesan, and M. Hartmann,
“Adsorption of Cytochrome C on New Mesoporous Carbon
Molecular Sieves,” J. Phys. Chem. B, 107 8297-99 (2003).
7. C. T. Hsieh and H. Teng, “Influence of Mesopore Volume
and Adsorbate Size on Adsorption Capacities of Activated
Carbons in Aqueous Solutions,” Carbon, 38 863-69 (2000).
8. I. Martin-Gullon and R. Font, “Dynamic Pesticide Removal
with Activated Carbon Fibers,” Water Res., 35 516-20 (2001).
9. Q. Li, V. L. Snoeyink, B. J. Marinas, and C. Campos, “Elu-
cidating Competitive Adsorption Mechanisms of Atrazine
and NOM Using Model Compounds,” Water Res., 37 773-84
(2003).
10. K. Nakagawa, A. Namba, S. R. Mukai, H. Tamon, P. Ariy-
adejwanich, and W. Tanthapanichakoon, “Adsorption of
Phenol and Reactive Dye from Aqueous Solution on acti-
vated carbons derived from Solid Wastes,” Water Res., 38
1791-98 (2004).
11. Z. Yue, J. Economy, K. Rajagopalan, G. Bordson, M.
Piwoni, L. Ding, V. L. Snoeyink, and B. J. Marinas, “Chem-
ically Activated Carbon on a Fiberglass Substrate for
Removal of Trace Atrazine From Water,” J. Mater. Chem.,
16 3375-80 (2006).
12. S. Han, K. Sohn, and T. Hyeon, “Fabrication of New Nan-
oporous Carbons through Silica Templates and Their
Application to the Adsorption of Bulky Dyes,” Chem.
Mater., 12 3337-41 (2000).
13. H. Tamai, T. Kakii, Y. Hirota, T. Kumamoto, and H.
Yasuda, “Synthesis of Extremely Large Mesoporous Acti-
vated Carbon and Its Unique Adsorption for Giant Mole-
cules,” Chem. Mater., 8 454-62 (1996).
14. C. H. Chang and A. Stella, “Control Performance of Liquid
Column Vibration Absorbers,” Prep. Symp.: Am. Chem.
Soc. Div. Fuel Chem., 43 580-86 (1998).
15. F. Haghseresht, S. Nouri, J. J. Finnerty, and G. Q. Lu,
“Effects of Surface Chemistry on Aromatic Compound
Adsorption from Dilute Aqueous Solutions by Activated
Carbon,” J. Phys. Chem. B, 106 10935-43 (2002).
16. A. Arenillas, F. Rubiera, J. B. Parra, C. O. Ania, and J. J.
Pis, “Surface Modification of Low Cost Carbons for Their
Application in the Environmental Protection,” Appl. Surf.
Sci., 252 619-24 (2005).
17. A. Derylo-Marczewska and A. W. Marczewski, “Effect of
Adsorbate Structure on Adsorption from Solutions,” Appl.
Surf. Sci., 196 264-72 (2002).
18. A. M. Puziy, O. I. Poddubnaya, V. N. Zaitsev, and O. P.
Konoplitska, “Modeling of Heavy Metal Ion Binding by
Phosphoric Acid Activated Carbon,” Appl. Surf. Sci., 221
421-29 (2004).
19. J. B. Yang, L. C. Ling, L. Liu, F. Y. Kang, Z. H. Huang, and
H. Wu, “Preparation and Properties of Phenolic Resinbased
Activated Carbon Spheres with Controlled Pore Size Distri-
bution,” Carbon, 40 911-16 (2002).
20. Z. Liu, L. Ling, W. Qiao, and L. Liu, “Effect of Hydrogen on
the Mesopore Development of Pitch-based Spherical Acti-
vated Carbon Containing Iron During Activation by
Steam,” Carbon, 37 2063-66 (1999).
21. G. Gryglewicz, K. Grabas, and E. Lorenc-Grabowska, “Prep-
aration and Characterization of Spherical Activated Carbons
from Oil Agglomerated Bituminous Coal for Removing
Organic Impurities from Water,” Carbon, 40 2403-11 (2002).
22. H. Nakagawa, K. Watanabe, Y. Harada, and K. Miura,
“Control of Micropore Formation in the Carbonized Ion
Exchange Resin by Utilizing Pillar Effect,” Carbon, 37
1455-61 (1999).
23. V. M. Gunko, R. Leboda, J. Skubiszewska-Zieba, B. Char-

573 Journal of the Korean Ceramic Society - Won-Chun Oh et al. Vol. 46, No. 6
mas, and P. Oleszczuk, “Adsorbents from Waste Ion
Exchange Resins,” Carbon, 43 1143-50 (2005).
24. E. M. Zippi and G. W. Kabalka, “Characterization and
Pyrolysis of Poly(Styrene) Derivatives,” Carbon, 34 1539-
42 (1996).
25. M. Kocirik, J. Brych, and J. Hradil, “Carbonization of
Bead-shaped Polymers for Application in Adsorption and in
Composite Membranes,” Carbon, 39 1919-28 (2001).
26. American Society for Testing and Materials, “Standard
Test Method for Determination of Iodine Number of Acti-
vated Carbon,” Philadelphia, PA: ASTM Committee on
Standards (1986).
27. Japanese Industrial Standard Specifies the Testing Meth-
ods, “Testing Methods for Carbon Blocks,” Japan Carbon
Association (1995).
28. N. S. Roh, K. H. Kim, and D. C. Kim, “Rheological Charac-
teristics of Coal-water Mixture Fuel and Pressure Losses in
Pipe Flow,” J. Kor. Ins. Chem. Eng., 33 282-91 (1995).
29. W. Lu and D. D. L. Chung, “Mesoporous Activated Carbon
Filaments,” Carbon, 35 427-30 (1997).
30. J. W. Kim, M. H. Sohn, D. S. Kim, S. M. Sohn, and Y. S.
Kwon, “Production of Granular Activated Carbon from
Waste Walnut Shell and Its Adsorption Characteristics for
Cu2+ Ion,” J. Hazardous Materials, 85 301-15 (2001).
31. S. C. Kim, I. K. Hong, and K. A. Park, “Preparation and
Performance of the Briquette Type Activated Carbon Based
on Bituminous Coal,” J. Industrial Eng. Chem., 3 218-22
(1997).