preparation of fine particulate emissions inventories lesson 1 introduction to fine particles (pm...
TRANSCRIPT

Preparation of Fine Particulate Emissions
Inventories Lesson 1
Introduction to Fine Particles (PM 2.5 )
2Preparation of Fine Particulate Emissions Inventories
What will We Discuss in Lesson 1?
After this lesson, participants will be able to describe:– the general composition of fine particulate matter in
the atmosphere
– how fine particulate matter are formed
– typical composition of ambient air in 2 western areas
– sources that contribute to the formation of fine particulate matter, nationally and in this area

3Preparation of Fine Particulate Emissions Inventories
Why is This Information Important?
This information
– puts the local inventory efforts in perspective,
– shows how source types fit into the overall accounting of PM2.5
– provides a foundation for setting inventory priorities in your area

4Preparation of Fine Particulate Emissions Inventories
PM2.5 In Ambient Air - A Complex Mixture

5Preparation of Fine Particulate Emissions Inventories
PM2.5 Composition Definitions
– Crustal ~ Metallic oxides in earth’s crust
– Fugitive Dust ~ Crustal matter emitted into the air directly, not thru a stack or vent.
– Sulfate ~ H2SO4 (condensed), (NH4)HSO4 (NH4)2SO4
– Nitrate ~ NH4NO3
– Organic Carbon ~ OC
– Organic Matter ~ OC + the associated O & H
– Elemental Carbon ~ EC
– Primary ~ Directly emitted
– Secondary ~ Formed in air from precursor gases (generally considered to be all PM2.5)

6Preparation of Fine Particulate Emissions Inventories
Why is Ambient Composition Important?
Identifying important source types on days with high PM2.5 concentration
Help prioritize inventory efforts– Carbonaceous vs. Crustal
– Sulfate vs. Nitrate
– Role of Ammonia
Help in benchmarking the validity of the EI

7Preparation of Fine Particulate Emissions Inventories
PM2.5 Composition (cont’d)
Other characteristics: Sulfate, Carbon & NO3
– Sulfate forms slowly, over long distances– Sulfate patterns relatively “flat” over large
regions. – Regionally disbursed sources– Carbon has both regional & urban components– High Nitrate concentrations are usually
more localized tend to form in urban areas, or where abundance of animal or fertilizer NH3

8Preparation of Fine Particulate Emissions Inventories
PM2.5 Composition Varies Across U.S.
NorthwestMidwest
Southeast
Sulfate Nitrate EC OC Crustal

9Preparation of Fine Particulate Emissions Inventories
Urban (EPA STN) Annual AveragesSep 2001-Aug 2002

10Preparation of Fine Particulate Emissions Inventories
Mid-Atlantic Area Air Quality in More Detail
• Maryland
• Baltimore County
• Kentucky
• Pennsylvania
• Allegheny Co
• Northampton County
• Lancaster County
• Delaware County
• Philadelphia County
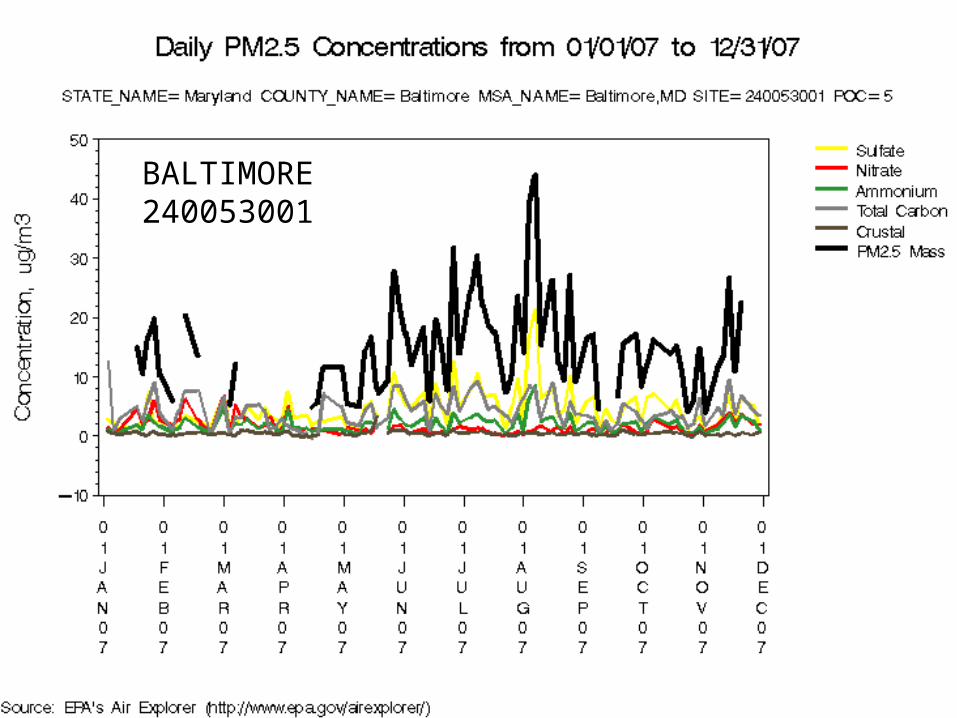
Composition of PM2.5 in Baltimore Co, MD
BALTIMORE240053001

Composition of PM2.5 in Allegheny Co, PA
PITTSBURGH420030008

Composition of PM2.5 in Northampton Co, PA
BETHLEHAM420950025

Composition of PM2.5 in Lancaster Co, PA
LANCASTER420710007

Composition of PM2.5 in Delaware Co, PA
PHILADELPHIA420450002

Composition of PM2.5 in Philadelphia Co, PA
PHILADELPHIA421010004

17Preparation of Fine Particulate Emissions Inventories
Components of PM are higher in the urban area than in the surrounding area
Urban Excess is that part of the urban AQ that is higher than in surrounding areas
Simplistically, urban excess is assumed mostly associated with urban sources
Composition AND Urban Excess
ENFI 2007

18Preparation of Fine Particulate Emissions Inventories
Urban Excess Concept in Mid-Atlantic
http://www.cambridge.org/us/catalogue/catalogue.asp?isbn=0521842875
Excess of OC and Nitrate PM 2.5 (esp in Winter) in Urban Areas of Mid Atlantic

19Preparation of Fine Particulate Emissions Inventories
Rural Monitors used for
Comparison( + ) Draft Analysis
Sulfate Est. Ammonium Nitrate EC+OC Crustal0
2
4
6
8
10
ug/m
3
Atlanta, GA / Ring of Rural Locations
Bottom: Regional ContributionTop: Urban Excess
“Urban Excess” in Atlanta, GA
20Preparation of Fine Particulate Emissions Inventories
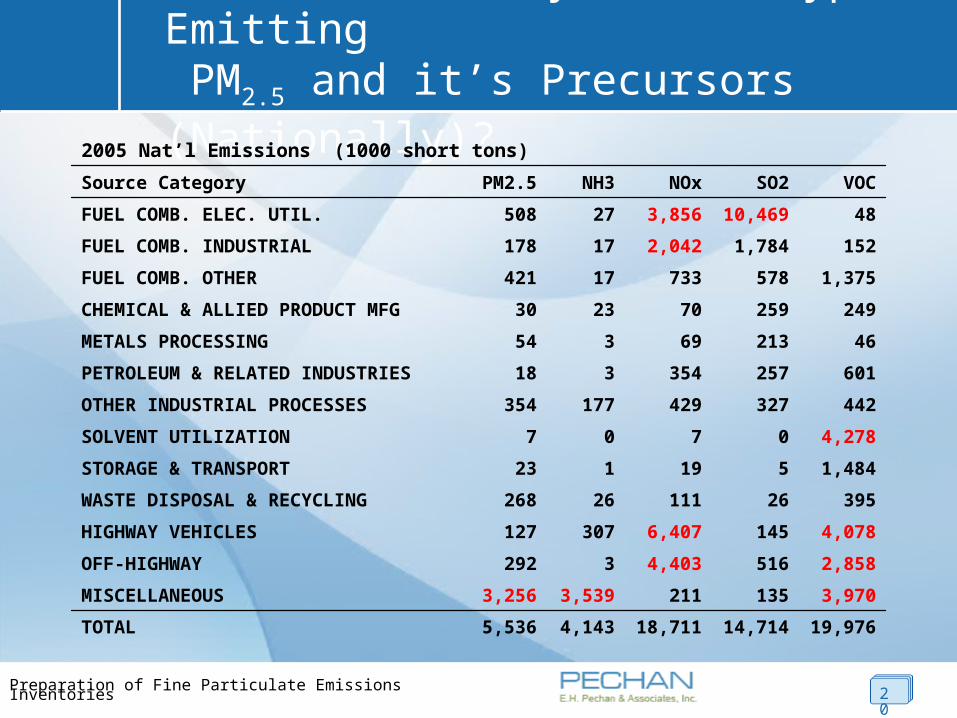
What are the Key Source Types Emitting PM2.5 and it’s Precursors (Nationally)?
19,97614,71418,7114,1435,536TOTAL
3,9701352113,5393,256MISCELLANEOUS
2,8585164,4033292OFF-HIGHWAY
4,0781456,407307127HIGHWAY VEHICLES
3952611126268WASTE DISPOSAL & RECYCLING
1,484519123STORAGE & TRANSPORT
4,2780707SOLVENT UTILIZATION
442327429177354OTHER INDUSTRIAL PROCESSES
601257354318PETROLEUM & RELATED INDUSTRIES
4621369354METALS PROCESSING
249259702330CHEMICAL & ALLIED PRODUCT MFG
1,37557873317421FUEL COMB. OTHER
1521,7842,04217178FUEL COMB. INDUSTRIAL
4810,4693,85627508FUEL COMB. ELEC. UTIL.
VOCSO2NOxNH3PM2.5Source Category
2005 Nat’l Emissions (1000 short tons)

21Preparation of Fine Particulate Emissions Inventories
Overview of PM2.5 Sources in NE U.S.
• PM2.5 (OC, EC, Ammonium Nitrate and Sulfate, Crustal)
• Open Fires (primary OC, EC, VOC, NOx & NH3)
• Open burning, land clearing debris, prescribed fires
• Motor Vehicles (NOx, VOC, NH3, OC, EC)
• Non road emissions (NOx, VOC, NH3, OC, EC)
• aircraft, lawn, construction, and agricultural equipment.
• Residential Wood Combustion (OC, EC, VOC)
• Boilers (OC, EC, VOC, NOx, SO2, some crustal)
• Fugitive Dust (mostly crustal, some OC, EC)
• More ~ Anti-skid sanding, Construction
• Lesser ~ Agriculture, unpaved roads, windblown dust

22Preparation of Fine Particulate Emissions Inventories
Overview of PM2.5 Sources in NE U.S.
• PM2.5 (Crustal, OC, EC, Ammonium Nitrate)
• Misc VOC Sources (precursor to secondary OC)
• household and industrial products, such as paints and varnishes, cleaners, disinfectants, and degreasers.
• Fuel combustion and the handling and distribution of fuel
• Dairies and other livestock waste
• Open Burning and Prescribed fires • Misc Ammonia Sources (precursor to ammonium
nitrate)
• Livestock wastes from dairies and agricultural operations

23Preparation of Fine Particulate Emissions Inventories
Mid-Atlantic Area 2005 PM 2.5 Emissions (TPY)
STATE PM2.5 VOC* NOx SO2 NH3
Delaware 8,537 34,807 54,832 85,174 14,045
Dist. of Columbia 1,445 10,706 14,588 3,914 450
Maryland 57,400 224,255 273,777 381,313 31,814
New Jersey 31,135 295,479 294,775 101,433 15,221
N Carolina 129,390 605,757 522,620 650,560 173,581
Pennsylvania 147,592 560,136 677,499 1,181,249 94,066
Virginia 98,964 405,053 436,358 345,669 58,246
W Virginia 64,310 137,768 291,372 536,392 14,216
Totals 538,774 2,273,962 2,565,821 3,285,703 401,640
Note: Anthropogenic VOC (Biogenic VOC > Anthropogenic VOC in Mid Atlantic, SE US)

24Preparation of Fine Particulate Emissions Inventories
Mid-Atlantic Area 2005 PM 2.5 Emissions (TPY)
STATEPaved Roads Construction
Agricultural Tilling
Unpaved Roads
Delaware 168 352 262 0
Dist. of Columbia 28 383 0 0
Maryland 923 3,799 2,608 63
New Jersey 807 118 38 428
N Carolina 5,497 3,867 10,287 2,340
Pennsylvania 5,418 7,732 7,555 8,316
Virginia 2,965 3,115 2,713 5,842
W Virginia 1,067 2,451 349 4,201
Total 16,873 21,816 23,813 21,191

25Preparation of Fine Particulate Emissions Inventories
Mid-Atlantic Area 2005 PM 2.5 Emissions (TPY)
STATEAgricultural
Burning*
Residential Waste - Open
Burning
Land Clearing Debris -
Open Burning
Residential Wood
Combustion
Delaware 0 42 74 1,228
Dist. of Columbia 0 0 0 84
Maryland 0 611 7,481 8,194
New Jersey 204 32 0 9,361
N Carolina 6,788 9,619 7,868 10,473
Pennsylvania 0 2,489 7,016 10,283
Virginia 0 5,727 5,007 9,880
W Virginia 0 3,642 3,017 3,025
Total 6,992 22,162 30,463 52,528
Note: Extent of Ag Biomass Waste Burning is not fully understood

26Preparation of Fine Particulate Emissions Inventories
Let’s Talk More About Crustal and Carbon

27Preparation of Fine Particulate Emissions Inventories
Crustal Material – Sources & Composition
Fugitive Dust ~ Main source of Crustal– Unpaved roads
– Anti-skid materials on paved roads
– Agricultural tilling, dairies
– Wind-blown dust
– Construction
Fly ash
Composition of Fugitive Dust ~ a mixture of:– “earth oxides” (e.g., oxides of Ca, Al, Si, Fe & Ti)
– carbonaceous material (EC, OCM)

28Preparation of Fine Particulate Emissions Inventories
Speciation of Crustal
“Speciation” ~ process of estimating the components of the sample, e.g., crustal by using the chemical characteristics of the sample:
Crustal% = C1Al% + C2Ca% + C3Si% +C4Fe% + C5Ti%
where Al%, Ca%, Si%, Fe% & Ti% are these species % of the sample’s mass
Speciation can be done on both ambient measurements AND emissions
More about emissions speciation later

29Preparation of Fine Particulate Emissions Inventories
Carbonaceous Material – “Matter” Ratio of OC to EC changes with source
– Mobile Sources Gas: 5 - 15
– Mobile Sources Diesel: 0.4
– Open Fires: 10 - 12
– Residential Wood Burning: 7 - 8
– Fugitive Dust: 15 - 25
Hannaford 2009

30Preparation of Fine Particulate Emissions Inventories
Organic Carbon “Matter” (OCM) Emissions
“Matter” is the O and H that are part of the OC molecule
– The OC measurement must be “augmented” to account for the “matter”
Augmentation of Primary (Fresh) Emissions – augmentation done using a multiplier –
– OCM = C * OC
– C(E) = 1.2 to 1.8 (depending on source type)
– C(E) applied in Emissions processor
*C(E) values documented in Reff 2009
Augmenting Aged Aerosol-- C(E) = 1.8 - 2.4 (depends on aging, other factors)

31Preparation of Fine Particulate Emissions Inventories
Organic Carbon “Matter” (OCM) Emissions
Aerosol Aging and Secondary Formation: – 2 aging / formation processes:
1st – particles oxidize as they “age”
2nd – additional “secondary” particles form
– AQ Models age the aerosols and account for the formation of secondary organic carbon
– In ambient aerosols, the C(A) can be as high as 2.4
ambient OC includes secondary formation (which has a high matter content) and
aerosol aging by oxidation, which adds O and H “matter”

33Preparation of Fine Particulate Emissions Inventories
Let’s Review and Summarize
A Complex Mixture– Speciated Ambient Data
– Composition
– Primary vs. Secondary
Key Sources– Composition by source type
– Directly emitted vs. precursors

34Preparation of Fine Particulate Emissions Inventories
Review: PM2.5 In Ambient Air - A Complex Mixture
NH4NO3

35Preparation of Fine Particulate Emissions Inventories
Review of Important PM2.5 SourceCategories
Combustion a, b
Open Burning (all types)Non-Road & On-Road MobileResidential Wood BurningWildfiresPower Gen Boilers (Oil, Gas, Coal)Boilers (Wood)
Crustal / Metals b
Fugitive DustMineral Prod IndFerrous Metals
SO2 c
Power Gen (Coal)Boilers (Coal)Power Gen (Oil)Boilers (Oil)Industrial Processes
NOx
On-Road Mobile (Gas, Diesel)Power Gen (Coal)Non-Road Mobile (Diesel)Boilers (Gas, Coal)Residential (Gas, Oil)Industrial Processes
NH3
On-Road MobileAnimal HusbandryFertilizer ApplicationWastewater TreatmentBoilers
VOC d
BiogenicsSolvent useOn-Road (Gas)Storage and TransportResidential WoodPetrochemical IndustryWaste Disposal
DIRECT EMISSIONS
a Includes primary organic particles, elemental carbon and condensible organic particles; also some flyashb Impact of carbonaceous emissions on ambient PM 5 to 10 times more than crustal emissions impactc Includes SO2, and SO3 and H2SO4 condensible inorganicsd Contributes to formation of secondary organic aerosols
PRECURSOR EMISSIONS
NOTE: Categories in BOLDare most important nationally. Their relative importance varies among and between urban and rural areas.

36Preparation of Fine Particulate Emissions Inventories
Questions?
Typical Haze in the Blue Ridge Mountains
TPace 2009