preliminary report hurricane georges john l. guiney ... september - 01 october 1998 john l. guiney...
TRANSCRIPT

1
Preliminary ReportHurricane Georges
15 September - 01 October 1998
John L. GuineyNational Hurricane Center
05 January 1999
Updated 9 Spetember 2014 for U.S. damage
Georges (pronounced Zhorzh) was the second deadliest and secondstrongest hurricane within the Atlantic basin during the 1998 season. Its 17day journey resulted in seven landfalls, extending from the northeasternCaribbean to the coast of Mississippi, and 602 fatalities -- mainly in theDominican Republic and Haiti.
a. Synoptic History
Georges originated from a tropical wave, observed by satellite and upper-air data, which crossed the west coast of Africa late on 13 SeptemberRawinsonde data from Dakar, Senegal showed an attendant 35 to 45 knoteasterly jet between 550 and 650 millibars (mb). On the 14 , visible satelliteth
imagery depicted a large, well-defined cloud system in association with thewave and meteorologists at the Tropical Prediction Center/National HurricaneCenter (NHC) Tropical Analysis and Forecast Branch (TAFB), the SatelliteAnalysis Branch (SAB) of the National Environmental Satellite, Data, andInformation Service, and the Air Force Weather Agency (AFGWC) begansatellite-based Dvorak intensity classifications. By early on the 15 , shipth
reports indicated the presence of a closed surface circulation in this system andit is estimated that a tropical depression formed at 1200 UTC, centered about300 n mi south-southwest of the Cape Verde Islands in the far eastern Atlantic,as shown in the post-storm “best-track” - see Table 1 and Figure 1. During thenext 24 hours the tropical depression continued to become better organized asbanding features developed and deep convection formed over the center. Thesystem became a tropical storm at 1200 UTC on 16 September while centeredabout 620 n mi west-southwest of the Cape Verde Islands. Georges moved ona persistent west-northwest course for the next ten days, a classic Cape Verde-type track, in response to a mid- to upper-level tropospheric ridge whichstrengthened with height.
Georges continued to gradually strengthen over the next several days,reaching hurricane intensity around 1800 UTC on 17 September when abanding-type eye feature became evident in satellite imagery. By the 19 , anth
upper-level anticyclone was well-established over Georges and satellite pictures

2
suggested that the hurricane was beginning to strengthen rapidly, as indicatedby the cooling cloud tops, increased symmetry of the deep convection, and thewarming and contracting of the well-defined eye. By early afternoon on the 19 , the first U.S. Air Force Reserve (USAFR)th
reconnaissance aircraft reached the hurricane and measured maximum flight-level winds of 146 knots and a minimum central pressure of 938 mb -confirming the intensification trend noted in satellite imagery. Georges’ windswere increased to 125 knots at 1800 UTC on the 19 making it a category fourth
hurricane on the Saffir-Simpson Hurricane Scale.
Several Global Positioning System (GPS) dropwinsondes were deployedwithin the eye-wall region of the hurricane during these reconnaissancemissions. Near-surface (below 200 feet) wind estimates from these dropsindicate maximum winds from 134 knots to 150 knots. On this basis, Georgesis estimated to have reached a peak intensity of 135 knots at 0600 UTC on the20 while located about 285 n mi east of Guadeloupe in the Lesser Antilles.th
Although GPS Dropwinsondes data is still being evaluated by scientists at theNational Oceanic and Atmospheric Administration (NOAA) Hurricane ResearchDivision, preliminary research suggests that the observed near-surface windsapproximate one-minute values. For additional information on the GPSDropwindsondes, please see Franklin (1997) and Franklin et. al. (1997). Shortly after 0600 UTC 20 September, the hurricane began a marked
weakening trend with the eye becoming indiscernible in satellite pictures, or toaerial reconnaissance by that afternoon. Examination of water vapor satelliteimagery and satellite-derived wind analyses from the Cooperative Institute forMeteorological Satellite Studies at the University of Wisconsin suggest that onepossible factor responsible for the weakening could have been upper-levelnortherly vertical wind shear induced by an upper-level anticyclone located overthe eastern Caribbean. By the evening of the 20 , the central pressure hadth
risen 26 mb and Georges weakened. It then made the first two of its sevenlandfalls in the Lesser Antilles, first in Antigua then in St. Kitts and Nevis, earlyon the 21 with maximum sustained surface winds of 100 knots.st
By mid-morning of the 21 an upper-level low over Cuba, denoted inst
water vapor imagery, was moving westward away from Georges therebyreducing the possibility of Georges moving to the northwest, away from PuertoRico. Later in the afternoon, the shear appeared to diminish and the outflowaloft improved but Georges never fully recovered due in part to the circulation’sinteraction with Puerto Rico. Georges made landfall in southeast Puerto Ricowith sustained surface winds of 100 knots on the evening of the 21 . Thest
hurricane moved inland over Puerto Rico and weakened slightly and thenmoved into the Mona Passage early on the 22 . Georges began to re-intensifynd
while over the Mona Passage and made landfall later that morning in theDominican Republic, about 75 n mi east of Santo Domingo with estimated

3
sustained surface winds of 105 knots.
During the next 21 hours Georges weakened as it moved slowly acrossthe mountainous terrain of the Dominican Republic and Haiti, where it producedcopious rains resulting in deadly flash floods and mud slides. The systememerged into the Windward Passage on the morning of the 23 with 65 knotrd
maximum winds. Georges changed little before making landfall in easternCuba later that afternoon, about 25 n mi east of Guantanamo Bay. The systemretained hurricane status while moving slowly west-northwestward across thenorthern coast of Cuba, exiting the northern coast by late afternoon on the 24 .th
Satellite imagery showed that the system retained a fairly impressive upper-level outflow pattern during its crossing of both Hispaniola and Cuba.
Once back over water, the hurricane began to re-intensify. Satellitepictures showed that a band of deep convection developed east of the centerearly on the 25 which expanded throughout the morning. Georges madeth
landfall during mid-morning of the 25 in Key West, Florida with a minimumth
central pressure of 981 mb and maximum winds of 90 knots. After movingaway from Key West, Georges turned more to the northwest, then north-northwest, and gradually slowed down on the 26 and 27 . This occurred inth th
response to the mid-tropospheric anticyclone north of the hurricane shiftingeastward into the southeastern United States. The hurricane made landfallnear Biloxi, Mississippi on the morning of the 28 with estimated maximumth
sustained one-minute winds of 90 knots and a minimum central pressure of 964mb. After landfall, the system meandered around southern Mississippi and wasdowngraded to a tropical storm on the afternoon of the 28 . th
Georges became quasi-stationary for the next 6 to 12 hours moving in acyclonic loop over southern Mississippi. The tropical storm began moving in agenerally northeast to east direction early on the 29 and was downgraded toth
a tropical depression by mid-morning while located about 30 n mi north-northeast of Mobile, Alabama. Georges continued to move eastward at 5 to 10knots on the 29 and 30 . By early morning of 1 October, the systemth th
dissipated near the northeast Florida/southeast Georgia coast, although a veryweak remnant low did emerge over the western Atlantic during the day.However, the remnant circulation merged with a frontal zone by late on the 1 .st
b. Meteorological Statistics
The best-track intensities in Table 1 were obtained from the data inFigures 2 and 3 which depict the curves of minimum central sea-level pressureand maximum sustained one-minute average “surface” (10 meters aboveground level) wind speed, respectively, as a function of time. These figuresalso contain data upon which the curves are based: USAFR and NOAA aircraftreconnaissance data, satellite-based Dvorak-technique intensity estimates from

4
TAFB, SAB, and AFGWC, and estimates from synoptic data analyses afterlandfall.
1. Wind and Pressure Data
The bulk of the aerial reconnaissance flights into Georges were done bythe USAFR “Hurricane Hunters”. The Hurricane Hunters flew 17 missions, andmade 81 center fixes while NOAA aircraft performed six missions contributing24 center fixes. The highest wind speed reported was 152 knots (at 700 mb)at 0112 UTC 20 September by the NOAA aircraft. The lowest central pressurereported was 937 mb at 0613 UTC 20 September by the Hurricane Hunters witha corresponding maximum flight-level wind of 144 knots. During this period,subjective Dvorak intensity estimates from TAFB, SAB and AFGWC were T6.5(127 knots/935 mb) and objective-based Dvorak estimates ranged betweenT6.5 and T7.0 (140 knots/921 mb), all in good agreement with GPSdropwindsonde pressure and wind estimates.
George’s track brought it into range of several National Weather ServiceDoppler radars (WSR-88D - Weather Surveillance Radar-1988 Doppler)specifically; San Juan, Puerto Rico, Key West, FL, New Orleans, LA and Mobile,AL. The WSR-88D in San Juan, Puerto Rico measured winds near 100 knotsaloft at 0205 UTC 22 September while the center was located over centralPuerto Rico. Dr. Joshua Wurman of the University of Oklahoma was operatinghis dual doppler radar (Doppler-on-Wheels DOW) during Georges’ landfall inBiloxi, Mississippi. Around 0855 UTC 28 September, the radar showedmaximum wind near 107 knots, which represents a 2 to 5 second gust. Forfurther information on the DOW radar project, please refer to Wurman (1998).
Several land-based locations within the Caribbean recorded sustainedhurricane-force winds during Georges passage including Hamilton Airport andVITEMA/Herman Hill in St. Croix, Cyril E. King Airport in St. Thomas, and allthe official reporting sites in Puerto Rico. The highest sustained wind and gustreported at an official site was 78 knots and 93 knots, respectively, at RooseveltRoads Naval Station (TJNR) at 2302 UTC 21 September. These, as well asother selected surface observations for Georges, are listed in Table 2. Thehighest unofficial wind report received in the Caribbean was a wind gust of 153knots (at an elevation of about 700 feet) from the island of Saba of theNetherlands Antilles at 1044 UTC 21 September. The corresponding minimumpressure recorded at the site was 971.9 mb.
As is often the case in the Caribbean, many unofficial weather reports arerelayed to the NHC via amateur radio operators. These observations areinvaluable in helping to determine conditions in locations with no officialweather reporting equipment. Table 3 lists selected amateur radio surfaceweather reports for Georges. One of the most important observations reportedwas in Fajardo, Puerto Rico where the Civil Defense office measured a sustainedwind of 96 knots with gusts to 113 knots at 2130 UTC 21 September.

5
Operationally, this report was the basis of making Georges a category 3hurricane at landfall in Puerto Rico .
The USAFR reconnaissance reported a maximum flight-level wind of 117knots and a minimum central pressure of 962 mb near the time of landfall insoutheast Dominican Republic.
Surface reports received from the Instituto de Meteorologica in Cubaindicate that the maximum 1-minute surface wind observed was 71 knots atPunta Lucrecia, Holguin while the highest gust of 80 knots was measured atSagua La Grande, Villa Clara. The minimum central pressure recorded overCuba was 988 mb in Cayo Coco. All of these reports occurred as Georgesmoved out of Cuba and into the Florida Straits where it began to restrengthen.
The maximum sustained 2-minute wind recorded at Key West, FL was 48knots at 1353 UTC 25 September with the peak gust of 76 knots; the minimumcentral pressure reported was 982.5 mb. It should be noted that due toequipment/power failure around 1500 UTC a higher wind and a lower pressurevalue likely occurred. The highest gust recorded in the Florida Keys was 96knots at the Monroe County Emergency Operations Center in Marathon. TheSombrero Key C-MAN buoy (SMKF1) recorded a maximum sustained wind of 82Knots with a peak gust to 92 Knots at 1500 UTC 25 September. Moreover, thisbuoy recorded hurricane-force winds for a three hour period (1300 - 1600UTC). This, along with other National Data Buoy Center (NDBC) observations,can be found in Table 4.
Georges made its final landfall near Biloxi, Mississippi around 1130 UTCon 28 September with maximum sustained surface winds of 90 knots and aminimum central pressure of 964 mb. The USAFR aircraft reported a 960 mbpressure at 0503 UTC. The lowest pressure measured by a land station was964.9 mb at 1055 UTC 28 September at Keesler Air Force Base (KBIX) in Biloxi,MS; Harrison County Civil Defense in Gulfport, MS recorded 967.2 mb at 1015UTC. The NOAA ship Oregon II measured a minimum central pressure of 970mb at 0830 UTC 28 September while in port in Pascagoula, MS. On the 28 ,th
Keesler Air Force Base (KBIX) in Biloxi, MS reported sustained hurricane-forcewinds (65 Knots) at 0855 UTC. At 0755 UTC, KBIX reported wind gusts of 109knots, and 149 knots at 0855 UTC 28 September. The latter value isconsidered to be invalid based on the following: 1) DOW dual doppler maximumwind measurements made at the same time at KBIX were near 107 knots(considered a 2-5 second gust); 2) the anemometer at KBIX is a hot-wireanemometer which has been shown to be prone to major errors in heavy rain,e.g., the erroneous 205 knot wind gust in Typhoon Paka (Hagemeyer, 1998);3) USAFR dropwindsonde data from the same time period measured a peakwind of 101 knots at 920 mb. An Texas Instrument WR25 anemometer,operated by Mississippi Power and Light one mile north of the beach in Biloxi,measured a wind gust of 102 Knots.
Reconnaissance data from the USAFR aircraft suggest that the boundarylayer and inner core of the Georges never fully recovered from its passage

6
across Hispaniola and Cuba. Despite an apparently healthy cloud and outflowpattern and a small, but gradual, drop in the minimum central pressure of 13mb (975-962 mb) in a 36-hour period from early on the 26 to the evening ofth
the 27 , the eye was never able to become re-established. Most of the vortexth
messages from the 26 through the 28 reported a partially-formed eyewall -th th
mostly open to the west or southwest. Also, eyewall GPS dropwinsonde datanear landfall in Mississippi suggest that the winds at the surface were 20-30%below those at flight level (10,000 feet). This is in stark contrast to eyewallsamples taken when Georges was near peak intensity just east of the LeewardIslands where the surface winds, on average, were equal to or greater thanthose at 10,000 feet.
Table 4 contains all known ship observations which reported winds oftropical storm-force (34 knots) or higher associated with Georges. The highestwind observation was 44 knots from Ship PJKP at 1500 UTC 29 September inthe Gulf of Mexico. The highest significant wave height reported by a ship was13 feet (WFLG at 0900 UTC 22 September and C6JN at 1800 UTC 29September) while the highest value recorded at a NDBC buoy was near 36 feetat 42040 in the Gulf of Mexico.
2. Storm Surge Data
The storm surge was estimated to be near 10 feet in Fajardo, Puerto Ricowhile values of 4 to 6 feet were typical in the Florida Keys. Preliminary stormsurge estimates along the central and east Gulf Coast range from 5 to 9 feet inLouisiana and Mississippi (maximum of 8.9 feet at Point A La Hache, LA andPoint Cadet, Biloxi, MS) to 5 to 12 feet in Alabama (5 to 10 feet in MobileCounty and 7 to 12 feet in Baldwin County). The two highest values receivedfrom Alabama are 9.3 feet which occurred in west Mobile Bay, and 11.9 feet inFort Morgan. In the Florida Panhandle, the storm surge in Escambia, SantaRosa, and Okaloosa Counties was estimated to be 5 to 10 feet. Of coursebreaking waves superimposed on the storm surge will result in even higherwater marks. At the time of this writing, official United States Corps ofEngineers/ Geological Survey (USCE/USGS) storm surge site survey valueshave not been received.
3. Rainfall Data
Georges was a substantial rain-producer in portions of the Caribbean andthe central/eastern Gulf of Mexico coast. In the U.S. Virgin islands, rainfalltotals were generally between 3 and 8 inches. In Puerto Rico, the maximumofficial two-day USGS rain gage measurement was 24.62 IN in Lago El Guineonear Villalba while the maximum Cooperative Observer (CO-OP) two-day totalreported was 28.36 inches in Jayuya. Figure 3 shows the USGS rainfallanalysis for Puerto Rico in 5-inch isohyets - of particular interest is the largeswath of 10-15 inch values.
No surface-based rainfall estimates are available from the Dominican

7
Republic or Haiti, two of the hardest-hit countries. Satellite-derived rainfallestimates suggest that as much as 39 inches of rain may have fallen overportions of the Dominican Republic and Haiti over a 24-hour period endingaround 1200 UTC on the 23 . Over Cuba, the Instituto de Meteorologicard
reported a maximum storm total of 24.41 inches in Limonar.
Rainfall in the Florida Keys was considerably less than what was seen overCuba or Hispaniola, with Key West recording 8.38 inches. In contrast, stormtotals along the Gulf Coast were noticeably higher owing to the hurricane’smarked deceleration. The maximum rainfall total from an official observationsite was 24.24 inches at Eglin AFB (KVPS) in the Florida Panhandle while thehighest storm total was 29.66 inches from a CO-OP in Bay Minette, AL. Rainfalltotals generally ranged from 10 to 20 inches over most of southern Mississippiand Alabama, and the Florida Panhandle - see Figure 4. In response to theheavy rains, widespread river flooding occurred in southern Mississippi from 30September through 2 October flooding homes and forcing evacuations. TheTchoutacabouffa River at D’Iberbville, MS set a record crest of 19 feet at 0200UTC 30 September.
4. Tornadoes
Most of the reported tornado activity associated with Georges occurredin Florida and Alabama with a total of 28 tornadoes estimated to have toucheddown, mostly in northwest Florida. No deaths were directly attributible to thesetornadoes. Two tornadoes were also reported in Puerto Rico.
c. Casualty and Damage Statistics
Table 5 lists the deaths and insured damage estimates associated withGeorges. The 602 direct deaths attributed to Georges make it the 19* th
deadliest tropical cyclone in the Atlantic basin this century (Rappaport andPartagas, 1995). Most of the deaths associated with Georges (Table 6) occurredin the Dominican Republic and Haiti, due mainly to flash flooding andsubsequent mud slides in high terrain regions. The lone direct death in theUnited States, which was freshwater flood-related, occurred in Mobile, Alabama.
Insured property damage estimates supplied by the Property ClaimsServices Division of the American Insurance Services Group estimates thatGeorges caused a total of $2.955 billion in damage in the United Statesincluding Puerto Rico and the U.S. Virgin Islands (see Table 6 for individualstate totals). These estimates exclude storm surge damage. To determine thetotal estimated damage, a ratio of 2:1 is applied to the insured propertydamage; this is based on comparisons done in historical hurricanes. Thus, thetotal estimated damage from Georges is $5.9 billion. Note - in 2011 theU.S. damage estimate (including Puerto Rico and the U.S.V.I.) was revised to$6.365 billion.
* - This represents the best estimate received to-date and is subject to later revision. Totals which appear in Table6 from the Dominican Republic and Haiti are government-based estimates as reported in media accounts.

8
In Puerto Rico, there was considerable damage to homes throughout theisland. A total of 72,605 homes were damaged, of which 28,005 are estimatedto have been completely destroyed. During the hurricane, over 26,000 peoplewere in shelters. In the Dominican Republic upwards of 185,000 were lefthomeless by Georges and 100,000 remained in shelters through mid-October
as electricity and water service remain out in most of the country. Across Haiti, government officials stated that 167,332 had been left homeless by thehurricane.
The agricultural industry in Puerto Rico was hit hard by Georges withestimates of 95% of the plantain and banana crop destroyed along with 75%of the coffee crop.
Despite Georges’ weakened state when it moved across Cuba, it had asubstantial impact. A total of 60, 475 homes were damaged of which 3,481were completely destroyed. As was the case in Puerto Rico, the agriculturalsector was hard hit with major losses at banana plantations in eastern Cuba.
The damage to dwellings in the United States was not as extensive asthat experienced across the Caribbean. In the Florida Keys 1536 homes weredamaged of which 173 were completely destroyed, many of which were mobilehomes. Some roof and structural damage was also reported along the coast ofMississippi.
In the first 60 days or so after Georges made its final landfall inMississippi, the American Red Cross spent $104 million on relief services in theUnited States Virgin Islands, Puerto Rico, Alabama, Louisiana, Mississippi, theFlorida Keys and the Florida Panhandle. This makes it the most expensivedisaster aid effort in the organization’s 117-year history.
d. Forecast and Warning Critique
Overall, the track forecasts for Georges were generally good. The lowaverage errors of CLIPER show that the hurricane followed a climatologically-favored path.
The average track model and official forecast errors for Georges are listedin Table 6. The average official forecast errors are well below the most recent10-year average. These values represent a 47% to 60% improvement over the10-year official averages: 60% at 12 hr, 56% at 24 hr, 56% at 36 hr, 53% at48 hr, and 47% at 72 hr. It should be noted that the slow motion of Georgesover the north central Gulf of Mexico contributed to the low errors.
Not surprisingly, most of the track model guidance did quite well withGeorges. In fact, with the exception of BAMS and a few periods of the AVNI,

9
AVNO and A98E, the average errors of all the other track models were belowthe 10-year official averages. This includes the United Kingdom MeteorologicalOffice (UKM/UKMI) and the European Centre for Medium Range WeatherForecasting (EMX) models. Moreover, LBAR had slightly smaller average errorsthat the official forecast from 12 to 36 hr (although the EMX 48 hr error was 84n mi the sample size is too small to make any meaningful conclusions). Itshould be mentioned, however, that although the GFDL track errors were wellbelow the 10-year official forecast errors, it had a distinct left-bias over the Gulfof Mexico, insisting on turning Georges westward into central and southwestLouisiana.
While the average official track errors are exemplary, the averageintensity errors are unimpressive. The mean absolute errors, and associatedbiases, for the official forecast, SHIPS, the GFDL and GFDI, and SHIFOR arelisted Table 7. The official mean intensity forecast errors are within 10% of themost recent 10-year official average with the exception of 72 hr (16%). SHIPSand the GFDI are in fairly good agreement with the official forecast errors whilethe GFDL is considerably higher at 12 and 24 hr. The official NHC forecastshows a positive bias (i.e. the intensity was over-forecast) for all periods asopposed to the negative bias of the 10-year official average. SHIPS also showsa positive bias for all but the 12 hr period, owing to the absence of landrecognition in the model, while both the GFDI and GFDL has a distinct negativebias throughout, with that of the GFDL considerably larger. Of more interestare the biases at specific times.
Examination of the intensity forecast history of Georges shows severalinteresting trends. The first five official forecasts after the system attainedtropical storm strength under-forecast the intensity an average of 18 knotsbetween 12 to 48 hr and 44 knots at 72 hr. While SHIPS’ intensity errors werecomparable to the official forecast, the GFDL faired worse with 29 knotsbetween 12 and 48 hr and 55 knots at 72 hr. These forecasts represent theperiod when Georges went through its rapid intensification phase.
The intensity forecasts from 1800 UTC 19 September to 0600 UTC on 20th
show a significant positive bias. This is when Georges went through a markedweakening trend. During this period, both the official NHC forecast and SHIPSover-forecast the intensity an average of about 21 knots between 12 and 48 hr;at 72 hr the errors were 43 knots and 36 knots, respectively. The GFDL showedlower errors for this period with a mostly negative bias. Several of the 12 hrforecasts under-forecast the intensity by 50 knots. These data highlight ourlimited skill level in forecasting rapid, abrupt changes in intensity.
Table 8 lists the various watches and warnings issued in association withGeorges. Since Georges was well-forecast, the lead times on the hurricanewarnings were more than sufficient to allow for the completion of protectiveactions. A total of nearly 897,000 residents evacuated portions of south andwest central Florida including about 100,000 people in Dade County, and

10
35,000 in the Florida Keys in response to the mandatory evacuation orderissued by the Monroe County Emergency Management.
References:
Franklin, J.L. 1997: Status of GPS dropwindsondes. Minutes, 51stInterdepartmental Hurricane Conference, Miami, FL.
Franklin, J.L., H.L. Cole, T.F. Hock, D.K. Lauritsen, K.D. Norris, and E.F.Chamberlain, 1997: GPS dropwindsondes and the NOAA G-IV aircraft: Newopportunities for forecasting and research. Preprints, 22nd Conference onHurricanes and Tropical Meteorology, Ft. Collins, CO, AmericanMeteorological Society, 135-136.
Hagemeyer, R.H., 1998: Super Typhoon Paka December 2 thru 21, 1997.DOC/NOAA Service Assessment, National Weather Service, Honolulu,Hawaii, 28 pp. Rappaport, E.N. and J. Fernandez-Partagas, 1995: The deadilest AtlanticTropical cyclones, 1492-1994, NOAA, Technical MemorandumNWS-NHC-47, 41 pp.
Wurman, J. and J.Winslow, 1998: Intense Sub-kilometer-scale boundary layerrolls observed in Hurricane Fran, Science, V.280, p555-7.
Acknowledgments:
The author is indebted to the NWS Forecast Offices in San Juan, Puerto Rico,Florida (Miami, Melbourne, Tampa, and Tallahassee), Alabama (Mobile), andLouisiana (New Orleans/Baton Rouge) for their Post-Storm reports and relateddata. Data provided by the Instituto de Meteorologica in Cuba is gratefullyappreciated. Damage data was kindly provided by the Property Claims ServicesDivision of the American Insurance Services Group. Steve Baig produced thebest track maps. Rick Ullom, SERFC Atlanta, Georgia, provided the rainfallfigure for the Gulfcoast region; Shawn Bennett, SOO NWS San Juan, PuertoRico, provided the rainfall figure for Puerto Rico. The author wishes to thankLixion Avila, Jack Beven, Jerry Jarrell, Miles Lawrence, Max Mayfield, RichardPasch, and Ed Rappaport for reviewing this document and making numeroussuggestions which helped improve the report.

Figure 1. Best Track for Hurricane Georges, 15 September - 1 October, 1998.

Figure 4.
Preliminary rainfall analysis for Puerto Rico for Hurricane Georges, 21-22 September 1998.
(Source: U.S. Geological Survey)

Figure 5.
Preliminary rainfall analysis for the Gulf Coast for Hurricane Georges, 28-30 September 1998.
(Source: NOAA/NWS/Southeast River Forecast Center)

Table 1.
Preliminary Best Track - Hurricane Georges, 15 September - 01 October 1998.
Date/Time(UTC)
Latitude (°N)
Longitude(°W)
Pressure(mb)
Wind Speed(kt) Stage
09/15/1200 9.7 25.1 1009 30 Tropical Depression
1800 9.8 26.5 1009 30 " "
16/0000 10.0 28.1 1009 30 " "
0600 10.3 29.7 1009 30 " "
1200 10.6 31.3 1005 35 Tropical Storm
1800 11.0 32.9 1003 35 " "
17/0000 11.3 34.6 1000 45 " "
0600 11.7 36.3 997 50 " "
1200 12.0 38.1 994 55 " "
1800 12.3 40.0 987 65 Hurricane
18/0000 12.5 42.0 984 70 " "
0600 12.8 43.9 977 80 " "
1200 13.1 45.7 973 85 " "
1800 13.5 47.4 970 90 " "
19/0000 13.9 49.0 970 90 " "
0600 14.4 50.6 965 95 " "
1200 14.9 52.0 954 110 " "
1800 15.4 53.5 949 125 " "
20/0000 15.7 54.9 939 130 " "
0600 16.0 56.3 937 135 " "
1200 16.2 57.7 939 130 " "
1800 16.4 59.2 956 115 " "
21/0000 16.7 60.6 963 100 " "
0600 17.1 62.1 966 100 " "
1200 17.4 63.6 966 95 " "
1800 17.8 65.0 972 90 " "
22/0000 18.2 66.3 970 90 " "
0600 18.0 67.4 972 95 " "
1200 18.2 68.5 964 105 " "

Table 1 (continued).
Preliminary Best Track - Hurricane Georges, 15 September - 01 October 1998.
Date/Time(UTC)
Latitude (°N)
Longitude(°W)
Pressure(mb)
Wind Speed(kt) Stage
22/1800 18.6 69.7 970 95 Hurricane
23/0000 18.8 70.8 980 70 " "
0600 19.0 72.1 990 65 " "
1200 19.3 73.3 996 65 " "
1800 19.8 74.3 994 65 " "
24/0000 20.5 74.9 992 65 " "
0600 20.8 76.0 991 65 " "
1200 21.3 77.2 990 70 " "
1800 21.9 78.0 989 75 " "
25/0000 22.7 79.0 987 80 " "
0600 23.4 80.2 986 85 " "
1200 23.9 81.3 982 90 " "
1800 24.6 82.4 975 90 " "
26/0000 24.8 83.3 974 90 " "
0600 25.2 84.2 975 90 " "
1200 25.7 85.1 974 90 " "
1800 26.2 85.9 975 90 " "
27/0000 27.0 86.5 969 95 " "
0600 27.6 87.2 970 95 " "
1200 28.2 87.8 962 95 " "
1800 28.8 88.3 962 95 " "
28/0000 29.3 88.5 961 95 " "
0600 29.8 88.7 964 90 " "
1200 30.4 88.9 965 90 " "
1800 30.6 88.9 984 65 " "
29/0000 30.6 89.0 986 50 Tropical Storm
0600 30.6 88.4 992 40 " "
1200 31.0 88.1 994 30 Tropical Depression
1800 30.9 87.5 996 30 " "

Table 1 (continued).
Preliminary Best Track - Hurricane Georges, 15 September - 01 October 1998.
Date/Time(UTC)
Latitude (°N)
Longitude(°W)
Pressure(mb)
Wind Speed(kt) Stage
30/0000 30.8 86.9 998 30 Tropical Depression
0600 30.7 86.3 1000 30 " "
1200 30.7 85.4 1002 25 " "
1800 30.6 84.2 1004 25 " "
10/01/0000 30.5 83.0 1006 25 " "
01/0600 30.5 81.8 1008 20 " "
01/1200 Dissipated
20/0600 16.0 56.3 937 135 Minimum Pressure
L a n d f a l l s
21/0430 17.0 61.7 966 100Antigua
3 SM SE of Falmouth
21/0800 17.2 62.6 966 100St. Kitts
8 SM SE of Basseterre
21/2200 18.1 65.8 968 100Puerto Rico
20 SM SW of Fajardo
22/1230 18.2 68.7 962 105
DominicanRepublic
84 SM E of Santo
Domingo
23/2130 20.1 74.5 993 65Cuba
30 SM E of Guantanamo
Bay
25/1530 24.5 81.8 981 90 Key West, Florida
28/1130 30.4 88.9 964 90 Biloxi, Mississippi

Table 2. Hurricane Georges selected surface observations, September 1998.
L o c a t i o n
Pres.
(mb)
Date/
Time
(UTC)
Sust.
Wind
(kt)a
Peak
Gust
(kt)
Date/
Time
(UTC)b
Storm
Surge
(ft)c
Storm
Tide
(ft)d
Total
Rain
(in)
U .S . V irg in I s land s
St. Croix
Hamilton Airport 976.0 64 79 21/184 6.79
Vitema/Hermon Hill 71 81 21/181
Maria Hill 972.2 78 98 21/153@
Jolly Hill 7.41
Estate The Sight/CO-OP 2.63
Annaly/CO-OP Observer 5.30
East Hill/CO-OPObserver 6.20
St. Thomas
Cyril E. King Airport 991.0 66 81 21/203 4.99
Bonne Resolution Gut 6.02
National Park Service Guinea 5.70
Wintberg/CO-OP Observer 2.26
St. John 3.41 USGS Rain Gage 3.41
Coral Bay/CO-OP Observer 2.40
Catherineburg/CO-OP Observer 7.56
P uer to R ico Luis Munoz Marin Intl. Airport 979.7 69 81 21/231 5.26
Roosevelt Roads NS (TJNR) 971.4 76 93 21/225 4.57
Ponce (TJPS) 65 85 22/033
Quebradillas 978.4 78 85 22/024@
Naranjito (Barrio Guadiana Alto) 109 22/004@
Rincon 983.1 87 113 22/044@
Mayaguez Bo Guanajibo 976.9
Cupey Rio Piedras/CO-OP 974.5 9.39
Isabela KP4MYO 89 143 22/061 @
Yabucoa (Courtesy of Sun Oil 65 83 21/214@
USGS Rain Gages
Caguas 28.67
Lago El Guineo / Villalba 24.62
Rio Saliente at Coabey Ne Jayuya 24.30
Rio Portuguez at Tibes 18.46
Quebrada Salvatierra / San 16.93
Rio Grande de Arecibo / Utuado 16.87
Lago Garzas / Adjuntas 13.49
River Espiritu Santo / Rio Grande 13.04
NWS CO-OP Observer Rainfall Jayuya 28.36
Orocovis (Cacao) 23.62
Coamo 22.50
Mayaguez City 21.30
Cayey 20.97
Maricao 18.75
Juana Diaz (Guayabal) 17.35
Ponce 13.83
San Lorenz 12.99
Yauco 9.62
Trujillo Alto 8.33
USGS Storm Surge Estimate - Fajardo 10 #

Table 2 (Continued). Hurricane Georges selected surface observations, September 1998.
L o c a t i o n Pres.
(mb)
Date/
Time
(UTC)
Sust.
Wind
(kts)a
Peak
Gust
(kts)
Date/
Time
(UTC)b
Storm
Surge
(ft)c
Storm
Tide
(ft)d
Total
Rain
(in)
Cuba
Punta Lucrecia 71
Sagua La Grande 80
Cayo Coco 988.0
Guantanamo Bay 60 20/0245 8.98
Limonar 24.41
Bermeja 20.32
Santiago de Cuba 18.54
Nueva 12.44
Ciego de Avila 7.91
Standard NWS ASOS and C-MAN averaging period is 2 min; buoys Date/time is for sustained wind when botha b
are 8 min. sustained and gust are listed.Storm surge is water height above normal astronomical tide level. Storm tide is water height above NGVD. c d
Estimated. Power failed shortly after this observation; e f
Gage failed at 27/1945UTC. a higher value may have occurred.g
Preliminary estimate. Maximum gusts recorded (time unknown) # h
Unofficial observer data. higher gusts may have occurred; @
anemometer height 30 feet AGL.

Table 2 (continued).Hurricane Georges selected surface observations, September 1998.
Location Pres.
(mb)
Date/
Time
(UTC)
Sust.
Wind
(kts)a
Peak
Gust
(kts)
Date/
Time
(UTC)b
Storm
Surge
(ft)c
Storm
Tide
(ft)d
Total
Rain
(in)
Florida Leesburg 1013.3 25/1953 19 31 25/2218 1.19
Sanford 1013.6 25/2055 20 30 25/1834 1.81
Patrick AFB (KCOF) 1013.5 25/1955 15 23 25/1943
Titusville (KTIX) 1011.9 25/1550 20 40 25/1550 1.69
Miami Intl. Airport (KMIA) 33 44 25/1056 0.94
Tamiami Airport 33 57 24/2318
NWSFO MIA/TPC 1.76
Homestead 3.50
Tavernier 8.41
Duck Key 70 84 25/XXXX
Marathon Airport (KMTH) 58 25/1100
Marathon/Monroe EOC 96 25/XXXX
Vaca Key 4-5
Grassy Key 4-5
Cudjoe Key 5-6
Ramrod Key 5-6
Big Pine Key 5-6
Summerland Key 5-6 New Port Richey (RRF) 1011.4 25/1953 20 36 25/2153 1.71
St. Pete/Clearwater (KPIE) 1010.7 25/1953 24 34 25/2117 0.65
St Petersburg (KSPG) 1010.1 25/1953 23 35 25/2331
Tampa Airport (KTPA) 1010.6 25/2056 20 30 25/2116 1.23
McDill AFB (KMCF) 1010.8 25/1955 20 37 25/2100 1.04
Old Port Tampa 11 33 25/2150
Sunshine Skyway 29 33 25/2150
Winter Haven (GIF) 1012.2 25/1953 19 31 25/2146 0.89
Sarasota/Brad Airport (KSRQ) 1009.0 25/1853 29 36 25/1926 2.14
Punta Gorda (PGD) 1009.5 25/2053 30 42 25/1816 0.42
Fort Myers (KFMY) 1008.2 25/1753 31 38 25/1732 0.70
Regional SW Airport (RWS) 1007.7 25/1653 24 37 25/1703
Naples 31 48 25/1855
Inverness (INVF1) 0.46
Ruskin (KTBW) 1.43
Arcadia/Horse CK (ARHF1) 3.02
Levy County 2-4 e
Citrus County 1-3e
Hernando County 2-3e
Pasco County 1e
Pinellas County 2-3e
Hillsborough County 2-3e
Manatee County 3e
Sarasota County 3-4e
Charlotte County 4-5e
Lee County 2-3e
Tallahassee Airport (KTLH) 1003.3 30/0752 24 29 29/2224 6.42
FSU Weather Station 39 26/2129
Standard NWS ASOS and C-MAN averaging period is 2 min; buoys Date/time is for sustained wind when both a b
are 8 min. sustained and gust are listed.Storm surge is water height above normal astronomical tide level. Storm tide is water height above NGVD. c d
Estimated. Power failed shortly after this observation; e f
Gage failed at 27/1945UTC. a higher value may have occurred.g
Preliminary estimate. Maximum gusts recorded (time unknown) # h
Unofficial observer data. higher gusts may have occurred; @
anemometer height 30 feet AGL.

Table 2 (continued).Hurricane Georges selected surface observations, September 1998.
Location Pres.
(mb)
Date/
Time
(UTC)
Sust.
Wind
(kts)a
Peak
Gust
(kts)
Date/
Time
(UTC)b
Storm
Surge
(ft)c
Storm
Tide
(ft)d
Total
Rain
(in)
F lo r id a (con t inued ) Apalachicola (KAQQ) 28 33 29/1311
Panama City Airport (KPAM) 24 37 29/0605
Munson (NE of Milton) 38.46
Bay Minette 29.66
Andalusia 26.90
Milton (CO-OP) 25.06
Milton School 14.62
Milton/Whiting Field (NSE) 992.5 n/a 38 50 28/0240 18.41
Destin (DTS) 999.4 29/2353 33 49 28/0156 6.21
Hurlburt AFB (HRT) 1000.0 29/2200 44 69 29/0216 17.08
Crestview (KCEW) 999.6 29/2253 28 43 28/2005 19.98
Eglin AFB (KVPS) 994.0 29/2300 42 79 28/0642 24.24
Pensacola APT (KPNS) 998.7 29/0953 44 58 28/0321 15.78
Pensacola NAS (KNPA) 997.9 29/0956 40 61 27/2200 12.84
Pensacola EM Office 61 28/0235 Pensacola (TV Station) 26.83
Shell Point Sailboard Club 39 29/2045 St. Teresa Beach 49 29/2225 Pensacola Beach 7.7 Choctawhatchee Bay 5.2
Destin Harbor 5.2 Panama City Beach 5.2
A labam a Mobile Regional Airport (KMOB) 989.9 28/0921 44 55 28/0924 15.02
Mobile Brookley Field (BFM) 989.9 28/0853 47 54 27/2240
Evergreen (GZH) 999.6 29/2041 31* 39* 29/0353 7.67
Fairhope AG. Station 56 28/0709 14.57 Fairhope (CO-OP) 15.82
Grand Bay AG. Station 52 28/1811 Semmes AG. Station 43 28/1836 17.84
Alabama Port 13.66 Atmore Nursery (CO-OP) 15.15 Bay Minette (CO-OP) 29.66 Brewton 14.80
Brewton AG Center 16.34
Brewton (CO-OP) 18.44
Leakesville (CO-OP) 11.44
Niceville 19.53
Alberta (CO-OP) 9.90 Georgiana (CO-OP) 19.15
Jackson (CO-OP) 12.76 Thomasville (CO-OP) 10.20 Whatley (CO-OP) 15.15 Mobile Downtown 13.13 Greenville (CO-OP) 18.15 Andalusia (TV Station) 26.90
Gulf Breeze 26.87 Jay 18.19
Spanish Port 19.86
Camden (CO-OP) 10.77
Gulf Shores 9.0*
Bayou La Batre 8.8*
Downtown Mobile 8.5*
Fort Morgan - Gulf 8.5*
Mobile Bay - Belle Fountaine 8.3*

Table 2 (continued).Hurricane Georges selected surface observations, September 1998.
Location Pres.
(mb)
Date/
Tme
(UTC)
Sust.
Wind
(kts)a
Peak
Gust
(kts)
Date/
Time
(UTC)b
Storm
Surge
(ft)c
Storm
Tide
(ft)d
Total
Rain
(in)
A labam a (con t inued ) Weeks Bay 6.5*
Fort Morgan - Bay 5.8*
Ono Island 5.4*
Dauphin Island - Bay 5.3*
M iss is s ipp i
Gulfport Airport (KGPT) 42 63 28/0931f
Keesler AFB (KBIX) 964.9 28/1055 65 28/0855 9.18 Pascagoula/Trent Lott Airport (KPQL) 36 47 27/2306f
Gulfport Harbor - Harrison County CD 53 69 28/1015 8.1 Gulfport - 1 MI North of Beach (Courtesy of MS Power and Light) 102 n/ah
Gulfport - Harrison County CD 967.2 28/1015 Pascagoula CO-OP Observer 16.68
Ocean Springs 15.68
Vancleave 14.81
Wiggins 13.25
Lyman 9.85
Pass Christian Harbor 6.2 8.79
Pascagoula - Bayou Chico 9.6* Biloxi - Black Bay 8.8*
Gulfport 7.6* Pass Christian 6.4* Bay St. Louis 5.8*
Lou is ian a
New Orleans Intl. Airport (KMSY) 996.6 28/1052 35 46 28/1137f
New Orleans Lakefront APT (KNEW) 994.5 28/0953 39 48 28/0911f
Slidell (KSIL) 31 42 28/0401 0.87 f
Lake Pontchartrain East Lake - Rigolets 37 54 28/0910 5.8
Mid Lake - Pontchartrain Causeway 42 59* 28/1020 4.7
West Lake - Frenier 33* 45 28/0110 4.7
North Lake - Mandeville 21 42 28/0840
New Orleans Audubon Park 0.88
Slidell CO-OP Observer 1.48
Covington CO-OP Observer 1.11
Bogalusa CO-OP Observer 2.98
West End Marina 5.3
Industrial Canal 7.3
North End Causeway 4.3
Lake Borgne
Bayou Bienvenu 7.4
Bayou Dupre 6.4
Plaquemines Parish - East Side
NE Gardene Bay (13 MI ESE of Pointe A La Hache) 8.9f
Standard NWS ASOS and C-MAN averaging period is 2 min; buoys Date/time is for sustained wind when both a b
are 8 min. sustained and gust are listed.Storm surge is water height above normal astronomical tide level. Storm tide is water height above NGVD. c d
Estimated. Power failed shortly after this observation; e f
Gage failed at 27/1945UTC. a higher value may have occurred.g
Preliminary estimate. Maximum gusts recorded (time unknown) # h
Unofficial observer data. higher gusts may have occurred; @
* - U.S. Army Corps of Engineers Data (Mobile District) anemometer height 30 feet AGL.

Table 3.
Hurricane Georges selected amateur radio surface weather reports, September 1998.
REPORTINGSTATION
CALL SIGN
LOCATION DATE/TIME
(UTC)
PRESSURE
(mb)
SUSTAINED WIND (MPH)
PEAK WIND (MPH)
W. Resto Cayey PR-18.1N/66.15W 21/2300 17 51
KRRF PR/18.4N 66.9W 22/0300 1008.5 80-90 80-90
KP4SC Puerto Rico/Ponce 21/0020 60+ 60+
WP4MTG Puerto Rico/Fajardo 21/2340 113 113
WP4MZA Puerto Rico/Fajardo CD 21/2115 110* 125-130*
21/2130 110* 117-130*
21/2140 80* 110*
KP4RF Puerto Rico/Carilina 21/2230 42* 62*
21/2230 55* 93*
K4FCZ Vieques Isl/18.1N56.2W 21/1449 1009.1 30-40 30-40
21/2000 974.6 Over 100
21/2020 967.8 35-40 50
N5NG Culebra Island 21/1739 58-69
21/2238 998.0 58 69
N2PB St. Croix 21/1109 1008.8 20-35 42
21/1145 1007.1 20-35 42
21/XXXX 1006.4 45
21/1316 1005.4 35-50
21/1502 990.2 55-60
21/1528 981.4 50-60 90
NP2L St. John 21/1303 1007.5 20-35 43
21/1400 1004.9 48* 54*
21/1615 996.8 90 143
21/XXXX 1001.3 74-76 85
VP2VQN Tortolla Island 21/1200 40-45
8R1BB/NP2 St. Thomas 21/1237 35+ 60+
KV4FZ St. Croix EOC 21/0107 1013.2
21/1033 1011.5 58
21/1424 46 63
21/1452 46 81
21/1800 58 104
* - measured

Table 4.
Hurricane Georges selected National Buoy Data Center (NBDC) observations, September1998.
L o c a t i o nPress(mb)
Date/ Time (UTC)
Sust.Wind (kt)a
PeakGust(kt)
Date/Time
(UTC)b
Significant Wave Height (FT)
CMAN Stations
Lake Worth, FL (LKWF1) 1010.0 25/1100 30 35 25/1400
Fowey Rocks, FL (FWYF1) 1006.3 25/1000 45 52 25/1000
Molasses Reef, FL ( MLRF1) 1003.1 25/0800 46 53 25/1400
Long Key, FL (LONF1) 1000.0 25/1000 47 58 25/1400
Sombrero Key, FL (SMKF1) 994.5 25/1300 81 92 25/1500
Sand Key, FL (SANF1) 990.5 25/1300 56 71 25/1400c
Dry Tortugas, FL (DRYF1) 976.3 25/2000 59 68 26/0000
Venice, FL (VENF1) 1011.6 30/0900 24 27 30/1800
Keaton Beach, FL (KTNF1) 1005.4 30/0900 30 37 29/2300
Cedar Key, FL (CDRF1) 1007.2 30/1000 29 34 30/0500
Cape San Blas, FL (CSBF1) 1003.2 30/0800 38 43 29/1900
Dauphin Island, AL (DPIA1) 987.0 28/0800 59 71 28/0600
Grand Isle, LA (GDIL1) 997.3 28/0100 40 50 27/2000
Southwest Pass, LA (BURL1) 989.1 27/2200 54 63 27/2200
NOAA Buoys
42003 (25.9N / 89.9W) 983.2 26/1800 51 66 26/2000 23.5
42039 (28.8N / 86.0W) 1002.6 27/0700 43 56 27/0300 22.5
42036 (28.5N / 84.5W) 1009.2 27/0100 34 48 26/1800 17.4
42040 (29.2N / 88.3W) 963.4 27/2300 54 68 27/1900 35.7
42007 (30.1N / 88.8W) 983.5 28/0400 44 54 27/2100 16.0 c c c c
NDBC Buoy
41522 (14.3N/58.7W) 35 20/1852
34-Knot Ship Reports
PJPS (13.3N / 67.0W) 1011.0 19/1800 35 19/1800 6.6
WFLG (19.5N / 66.4W) 1015.0 22/0900 38 22/0900 13.1
DHPK (23.3N / 71.9W) 1009.0 23/0600 35 23/0600 9.8
FNZP (24.0N / 87.8W) 1009.4 27/0600 43 27/0600 3.3
LAVD4 (29.1N / 87.0W) 1004.5 29/0600 37 29/0600 9.8
PJKP (29.3N / 85.7W) 1002.9 29/1500 44 29/1500 9.8
C6JN (29.4N / 87.8W) 1002.1 29/1800 35 29/1800 13.1
PFEI (27.7N / 85.1W) 1006.4 30/1200 39 30/1200 6.6
Standard NWS C-MAN averaging period is 2 min; buoys are 8 min.a
Date/time is for sustained wind when both sustained and gust are listed.b
Buoy failed shortly after this observation; a lower pressure and a higher wind and wave height may have occurred. C

Table 5.
Deaths and insured damage estimates associated with Hurricane Georges. Death figures basedon reports from respective governments and/or media sources. United States damage estimatescourtesy of the American Insurance Services Group/PCS Division.
Damage Estimate L O C A T I O N Deaths ($ Billions)
Antigua 2
St. Kitts and Nevis 4 0.402@
U.S.Virgin Islands 0 0.050
Puerto Rico 0 1.750
Dominican Republic 380* >1.0@
Haiti 209*
Bahamas 1
Cuba 6
United States (Mainland)
Florida 0 0.340
Mississippi 0 0.665
Alabama 1 0.125
Louisiana 0 0.025
United States Total 1 2.955
Storm Total 602
* - These are the best estimates received to-date; subject to revision at a later date.
- Estimates from media reports - no official figures have been received. @

Table 6.
Preliminary track forecast evaluation of Hurricane Georges - heterogeneous sample. Errors in nautical miles for tropical storm and hurricane stageswith number of forecasts in parenthesis. Numbers in italics represent forecasts which were better than the official forecast.
Forecast Technique
Period (hours)
12 24 36 48 72
CLIP 30 (50) 56 (48) 85 (46) 112 (44) 169 (40)
GFDI 32 (50) 60 (48) 76 (46) 95 (44) 148 (40)
GFDL* 32 (50) 60 (48) 77 (46) 92 (44) 135 (40)
LBAR 25 (50) 45 (48) 64 (46) 90 (44) 140 (40)
AVNI 41 (36) 74 (34) 115 (32) 170 (28) 358 (24)
AVNO* 81 (40) 97 (38) 119 (36) 149 (32) 277 (28)
BAMD 34 (50) 67 (48) 104 (46) 147 (44) 242 (40)
BAMM 37 (50) 74 (48) 113 (46) 154 (44) 245 (40)
BAMS 58 (50) 108 (48) 159 (46) 211 (44) 307 (40)
NGPI 28 (42) 52 (41) 86 (40) 118 (39) 181 (37)
NGPS* 34 (22) 39 (21) 60 (20) 91 (20) 152 (19)
UKMI 36 (47) 71 (45) 98 (42) 128 (38) 178 (34)
UKM* 31 (24) 58 (23) 89 (22) 121 (20) 166 (18)
A90E 30 (50) 62 (48) 105 (46) 159 (44) 220 (40)
A98E 30 (50) 62 (48) 105 (46) 169 (44) 254 (40)
A9UK 31 (22) 53 (21) 72 (20) 89 (20) 129 (18)
EMX 70 (10) 84 (9) 125 (9)
NHC Official 28 (50) 49 (48) 71 (46) 87 (44) 117 (40)
NHC Official 10-Year Average(1988-1997)
47(1838)
88 (1633)
127(1449)
165 (1284) 248 (1006)
* - Output from these models was unavailable at time of forecast issuance.

Table 7.
Mean absolute intensity forecast errors for Hurricane Georges - homogeneous sample.Number in parenthesis below 10-Year averages is the number of cases.
Forecast Technique
Period (hours)
12 24 36 48 72
SHIPS 8.9 (-0.1) 14.7 (0.8) 18.6 (1.3) 20.6 (2.8) 25.5 (6.1)
GFDI 11.0 (-6.2) 15.1 (-3.1) 17.8 (-2.1) 19.7 (-3.0) 24.0 (-8.2)
GFDL* 20.4 (-19.7) 18.5 (-16.8) 18.2 (-13.7) 18.5 (-13.6) 22.7 (-16.2)
SHFR 10.3 (0.8) 17.7 (0.9) 22.3 (-1.2) 25.2 (-3.2) 28.4 (-6.0)
NHC Official 7.2 (0.2) 13.1 (1.5) 15.9 (3.9) 18.3 (7.4) 25.3 (3.8)
Number of Cases 50 48 46 44 40
NHC Official 10-YearAverage (1988-1997)
7.0 (-1.5)
(1905)
12.0 (-2.3)
(1724)
15.9 (-3.8)
(1548)
18.5 (-5.2)
(1373)
21.4 (-5.8)
(1062)
* - Output from this model is unavailable at time of forecast issuance.

Table 8. Watch and warning summary, Hurricane Georges, September 1998.
Date/Time
(UTC)
Action
Location
18/2100 Hurricane Watch Issued St. Lucia to Anguilla including Saba and St. Maarten.
19/1500 Hurricane Watch ExtendedNorth/East
St. Lucia northward and then northwestward to theBritish/U.S. Virgin Islands
19/2100 Hurricane Warning Issued Dominica northward to Anguilla except St. Barthelemy andthe French portion of St. Martin.
19/2100 Hurricane Watch Issued Puerto Rico
20/0300 Tropical Storm Warning St. Lucia and Martinique
20/0900 Hurricane Warning extendedwestward
Dominica north and west to Puerto Rico
20/2100 Hurricane Watch Issued Dominican Republic
21/0900 Hurricane Warning extendedwestward
Dominica north and west to the Dominican Republic
21/0900 Tropical Storm Warning andHurricane Watchdiscontinued
Martinique to St. Lucia
21/1500 Hurricane Watch extendednorth and west
North coast of Haiti from St. Nicolas to the border of theDominican Republic / Southeast Bahamas, the Turks andCaicos Islands.
21/1500 Hurricane Warningdiscontinued
All islands east of the Virgin Islands except Antigua,Barbuda, and the French Islands of St. Barthelemy and St.Martin.
21/1500 Hurricane Warningdiscontinued
Antigua, Barbuda, and the French Islands of St. Barthelemyand St. Martin.
21/1900 Hurricane Watch Issued Eastern Cuba from the Province o f Las Tunas toGuantanamo
22/0300 Hurricane Warning extendedwestward
U.S. & British Islands, Puerto Rico, Dominican Republic,Haiti, the Southeast Bahamas, the Turks and CaicosIslands.
22/0900 Hurricane Warningdiscontinued
U.S. & British Virgin Islands
22/1500 Hurricane Warning Issued Eastern Cuba from the Province of Las Tunas toGuantanamo, the Central Bahamas from Acklins to CatIsland
22/1500 Hurricane Watch Issued Eastern Cuba for the Provinces of Camaguey to SanctiSpiritus
22/1500 Hurricane Warningdiscontinued
Puerto Rico
23/0900 Hurricane Warning Issued Eastern Cuba for the Provinces of Camaguey to SanctiSpiritus / Central Bahamas.
23/0900 Hurricane Watch Issued South Florida from Deerfield Beach southward on the eastcoast...and fromsouth of Bonita Beach on the west coastincluding the Florida Keys.
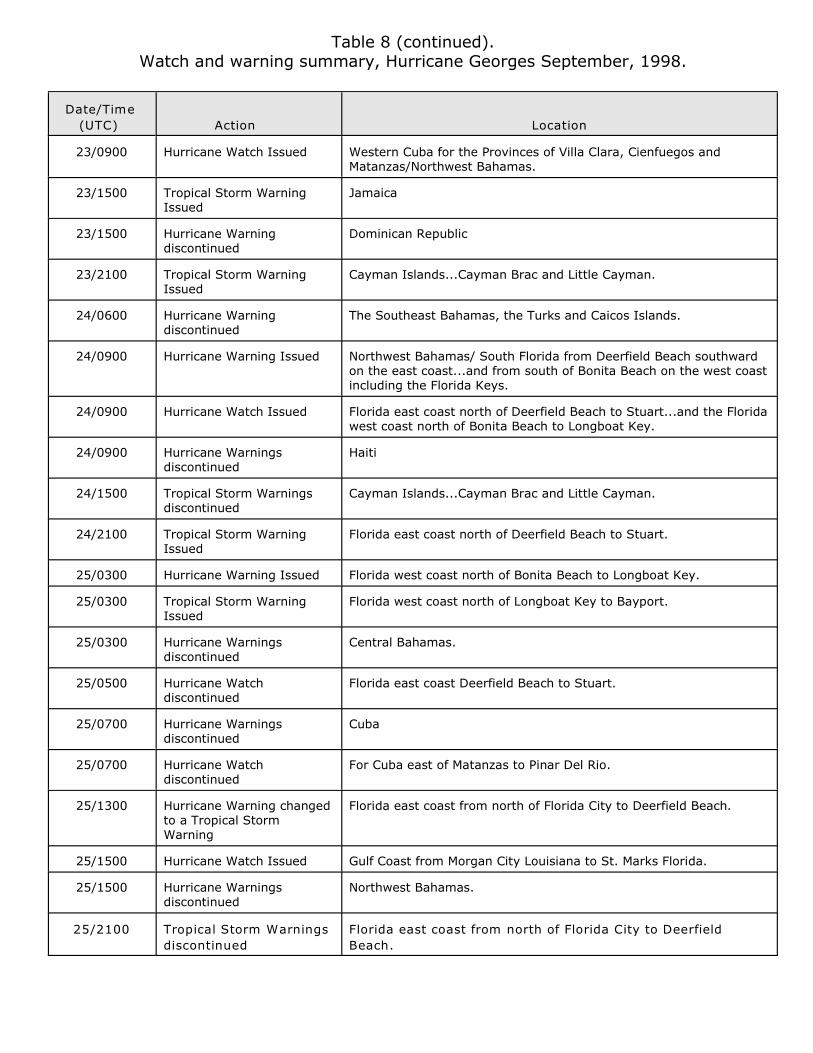
Table 8 (continued).Watch and warning summary, Hurricane Georges September, 1998.
Date/Time
(UTC)
Action
Location
23/0900 Hurricane Watch Issued Western Cuba for the Provinces of Villa Clara, Cienfuegos andMatanzas/Northwest Bahamas.
23/1500 Tropical Storm WarningIssued
Jamaica
23/1500 Hurricane Warningdiscontinued
Dominican Republic
23/2100 Tropical Storm WarningIssued
Cayman Islands...Cayman Brac and Little Cayman.
24/0600 Hurricane Warningdiscontinued
The Southeast Bahamas, the Turks and Caicos Islands.
24/0900 Hurricane Warning Issued Northwest Bahamas/ South Florida from Deerfield Beach southwardon the east coast...and from south of Bonita Beach on the west coastincluding the Florida Keys.
24/0900 Hurricane Watch Issued Florida east coast north of Deerfield Beach to Stuart...and the Floridawest coast north of Bonita Beach to Longboat Key.
24/0900 Hurricane Warningsdiscontinued
Haiti
24/1500 Tropical Storm Warningsdiscontinued
Cayman Islands...Cayman Brac and Little Cayman.
24/2100 Tropical Storm WarningIssued
Florida east coast north of Deerfield Beach to Stuart.
25/0300 Hurricane Warning Issued Florida west coast north of Bonita Beach to Longboat Key.
25/0300 Tropical Storm WarningIssued
Florida west coast north of Longboat Key to Bayport.
25/0300 Hurricane Warningsdiscontinued
Central Bahamas.
25/0500 Hurricane Watchdiscontinued
Florida east coast Deerfield Beach to Stuart.
25/0700 Hurricane Warningsdiscontinued
Cuba
25/0700 Hurricane Watchdiscontinued
For Cuba east of Matanzas to Pinar Del Rio.
25/1300 Hurricane Warning changedto a Tropical StormWarning
Florida east coast from north of Florida City to Deerfield Beach.
25/1500 Hurricane Watch Issued Gulf Coast from Morgan City Louisiana to St. Marks Florida.
25/1500 Hurricane Warningsdiscontinued
Northwest Bahamas.
25/2100 Tropical Storm Warnings
discontinued
Florida east coast from north of Florida City to Deerfield
Beach.

Table 8 (continued). Watch and warning summary, Hurricane Georges, September 1998.
Date/Time
(UTC)
Action
Location
25/2100 Hurricane Warningsdiscontinued
Florida east coast south of Florida City to Key Largo.
26/0300 Hurricane Warning changedto a Tropical Storm Warning
Florida Keys south of Key Largo and Florida west coast south ofBayport.
26/0300 Hurricane Watch discontinued For Cuba east of Matanzas to Pinar Del Rio.
26/0900 Tropical Storm Warningsdiscontinued
Florida west coast from Longboat Key to Bayport.
26/1200 Tropical Storm Warningsdiscontinued
Florida Keys south of Key Largo and the Florida west coastsouth of Longboat Key
26/1500 Hurricane Warning Issued Morgan City, Louisiana to Panama City, Florida.
26/1500 Tropical Storm Warning and aHurricane Watch
Panama City, Florida to St. Marks, Florida.
26/1500 Hurricane Watch Morgan City, Louisiana to Intracoastal City, Louisiana.
27/2100 Hurricane Watch discontinued Panama City, Florida to St. Marks, Florida.
28/0300 Hurricane Watch discontinued Morgan City, Louisiana to Intracoastal City, Louisiana.
28/1500 Hurricane Warningdiscontinued
Destin, Florida to Panama City, Florida.
28/1500 Tropical storm Warningdiscontinued
Panama City, Florida to St. Marks, Florida.
28/1500 Hurricane Warning changedto a Tropical Storm Warning
Grand Isle, Louisiana to Morgan City, Louisiana.
28/2100 Hurricane Warning changedto a Tropical Storm Warning
Grand Isle, Louisiana to Destin, Florida
28/2100 Tropical Storm Warningdiscontinued
Grand Isle, Louisiana to Morgan City Louisiana.
29/0300 Tropical Storm Warningdiscontinued
Grand Isle, Louisiana to the Mouth of the Mississippi River,Louisiana.
29/0900 Tropical Storm Warningdiscontinued
Mouth of the Mississippi River to Pascagoula, Mississippi.
29/1500 Tropical Storm Warningsdiscontinued
Pascagoula, Mississippi to Destin, Florida.