preliminary feasibility study - unescap.org · 11.2 lfg from bantan future landfills 16 11.3...
TRANSCRIPT

Preliminary Feasibility Study
Sustainable Sanitary Landfill to Energy System
(SSLTES)
Bantan Landfill / Thailand & Tanjung Pinang Landfill / Indonesia
Prayuth Thanomboon, February 2015

2
1. Executive Summary
GIZ is implementing a project called “Integrated Resource Management in Asian Cities: the Urban Nexus” or “GIZ Nexus”. The project is commissioned by German Federal Ministry for Economic Cooperation and Development (BMZ). The political partner of the project is United Nations Economic and Social Commission for Asia and Pacific (UN ESCAP) and the implementation partner is ICLEI SEAS. As a regional project, GIZ Nexus partners with six countries and ten cities as follows:
- Ulan Bator (1,200,000 inhabitants), Mongolia;
- Rizhao (2,880,000 inhabitants) China,
- Weifang/Binhai Development Zone (9,000,000/ 150,000 inhabitants), China;
- Korat (150,000 inhabitants) Thailand,
- Chiang Mai (150,000 inhabitants), Thailand;
- Da Nang (770,000 inhabitants), Vietnam;
- Pekanbaru (1.000.000 inhabitants) Indonesia;
- Tanjung Pinang (230.000 inhabitants) Indonesia;
- Naga City (180,000 inhabitants) Philippines,
- Santa Rosa, (330,000 inhabitants) Philippines.
GIZ Nexus focus is on the topics of secure water supply and sanitation systems, energy security and efficiency, land use, physical planning and food security. Moreover, knowledge and experience sharing and cooperation between public, private and civil-society stakeholders is essential. Strategically, the project focuses on two core elements. On the one hand, it will be key to identifying and developing nexus initiatives that will demonstrate in an exemplary way how to integrate the nexus approach into urban planning and development processes. On the other hand, the regional exchange and dissemination of successful practical approaches to integrated resource management is undertaken through efficient networking.
Partnering with Chiangmai Municipality, GIZ Nexus team explored solid waste management practices of the city and had the opportunity to visit Bantan Sanitary Landfill in September 2014. It was found that the private company contracted by Chiangmai Municipality to manage the city’s municipality solid waste - applied an appropriate technology for landfill gas collection and electricity production (waste-to-energy) at Bantan Sanitary Landfill. Not only the technology is able to reduce the amount of methane gas and odor being released into the atmosphere, but it also produces electricity from methane gas. The electricity is then sold to the central grid – yielding a profitable (eco/green) business model. Additionally, the waste heat from electricity production is used for drying fruits and other agricultural produce, which are sold to markets such as China.
GIZ Nexus, therefore, initiated a peer to peer learning platform, using Bantan Sanitary Landfill (waste-to-energy) as the model for the project’s partner cities to learn the technology and perhaps apply it to improve their respective solid waste management models. In October 2014, municipality officers from Santa Rosa (Philippines), Naga City (Philippines), Pekanbaru (Indonesia), Tanjung Pinang (Indonesia), and Danang (Vietnam) were invited to visit Bantan Sanitary Landfill.
Tanjung Pinang expressed their interest in the technology and requested the expert, Mr. Prayuth Thanomboon, who designed and operates Bantan Sanitary Landfill, to do a study on Tanjung Pinang’s sanitary landfill (TPA) and provide recommendations for the improvement of the TPA landfill. The study was done in December 2014.
This report details Bantan Sanitary Landfill and the appropriate technology, as well as the findings of the Tanjung Pinang TPA landfill study and recommendations for improvement.
3
Table of Contents 1. Executive Summary .......................................................................................................... 2 2. List of Tables .................................................................................................................... 4 3. List of Figures ................................................................................................................... 4 4. List of Acronyms ............................................................................................................... 5 5. Definitions ........................................................................................................................ 5 6. Introduction....................................................................................................................... 6 7. Bantan Sanitary Landfill Background ................................................................................ 6 8. Sustainable Sanitary Landfill to Energy (SSLTES)............................................................ 9 9. Landfill Gas (LFG) Estimation Methodology.................................................................... 11 10. Landfill Gas Collection .................................................................................................... 11 11. Landfill Gas Estimation for Investment Analysis at Bantan Sanitary Landfill ................... 12
11.1 LFG from Bantan Existing Landfill 13 11.2 LFG from Bantan Future Landfills 16 11.3 Estimation of Biogas collection from Leachate 18 11.4 LFG Utilization Potentials 18
12. LFG to Electricity Process .............................................................................................. 21 12.1 Bantan’s Phases of Electricity Production from LFG 21
13. Leachate Utilization ........................................................................................................ 22 14. Analysis of Investment for electricity production of 1 MWh ............................................. 23 15. Waste Dumping Methodology and its effect on LFG collection ....................................... 26 16. Design and Construction of SSLTES .............................................................................. 27
16.1 Sanitary Landfill 27 16.1.1 Sanitary Landfill 27 16.1.2 LFG Recovery 27 16.1.3 Landfill Rehabilitation 28
17. Tanjung Pinang Landfill .................................................................................................. 31 17.1 Existing Landfill 31
18. Converting Tanjung Pinang TPA Landfill into a Sustainable Landfill (SSLTES) .............. 33 19. Landfill Gas Estimation for TPA Landfill .......................................................................... 34
19.1 LFG Estimation Tanjung Pinang Landfill (Existing Cells) 34 19.2 Estimation of LFG from the future landfills cells (SSLTES type, Cell 5 to Cell 15) 36 19.3 Estimation of Biogas Collection from Leachate 38 19.3.1 Leachate and Biogas from existing cells (cell 1 to 4) 38 19.3.2 Estimation of Leachate and Biogas from new SSLTES cells (Cell 5 to 15) 39 19.3.3 LFG Utilization Potentials in Tanjung Pinang TPA Landfill 40
20. Utilization of LFG to produce Compressed Bio-methane Gas (CBG) .............................. 42 20.1 Using CBG for activities at the TPA landfill 42 20.2 Investment Analysis for CBG Production 43
21. Utilization of LFG to produce Electricity .......................................................................... 45 22. Pre-requisite Investments ............................................................................................... 47
a. Collection Piping Network (Cell3 – Cell4) 47 b. Landfill preparation according SSLTES concept (Cell 5 – Cell 15) 47 c. Investment cost for leachate collection and treatment 49
23. Summary and Recommendation of investment for Tanjung Pinang TPA landfill ............. 49 24. Conclusion ..................................................................................................................... 50
24.1 Lack of budget for Solid Waste Management 50 24.2 Odor and Insects problems 50 24.3 Landfill space limitation 50 24.4 Electricity Shortage 51 24.5 Leachate Disposal 51 24.6 Release of Greenhouse Gas (Methane Gas) 51 24.7 Unhealthy working environment for waste segregators 51 24.8 Jobs creation for the locals 51

4
24.9 Improvement of Tanjung Pinang city image 51 24.10 Concerns for future generations 52 24.11 Application of SSLTES 52 24.12 PPP (Public Private Partnership) Option 52
25. Appendix A ..................................................................................................................... 53
2. List of Tables
Table 11.1 Bantan Sanitary Landfill History in 2009 ............................................................................. 13 Table 13.1 Treated Leachate from Anaerobic Digester ........................................................................ 23 Table 14.1 Analysis of Investment for electricity production of 1 MWh from LFG at Bantan Landfill ... 25 Table 20.1 6 tons per day CBG Production Plant Investment and Payback Period in Tanjung Pinang 44 Table 21.1 Investment analysis for 1 MWh Landfill Gas to Electricity Project in Tanjung Pinang ........ 46 Table 22.1 SSLTES Investment Cost .................................................................................................... 47 Table 22.2 LFG Collection System Investment Cost ............................................................................ 48 Table 22.3 Leachate Treatment Plant Investment Cost ........................................................................ 49 Table 23.1 Investment Recommendation for LFG to Electricity ............................................................ 49 Table 23.2 Investment Recomendation For LFG to CBG ..................................................................... 50 Table 24.1 Precipitation Amount in Bintan Island.................................................................................. 53 Table 24.2 Surface runoff Coefficients .................................................................................................. 53 Table 24.3 Infiltration Coefficient ........................................................................................................... 54 Table 24.4 The Amount of Leachate Calculation .................................................................................. 55 Table 24.5 Leachate Organic Compound VS Increasing Landfill Ages ................................................ 56
3. List of Figures
Figure 7.1 Bantan Sanitary Landfill to Energy in 2014 ............................................................................ 8 Figure 8.1 Sustainble Sanitary Landfill to Energy System Concept Diagram ....................................... 10 Figure 10.1 LFG and Biogas Collection System (Red Line) ................................................................. 12 Figure 11.1 Bantan Sanitary Landfill History in 2009 ............................................................................ 13 Figure 11.2 LFG Production and Recovery in Bantan Sanitary Landfill Existing Landfill in 2009......... 15 Figure 11.3 Estimation LFG production and collection from new landfill cells (Cell 6 to Cell 15) ......... 17 Figure 11.4 LFG Collection Potential in Bantan Sanitary Landfill ......................................................... 20 Figure 12.1 LFG to Electricity Process .................................................................................................. 21 Figure 13.1 Bantan Sanitary Landfill Leacahte Treatment Plant .......................................................... 22 Figure 13.2 Treated Leachate to Fertilizer Testing ............................................................................... 23 Figure 15.1 Bantan Sanitary Landfill History in 2014 ............................................................................ 26 Figure 16.1 SSLTES Construction Steps .............................................................................................. 28 Figure 16.2 Laying MSW on slope decline from the top to the lower .................................................... 30 Figure 16.3 Temporary Covering Landfill Slope with Plastic Sheet ...................................................... 30 Figure 17.1 Tanjung Pinang Existing Landfill ........................................................................................ 31 Figure 17.2 Figure Landfill Cell1 in Zone1 ............................................................................................ 32 Figure 17.3 Landfill Cell2 in Zone2 Figure 17.4 Landfill Cell3 in Zone3 ............................................... 32 Figure 17.5 Landfill Cell4 in Zone4........................................................................................................ 32 Figure 17.6 Historical Data of Tanjung Pinang Landfill ......................................................................... 32 Figure 18.1 SSLTES Preliminary Master Plan Design for Tanjung Pinang Landfill .............................. 33 Figure 18.2 SSLTES Preliminary Cross Section Design for Tanjung Pinang Landfill .......................... 34 Figure 19.1 Estimation of LFG Production in Tanjung Pinang Existing Landfill .................................... 35 Figure 20.1 LFG to CBG Process ......................................................................................................... 42

5
4. List of Acronyms
AD = Anaerobic Digester
CBG = Compress Bio-methane Gas
CDM = Clean Development Mechanism
ERDI = Energy Research and Development Institute, Chiang Mai University
FIRR = Financial Internal Rate of Return
LFG = Landfill Gas
m2 = Square meter
m3 = Cubic meter
MSW = Municipal Solid Waste
MWh = Megawatt hour
NGV = Natural Gas for Vehicles
Nm3/h = normal cubic meter per hour
PEA = Provincial Electricity Authority
RDF = Refuse-derived fuel
SSLTES = Sustainable Sanitary Landfill To Energy System
VSPP = Very Small Power Producers
5. Definitions
Anaerobic – Absence of oxygen
Biogas - A mixture of methane and carbon dioxide produced by bacterial
degradation of organic matter and used as a fuel
Flow rate – Rate at which the landfill gas is pulled or passively vented out of the
Leachate – Water that has picked up environmentally harmful substances after
passing through landfill matter

6
6. Introduction
Most Southeast Asian countries have tropical climates with high levels of precipitation and humidity. High amounts of precipitation add a large quantity of moisture to the municipal solid waste (MSW) and increase the total weight of the waste. The organic portion of the MSW tends to decompose quickly due to the hot and humid conditions and poses problems in handling and disposing of MSW. Open dumping will cause problems with regards to odor, insects, leachate, air pollution from burning waste, and the anaerobic decay of organic matters. The anaerobic decay of organic matters will release methane gas, a greenhouse gas, into the atmosphere. Methane gas is 21 times more harmful to the atmosphere than carbon dioxide.
The idea of using incineration plants to dispose the MSW has been proposed as one of the alternatives to Open Dumping sites. However, incineration technology is not appropriate due to high humidity in the MSW of South Asian Countries, and therefore burning the waste will demand high amount of energy – proving to be a counter-productive solid waste disposal process.
Sanitary Landfill to Energy concept will allow for a better control of the landfill affects to the environment than the open dumping site and the technology is more appropriate than incineration. GIZ Nexus therefore has chosen Bantan Sanitary Landfill, Chiangmai, Thailand, which successfully applies the Sanitary Landfill to Energy concept, to be the model for case studies and dissemination for the project’s partner countries in the Southeast Asia region.
Bantan Sanitary Landfill was established in 1998 and was changed to a Sanitary landfill to Energy Model in 2007. Currently, the energy from Landfill Gas (LFG) can be used to generate approximately 2 MWh of electricity and is expected to increase to 3 MWh by 2016. In 2014, a plant to dry agricultural produce was set up and the waste heat from the electricity generation process was used for drying fruits. In 2015, a concept was developed with the aim to create sustainability for municipal solid waste management process. The concept principle is to be able to retrieve byproducts from every step of waste disposal/treatment and create value for those byproducts. At the final step of this concept, the old landfills (have been closed for 15 to 20 years), can be rehabilitated and reused, thereby eliminating the problem of space limitation. The concept is called “Sustainable Sanitary Landfill to Energy System” (SSLTES, the concept will be elaborated in section 8).1
Although the current method of Bantan Sanitary Landfill is not yet a complete waste management system, in accordance with the SSLTES guidelines, there are activities from the landfill and energy production that can be used as a model to study the gaps and opportunities for mixed (no separation at source) solid waste management in tropical countries.
7. Bantan Sanitary Landfill Background
In 1997, overflowing garbage in the Municipality of Chiangmai in Thailand was a critical issue. Mr. Sriret Kotkhamlue, the leader of a community within Chiangmai province at that time, volunteered to help solve the waste disposal problem. He visited many sites to study waste disposal methods in countries such as Germany and South Korea. These site visits provided him knowledge about waste disposal, building power plants from Landfill Gas (LFG), as well as the difficulties of waste management in practice. Mr. Sriret Kotkhamlue is knowledgeable about his locality and has strong knowledge of wind direction and geography. He used his expertise and knowledge from the field trips as well as a feasibility study on waste to landfills to build his
1 Sustainable Sanitary Landfill to Energy System (SSLTES) is a sanitary landfill concept designed in 2014
by Mr. Prayuth Thanomboon, engineer and operator of Bantan Sanitary landfill, with the intention to reduce the complexity of simultaneous management of garbage dumping and gas pipe installation in the same landfill cell. Additionally, the SSLTES concept also introduces landfill rehabilitation (re -use of cells and value creation of waste)

7
own landfill according to sanitation principles2 available area, and environmental settings - on his land of 1500 rai (currently 2000 rai) (1 rai = 0.4 acres). The landfill was officially set up on
October 6, 1998 in Bantan village, Hod District, in the province of Chiangmai3.
The waste management system at Bantan landfill can control its impact to the environmental well, such that there has been no complaints from nearby communities. There is constant process improvement to ensure the quality of the waste management system. Moreover, the Bantan landfill project consistently supports the neighboring communities who might be affected by the environmental impacts. As a result, Bantan landfill project continues to provide benefits to the society and has today become a sustainable project.
In 2007, the government of Thailand promoted the Clean Development Mechanism (CDM) in the country and also supported the purchase of electricity from renewable energy from the very small power producer (VSPP) project. Mr. Sriret Kotkhamlue realized the opportunity to further develop his landfills and established the company, Tha Chiang Thong, to develop electricity generation projects using LFG as fuel. These projects can help to reduce odors from waste landfills as well as mitigate greenhouse gas emissions and address energy concerns of the country.
In 2009, the company designed and constructed a power plant from landfill gas with a generation capacity of 1 MWh. The project started to sell electricity to the Provincial Electricity Authority (PEA) within nine months after the installation. In 2012, the power plant expanded and an additional 1 MWh of electricity was generated. The power plant also set up a facility for drying crops by using thermal energy from the electricity generation process to dry crops at a capacity of 30 tons per day. Shown in Figure 7.1
2 Thailand Council of Engineer: Code of Practice: Design and Operation of Solid Waste Disposal using
Sanitary Landfill, http://www.coe.or.th/_coe/_product/20100608163332-2.pdf
3 Sriret Kotkhamlue (2003). The satisfaction of waste landfill management of Tanet construction company: Specific site at Moo 7 Maeyui village, Bantan, Hod city, Chiangmai province. Naresuan university pp.8

8
Figure 7.1 Bantan Sanitary Landfill to Energy in 2014
Balloon Gas Holder
Drying Factory
Bantan Sanitary Landfill
Suction Station & Bio-Filter
Waste Heat Recovery System
Balloon Gas Holder
Two Power Plants, each producing 1 MWh
Suction Station & Bio-Filter
9
9
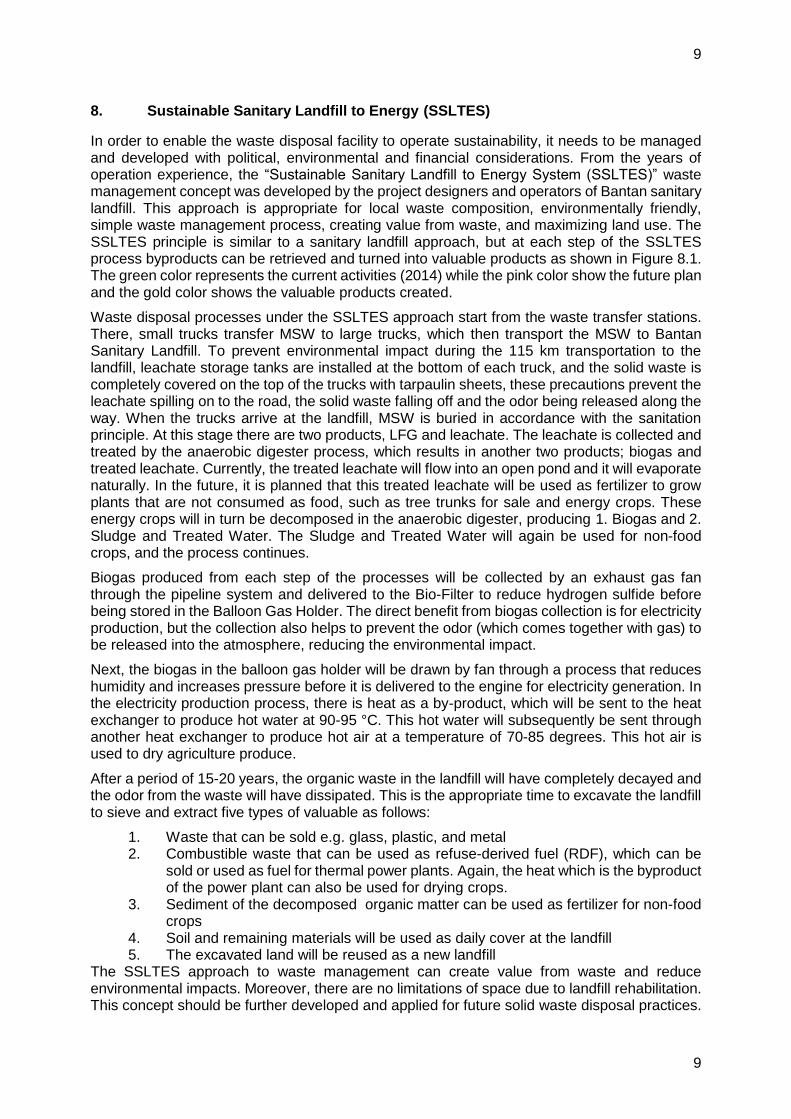
8. Sustainable Sanitary Landfill to Energy (SSLTES)
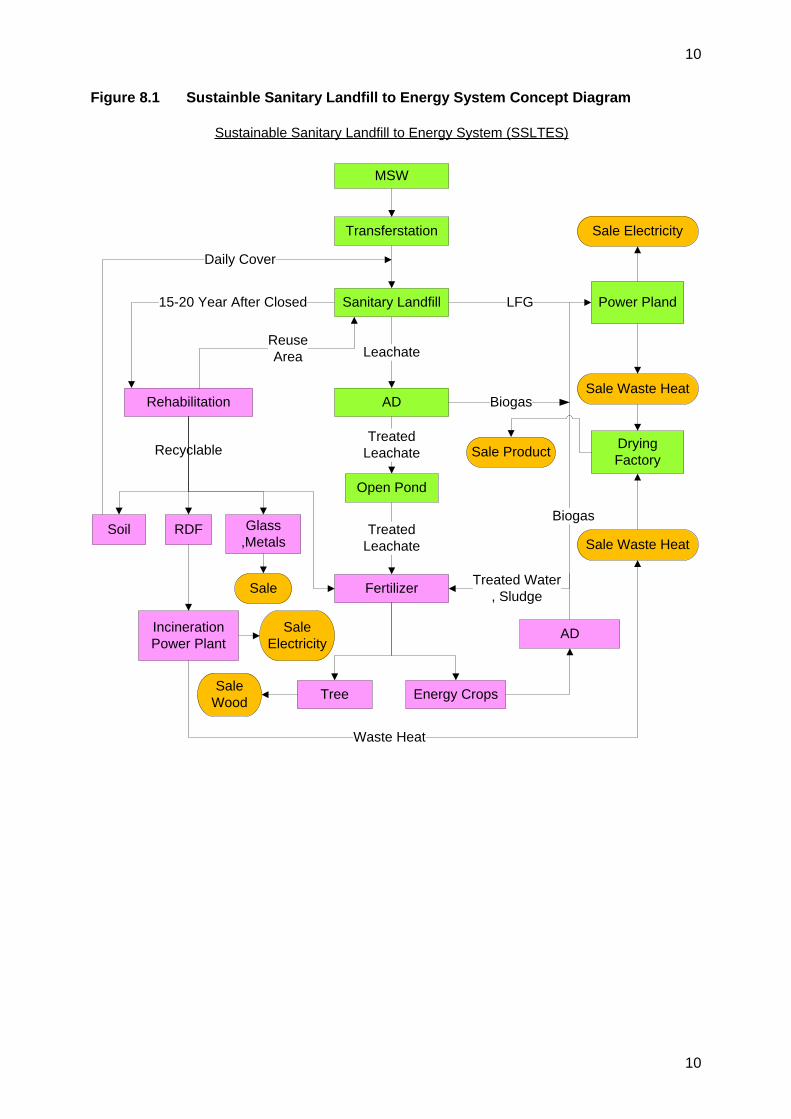
In order to enable the waste disposal facility to operate sustainability, it needs to be managed and developed with political, environmental and financial considerations. From the years of operation experience, the “Sustainable Sanitary Landfill to Energy System (SSLTES)” waste management concept was developed by the project designers and operators of Bantan sanitary landfill. This approach is appropriate for local waste composition, environmentally friendly, simple waste management process, creating value from waste, and maximizing land use. The SSLTES principle is similar to a sanitary landfill approach, but at each step of the SSLTES process byproducts can be retrieved and turned into valuable products as shown in Figure 8.1. The green color represents the current activities (2014) while the pink color show the future plan and the gold color shows the valuable products created.
Waste disposal processes under the SSLTES approach start from the waste transfer stations. There, small trucks transfer MSW to large trucks, which then transport the MSW to Bantan Sanitary Landfill. To prevent environmental impact during the 115 km transportation to the landfill, leachate storage tanks are installed at the bottom of each truck, and the solid waste is completely covered on the top of the trucks with tarpaulin sheets, these precautions prevent the leachate spilling on to the road, the solid waste falling off and the odor being released along the way. When the trucks arrive at the landfill, MSW is buried in accordance with the sanitation principle. At this stage there are two products, LFG and leachate. The leachate is collected and treated by the anaerobic digester process, which results in another two products; biogas and treated leachate. Currently, the treated leachate will flow into an open pond and it will evaporate naturally. In the future, it is planned that this treated leachate will be used as fertilizer to grow plants that are not consumed as food, such as tree trunks for sale and energy crops. These energy crops will in turn be decomposed in the anaerobic digester, producing 1. Biogas and 2. Sludge and Treated Water. The Sludge and Treated Water will again be used for non-food crops, and the process continues.
Biogas produced from each step of the processes will be collected by an exhaust gas fan through the pipeline system and delivered to the Bio-Filter to reduce hydrogen sulfide before being stored in the Balloon Gas Holder. The direct benefit from biogas collection is for electricity production, but the collection also helps to prevent the odor (which comes together with gas) to be released into the atmosphere, reducing the environmental impact.
Next, the biogas in the balloon gas holder will be drawn by fan through a process that reduces humidity and increases pressure before it is delivered to the engine for electricity generation. In the electricity production process, there is heat as a by-product, which will be sent to the heat exchanger to produce hot water at 90-95 °C. This hot water will subsequently be sent through another heat exchanger to produce hot air at a temperature of 70-85 degrees. This hot air is used to dry agriculture produce.
After a period of 15-20 years, the organic waste in the landfill will have completely decayed and the odor from the waste will have dissipated. This is the appropriate time to excavate the landfill to sieve and extract five types of valuable as follows:
1. Waste that can be sold e.g. glass, plastic, and metal 2. Combustible waste that can be used as refuse-derived fuel (RDF), which can be
sold or used as fuel for thermal power plants. Again, the heat which is the byproduct of the power plant can also be used for drying crops.
3. Sediment of the decomposed organic matter can be used as fertilizer for non-food crops
4. Soil and remaining materials will be used as daily cover at the landfill 5. The excavated land will be reused as a new landfill
The SSLTES approach to waste management can create value from waste and reduce environmental impacts. Moreover, there are no limitations of space due to landfill rehabilitation. This concept should be further developed and applied for future solid waste disposal practices.
10
10
Figure 8.1 Sustainble Sanitary Landfill to Energy System Concept Diagram
MSW
Transferstation
Leachate
LFG15-20 Year After Closed Power Pland
Drying
Factory
AD
Sanitary Landfill
Biogas
Open Pond
Treated
Leachate
Fertilizer
Treated
Leachate
Energy Crops
AD
Biogas
Treated Water
, Sludge
Rehabilitation
Glass
,MetalsRDF
Tree
Incineration
Power Plant
Waste Heat
Reuse
Area
Soil
Daily Cover
Recyclable
Sale
Sale
Electricity
Sale
Wood
Sale Electricity
Sale Waste Heat
Sale Waste Heat
Sale Product
Sustainable Sanitary Landfill to Energy System (SSLTES)
11
11
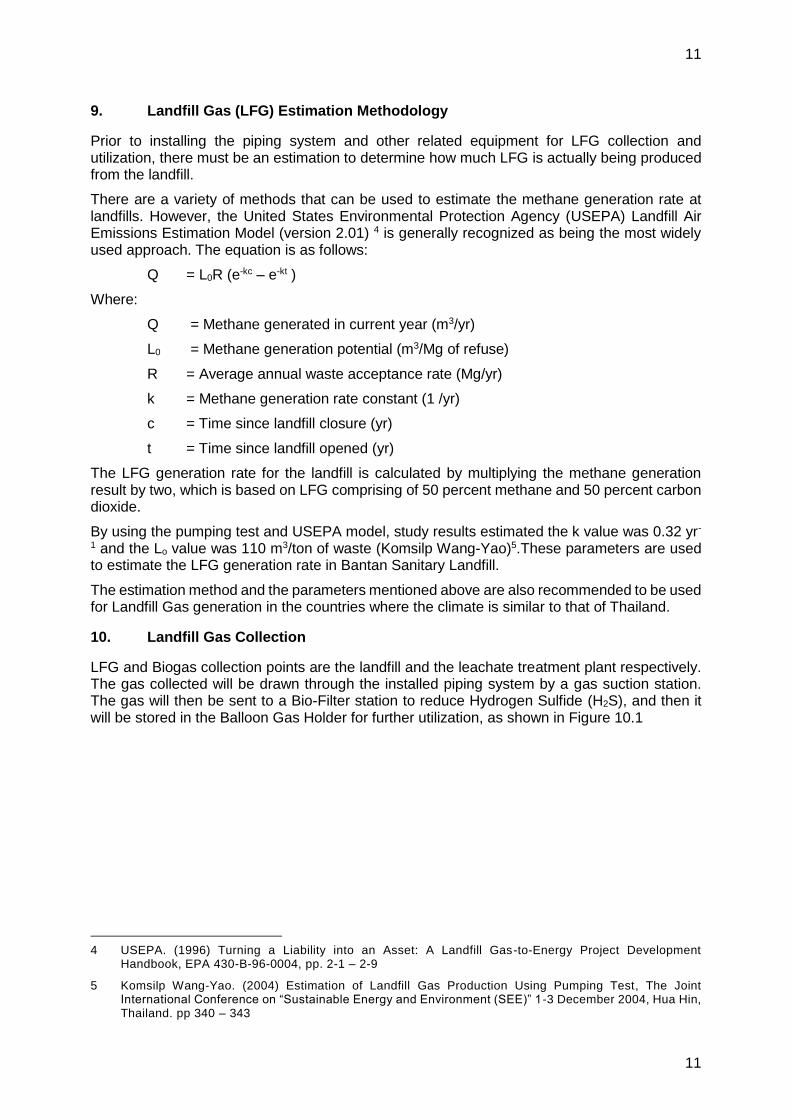
9. Landfill Gas (LFG) Estimation Methodology
Prior to installing the piping system and other related equipment for LFG collection and utilization, there must be an estimation to determine how much LFG is actually being produced from the landfill.
There are a variety of methods that can be used to estimate the methane generation rate at landfills. However, the United States Environmental Protection Agency (USEPA) Landfill Air Emissions Estimation Model (version 2.01) 4 is generally recognized as being the most widely used approach. The equation is as follows:
Q = L0R (e-kc – e-kt )
Where:
Q = Methane generated in current year (m3/yr)
L0 = Methane generation potential (m3/Mg of refuse)
R = Average annual waste acceptance rate (Mg/yr)
k = Methane generation rate constant (1 /yr)
c = Time since landfill closure (yr)
t = Time since landfill opened (yr)
The LFG generation rate for the landfill is calculated by multiplying the methane generation result by two, which is based on LFG comprising of 50 percent methane and 50 percent carbon dioxide.
By using the pumping test and USEPA model, study results estimated the k value was 0.32 yr-
1 and the Lo value was 110 m3/ton of waste (Komsilp Wang-Yao)5.These parameters are used to estimate the LFG generation rate in Bantan Sanitary Landfill.
The estimation method and the parameters mentioned above are also recommended to be used for Landfill Gas generation in the countries where the climate is similar to that of Thailand.
10. Landfill Gas Collection
LFG and Biogas collection points are the landfill and the leachate treatment plant respectively. The gas collected will be drawn through the installed piping system by a gas suction station. The gas will then be sent to a Bio-Filter station to reduce Hydrogen Sulfide (H2S), and then it will be stored in the Balloon Gas Holder for further utilization, as shown in Figure 10.1
4 USEPA. (1996) Turning a Liability into an Asset: A Landfill Gas-to-Energy Project Development
Handbook, EPA 430-B-96-0004, pp. 2-1 – 2-9
5 Komsilp Wang-Yao. (2004) Estimation of Landfill Gas Production Using Pumping Test, The Joint International Conference on “Sustainable Energy and Environment (SEE)” 1-3 December 2004, Hua Hin, Thailand. pp 340 – 343
12
12
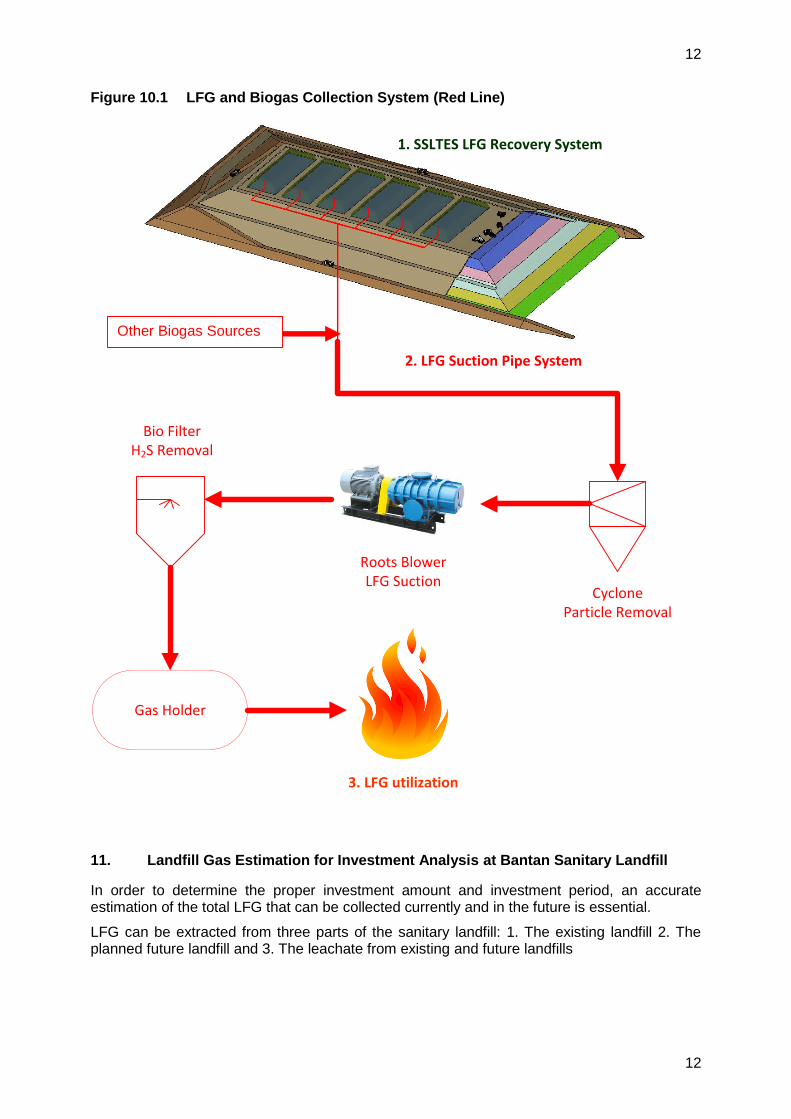
Figure 10.1 LFG and Biogas Collection System (Red Line)
2. LFG Suction Pipe System
Cyclone Particle Removal
Roots BlowerLFG Suction
Bio FilterH2S Removal
Gas Holder
3. LFG utilization
1. SSLTES LFG Recovery System
11. Landfill Gas Estimation for Investment Analysis at Bantan Sanitary Landfill
In order to determine the proper investment amount and investment period, an accurate estimation of the total LFG that can be collected currently and in the future is essential.
LFG can be extracted from three parts of the sanitary landfill: 1. The existing landfill 2. The planned future landfill and 3. The leachate from existing and future landfills
Other Biogas Sources

13
13
11.1 LFG from Bantan Existing Landfill
In 2009, a study on Bantan Existing landfill was done, and the landfill operation history is shown in Table 11.1 and
Figure 11.1
Table 11.1 Bantan Sanitary Landfill History in 2009
Landfill Cell Operating Duration MSW in Cell MSW
Open Close (d) (ton) (ton/d)
Cell 1 1/3/1997 1/6/2002 1,918 479,500 250
Cell 2 2/6/2002 1/10/2004 852 255,600 300
No operations during this period
2/10/2004 1/4/2006 546
Cell 3 2/4/2006 1/6/2007 425 148,750 350
Cell 4 2/6/2007 1/10/2008 487 207,462 426
Cell 5 2/10/2008 15/11/2009 409 184,050 450
Figure 11.1 Bantan Sanitary Landfill History in 2009
Using the landfill operation history, LFG estimation methodology in section 9 of the report, and the collection efficiency at 40%6, the total amount of LFG produced from the existing landfills
6 The 40% Collection Efficiency is calculated as follows:
14
14
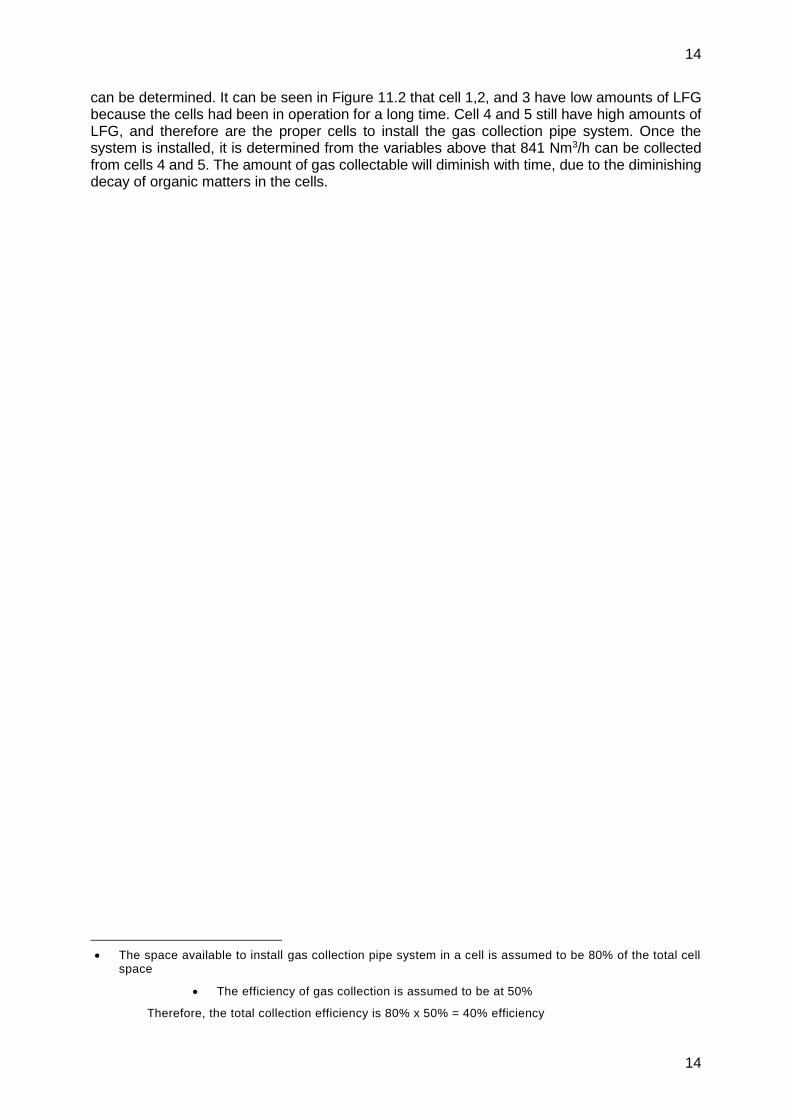
can be determined. It can be seen in Figure 11.2 that cell 1,2, and 3 have low amounts of LFG because the cells had been in operation for a long time. Cell 4 and 5 still have high amounts of LFG, and therefore are the proper cells to install the gas collection pipe system. Once the system is installed, it is determined from the variables above that 841 Nm3/h can be collected from cells 4 and 5. The amount of gas collectable will diminish with time, due to the diminishing decay of organic matters in the cells.
The space available to install gas collection pipe system in a cell is assumed to be 80% of the total cell
space
The efficiency of gas collection is assumed to be at 50%
Therefore, the total collection efficiency is 80% x 50% = 40% efficiency

15
15
Figure 11.2 LFG Production and Recovery in Bantan Sanitary Landfill Existing Landfill in 2009
841
610
443 321
233 169 123 89 65 47 34 -
500
1,000
1,500
2,000
2,500
3,000
3,500
2010 2011 2012 2013 2014 2015 2016 2017 2018 2019 2020
Nm
3/h
Estimation of Landfill Gas in Bantan existing landfill cells
Cell1
Cell2
Cell3
Cell4
Cell5
40% Recovery Eff. Cell4-Cell5
LFG Production Cell1 - Cell5

16
16
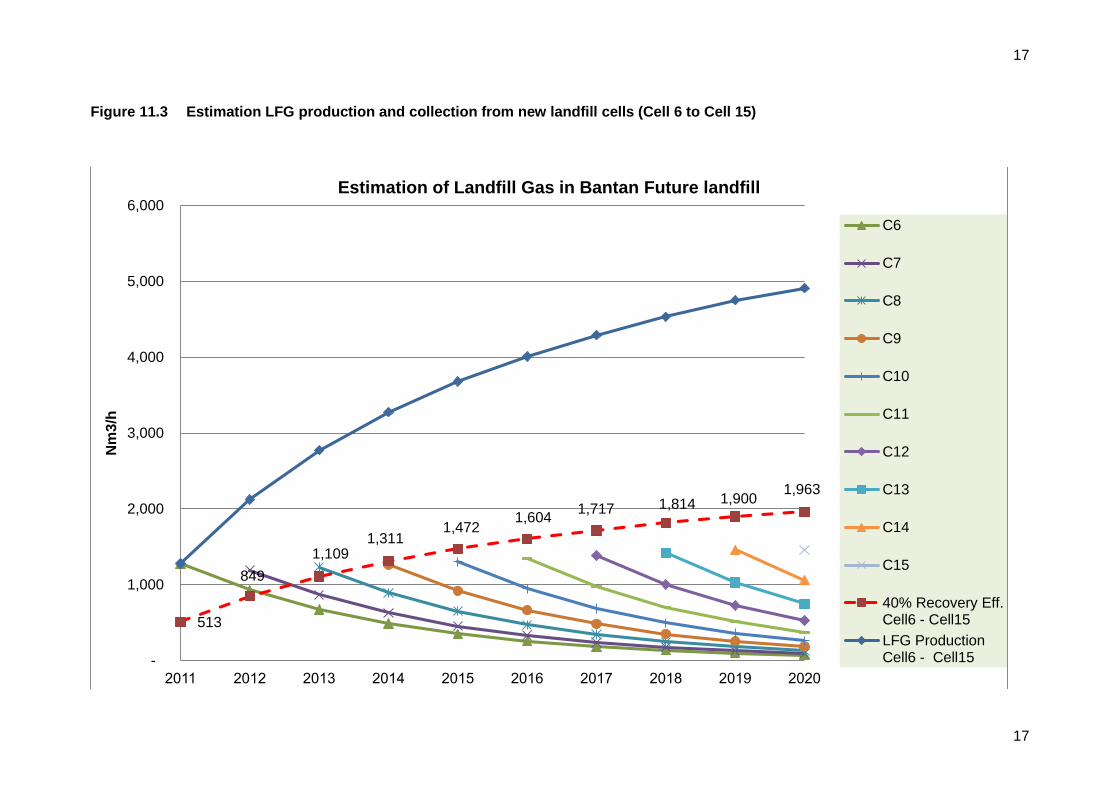
11.2 LFG from Bantan Future Landfills
Estimation of LFG from the future landfills has the following underlying assumptions:
The Municipal Solid Waste (MSW) coming to the landfill increases at 3% per year, starting at 450 tons/day in the year 2009
A new LFG collection pipe system can be installed every year
The collection efficiency is at 40%7
In Figure 11.3, the potential gas production in consecutive years from each new cell (Cells 6 to Cell 15) is shown. If the amount of LFG produced from each cell is added up, the total amount is very high (Dark blue line in Figure 11.3).
But the actual collection (with 40% efficiency), will yield a lower number (Dotted Red line in Figure 11.3). This actual collection is the number used to determine appropriate investment activities.
7
The 40% Collection Efficiency is calculated as follows:
The space available to install gas collection pipe system in a cell is assumed to be 80% of the total cell space
The efficiency of gas collection is assumed to be at 50%
Therefore, the total collection efficiency is 80% x 50% = 40% efficiency
17
17
Figure 11.3 Estimation LFG production and collection from new landfill cells (Cell 6 to Cell 15)
513
849
1,109 1,311
1,472 1,604
1,717 1,814 1,900 1,963
-
1,000
2,000
3,000
4,000
5,000
6,000
2011 2012 2013 2014 2015 2016 2017 2018 2019 2020
Nm
3/h
Estimation of Landfill Gas in Bantan Future landfill
C6
C7
C8
C9
C10
C11
C12
C13
C14
C15
40% Recovery Eff.Cell6 - Cell15
LFG ProductionCell6 - Cell15

18
18
11.3 Estimation of Biogas collection from Leachate
The highest amount of leachate produced from Bantan Sanitary Landfill is between 25 -350 m3/day, depending on the rate of precipitation. Throughout the year, the average the amount of leachate is 150 m3/day. The Chemical Oxygen Demand (COD) is between 8,000 to 50,000 mg/l, which is 10,000 mg/l on average. The biogas obtained from leachate will have 60% of methane as its composition.
The figures above are used to calculate and design the leachate treatment system as follows:
COD Load = 150 x 20,000/1,000 = 3,000 kg-COD/d COD Loading rate = 2 kg-COD/m3/d with Safety Factor = 2.5 Volume of Digester = 3,000/2*2.5 = 3,750 m3 Design digester = 2,000 m3 x 2 Retention time of Digester = 4,000/150 = 26 day
Open ponds are designed to be able to retain treated water for 3 months or 30,000 m3
The evaporation area for treated leachate is 50,000 m2 The amount of Biogas/Methane gas which can be obtained from the leachate can be estimated as follows: QBG = CODL x CODR x 0.35 / %CH4 8 Where: QBG = Biogas generated (m3/d)
CODL = COD Load (kg/d) CODR = COD removal to CH4 (%) 0.35 = CH4produced /Kg CODremoval (m3/kg) %CH4 = % CH4 in Biogas v/v
Assuming there is 50% of CODR in the leachate, the amount of Methane gas from leachate can be estimated as follows QBG = 3,000 x 0.5 x 0.35 /0.6
= 874 m3/d or 36 m3/h The 36 m3/h of methane gas collected from the leachate is relatively small when compared to the 841 m3/h collected from the existing Cell 4 and Cell 5, and when compared to 849 m3/h from the new Cell 6 alone. Nevertheless, leachate treatment at the landfill must be done, otherwise large amounts of heavy metal which come with the leachate will be released and contaminate the environment and perhaps even contaminate the food-chain crops and subsequently effect the health of the people consuming the crops.
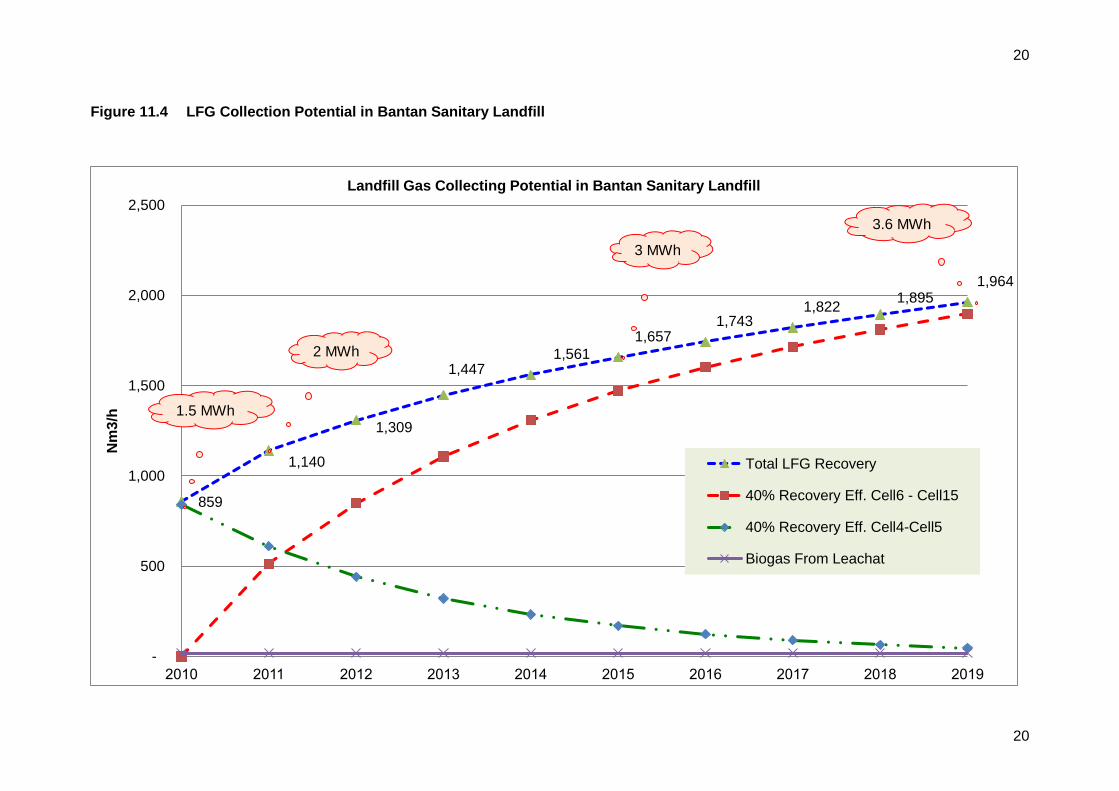
11.4 LFG Utilization Potentials
In Figure 11.4, the dotted blue line shows the total LFG collected from the existing landfill, the future landfills, and the leachate. The amount of LFG collected in 2010 is 859 Nm3/h and will increase every year.
There are three uses of LFG as follows: 1. Heat production e.g. cooking, drying, and as fuel for the boiler
8 Anaerobic Biotechnology for Bioenergy Production: Principles and Applications
By Samir Khana
19
19
2. Mechanical energy e.g. compressed Bio-Methane Gas (CBG) to replace fuel oil or LPG.
3. Electricity generation e.g. engine fuel to generate electricity. (To produce 1 MWh of electricity one requires 550 NM3/h. Which means it can be estimated from Figure 11.4 that in 2010 there is enough LFG 1.5 MWh, in 2011 enough to produce 2 MWh, in 2014 enough to produce 3 MWh, and in 2019 enough to produce 3.6 MWh)
Bantan Sanitary Landfill decided to use LFG as a fuel for generating electricity and sell energy to the Provincial Electricity Authority (PEA) for the following reasons:
1. The amount of Biogas available is suitable for electricity production and there is only one customer to purchase electricity, which eliminates the hassle of selling electricity
2. The electricity generation process is classified as a Very Small Power Producer (VSPP) and is under the power purchase agreement as a ‘non-firm’ producer. Therefore, it is flexible for controlling the engine for electricity generation as well as the ease of operation and maintenance.
3. The possibility of financial support from the government under the Feed-in premium program for seven years. Moreover, there are income tax exemptions for eight years. This results in a reasonable payback period.
4. The project also gets heat as a byproduct from the electricity generation process, which can be used for drying crops
Prior to investing in Bantan Sanitary Landfill the owner also took into consideration other aspects such as the time and difficulty in obtaining the license to produce electricity, the stability of minimum amount of waste coming into the landfill, and the short term annual contract with Chiangmai municipality and two other municipalities (which in 2015 becomes a total of 45 municipalities) to dispose their MSW. With the above consideration in mind, the owner therefore, decided to divide the investment into three phases, 1 MWh per phase.
20
20
Figure 11.4 LFG Collection Potential in Bantan Sanitary Landfill
859
1,140
1,309
1,447 1,561
1,657 1,743
1,822 1,895
1,964
-
500
1,000
1,500
2,000
2,500
2010 2011 2012 2013 2014 2015 2016 2017 2018 2019
Nm
3/h
Landfill Gas Collecting Potential in Bantan Sanitary Landfill
Total LFG Recovery
40% Recovery Eff. Cell6 - Cell15
40% Recovery Eff. Cell4-Cell5
Biogas From Leachat
2 MWh
3 MWh
3.6 MWh
1.5 MWh

21
21
12. LFG to Electricity Process
Bantan Sanitary Landfill electricity production system starts from drawing out the biogas from the Balloon Gas Holder to reduce humidity in the gas, and then increase the pressure and maintain between 100-150 millibar at a flow rate of 550 Nm3/h. Subsequently the gas is sent to the generator to produce electricity at the capacity of 1 MWh. As shown in Figure 12.1
Figure 12.1 LFG to Electricity Process
Gas Holder
Dehumidification
Boost pressure
Gas Engine
Power House
12.1 Bantan’s Phases of Electricity Production from LFG
The project to produce 1 MWh from LFG started on 1st August 2009 and the date of first electricity sold was 4th May 2010. The second phase (2nd MWh) date of first electricity sold was 10th August 2012. The third phase is in the process of application for electricity production license and is expected to be awarded in 2016.

22
22
13. Leachate Utilization
Leachate is the liquid that drains or ‘leaches’ from a landfill. It varies widely in composition depending on the age of the landfill and the type of waste it contains. It usually contains both dissolved and suspended material. The amount of leachate varies directly with the amount of rainfall into the landfill. Therefore, the amount of rain and open areas are two key factors for leachate production. The leachate treatment process must be done in a controlled area in order to prevent environmental impacts. The cost of treating the leachate up to the quality that it can be released into the nature is very high. Therefore, Bantan Sanitary Landfill chose to treat leachate through an anaerobic digester, and subsequently send the treated leachate to open ponds to evaporate as shown in Figure 13.1.
Figure 13.1 Bantan Sanitary Landfill Leachate Treatment Plant
There is a plan to use the treated leachate as fertilizer for plants that are not in the food chain. The purpose is to increase the value of the leachate and reduce environmental impacts. There has already been an experiment using treated leachate to grow grass, and the result of the experiment will be further used as baseline data for growing non-food crops, as shown in Figure 13.2 and Table 13.1
Anaerobic Digester
Open Pond
Evaporation

23
23
Figure 13.2 Treated Leachate to Fertilizer Testing
Table 13.1 Treated Leachate from Anaerobic Digester
No Parameter Concentration (PPM)
1 Nitrogen 2,000
2 Phosphorus 154
3 Potassium 2,720
4 Chromium 0.19
5 Cadmium -
6 Lead 0.02
7 COD 4,800 -7,200
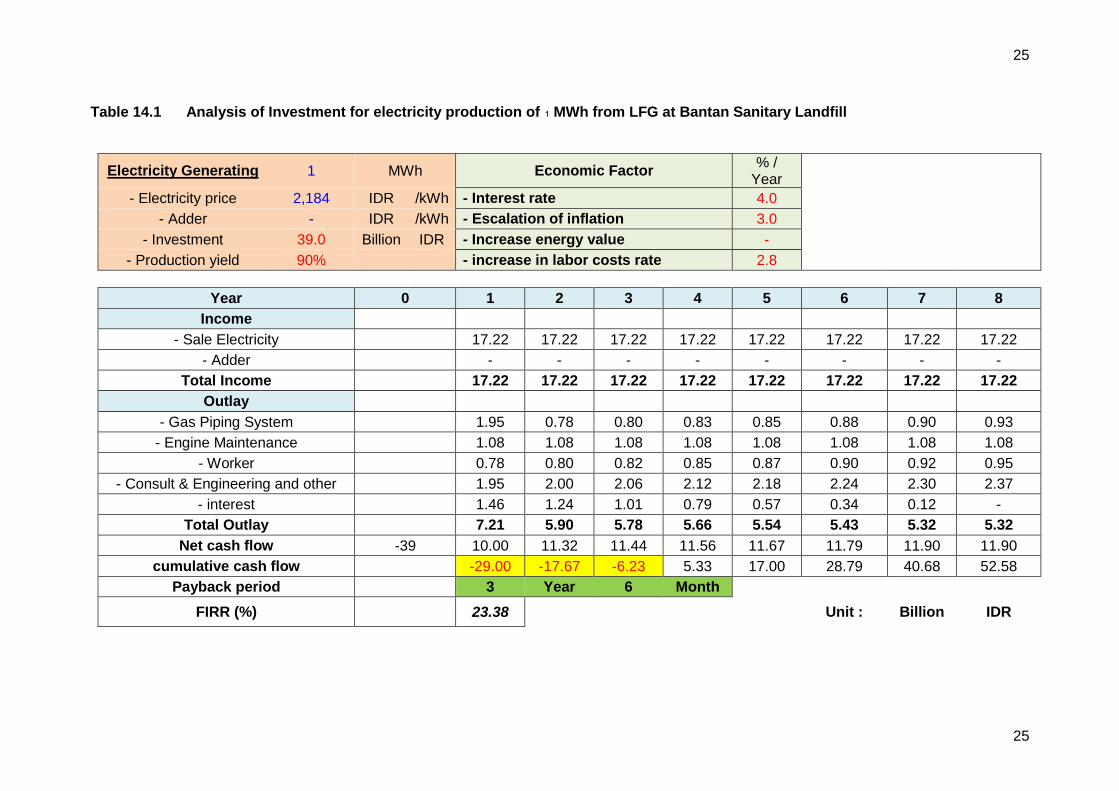
14. Analysis of Investment for electricity production of 1 MWh
Table 14.1 shows the estimated cost of investment and payback period for electricity production of 1MWh for Bantan Sanitary Landfill The total investment was 100 Million THB (Thai Baht) or roughly 39 Billion Indonesian Rupiah (IDR). The government supports Bantan Sanitary Landfill waste to energy project by offering to purchase the electricity at 5.6 THB/kWh or 2,184 IDR/kWh. This government incentive enables the investment payback period to be only 3 years and 6 months and the accumulated income in the 8th year to be 134.8 Million THB or 52.58 Billion IDR. This rate of return and profitability are attractive figures for investors.

24
24
Remark: The investment cost figures refer to Thai industry figures (and converted into IDR9) and may not reflect the situation in Indonesia.
9 390 IDR/THB On Feb-2015 from Google Finance
25
25
Table 14.1 Analysis of Investment for electricity production of 1 MWh from LFG at Bantan Sanitary Landfill
Electricity Generating 1 MWh Economic Factor % /
Year
- Electricity price 2,184 IDR /kWh - Interest rate 4.0
- Adder - IDR /kWh - Escalation of inflation 3.0
- Investment 39.0 Billion IDR - Increase energy value -
- Production yield 90% - increase in labor costs rate 2.8
Year 0 1 2 3 4 5 6 7 8
Income
- Sale Electricity 17.22 17.22 17.22 17.22 17.22 17.22 17.22 17.22
- Adder - - - - - - - -
Total Income 17.22 17.22 17.22 17.22 17.22 17.22 17.22 17.22
Outlay
- Gas Piping System 1.95 0.78 0.80 0.83 0.85 0.88 0.90 0.93
- Engine Maintenance 1.08 1.08 1.08 1.08 1.08 1.08 1.08 1.08
- Worker 0.78 0.80 0.82 0.85 0.87 0.90 0.92 0.95
- Consult & Engineering and other 5 1.95 2.00 2.06 2.12 2.18 2.24 2.30 2.37
- interest 1.46 1.24 1.01 0.79 0.57 0.34 0.12 -
Total Outlay 7.21 5.90 5.78 5.66 5.54 5.43 5.32 5.32
Net cash flow -39 10.00 11.32 11.44 11.56 11.67 11.79 11.90 11.90
cumulative cash flow -29.00 -17.67 -6.23 5.33 17.00 28.79 40.68 52.58
Payback period 3.54 3 Year 6 Month
FIRR (%) 23.38 Unit : Billion IDR

26
26
15. Waste Dumping Methodology and its effect on LFG collection
In the past, most landfill sites were just open dump sites. The design of those sites does not take into consideration neither renewable energy production nor landfill rehabilitation for space reuse. Therefore, the main concern was to conserve space as much as possible by dumping the waste vertically layer after layer up to a certain height. Once that certain height is reached, the landfill cell is simply closed permanently, and dumping is moved to adjacent land/space, and the cycle continues until all space is used up and the whole site can no longer accommodate further dumping – as shown in Figure 15.1
Figure 15.1 Bantan Sanitary Landfill History in 2014
This layer by layer vertical dumping affects the efficiency in LFG collection. For example, if a cell has been opened for dumping for roughly 1 year. The first layer of solid waste has been dumped onto the cell and the LFG collection pipe network has been installed on top of this first layer. The problems arise when the site runs out of dumping space and needs to return to the first cell to dump the second layer on top of the first layer. This causes several problems because now the LFG piping network which was previously installed on the first layer will have to be taken out prior to the dumping of the second layer. The effects on operation and efficiency are the following: extra labor and equipment cost for uninstalling and reinstalling the pipe network, as well as the stop of LFG collection which is a loss of revenue as electricity cannot be produced.
Therefore Bantan Sanitary Landfill operator has designed and developed a new methodology of landfill preparation and dumping process as a part of the SSLTES concept. This landfill preparation methodology will prevent the above mentioned problems and add several advantages. The process will be applied at Bantan Landfill by the end of 2015. The operator of Bantan landfill expects that by the end 2015 the vertical dumping methodology will no longer be applied at Bantan Landfill.
SSLTES landfill preparation methodology will be elaborated in the next section.
27
27
16. Design and Construction of SSLTES
SSLTES is separated into 4 parts:
1. Sanitary Landfill : Sanitary Landfill, LFG Recovery and Landfill Rehabilitation. 2. LFG Collection : LFG Collection Pipe, LFG Cleaning and Balloon Gas Holder. 3. LFG Utilization : Generate Electricity or CBG 4. Leachate Utilization : Leachate Treatment and Treated Leachate Utilization
Part 2 (LFG Collection), part 3 (LFG Utilization), and part 4 (Leachate Utilization) of the SSLTES concept have already been discussed in previous sections 11, 12, and 13 respectively. This section will concentrate on part 1, the Sanitary Landfill and its preparation. The landfill preparation method is the unique feature of SSLTES concept as it enables high efficiency of landfill gas collection and the landfill rehabilitation.
16.1 Sanitary Landfill
The landfill consists of three parts which are 1. Sanitary landfill, 2. LFG recovery and 3. landfill rehabilitation. The operation of these three components must go on without interrupting each other. In any given area on the landfill, there will not be a need to stop the operation of one component due to the other operation. The new design of the landfill cells to achieve the above criteria is as follows:
16.1.1 Sanitary Landfill
The construction design starts with the preparation of the landfill basin according to the sanitary regulations. Next is the installation of the leachate drainage system, which is divided into sections in order to drain the leachate out from different sections of the landfill, as shown in Figure 16.1/1-6.
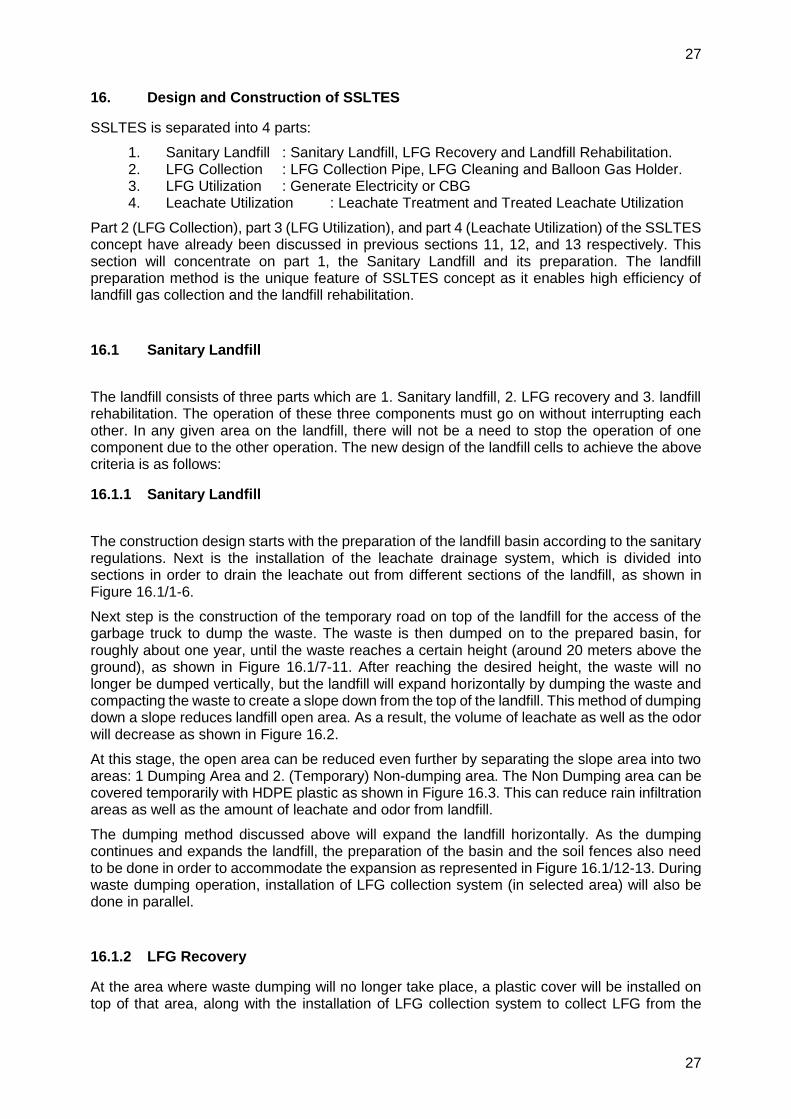
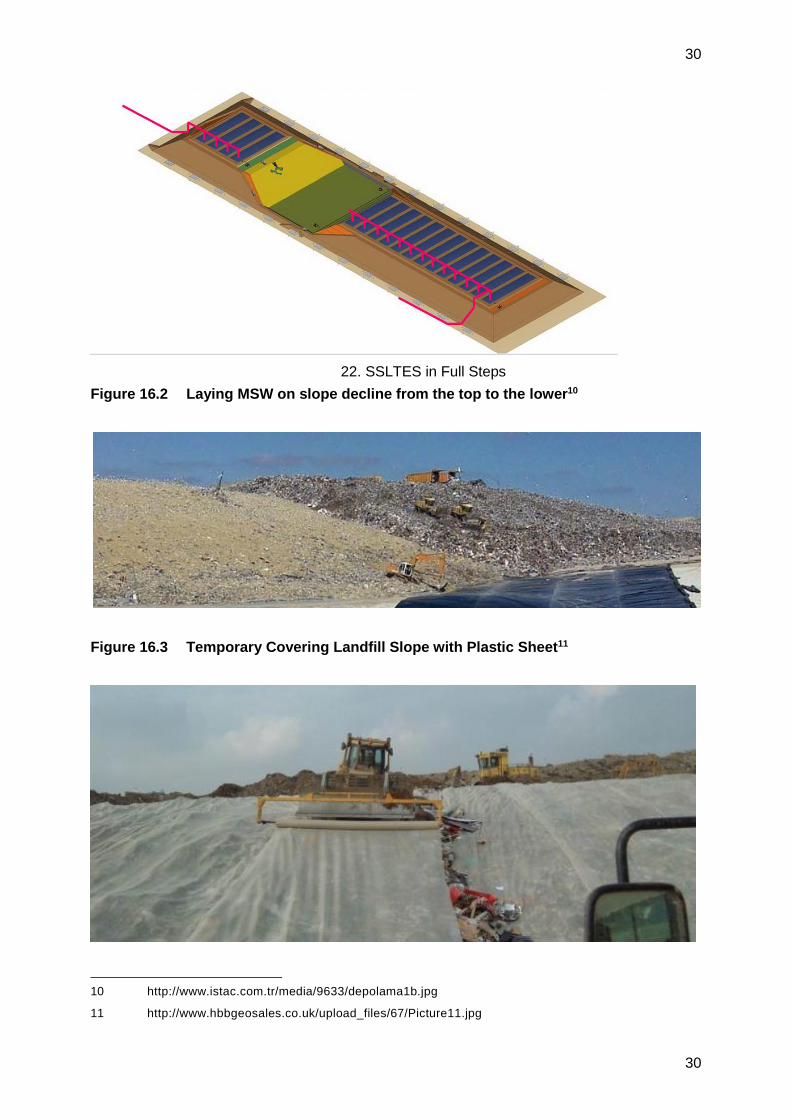
Next step is the construction of the temporary road on top of the landfill for the access of the garbage truck to dump the waste. The waste is then dumped on to the prepared basin, for roughly about one year, until the waste reaches a certain height (around 20 meters above the ground), as shown in Figure 16.1/7-11. After reaching the desired height, the waste will no longer be dumped vertically, but the landfill will expand horizontally by dumping the waste and compacting the waste to create a slope down from the top of the landfill. This method of dumping down a slope reduces landfill open area. As a result, the volume of leachate as well as the odor will decrease as shown in Figure 16.2.
At this stage, the open area can be reduced even further by separating the slope area into two areas: 1 Dumping Area and 2. (Temporary) Non-dumping area. The Non Dumping area can be covered temporarily with HDPE plastic as shown in Figure 16.3. This can reduce rain infiltration areas as well as the amount of leachate and odor from landfill.
The dumping method discussed above will expand the landfill horizontally. As the dumping continues and expands the landfill, the preparation of the basin and the soil fences also need to be done in order to accommodate the expansion as represented in Figure 16.1/12-13. During waste dumping operation, installation of LFG collection system (in selected area) will also be done in parallel.
16.1.2 LFG Recovery
At the area where waste dumping will no longer take place, a plastic cover will be installed on top of that area, along with the installation of LFG collection system to collect LFG from the

28
28
landfill area. The LFG will then be delivered to balloon gas holders for storage, please see in Figure 16.1/14-18.
16.1.3 Landfill Rehabilitation
After the dumping area is filled and the dumping at the particular area has been stopped for approximately 15-20 years, it is excavation time. The area will be excavated, the waste will be sieved, separating soil and saleable waste (turning waste to value). Moreover, the excavated land can now be used as the new landfill space, as shown in Figure 16.1/19-22.
Figure 16.1 SSLTES Construction Steps
\
1. Land 2. Cell Basin 3. Drainage Pipe
4. Berm 5. Lining 6. Drainage filtering
7. Temporary Road 8. MSW Filling 9. MSW Filling
10. MSW Filling Overlay

29
29
11. Final Overlay Layer 12. Add new Basin and Filling MSW on Slope
13. Lay MSW on slope decline from the top to the lower 14. LFG Collecting Cell
19. Rehabilitation
20. Reuse Area to Fill New MSW 21. SSLTES Cycle starts
15. Collecting LFG by Plastic Sheet
17. LFG Collecting Pipe
18. SSLTES expands horizontally
16. Add New Basin
30
30
Figure 16.2 Laying MSW on slope decline from the top to the lower10
Figure 16.3 Temporary Covering Landfill Slope with Plastic Sheet11
10 http://www.istac.com.tr/media/9633/depolama1b.jpg
11 http://www.hbbgeosales.co.uk/upload_files/67/Picture11.jpg
22. SSLTES in Full Steps
31
31
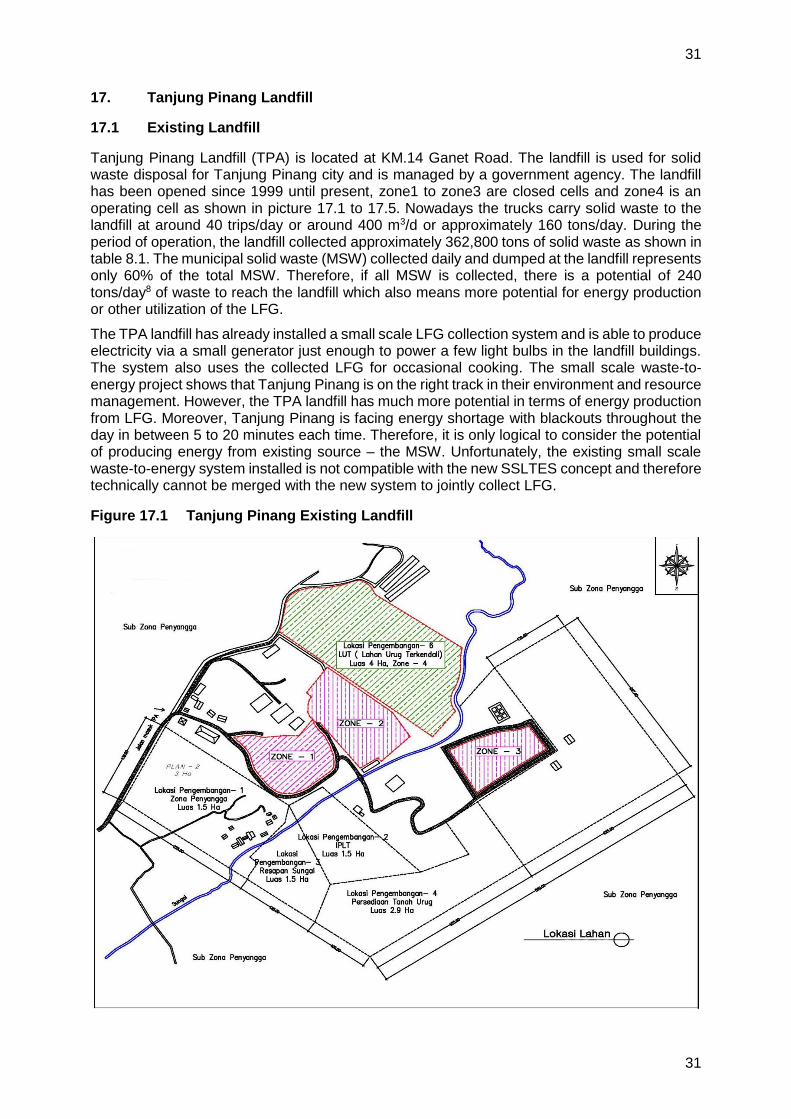
17. Tanjung Pinang Landfill
17.1 Existing Landfill
Tanjung Pinang Landfill (TPA) is located at KM.14 Ganet Road. The landfill is used for solid waste disposal for Tanjung Pinang city and is managed by a government agency. The landfill has been opened since 1999 until present, zone1 to zone3 are closed cells and zone4 is an operating cell as shown in picture 17.1 to 17.5. Nowadays the trucks carry solid waste to the landfill at around 40 trips/day or around 400 m3/d or approximately 160 tons/day. During the period of operation, the landfill collected approximately 362,800 tons of solid waste as shown in table 8.1. The municipal solid waste (MSW) collected daily and dumped at the landfill represents only 60% of the total MSW. Therefore, if all MSW is collected, there is a potential of 240 tons/day8 of waste to reach the landfill which also means more potential for energy production or other utilization of the LFG.
The TPA landfill has already installed a small scale LFG collection system and is able to produce electricity via a small generator just enough to power a few light bulbs in the landfill buildings. The system also uses the collected LFG for occasional cooking. The small scale waste-to-energy project shows that Tanjung Pinang is on the right track in their environment and resource management. However, the TPA landfill has much more potential in terms of energy production from LFG. Moreover, Tanjung Pinang is facing energy shortage with blackouts throughout the day in between 5 to 20 minutes each time. Therefore, it is only logical to consider the potential of producing energy from existing source – the MSW. Unfortunately, the existing small scale waste-to-energy system installed is not compatible with the new SSLTES concept and therefore technically cannot be merged with the new system to jointly collect LFG.
Figure 17.1 Tanjung Pinang Existing Landfill

32
32
Figure 17.2 Figure Landfill Cell1 in Zone1
Figure 17.3 Landfill Cell2 in Zone2 Figure 17.4 Landfill Cell3 in Zone3
Figure 17.5 Landfill Cell4 in Zone4
Figure 17.6 Historical Data of Tanjung Pinang Landfill
Landfill Cell
Operating Duration Area Amount of MSW in
landfill Cell Average
Open Close (d) HA m3 Ton* Ton/day
Cell1 1999 2002 1,460 1 151,200 60,400 41.4
Cell2 2003 2006 1,460 1.3 159,650 64,000 43.8
Cell3 2007 2012 2,191 0.9 319,220 127,600 58.2
Cell4 2013 2014 729 4 277,000 110,800 152.0
Total 5,840 7.2 907,070 362,800
*Assumed solid waste density is 0.4 ton/m3

33
33
18. Converting Tanjung Pinang TPA Landfill into a Sustainable Landfill (SSLTES)
In order for the TPA landfill to become a sustainable sanitary landfill and reach its highest potential in landfill gas collection and utilization, it is recommended that the TPA landfill adopts Bantan’s ‘Sustainable Sanitary Landfill to Energy System’ or SSLTES concept.
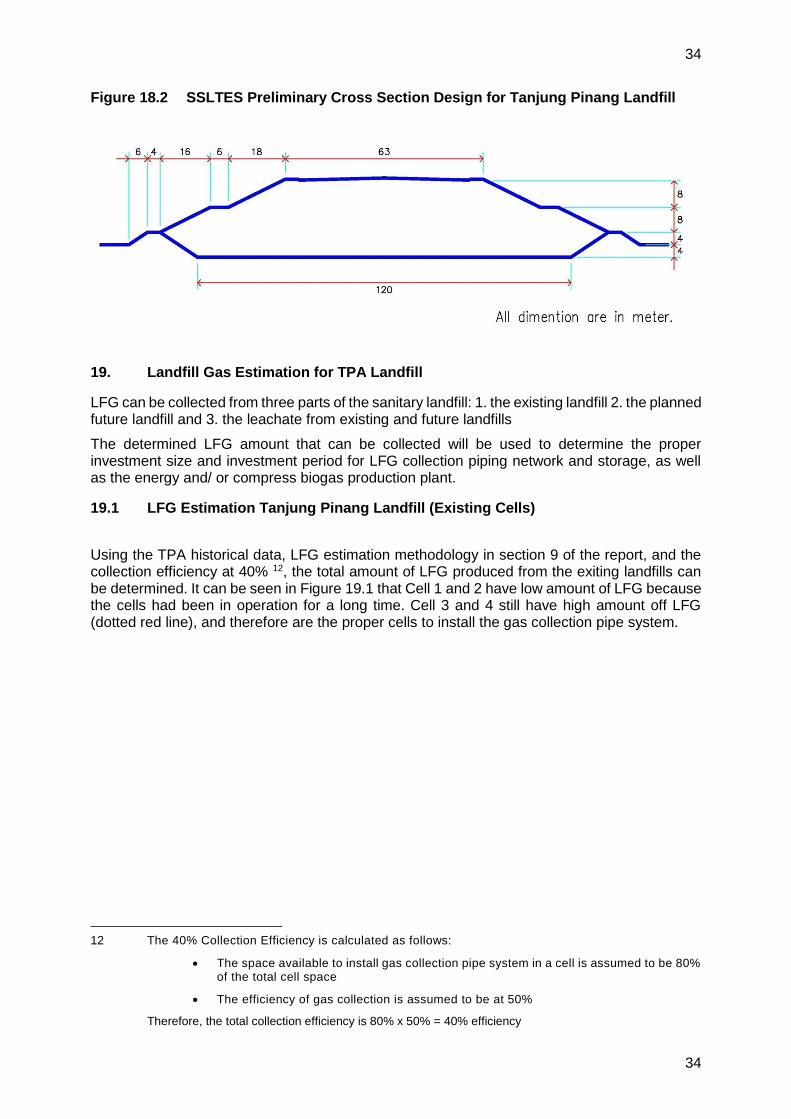
As shown in Figure 18.1and Figure 18.2, the TPA landfill area now has a combination of existing cells and the new cells (yellow and green color, Cell 5 to Cell 15) which applies the SSLTES concept. The new cells will have a 120 meters wide basin and the total length is 630 meters. The total height from the bottom of the basin up to the top of the dumped garbage will be 24 meters high. The dumping capacity of the new cells is 200 tons/day for a period of 11 years, with the solid waste density of 0.65 ton/m3.
The solid waste density is an important figure to consider because the better the compaction the more landfill space will be saved. Also in some countries, such as Indonesia (Tanjung Pinang) measures their solid waste in cubic meters and not in tons, therefore, the value of solid waste density is required in order to convert m3 to tons – to match with the calculation of Ban Tan’s SSLTES model.
Figure 18.1 SSLTES Preliminary Master Plan Design for Tanjung Pinang Landfill
Cell 5 to Cell 15
34
34
Figure 18.2 SSLTES Preliminary Cross Section Design for Tanjung Pinang Landfill
19. Landfill Gas Estimation for TPA Landfill
LFG can be collected from three parts of the sanitary landfill: 1. the existing landfill 2. the planned future landfill and 3. the leachate from existing and future landfills
The determined LFG amount that can be collected will be used to determine the proper investment size and investment period for LFG collection piping network and storage, as well as the energy and/ or compress biogas production plant.
19.1 LFG Estimation Tanjung Pinang Landfill (Existing Cells)
Using the TPA historical data, LFG estimation methodology in section 9 of the report, and the collection efficiency at 40% 12, the total amount of LFG produced from the exiting landfills can be determined. It can be seen in Figure 19.1 that Cell 1 and 2 have low amount of LFG because the cells had been in operation for a long time. Cell 3 and 4 still have high amount off LFG (dotted red line), and therefore are the proper cells to install the gas collection pipe system.
12 The 40% Collection Efficiency is calculated as follows:
The space available to install gas collection pipe system in a cell is assumed to be 80% of the total cell space
The efficiency of gas collection is assumed to be at 50%
Therefore, the total collection efficiency is 80% x 50% = 40% efficiency

35
35
Figure 19.1 Estimation of LFG Production in Tanjung Pinang Existing Landfill
359
260
189
137 99
72 52 38 28 20 14 11 8 6 -
100
200
300
400
500
600
700
800
900
1,000
2015 2016 2017 2018 2019 2020 2021 2022 2023 2024 2025 2026 2027 2028
Nm
3/h
Estimation of LFG Production in Tanjungpinang Existing Landfill
Cell 1
Cell 2
Cell 3
Cell 4
40% Recovery eff. (Cell3-Cell4)
LFG Production Cell1 - Cell4
36
36
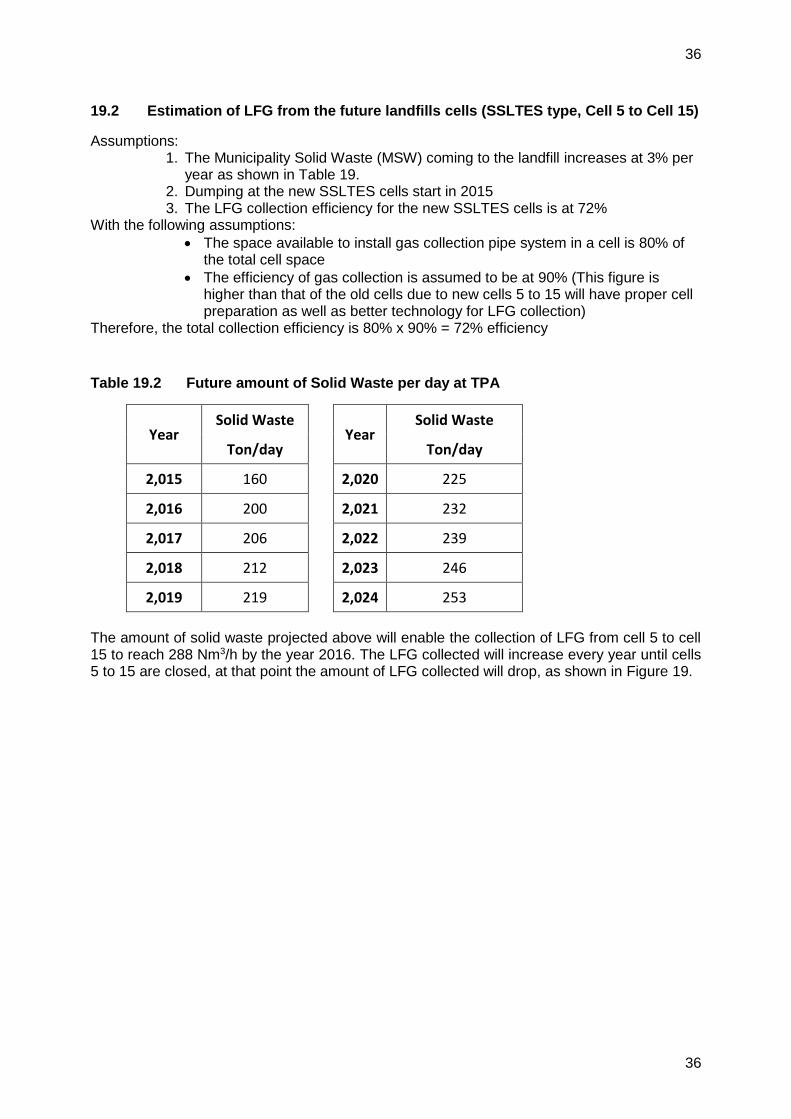
19.2 Estimation of LFG from the future landfills cells (SSLTES type, Cell 5 to Cell 15)
Assumptions: 1. The Municipality Solid Waste (MSW) coming to the landfill increases at 3% per
year as shown in Table 19. 2. Dumping at the new SSLTES cells start in 2015 3. The LFG collection efficiency for the new SSLTES cells is at 72%
With the following assumptions:
The space available to install gas collection pipe system in a cell is 80% of the total cell space
The efficiency of gas collection is assumed to be at 90% (This figure is higher than that of the old cells due to new cells 5 to 15 will have proper cell preparation as well as better technology for LFG collection)
Therefore, the total collection efficiency is 80% x 90% = 72% efficiency
Table 19.2 Future amount of Solid Waste per day at TPA
Year Solid Waste
Year Solid Waste
Ton/day Ton/day
2,015 160 2,020 225
2,016 200 2,021 232
2,017 206 2,022 239
2,018 212 2,023 246
2,019 219 2,024 253
The amount of solid waste projected above will enable the collection of LFG from cell 5 to cell 15 to reach 288 Nm3/h by the year 2016. The LFG collected will increase every year until cells 5 to 15 are closed, at that point the amount of LFG collected will drop, as shown in Figure 19.

37
37
Figure 19.3 Estimation of LFG collection from SSLTES cells 5 to 15 at Tanjung Pinang TPA landfill
288
570
784
950
1,082 1,190
1,279 1,356
1,424 1,488
1,546
1,122
814
-
500
1,000
1,500
2,000
2,500
2015 2016 2017 2018 2019 2020 2021 2022 2023 2024 2025 2026 2027 2028
Nm
3/h
LFG From The SSLTES landfill cell
Cell5
Cell6
Cell7
Cell8
Cell9
Cell10
Cell11
Cell12
Cell13
Cell14
Cell15
72% Recovery Cell5-Cell15
LFG Production Cell5-Cell15

38
38
19.3 Estimation of Biogas Collection from Leachate
19.3.1 Leachate and Biogas from existing cells (cell 1 to 4)
As shown in the Figure 19., the existing cells do not have a specific system installed for collection and prevention of leachate being disposed into the environment, but rather just a drainage line which could be used for both storm drainage and leachate drainage. Therefore, there is a need to install a proper leachate collection system and treat the leachate. The main purpose is to decrease the probability of the nature being contaminated from untreated leachate disposal.
Due to the fact that cell 1 to cell 4 have been in operation for a long time, there will be
amount of leachate left in those cells. The concentration of organic matters (source of biogas)
in old cells is also a very small amount. Moreover, it is technically difficult to install a leachate
collection piping system inside old cells. The leachate collection efficiency is assumed to be
only 10%. It can be seen from the
Table 19. that the amount of Biogas which can be obtained from Cell 4 leachate is only 0.30% (when compared to the Biogas that could have been obtained from Cell 4 leachate at the very beginning of its operation).
Hence, the amount of biogas that can be obtain from Cell 1 to Cell 4 leachate, is negligible.
It is recommended that Tanjung Pinang TPA landfill should plan for converting the old cells 1 to 4 into the SSLTES system such that it is worthwhile in terms of environment protection and biogas extraction for future utilization.
Figure 19.4 A mixed system of storm drainage and leachate drainage

39
39
Table 19.5 Estimation of Biogas from leachate of Cell 1-4
Cell Operating Duration
Age Leachate Collection Efficiency
Compared to the respective values at the beginning of
cell operation
COD biodegradable
Biogas Production
Open Close Year % % %
Cell1 1999 2002 14 10% - -
Cell2 2003 2006 9 10% 0.3% 0.03%
Cell3 2007 2012 4 10% 0.64% 0.06%
Cell4 2013 2014 1 10% 30% 0.30%
19.3.2 Estimation of Leachate and Biogas from new SSLTES cells (Cell 5 to 15)
The amount of leachate is directly related to the amount of rain (Appendix A) and the open area of the cells. According to the SSLTES concept, the amount of leachate will change as illustrated in Figure 11.1. The amount of leachate is between 30-188 m3/day, depending on the amount of rainfall, and averages approximately 90 m3/day. It is assumed that COD is between 8,000 - 50,000 mg/l, with an average value of 20,000 mg/l. The amount of CH4 is around 60% of biogas. According to the data from Bantan Sanitary Landfill, the estimation of leachate treatment and biogas from leachate for TPA landfill should be as follows:
COD Load = 90 x 20,000/1,000 = 1,800 kg-COD/d

40
40
COD Loading Rate = 2 kg-COD/m3/d and Safety Factor = 2.5 Volume of digester = 1,800/2*2.5 = 2,250 m3 Design of digester volume = 2,500 m3 Retention Time = 2,500/90 = 28 day Volume of open pond for treated water = 10,000 m3 or for the period of 3 months
The amount of biogas from leachate is approximately: QBG = 1,800 x 0.5 x 0.35 /0.6 = 525 m3/d = 22 m3/h
Figure 19.6 Leachate Amount From SSLTES in Tanjung Pinang TPA Landfill
19.3.3 LFG Utilization Potentials in Tanjung Pinang TPA Landfill
Figure 19., the dotted blue line shows the total LFG collected from the existing landfill cells (Cell 1 to 4), the future landfills cells (Cell 5 to 15), and the leachate from Cell 5 to 15. The total amount of LFG collected from the three sources in 2016 will be 559 Nm3/h and will increase every year.
With the amount of 559 Nm3/h of LFG collected, Tanjung Pinang Municipality can utilize the Landfill Gas collected in 2 ways:
1 Produce 1 MWh of electricity from the LFG 2 Produce Compressed Bio-Methane Gas (CBG) to replace fuel oil or LPG at 6
tons/day In the case of electricity production, from the data discussed above, it can be projected that in 2016 there is enough LFG to produce 1 MWh of electricity, in 2020 there is enough LFG for 2 MWh, and in 2019 enough LFG to produce 2.7 MWh.
58.7
27.5
46.2 50.3 41.9
35.4
51.1 52.5 47.3 59.0
73.7 73.4
150.2
70.2
118.2 128.6
107.1
90.4
130.7 134.2 121.0
150.9
188.4 187.7
0
50
100
150
200
250
1 2 3 4 5 6 7 8 9 10 11 12
m3
/d
Mounth
Amount of Leachate From SSLTES
Year 1
Year 2
Year 3
Year 4
Year 5
Year 6
Year 7
Year 8

41
41
Figure 19.7 LFG Collection Potaintial in Tanjung Pinang TPA Landfill
370
559
770
932
1,060
1,165
1,253
1,3281,394
1,455 1,513
-
200.0
400.0
600.0
800.0
1,000.0
1,200.0
1,400.0
1,600.0
2015 2016 2017 2018 2019 2020 2021 2022 2023 2024 2025
Nm
3/h
Landfill Gas Collecting Potaintial in Tanjung Pinang Landfill
Total LFG Recovery
72% Recovery eff. Cell5 - Cell 15
40% Recovery eff. Cell3 - Cell4
Biogas From Leachate
2 MWh
2.7 MWh
1.0 MWh
42
42
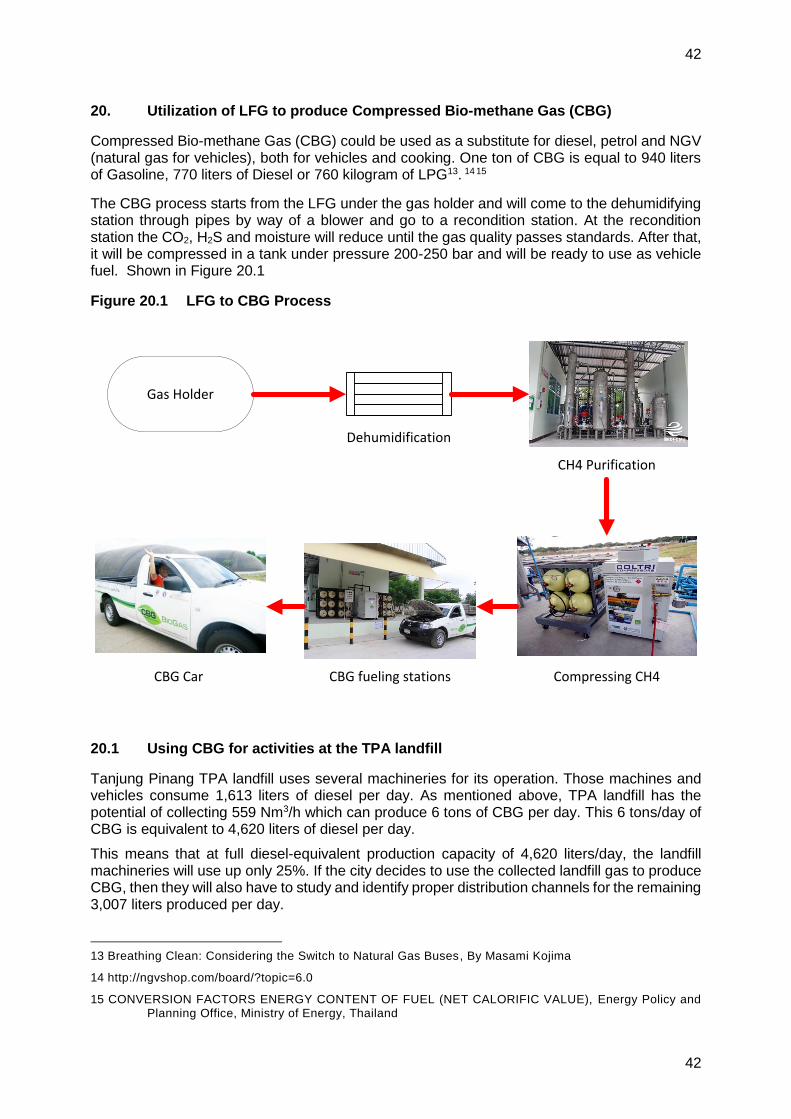
20. Utilization of LFG to produce Compressed Bio-methane Gas (CBG)
Compressed Bio-methane Gas (CBG) could be used as a substitute for diesel, petrol and NGV (natural gas for vehicles), both for vehicles and cooking. One ton of CBG is equal to 940 liters of Gasoline, 770 liters of Diesel or 760 kilogram of LPG13. 14 15
The CBG process starts from the LFG under the gas holder and will come to the dehumidifying station through pipes by way of a blower and go to a recondition station. At the recondition station the CO2, H2S and moisture will reduce until the gas quality passes standards. After that, it will be compressed in a tank under pressure 200-250 bar and will be ready to use as vehicle fuel. Shown in Figure 20.1
Figure 20.1 LFG to CBG Process
Gas Holder
Dehumidification
CH4 Purification
Compressing CH4CBG fueling stationsCBG Car
20.1 Using CBG for activities at the TPA landfill
Tanjung Pinang TPA landfill uses several machineries for its operation. Those machines and vehicles consume 1,613 liters of diesel per day. As mentioned above, TPA landfill has the potential of collecting 559 Nm3/h which can produce 6 tons of CBG per day. This 6 tons/day of CBG is equivalent to 4,620 liters of diesel per day.
This means that at full diesel-equivalent production capacity of 4,620 liters/day, the landfill machineries will use up only 25%. If the city decides to use the collected landfill gas to produce CBG, then they will also have to study and identify proper distribution channels for the remaining 3,007 liters produced per day.
13 Breathing Clean: Considering the Switch to Natural Gas Buses, By Masami Kojima
14 http://ngvshop.com/board/?topic=6.0
15 CONVERSION FACTORS ENERGY CONTENT OF FUEL (NET CALORIFIC VALUE), Energy Policy and Planning Office, Ministry of Energy, Thailand

43
43
20.2 Investment Analysis for CBG Production
Even though the production of CBG is technically possible, but the production process and marketing the CBG is more complicated than producing electricity from LFG and sell to the central grid. Nevertheless, with proper technical knowhow and identified distribution channel for the CBG, the investment can be attractive for investors.
The following are investment assumptions:
1. The CBG will be used as Diesel equivalent and will be sold at 60% of the diesel market price
2. The investment does not include individual modification of machineries to run on CBG
3. The CBG plant production efficiency is 85% The total investment cost for producing CBG 6 tons/day is 20.3 Billion IDR. With the
assumptions above, the return on investment period will be only 4 years and 3 months as shown in Table 25.5

44
44
Table 20.1 6 tons per day CBG Production Plant Investment and Payback Period in Tanjung Pinang
CBG Capacity 6 ton/day equivalent CBG Economic Factor % / Year
- gasoline price 16
8,150 IDR/L 0.940 L/kg cbg - Interest rate 4.0
- Diesel price 17
9,550 IDR/L 0.770 L/kg cbg - Escalation of inflation 3.0
- LPG price 18
10,750 IDR/kg 0.760 kg/kg cbg - Increase energy value 4.5
- Investment 20.3 Billion IDR - increase in labor costs 2.8
- Production time 85% Sale Price = 60% of Market Price
Year 0 1 2 3 4 5 6 7 8
Income
- Use for Diesel engine 100% 8.21 8.58 8.97 9.37 9.79 10.24 10.70 11.18
Total Income 8.21 8.58 8.97 9.37 9.79 10.24 10.70 11.18
Outlay
- O&M 3.29 3.39 3.49 3.59 3.70 3.81 3.93 4.04
- interest 0.76 0.64 0.53 0.41 0.29 0.18 0.06 -
Total Outlay 4.05 4.03 4.02 4.00 4.00 3.99 3.99 4.04
Net cash flow -20.28 4.17 4.55 4.95 5.37 5.80 6.24 6.71 7.13
cumulative cash flow -16.11 -11.56 -6.61 -1.24 4.56 10.80 17.51 24.64
Payback period - Years 4.21 Payback 4 Year
FIRR (%) 19.64 Period 3 Month Unit : Billion IDR
16 http://www.globalpetrolprices.com/gasoline_prices/#Indonesia, 15-Feb-2015
17 http://www.globalpetrolprices.com/diesel_prices/#Indonesia, 15-Feb-2015
18 http://en.tempo.co/read/news/2015/01/16/056635403/Govt-Announces-New-Price-for-12-Kilograms-LPG, 15-Jan-2015

45
45
21. Utilization of LFG to produce Electricity
The Indonesia Government has the policy to encourage the production of electricity from LFG by offering to purchase the electricity at 1,250.00 IDR/kWh 19. It is assumed that the total
investment cost to produce 1 MWh of electricity from landfill gas in Indonesia will be about 70% of the total cost of the same investment in Thailand. This reduction in investment cost is assumed to be lower because the TPA landfill is local government own, and the investment to produce electricity would also be done by the City. Therefore, there are fees or parts of the investment costs that would not apply to governmental organizations such as license for electricity production fee, as well as other favorable tax incentive such as import tax.
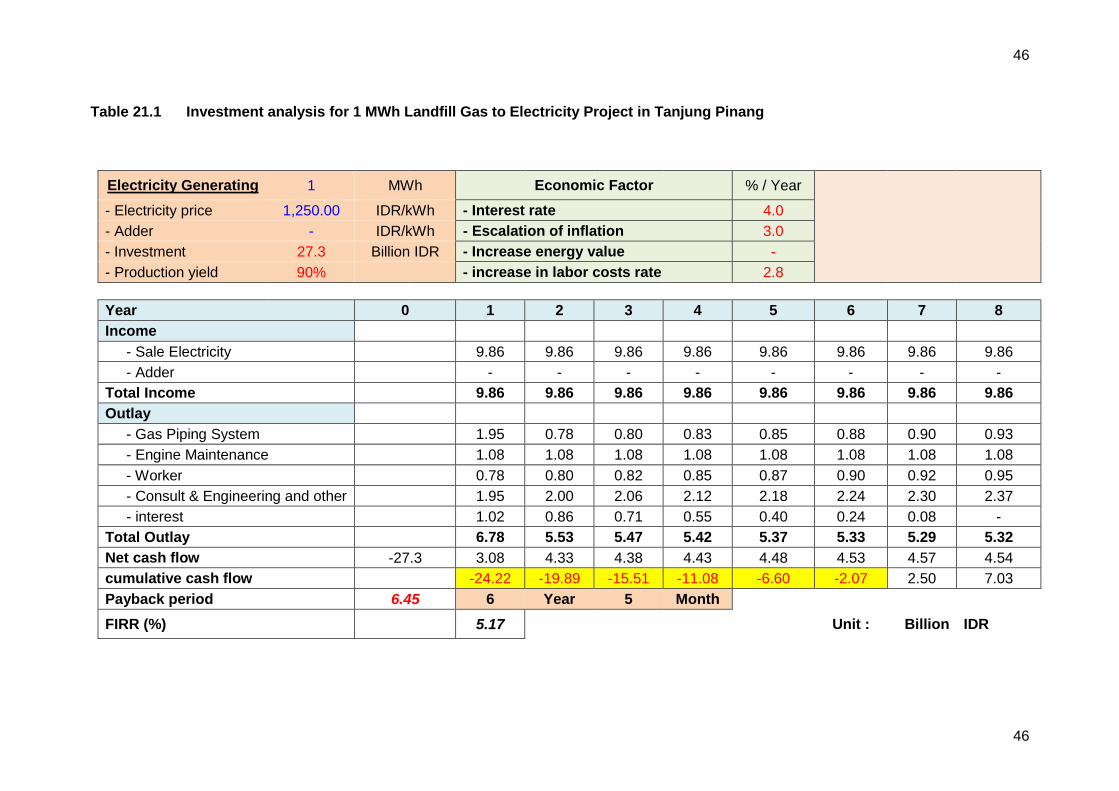
Taking the above assumptions into consideration, the investment cost would be 27.3 Billion IDR and the return on investment period is 6 years and 5 months. The return on investment period of TPA landfill is longer than that of Bantan landfill because the Thai Government buys the electricity at a higher price – more favorable incentive mechanism. The investment analysis is shown in Table 21.3.
The experience from Ban Tan landfill has shown that there are many incentives from different government organizations in Thailand. For example, the Board of Investment of Thailand (BOI) exempt the import tax for heavy machinery for such waste-to-energy project. There is also an 8 years exemption for income tax from revenue gained from selling the electricity. Therefore, it is essential for Tanjung Pinang Municipality to explore different incentives from different National government organizations – this could in effect yield an even shorter return on investment period.
19 MINISTRY OF ENERGY AND MINERAL RESOURCES OF THE REPUBLIC OF INDONESIA
NO. 19 OF 2013, article 4
46
46
Table 21.1 Investment analysis for 1 MWh Landfill Gas to Electricity Project in Tanjung Pinang
Electricity Generating 1 MWh Economic Factor % / Year
- Electricity price 1,250.00 IDR/kWh - Interest rate 4.0
- Adder - IDR/kWh - Escalation of inflation 3.0
- Investment 27.3 Billion IDR - Increase energy value -
- Production yield 90% - increase in labor costs rate 2.8
Year 0 1 2 3 4 5 6 7 8
Income
- Sale Electricity 9.86 9.86 9.86 9.86 9.86 9.86 9.86 9.86
- Adder - - - - - - - -
Total Income 9.86 9.86 9.86 9.86 9.86 9.86 9.86 9.86
Outlay
- Gas Piping System 1.95 0.78 0.80 0.83 0.85 0.88 0.90 0.93
- Engine Maintenance 1.08 1.08 1.08 1.08 1.08 1.08 1.08 1.08
- Worker 0.78 0.80 0.82 0.85 0.87 0.90 0.92 0.95
- Consult & Engineering and other 5 1.95 2.00 2.06 2.12 2.18 2.24 2.30 2.37
- interest 1.02 0.86 0.71 0.55 0.40 0.24 0.08 -
Total Outlay 6.78 5.53 5.47 5.42 5.37 5.33 5.29 5.32
Net cash flow -27.3 3.08 4.33 4.38 4.43 4.48 4.53 4.57 4.54
cumulative cash flow -24.22 -19.89 -15.51 -11.08 -6.60 -2.07 2.50 7.03
Payback period 6.45 6 Year 5 Month
FIRR (%) 5.17 Unit : Billion IDR

47
47
22. Pre-requisite Investments
At this point, it is clear that there is Landfill Gas that can be collected from the TPA’s existing cells. The new cells which apply the SSLTES concept will also add even more Landfill Gas to that of the existing cells. Leachate collection and treatment can also yield Biogas. Finally, by accumulating all the gas produced, the Municipality has different choices of gas utilization – mainly either for CBG or Electricity production. The investment cost and return on investment period for CBG plant and Electricity power plant were also elaborated. However, in order for sufficient amount of gas to be collected for subsequent production of CBG or Electricity, there has to be investments on land preparation according to SSLTES concept, collection piping at the existing landfill cells, as well as leachate collection and treatment system. The investment cost of the above items are elaborated below. Note that the investment or equipment costs below are figures from Thailand market converted to IDR20. a. Collection Piping Network (Cell3 – Cell4)
The area of cell3 is around 4,000 m2 and cell4 is around 15,000 m2. The unit cost to install the recovery pipe system is around 400 THB/m2 or 156,000 IDR/m2. Therefore, the collection pipe network investment cost for the existing landfill cells 3-4 is around 2.964 billion IDR. b. Landfill preparation according SSLTES concept (Cell 5 – Cell 15) During the first year of Landfill preparation for Cell 5 to Cell 15, the cost of investment will be 7.85 Billion IDR. It reduces to 6.63 Billion IDR in the second year. And for the rest of the years in operation will cost 6.30 Billion IDR. Is shown in Table 23.1
Additional cost for the installation of gas collection pipes is shown in
20 390 IDR/THB on Feb-2015 from Google Finance

48
48
Table 22.2. Table 0.1 SSLTES Investment Cost
No. Item Unit
First year
Second Year
Following years
Billion IDR
Billion IDR Billion IDR
1 Excavate Soil m3 0.3900 0.1950 0.1950
2 Filling Soil m3 0.4875 0.1950 0.1950
3 1.5 mm thickness HDPE for basin lining m2 1.0530 0.6318 0.6318
4 1.0 mm. thickness HDPE for temporary covering
m2 - 0.2496 -
5 1.5 mm thickness HDPE for LFG capturing m2 0.0702 0.1404 0.1404
6 Leachate drainage system set 0.1560 0.1560 0.1560
7 Vertical and horizontal drainage pipe system m 0.4680 0.3510 0.3510
8 LFG recovery pipe system m 0.3413 0.1463 0.1463
9 MSW Compacting ton 2.8470 2.8470 2.8470
10 Operating cost and other ls 2.0345 1.7192 1.6319
Total
7.8475 6.6313 6.2943
49
49
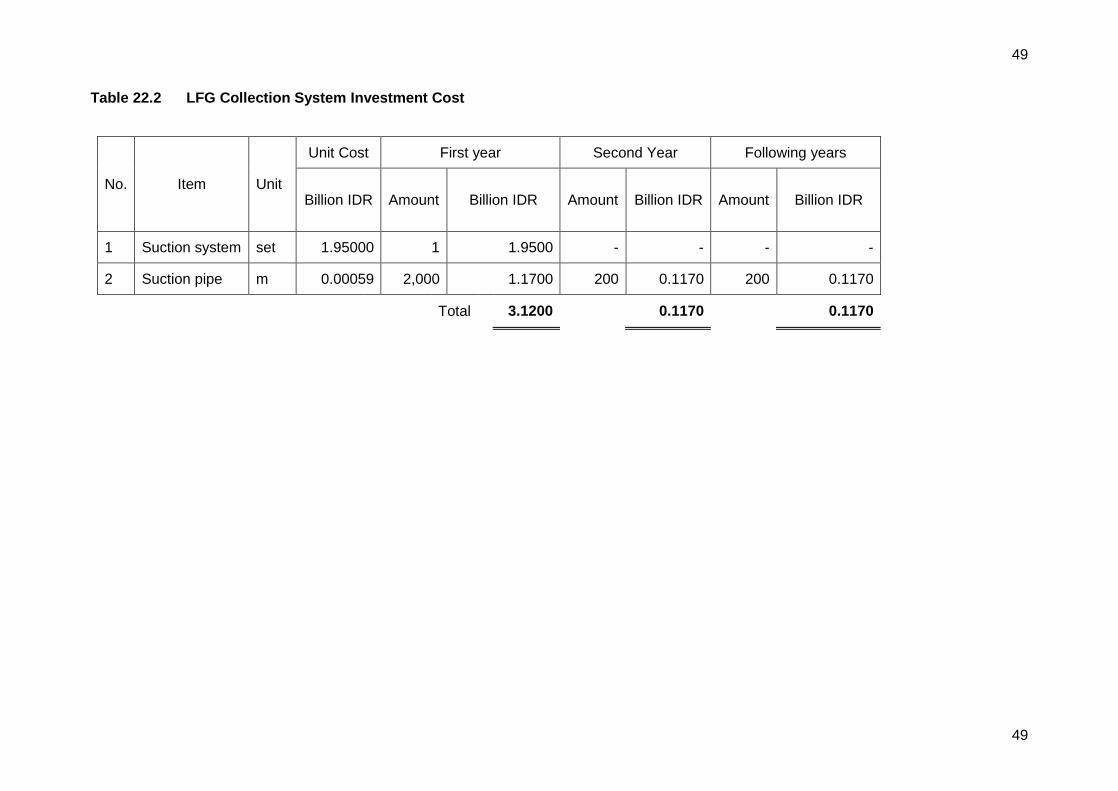
Table 22.2 LFG Collection System Investment Cost
No. Item Unit
Unit Cost First year Second Year Following years
Billion IDR Amount Billion IDR Amount Billion IDR Amount Billion IDR
1 Suction system set 1.95000 1 1.9500 - - - -
2 Suction pipe m 0.00059 2,000 1.1700 200 0.1170 200 0.1170
Total 3.1200 0.1170 0.1170

50
50
c. Investment cost for leachate collection and treatment
The leachate anaerobic treatment digester and open pond investment cost will be estimated as shown in table 21.4.
Table 0.3 Leachate Treatment Plant Investment Cost
23. Summary and Recommendation of investment for Tanjung Pinang TPA landfill
As investment budget is usually quite limited for municipalities, the recommended yearly investment or step by step investments for both type LFG utilization are shown in the Table 23.1 and Table 23.2. For both types of LFG utilizations, the first year investment will be on land preparation and leachate treatment plant. The larger investment will be done in the second year for installation of either electricity plant or CBG plant. The following years will require a relatively lower annual investments for cells expansion and gas collection piping.
Table 23.1 Investment Recommendation for LFG to Electricity
Items List Investment Billion IDR
2015 2016 2017 2018 2019 2020
1 Collection pipe network at existing cells
2.96
2 Landfill preparation 7.85 6.63 6.29 6.29 6.29 6.29
3 Suction System 1.95 1.95
4 Suction Pipe 1.17 0.12 0.12 0.12 1.29
5 LFG Utilization (Electricity production)
27.30 27.30
6 Leachate Treatment Plant 3.0
Total 10.85 40.01 6.41 6.41 6.41 36.83
No Item Amount Unit Cost (Billion IDR)
1 Anaerobic Digester 2,500 m3 2.438
2 Open pond 10,000 m3 0.078
Plastic Lining in open pond 7,000 m2 0.491
Total 3.001

51
51
Table 23.2 Investment Recomendation For LFG to CBG
Items List Investment Billion IDR
2015 2016 2017 2018 2019 2020
1 Collection pipe network at existing cells
2.96
2 Landfill preparation 7.85 6.63 6.29 6.29 6.29 6.29
3 Suction System 1.95 1.95
4 Suction Pipe 1.17 0.12 0.12 0.12 1.29
5 LFG Utilization (CBG production)
20.30 20.30
6 Leachate Treatment Plant 3.0
Total 10.85 33.01 6.41 6.41 6.41 29.83
24. Conclusion
Following Bantan Sanitary Landfill model, Tanjung Pinang Landfill can be improved by applying SSLTES concept to the landfill, which will enable the city to protect the environment, produce energy and other valuable products from waste, as well as achieving sanitary landfill sustainability. The recommendations on how to use the SSLTES concept to alleviate Tanjung Pinang’s pending issues are as follows:
24.1 Lack of budget for Solid Waste Management
There are revenues from each step of the SSLTES solid waste management process; sale of renewable energy from LFG, the excavated valuables, sales of trees grown by using treated leachate as fertilizers. These revenue can be used as additional budget to further improve the city’s solid waste management. In the future, once these revenues are stable and the landfill becomes self-sufficient, the revenues could replace the city’s allocated budget for solid waste management and that budget could be used for other development purposes.
24.2 Odor and Insects problems
The SSLTES concept decreases open space during operation. The only open space at any given time is the area opened for garbage dumping. The rest of the space is either covered by HDPE, temporary plastic sheets, or daily cover (soil). By applying such operation method, less odor will be released into the atmosphere, less spaces for insects to use for colonization, as well as less leachate due to less rain penetration into the landfill. As a result, the nearby communities will be less affected by the landfill.
24.3 Landfill space limitation
In the case of Tanjung Pinang landfill, once the cells are filled, they will be closed and garbage dumping will be done in the other cells, and the process continues until all the space available is used up. The SSLTES concept allows for the excavation of the closed cell (after 15 -20 years, which is when all the organic waste have completely decayed). The excavated cell becomes a ‘new’ cell for dumping. By preparing the landfill cells according to the SSLTES concept, the excavation can be done in a series (one cell after another), and therefore, Tanjung Pinang landfill will never run out of ‘new’ cells to dump garbage.

52
52
24.4 Electricity Shortage
Electricity production from landfill gas and biogas (from leachate) is an additional source of energy. Tanjung Pinang is already on the right path in terms of LFG collection and energy production. However, the challenge is now on how to scale up the LFG collection and electricity production.
According to www.regalianews.com and www.antaranews.com, Tanjung Pinang peak demand of electricity is 52 MWh and the State Electricity Company (PLN) has the capacity to produce between 44 to 49 MWh. Therefore, there is at least 3 MWh deficit2122. Tanjung Pinang landfill has the potential to cover one third of the deficit which is 1 MWh from 240 tons/day of solid waste (Municipal Solid Waste collection efficiency must improve in order to reach 240 tons/day. It is currently at 160 tons/day). Note: The city’s electricity production capacity should be at least 25% more than the peak load demand: 52 MWh + 25% = 65 MWh. Therefore, Tanjung Pinang landfill could only cover a part of the deficit and will not be able to cover the appropriate capacity for the city.
24.5 Leachate Disposal
As mentioned in section 2 above, in the SSLTES concept there is less open space and therefore less leachate is produced. Moreover, any leachate produced from the landfill will be collected and treated and subsequently used as fertilizer to grow ‘non-food’ crops or trees. Therefore, the SSLTES concept reduces leachate production and transforms the leachate into valuable product – both methods prevent the release of leachate into the nature.
24.6 Release of Greenhouse Gas (Methane Gas)
United States Environmental Protection Agency (USEPA) states that methane gas’ impact on climate change is over 20 times greater than carbon dioxide gas. SSLTES reduces the greenhouse gas effect by collecting methane gas from the landfill and leachate for energy production – reducing methane gas’ impact on the ozone and global warming.
24.7 Unhealthy working environment for waste segregators
Currently the waste segregators are segregating the waste from ‘fresh’ waste which contains high amount of organic waste (roughly 65%). The decay of these organic waste produces gases which are harmful to the segregators. Instead of segregating the fresh waste, the segregators could work on the excavated waste from the rehabilitated cells. The organic waste will have fully decayed from the excavated waste, creating healthier working environment for the segregators.
24.8 Jobs creation for the locals
Labor will be required for the new jobs created from the new activities at the landfill
Labor for LFG-to-Electricity power plant
Labor for farming energy crops and growing trees from treated leachate fertilizer
Labor for segregating excavated waste from rehabilitated cells If the city decides to invest in the drying factory (using waste heat from electricity production)
Labor for the drying factory
Local farmers could also dry their agriculture produce at the factory
24.9 Improvement of Tanjung Pinang city image
21 http://regalianews.com/walikota-tanjungpinang-minta-pln-atur-pemadaman-listrik-dengan-bijak/
22http://kepri.antaranews.com/berita/32486/pengusaha-tanjungpinang-tolak-permintaan-pln-gunakan-genset

53
53
As mentioned earlier, Tanjung Pinang already implemented a small scale LFG to Energy model. The city therefore, should take a further step in implementing a larger scale that could have impact on more people. This implementation will show the city’s commitment to solving solid waste management problems, environmental protection, and production of ‘green’ energy – all of which supports Indonesia’s national policies. Not only the landfill will have a better image for the inhabitants but the larger scale LFG to Energy model can also be used as a case study for other cities in the country and cities abroad.
24.10 Concerns for future generations
Land prices will definitely increase in the future, therefore it is important that the landfill is sustainable (by choosing the appropriate landfill management concept). Otherwise, the city will have to continue to purchase more and more land to accommodate future garbage. If the landfill is not sustainable, Tanjung Pinang future generations will face the same problems which many cities are facing at the moment, which are running out of space for solid waste disposal, solid waste impacting the communities and environment, greenhouse gas emission, etc.
24.11 Application of SSLTES
SSLTES is a comprehensive concept which covers several dimensions of solid waste management at the landfill. However, financial investment to apply the concept to Tanjung Pinang landfill does not have to cover all dimensions at one time. It is recommended that Tanjung Pinang landfill starts with the investment in landfill cell preparation for future dumping, gas collection, leachate collection and treatment. Once the amount of solid waste coming to the landfill is stable (at least 200 tons/day) and gas collection is appropriate for electricity or CBG production, then the city could invest in respective production plants. Therefore, the success of one activity will lead to appropriate investment of another activity. The first and foremost activity that Tanjung Pinang landfill should focus on is the preparation of the land according to the SSLTES concept.
24.12 PPP (Public Private Partnership) Option
For efficiency in managing the Municipality’s Solid Waste (collection, disposal, LFG collection, energy production, and landfill rehabilitation), it is recommended that the private sector is contracted to manage the MSW. For example, Chiangmai municipality contracted a private company to manage the collection of solid waste within the city and accumulate the waste at the transfer station within the city. From the transfer station, another private company (the company managing Bantan landfill) is contracted by Chiangmai municipality to dispose the waste. Both companies receive collection and disposal service fee from municipality who has a budget for solid waste management. The companies do the necessary investments required for their respective activities in terms of machinery for collection and disposal, land acquisition, land preparation, and subsequent gas collection and energy production, labor etc. This model of partnership between the municipality and private companies has proven to be very effective for Chiangmai’s solid waste management. The municipality only ensure there is sufficient budget to pay private companies for the collection and disposal services, without having to concern about other investments in machinery, labor, and technological know-how. The private companies ensure that they collect and dispose the waste according to the environmental rules and regulations. The value creation from the solid waste to achieve business profit is entirely the concerns of the private companies.

54
54
25. Appendix A
Leachate Estimation
Leachate can be generated from the precipitation of water into landfill sites via rainfall or other surface water sources and from underground aquifer activity. However, in this report the estimation of leachate is estimated by taking into consideration only the amount of rainfall/precipitation amount in the area. Tanjung Pinang’s precipitation amount is shown in Table 24.1
Table 25.1 Precipitation Amount in Bintan Island23
The Rational Method Runoff Coefficient is a function of the soil type and drainage basin slope 24. A simplified version is shown in Table 25.2.
Table 25.2 Surface runoff Coefficients
Slope Surface runoff coefficient
sandy soil Compacted soil
Flat–Slope 2% Slope 2-7% Slope 7% up
0.05 – 0.10 0.10 – 0.15 0.15 – 0.20
0.13 – 0.18 0.18 – 0.22 0.25 – 0.35
23 http://www.myweather2.com/City-Town/Indonesia/Bintan/climate-profile.aspx
24 Runoff. Urban Drainage and Flood Control District,
http://www.udfcd.org/downloads/pdf/critmanual/Volume%201%20PDFs/050%20Chapter%2005%20Runoff%202008-04%20Rev.pdf

55
55
After rain fall around 28% of the rain water will evaporate25.
Infiltration coefficient
The infiltration coefficient comes from how much water will enter to the landfill and ultimately seep into it. A simplified table is shown in Table 25.3.
Table 25.3 Infiltration Coefficient
No. Landfill Area Infiltration coefficient
1 Operating 0.67
2 Toping covered 0.50
3 Side covered 0.46
The leachate amount will be calculated by the equation below: Q = (Ao*0.67+ AC*0.5 +As*.46)*Rf / (N*1000) Where:
Q = Leachate (m3/d)
Ao = Operating Area (m2) Ac = Close area on the top (m2) AS = Close area beside (m2) Rf = average rainfall (mm/month) N = Days in month = 30 (d)
25 CMU and JICA. 1992. Development of the Appropriate as a Primary Health Care for Human Waste
Treatment and Disposal in Northern Thailand; Joint study project / Chiang Mai University, Ministry Institute of Public Health and JICA

56
56
Following the above equation, the leachate will be estimated and shown in
Table 25.4.
Table 25.4 The Amount of Leachate Calculation
Year
Area average monthly precipitation amount in Bintan (mm)
As Ac Ao Jan Feb Mar Apr May Jun Jul Aug Sep Oct Nov Dec
m2 m2 m2 216.0 101.0 170.0 185.0 154.0 130.0 188.0 193.0 174.0 217.0 271.0 270.0
Leachate m3/d
Year 1 1,900 900 10,200 58.7 27.5 46.2 50.3 41.9 35.4 51.1 52.5 47.3 59.0 73.7 73.4
Year 2 4,400 2,650 8,000 62.7 29.3 49.4 53.7 44.7 37.7 54.6 56.0 50.5 63.0 78.7 78.4
Year 3 6,900 4,400 8,000 77.3 36.1 60.8 66.2 55.1 46.5 67.3 69.1 62.3 77.6 97.0 96.6
Year 4 9,400 6,150 8,000 91.9 43.0 72.3 78.7 65.5 55.3 80.0 82.1 74.0 92.3 115.3 114.8
Year 5 11,900 7,900 8,000 106.4 49.8 83.8 91.2 75.9 64.1 92.6 95.1 85.7 106.9 133.5 133.1
Year 6 14,400 9,650 8,000 121.0 56.6 95.3 103.7 86.3 72.8 105.3 108.1 97.5 121.6 151.8 151.3
Year 7 16,900 11,400 8,000 135.6 63.4 106.7 116.1 96.7 81.6 118.0 121.2 109.2 136.2 170.1 169.5
Year 8 19,400 13,150 8,000 150.2 70.2 118.2 128.6 107.1 90.4 130.7 134.2 121.0 150.9 188.4 187.7
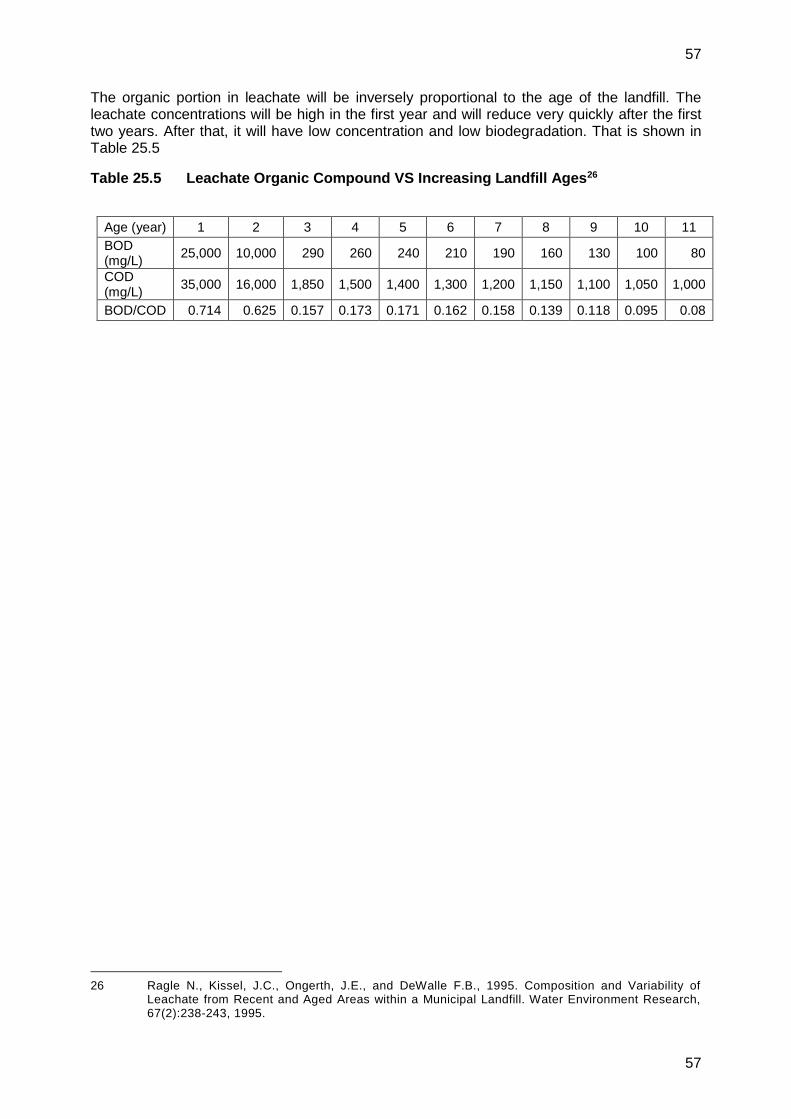
57
57
The organic portion in leachate will be inversely proportional to the age of the landfill. The leachate concentrations will be high in the first year and will reduce very quickly after the first two years. After that, it will have low concentration and low biodegradation. That is shown in Table 25.5
Table 25.5 Leachate Organic Compound VS Increasing Landfill Ages26
Age (year) 1 2 3 4 5 6 7 8 9 10 11
BOD (mg/L)
25,000 10,000 290 260 240 210 190 160 130 100 80
COD (mg/L)
35,000 16,000 1,850 1,500 1,400 1,300 1,200 1,150 1,100 1,050 1,000
BOD/COD 0.714 0.625 0.157 0.173 0.171 0.162 0.158 0.139 0.118 0.095 0.08
26 Ragle N., Kissel, J.C., Ongerth, J.E., and DeWalle F.B., 1995. Composition and Variability of
Leachate from Recent and Aged Areas within a Municipal Landfill. Water Environment Research, 67(2):238-243, 1995.