preliminary draft please do not quote without permission
TRANSCRIPT
Preliminary DraftPlease Do Not Quote without Permission
Market-to-Book, Charter Value, and Bank Risk-Taking – A Recent Perspective
Frederick FurlongFederal Reserve Bank of San Francisco
Simon KwanFederal Reserve Bank of San Francisco
April 2005
AbstractThis paper studies the determinants of bank charter value and its disciplining effect on bank risk-taking in the period since the mid-1980s. Due to significant macro developments in the bankingindustry, including legislation and regulation, consolidation, and technological advances, we findthe magnitude, determinants, and the disciplining effect of bank charter value changed quitesubstantially over time. Our evidence indicates that bank size and operating efficiency were twomain drivers in determining bank charter values. Banking firms seemed to have earned rentsfrom their non-interest revenues, though the impact may have faded in recent years. Chartervalues of banking organizations did not appear to be systematically related to traditional loansand deposits, except savings and small time deposits. The disciplining effect of charter value onbank risk-taking was robust and significant during the earlier periods when the average chartervalue was low, and became weaker more recently despite a substantial increase in average chartervalues. The diminishing disciplining effect is consistent with the substantial increase in bankcapitalization since the early 1990s, and the proliferation of capital market discipline boughtabout by supervision and regulation that realigned bank risk-taking with banking firms’ cost ofcapital.
Key words: Q-ratio, bank charter value, bank risk-takingJEL classification: G21, G32, G34
Please send correspondence to Simon Kwan, Research Department, Federal Reserve Bank of SanFrancisco, 101 Market Street, San Francisco CA 94105, U.S.A. Email: [email protected] Telephone: 415-974-3485
Thanks are due to Zena Knight for excellent research assistance.

1
Market-to-Book, Charter Value, and Bank Risk-Taking – A Recent Perspective
I. Introduction
Several recent studies present theoretical models demonstrating the disciplining effects of
bank charter value on bank risk-taking and the implications for bank supervision and regulation
(see for example Hellmann et al. (2000) and Repullo (2004). In these models, the charter value
represents the difference between the market value of a bank and its book value. With bank
supervisors basing closure decisions on book-value capital measures, a bank has an incentive to
maintain a sufficiently high book capital ratio and restrain risk-taking to limit the probability of
its closure with positive charter value. The theoretical models of the disciplining effects of bank
charter value derive credence from studies such as Keeley (1990), which found an empirical
relation between the decline in charter values of U.S. banking organizations in the 1960s and
1970s and increases in measures of bank risk and, thus, the exposure of the federal deposit
insurance system to bank failures.
In this study, we re-examine the empirical link between bank charter values and bank
risk-taking by focusing on the experience of more recent years. The re-examination is motivated
in part by the changes in banking legislation and regulation, banking structure, and technology
that likely have altered charter values through changes in the value of the federal safety net, the
degree of competition for financial services, gains in efficiency in banking, and financial
integration. Moreover, since the early 1990s, the increase in book-value capital ratios, the linking
of capitalization to risk under the Basel Capital Accord, and greater supervisory focus on risk
management in banking may have affected the marginal effects of charter values on risk-taking
among U.S. banks.

2
The landmark legislative changes shaping U.S. banking system today include the
Depository Institution Deregulation and Monetary Control Act of 1980, the Federal Deposit
Insurance Corporation Improvement Act (FDICIA) of 1991, the Riegle-Neal Interstate Banking
and Branching Efficiency Act of 1994, and the Gramm-Leach-Bliley Financial Modernization
Act (GLB) of 1999. On banking regulation, the 1988 Basel Capital Accord and the soon-to-be
implemented Basel II have reformed bank capital regulation, linking capital requirements more
explicitly to bank risk- taking. Furthermore, the Prompt-Corrective-Action and the Least-Cost-
Resolution provisions in FDICIA, the movement towards risk-based deposit insurance pricing,
and the shift in supervisory focus from bank portfolio quality to bank risk management have
promulgated the realignment of bank risk-taking with a banking firm’s cost of capital and hence
capital market discipline.
These legislative and regulatory changes were responses to, and enabled changes in, the
banking system. The Riegle-Neal Act, for example, allowed banking firms to consolidate their
individual bank charters across state lines to streamline management and operations, potentially
cutting costs along the way. Facilitating interstate-banking also eased entry conditions in banking
and increase competitive conditions. At the same time, the consolidation in banking since the
mid-1980s reduced the number of banking organizations. This led to a notable increase in
concentration in the banking industry at the national level. For example, the largest ten (fifty)
bank holding companies controlled 60.6 (76.3) percent of the banking industry’s assets in 2004,
compared to only 35.4 (64.7) percent in 1992. However, the impact of banking consolidation on
local market concentration has been somewhat more limited, suggesting the anti-trust policies
may have contained some of the potential adverse effects on competition (Laderman 2005).

1 See for example, Berger (2003), Jorgenson and Stiroh (2000) and Stiroh (2002) fordetail analysis of the advances in information technology and the acceleration in productivity inbanking in the U.S.
3
As a result of the passage of the GLB Act, a number of banking firms took advantage of
their newly granted banking powers to expand securities and/or insurance activities. These
financial holding companies have the potential to reap certain scope economies that were
impossible before. Also, with the rapid advances in information technology taking place during
this time period, it is quite possible that banking organizations now are able to attain levels of
scale and scope economies, as well as operating efficiency, that were not feasible just a couple of
decades ago.1
In light of these developments, we re-examine bank charter values and bank risk-taking in
the period since the mid-1980s. With the supervisory and regulatory emphasis on bank capital
and the proliferation of capital market discipline during the last ten years, we are particularly
interested in whether the disciplining power of bank charter value has changed. Understanding
the determinants of bank charter value and its effects on bank risk-taking are important to policy
makers. They have implications for competition policy, moral hazard in banking, and bank
safety and soundness.
The rest of this paper is organized as follow. Section II discusses the macro changes in
the U.S. banking industry over the last twenty years and their implications for bank charter
values. Section III motivates the employment of the market-to-book capital ratio to measure
bank charter values, and models the bank charter value and its effects on bank risk-taking. Data
and descriptive statistics on our measure of bank charter value are presented in Section IV.
Section V presented our empirical findings, followed by the conclusions in Section VI.

4
II. Macro Developments in U.S. Banking
In this section, we discuss four major developments in the U.S. banking industry that
have implications for banking firms’ charter values from 1986 to 2003, the study period for our
empirical analysis. First is banking legislation and regulation. Second is banking consolidation.
Third is technological innovation. Forth is the increase in book-value capitalization among
banking organizations. These developments are argued to impact bank charter values through
their effects on the value of the federal safety net, especially the value of deposit insurance,
banking competition, banking efficiency, and financial integration.
A. Legislation and Regulation
The three major pieces of banking legislation that were enacted during our study period
were the Federal Deposit Insurance Corporation Improvement Act of 1991 (FDICIA), the Riegle-
Neal Interstate Banking and Branching Efficiency Act of 1994 (Riegle-Neal), and the Gramm-
Leach-Bliley Financial Modernization Act of 1999 (GLB). FDICIA was passed to reform the
deposit insurance system, in which moral hazard problems were widely believed to have
contributed to the thrift and banking crisis in the 1980s. A main goal of the act was to
recapitalize the depleted deposit insurance funds. The aim of other major provisions was to
lessen the moral hazard problem associated with the government deposit insurance program.
These provisions include: Prompt-Corrective-Action requiring the FDIC to intervene with
troubled banks earlier and more vigorously based on the levels of book-value capital ratios; risk-
based insurance premiums allowing the FDIC to charge insurance premiia according to some
simple measures of bank risk; Least-Cost Resolution requiring the FDIC to resolve bank failures
using methods which produce the least cost to the deposit insurance system; and reforming Too-
2 A number of event studies detected too-big-to-fail subsidy incidental to the FDICIA,including Angbazo and Saunders (1996) and Wall (1993).
5
Big-To-Fail by specifying the conditions under which a bank is considered too big to fail. A
large body of banking literature studies the effectiveness of FDICIA in redressing the moral
hazard problem inherent in the deposit insurance system [see, for example, Benston and
Kaufman (1997) and Mishkin (1997)]. The general consensus is that the FDICIA was a step in
the right direction. However, while the concepts of prompt-corrective-action and risk-based
insurance premium are very desirable, the way they are implemented under FDICIA are prone to
measurement problems in bank capital and bank risk that greatly undermine their effectiveness.
A more critical shortcoming of FDICIA is argued to be its Too-Big-To-Fail provision [see Stern
and Feldman (2004) and Kaufman (2002)]. Under FDICIA, a bank can be declared too-big-to-
fail so that insured and uninsured liability holders would be protected, only if not doing so would
have serious adverse effects on economic conditions or financial stability. To invoke too-big-to-
fail, a two-thirds majority of both the Board of Governors of the Federal Reserve System and the
directors of the FDIC, as well as the approval of the secretary of the Treasury, would be required.
Hence, FDICIA enacted too-bog-to-fail and arguably lessened its ambiguity in the mind of
market participants. This could have increased the potential too-big-to-fail subsidy for very large
banking firms.2
The Reagle-Neal Interstate Banking and Branching Efficiency Act greatly relaxed the
federal restrictions on interstate banking, effective in 1997. In the years leading up to Reagle-
Neal, most states had taken steps to liberalize rules for entry by out-of-state banking
organizations. Reagle-Neal opened the way for nationwide interstate banking and, very

3 Riegle-Neal Act prohibits any merger or acquisition that results in the combinedbanking organization controlling more than 10 percent of the nation’s domestic deposits. Abanking organization could exceed the deposit cap through internal growth, but it would not beallowed to engage in any more mergers or acquisitions.
6
importantly, interstate branching. Prior to the act, a banking firm had to enter a new state by a
separately chartered bank subsidiary of the holding company. By allowing interstate banking
through branching, the act greatly facilitated improved efficiency in operating a banking
organization across state lines.
Hence, it is quite possible that Reagle-Neal added value to a banking franchise by
allowing more concentration at the national level along with reducing operating costs associated
with interstate banking.3 Moreover, Reagle-Neal may have added value for some banking
organizations by raising the chance of their being acquisition targets [Carow and Heron (1998)].
Jayaratne and Strahan (1998) provided empirical evidence regarding the effects of easing
branching restrictions. They showed that bank performance improved significantly after state
restrictions on bank expansion were lifted. Specifically, operating costs and loan losses decreased
after states permitted statewide branching and, to a lesser extent, after states allowed interstate
banking. They argued that improvements following branching deregulation appeared to occur
because more efficient banks grew at the expense of their less efficient rivals and the reduction in
banks' costs were passed along to bank borrowers in the form of lower loan rates. Whether this
meant a decline in market power is not clear. Even banks with market power would be expected
to lower loan rates, for example, in the wake of improved efficiency.
The Gramm-Leach-Bliley Financial Modernization Act legalized the integration of
commercial banking, securities brokerage and dealing, and insurance activities. It greatly

4 Furlong and Keeley (1989) argued that more stringent capital regulations wouldconstrain bank risk-taking.
7
expanded banking power and thus allowed banking firms to realize potential scope economies by
engaging in a mix of financial activities. A number of large banking firms had been engaging in
limited securities activities through their so-called Section 20 subsidiaries before GLB [see Kwan
(1998)]. However, GLB removed many restrictions on operating a Section 20 subsidiary and
thus allowed greater efficiency. Also, GLB opened up new avenues for large banking firms to
become even larger, perhaps permitting these mega-firms to solidify further their too-big-to-fail
status. The combination of scope economies, efficiency enhancement, and the too-big-to-fail
subsidy could lead to an increase in banking firms’ charter values. Event studies suggested that
the passage of the GLB Act increased shareholders’ wealth among larger banking institutions
[Carow (2001a, 2001b), Carow and Heron (2001), Carow and Kane (2001) and Collins, Kwag,
and Yildirim (2002)].
In addition to legislative developments, there was a profound change in prudential
regulation and supervision of banks in the U.S. over the last twenty years. As part of the
legislation, FDICIA included increased banking supervision to reform the deposit insurance
program, and the GLB Act called for umbrella supervision of financial holding companies.
Specifically, on capital regulations, the Basel Capital Accord was the first step towards
risk-based capital requirements.4 FDICIA tied prompt corrective action to the level of bank’s
book-value capital. The GLB Act stated that the ability to expand banking powers is dependent
on the capitalization.
On banking supervision, regulators shifted from emphasizing the examination of

5 CAMEL rating is the supervisory rating of the quality of bank capital (C), assets (A),management (M), earnings (E), and liquidity (L), with one being the best and five being theworst.
6 Flannery and Sorescu (1996) found that subordinate debtholders disciplined bank risk-taking only after 1989, and did not find any detectable bond market discipline before that. Onthe other hand, Covitz et al. (2002) found that, after accounting for liquidity premia, bankingrelated subordinated debt spreads were sensitive to organization-specific risks in the mid-1980s,and that the risk sensitivity of such spreads was about the same in the pre- and post-FDICIAperiods.
8
individual loans to the examination of the risk management process, including internal controls
and risk management. The traditional CAMEL rating assigned by banking regulators upon
banking examination was changed to CAMELS to explicitly emphasize the importance of risk
management in the S rating.5 More recently, the BASEL II Accord prominently places banking
supervision as one of the three pillars in the new proposal, along with capital requirements (Pillar
one) and market discipline (Pillar three).
While the overall goal of prudential regulation is to maintain bank safety and soundness,
one specific objective is to enhance the alignment of bank risk-taking with the banking firm’s
cost of capital to minimize the moral hazard problem. A number of studies found evidence that
interest rates on uninsured bank-related debt were sensitive to bank risk-taking. In the case of
subordinated debts, some studies suggested that market sensitivity to risk rose in the 1990s
following the reform of prudential regulations and the transformation of banking supervision
[Flannery (1998), Federal Reserve (1999), Flannery, Kwan, and Nimalendran (2004)].6 If the
capital market became more effective in disciplining bank risk-taking, that should reduce the
incentives for risk-taking stemming from exploiting the federal safety net. To the extent that
banks retain at least part of the value of the federal safety net, higher risk premia on uninsured

7 In the U.S., all bank mergers must be approved by banking regulators. When aproposed bank merger is deemed to have significant effects on competition, the applicant mustaddress those concerns, often via divestiture of certain banking offices or operations in
9
bank debt would work towards lowering bank charter values. Perhaps more importantly, with
less distortion to risk-taking associated with the federal safety net, at the margin, the disciplining
effect of bank charter value would be expected to fall.
B. Banking Consolidation
Our study period was marked by a substantial degree of banking consolidation in the U.S.
Figure 1 shows the number of large bank mergers from 1986 to 2003. While the number of all
bank mergers was increasing steadily during this time period, large bank mergers, where the
combined total assets of the acquiring firm and the target firm exceed $1 billion, was rising much
more rapidly. Among large bank mergers, the number of interstate bank mergers where the
acquirer and the target were headquartered in different states escalated noticeably after the
passage of the Riegle-Neal Act in 1994 that permitted interstate bank mergers starting in 1997.
To the extent that these large interstate bank mergers were market-expansion mergers, where the
acquirer and the target had little overlapping operations in their respective banking markets,
banking concentration at the national level rose. The impact of increase national presence and
size on market power is unclear. Research suggests that the markets for many banking products
and services remain local in nature, despite the advances in information technology and
electronic commerce [Rhodes (2000)]. Over the past two decades, average concentration of local
banking markets has increased on balance, though mainly due to increases among markets with
relatively low initial levels of concentration [Laderman (2005)]. Still, the higher average
concentration could increase banking firms’ market power to some extent.7

conjunction with the merger, before it receives regulatory approval. In addition, the U.S.Department of Justice has the authority to challenge any mergers that are deemed harmful tocompetition.
10
In addition to possible direct effects from increased market power from banking
consolidation, banking firms’ charter values could rise as a result of scale economies. A large
body of literature has documented the presence of scale economies in banking, and the survey by
Humphrey (1990) provided a good overview of the early findings. Although earlier research
seemed to indicate that the optimal scale may be less than the size of today’s mega-banks, the
changing banking environment – specifically, the passage of Reagle-Neal and Gramm-Leach-
Bliley as well as advances in technology – could push the optimal scale further out the size
spectrum. More recent research on megamergers suggested that merged banks did experience
higher profit efficiency from increased revenues, stemming from providing higher value-added
products and services to customers than a group of individual banks [Akhavein, Berger, and
Humphrey (1997)]. As discussed earlier, a banking organization of certain scale might also
realize a too-big-to-fail subsidy due to the market’s perception of de facto government backing of
a mega-institution in times of crisis.
In addition to scale and scope economies, the potential benefits of risk diversification due
to market or product expansions could add value to the banking franchise. Mester, Huges, Lang,
and Moon (1999) suggested that geographic expansion would provide diversification benefits to
a banking organization, not only reducing its portfolio risk on the asset side, but also lowering its
funding risk on the liability side by spreading funding activities over a larger geographic area.
Kwan (1998) and Kwan and Laderman (1999) suggested that product expansion could yield
diversification benefits, most notably between banking and securities activities, but less so

8 In Furlong (2001) value-added in banking is measured as the sum of net-interest income and gross non-
interest income. Labor inputs are measured as the number of employees and the dollar value of personnel expenses.
11
between banking and insurance. Thus, a bigger bank is expected to be less vulnerable to
economic shocks, which could reduce its cost of capital, compounding the benefits of scale and
scope economies from the production processes alone.
On the other hand, bank managers may have the incentive to undertake mergers for
personal reasons, including the desire to run a larger firm and the possibility to maximize their
own personal welfare, which could mitigate or even offset the above mentioned economic
benefits of bank mergers. Empirical research has shown that managerial compensation and
perquisite consumption tend to rise with firm size. Kwan and Eisenbeis (1999) found that in
their event study of stock market reactions to megamerger announcements in the 1990s, on
average, the market did not view mergers of publicly owned banking companies as providing a
significant gain to total wealth of the shareholders of the combined company. Thus, on average,
the market seemed to be skeptical to the value creation in mega-mergers.
C. Technological Innovations
There is evidence that the drive to increase efficiency in banking began in earnest in the
early 1980s. Furlong (2001) showed that labor productivity growth in banking turned up sharply
in the early 1980s and continued at a strong pace into the 1990s. The acceleration was evident in
both the productivity measure used by the Bureau of Economic Analysis and in the measure of
value-added in banking relative to the value of labor inputs.8 Furlong argued that the timing of
the boost to labor productivity in banking suggested that the impetus for firms to push for greater
labor productivity coincided with deregulation and increased competition, which led to the

12
acceleration of the broad restructuring in banking.
As an information-based industry, part of the improvement in productivity is argued to be
related to banks’ being early investors in information technology (Furlong 2001). Banks’
investing in information technology (IT) have reduced cost of back-office operations and
facilitated innovations in financial products and delivery systems [see Berger (2003)]. Banks
also have used IT in conjunction with the advances in financial theory related to assessing and
managing risk.
Despite the early increases in labor productivity, bank profitability languished through
much of the 1980s and early 1990s. Moreover, after the early 1990s, the impact of innovation on
bank performance appeared to have been more than just improved efficiency through lowering
costs. Berger and Mester (2003), for example, found that for the 1991-97 period, improved
performance in banking stemed from improved market conditions and profit efficiency, while
cost efficiency in banking actually fell. They argued that innovation led to higher value-added
banking services that boosted revenues more than costs. For example, traditional banking
services likely have been enhanced by the proliferation of ATMs, greater use of banking phone
centers, and the Internet. These innovations, along with the expansion into new activities and the
growth of more sophisticated financial services activities have changed the quality and nature of
bank output.
One indication of the impact of innovation on bank revenue is the increase in the relative
importance of non-interest income. Figure 2 shows the ratio of non-interest income to the sum of
net-interest income and non-interest income at banks since the mid-1980s. In the figure, banks
are grouped by size related to their percentile ranking of total assets. Banking organizations in
13
the top tenth percentile by maximum total assets are classified as Large. Firms at the tenth to
fiftieth percentile are Medium, and firms in the bottom fiftieth percentile are Small. The evidence
in the figure is consistent with the notion that enhancement in revenue from innovation boosted
bank performance after the early 1990s.
The improvement in efficiency in banking in terms of operating revenues relative to
expenses is shown in figure 3. The figure shows the ratios of the sum of net-interest revenue and
non-interest revenue to non-interest expenses for different size groupings of banking
organizations. This ratio is a measure of value-added in banking relative to operating expenses,
and abstracts from expenses related to allocations to loan loss reserves. For each grouping, the
ratio shows a pickup after the early 1990s, with the rise most notable among large banking
organizations.
For given levels of market power, improved efficiency in banking could raise charter
values. However, the ratios in figure 3 also could be influenced by changes in market power
among banks. From our earlier discussion, there have been countervailing currents affecting
competition in banking such as increased local concentration on the one hand and less restrictive
entry through branching on the other. Also, financial innovations, while not fully negating the
local dimension of certain banking services, likely have broadened the geographic scope for
many banking services, and raise doubts regarding a net increase in market power. For example,
the findings in Berger and Mester (2003) indicated that variations in local market concentration
among banks did not explain much of the improved profit efficiency in 1991-97 period. They
argued that the rents earned by banks might reflect an on-going innovation process; one in which
rents from a given innovation earned by first movers dissipated as the effects of new innovations
9
Furlong (1992) showed that the average target capital ratios for all banks rose from about7% during the 1985-1989 period to almost 9% during the 1990-1991 period. This increase wasobserved for both large banks, which were more likely to be affected by Basel Regulatorychanges, and for small banks.
14
took hold.
D. Recapitalization
The first Basel Capital Accord, which took effect in the early 1990s, broke new ground by
explicitly tying the level of required capital to the riskiness of a bank’s assets. More importantly,
though, Basel I was about increasing capital in banking and putting capital on the front line in
risk management, both for supervisors and for banks. In part due to the impetus from capital
regulation and improved performance of U.S. banks in the 1990s, book-value capitalization
increased substantially. Figure 4 shows book value equity capital to assets ratios for the different
size groupings of bank holding companies. For each grouping, book-value capital ratios began
rising very sharply in the early part of the 1990s before stabilizing.9 The large bank grouping had
another surge in capitalization in more recent years.
The increase in book value capital among banks has been more than just meeting
minimum requirements. Today, ninety-seven percent of U.S. banks are considered not just
adequately capitalized, but actually well-capitalized, and the average risk-based total capital
ratio sits at close to 13 percent. That compares with guidelines indicating that a bank with a 10
percent total risk-base capital ratio generally would be considered well-capitalized. The
substantially higher book-value capitalization of U.S. banking organizations likely has contained,
if not materially reduced, the disciplining effect of bank charter value on bank risk-taking (to be
discussed more fully in next section).

10 Other studies such as Keeley (1990) employed an ex post Tobin Q measure calculatedas the ratio of market-value assets (market equity plus book liabilities) to book-value assets. Ourmeasure of market equity to book equity ratio is highly correlated with the ex post Q measure.
15
III. Model
In a perfectly contestable market, all profits are competed away so that existing
shareholders earn just the competitive rate of return on their capital that was supplied to the firm.
In that world, the capital market values each dollar of shareholders’ equity exactly one dollar so
that the market value of capital equals the book value of capital. Suppose the world has changed
so that the firm can earn an abnormal profit on its capital. The present value of the future stream
of abnormal profits will accrue to existing shareholders. As such, the market value of the firm’s
capital equals the sum of the book value capital plus the present value of future rents. Thus, the
market-to-book capital ratio can be used to measure the present value of the firm’s future rents,
or in the case of banking, the value of the banking firm’s charter.10
A banking firm can earn rents when it has market power in the loan and/or deposit market
where it can charge an above normal loan rate and/or pay a below normal deposit rate. Given a
degree of market power, rents also would be affected by innovations shifting a bank’s cost of
producing banking services. Even without market power, a firm could earn rents temporarily if it
has access to a superior production technology that is not immediately available to other
institutions, the so-called first-mover effect. Finally, a banking firm with market power can earn
rents from extracting wealth from the deposit insurance system when the insurance premium is
underpriced.
Abstracting from the deposit insurance subsidy, we model the banking firm’s charter
value as a linear function of its revenue mix, loan portfolio composition, deposit composition,

16
and operating efficiency:
CV = f (NIC, CILOAN, CSLOAN, RELOAN, TRAN, NONTRAN, CD, EFFCY) + ,, (1)
where,CV = market value equity / book value equity;NIC = non-interest revenue / (non-interest revenue + net interest income);CILOAN = commercial loans / total assets;CSLOAN = consumer loans / total assets;RELOAN = real estate loans / total assets;TRAN = transaction deposits / total liabilities;NONTRAN = nontransaction deposits / total liabilities; CD = large Certificate of Deposits / total liabilities;EFFCY = (non-interest revenue + net interest income) / non-interest expenses.
In equation (1), to the extent that banks derive charter value from different types of
lending, the effects are modeled to be proportional to shares of total assets. In the case of
deposits, the effects are modeled as proportional to total liabilities. In the case of NIC, ideally,
we would want the present value of the revenue streams. The use of the quarterly measures from
the income statements is meant to be a proxy for this measure.
In the case of EFFCY, we ideally would like to measure the quantity of banking products
and services produced rather than the dollar revenues from those products and services because
the revenue stream also reflects the effects of differences in market power among banks on their
rents. Moreover, a banking firm’s operating efficiency is a function of its product and input mix.
To address these measurement issues, we would like a measure of efficiency that is “free” of the
effects of differences in market power on rents and also controls for the firm’s output mix. To
derive such measure, we orthogonalize EFFCY by the other right-hand-side variables in (1). In
doing so, we assume market power and costs differ based on a banking organization’s activities.
That is, we regress EFFCY on NIC, CILOAN, CSLOAN, RELOAN, TRAN, NONTRAN, and

11 Also, as shown in Berger and Mester (2003), macroeconomic developments such aschanges in interest rates affect bank performance, which would be expected to affect anorganization’s market valuation.
17
CD and use the residuals from this regression to fit equation (2) below:
CV = f (NIC, CILOAN, CSLOAN, RELOAN, TRAN, NONTRAN, CD, OEFFCY) + ,, (2)
where,OEFFCY = orthogonalized EFFCY.
As discussed earlier, macro developments in the banking industry could lead to
systematic changes in bank charter values that were unrelated to underlying firm characteristics.11
In estimating equation (2) using pooled time-series cross-section observations, we include time
effect dummies to allow for the intercept term to shift over time. However, the macro
developments could also alter how firm characteristics determined bank charter values over time.
For example, changes in market structure and technology could change how the rents were
generated from loan and deposit markets. Thus, to allow for complete flexibility in the structural
relationship depicted in equation (2), we re-estimate the model using only cross-sectional data at
each time period to examine if and how the determinants of bank charter value may change over
time.
The coefficient of NIC in equation (2) tests whether banking firms earn rents from
providing financial services that generate non-interest revenues. The coefficients of CILOAN,
CSLOAN, and RELOAN test whether banking firms earn rents from making commercial loans,
consumer loans, and real estate loans, respectively. For lending, the market power would be
expected to derive in part from servicing local borrowers. In the case of CILOAN, modern
banking theory also postulates that banking firms have information monopoly on their business

12 Nontransaction deposits include savings and small-denomination time deposits.
13 This is consistent with the prompt corrective action under FDICIA where the closurepolicy does not take into consideration bank charter values.
18
borrowers. The coefficients of TRAN and NONTRAN test whether banking firms have market
power in the local deposit market.12 To the extent that the market for large CDs is national,
banking firms are expected to have little market power in the CD market so that the coefficient of
CD is expected to be indistinguishable from zero. Finally, the coefficient of OEFFCY tests
whether any cost savings from operating efficiently accrue to stockholders.
To model the effects of charter value on bank risk taking, we starte with Merton’s (1977)
model of a banking firm’s deposit insurance as a put option. Insured banks are examined by the
deposit insurer or their primary regulators, usually annually. Upon examination, if the insured
bank is found to be insolvent, that is, bank assets (A) worth less than bank debts (B), it
essentially puts the bank’s assets, A, to the deposit insurer at the face value of the bank’s debts,
B. The deposit insurer pays off debt holders by making up the difference between A and B and
equity holders receive nothing.13 If A is greater than B, however, the equity holders have a claim
on the firm worth A - B + C where C is the value of the bank charter. Thus, at the examination
date, T, the value of bank equity, E, can be written as:
E = 0, if A < B, (3) = A - B + C if A $B.
Assume that A follows the diffusion process
dA = " A dt + F A dz, (4)
where " is the instantaneous expected growth rate of A, and F is the instantaneous standard

19
deviation of the rate of return and dz is a Weiner process. Using standard option pricing model,
Marcus (1984) showed that the value of bank equity,
E = [A N(d1) - e-rT B N((d2)] + e-rT C N((d2), (5)
wherer = the risk-free rate,d1 = (ln(A/B) + (r+F 2/2)T)/F %T,d2 = d1 - F %T,N(•) is the cumulative standard-normal density function.
The first bracketed term in equation (5) is the same as the value of bank equity derived from
Merton (1977) and the contingent claim to the charter value C has present value equal to the last
term in (5).
When C is positive, it can be shown that a bank’s desire to take risk can be ambiguous,
depending on two parameters: the size of C and its level of capitalization. Specifically, regarding
capital decision, adding capital increases the market value of equity at rate ME/MA or existing
equity holders’ claims at rate
ME/MA - 1 = N(d1) + e-rT C n(d2)/(AF %T) - 1, (6)
where n(•) is the standard normal density function.
We normalize equation (6) by B so that A is the bank’s asset-to-liability ratio, and C is a multiple
of liabilities. To evaluate (6) by numerical simulation, we assume risk-free rate to be 4% and
asset standard deviation to be 5%. Figure 5 charts (ME/MA - 1) against A at different values of C.
Under our parameter assumptions, there exists an A* such that (ME/MA - 1) is negative when A <
A*, and positive when A > A*. Thus, when the bank’s asset-to-liability ratio is below the
threshold A*, shareholders’ wealth is increased by further lowering capital. When bank capital
exceeds certain threshold such that A > A*, shareholders’ wealth is increasing with capital

20
infusion to protect the claim on the charter value. However, when A is sufficiently large, that is,
when the bank is sufficiently well capitalized, (ME/MA - 1) approaches zero so that the marginal
benefit of adding capital to protect the charter is diminishing with A when A > A’ where A’ is
the maximum of ME/MA - 1. Also notice that A* decreases in C so that the higher the charter
value, the lower the critical value of A* above which banks would add capital to protect the
charter.
Turning to asset portfolio decision, differentiating (5) with respect to F yields the rate of
change in shareholders’ wealth from raising asset risk.
ME/MF = Be-rT n(d2)%T - e-rT C d1 n(d2)/F. (7)
The first term in (7) is positive and reflects the standard moral hazard problem of raising risk to
increase the value of the deposit insurance put option. However, with positive C, the second
term due to the charter value counter acts the standard risk exploitation. Using similar parameter
values as in figure 5, figure 6 shows that ME/MF falls with C, for a given A. Also notice that for a
given C, ME/MF falls with A so that when A is sufficiently large, ME/MF approaches zero.
Equations (6) and (7) imply that charter value has a disciplining effect on bank risk-
taking. That is, below certain A, ceteris paribus, banking firms with higher charter values are
likely to hold more capital and take less risk to protect their valuable charter. However, the
strength of the disciplining effect depends on A, or the capitalization of the bank firms. That is,
when the banking industry is well capitalized, we expect the disciplining effect of bank charter
values to diminish, even though the charter value itself may be high.
To empirically study the disciplining effects of charter value on bank risk-taking, we
propose the following model:

14 See Boyd and Graham (1988) for the underlying concept of the Z-score.
21
RISK = g (CV) + *, (8)
where RISK is measured by(1) CAPITAL = book capital / total assets;(2) PASTDUE = pastdue and non-accrual loans / total loans; (3) NONSYS = idiosyncratic risk of holding the banking firm’s stocks; and(4) Z-SCORE = probability of failure derived from equity returns.
CAPITAL measures book-value capitalization, which is used by regulators in their
closure policy and thus determines whether a bank keeps or lose its charter. PASTDUE is an
accounting measure of the credit risk in the banking firm’s loan portfolio. Firms taking more
credit risk are expected to have more PASTDUE. NONSYS represents a market measure of the
idiosyncratic risk of holding the banking firm’s stocks. NONSYS is the standard deviation of the
residuals from regressing the banking firm’s daily stock returns on a stock market index. Under
the Capital Asset Pricing Model, NONSYS captures the non-systematic risk of the banking
firm’s equity. Finally, Z-SCORE, computed as the ratio of the stock return to the standard
deviation of return, measures the probability of failure using market data.14 Firms with higher Z-
SCORE have lower bankruptcy risk.
In order for bank charter value to discipline bank risk-taking, CV in (8) is expected to
have a positive effect on CAPITAL and Z-SCORE, and a negative effect on PASTDUE and
NONSYS. In equation (8), to the extent that charter value could be dependent on bank risk due
to deposit insurance subsidy, there is a potential simultaneity between RISK and CV. Hence, we
replace CV in equation (8) by the fitted value of CV from estimating (2) to remove the possibility

15 We also estimate equation (8) using the lagged charter value, which yields qualitativelysimilar results.
22
(9)
of simultaneity bias.15 The final model to be estimated is:
In estimating equation (9) using pooled time-series cross-section observations, we include
time effect dummies to allow the intercept term to shift over time due to macroeconomic shocks.
However, the disciplining effect of bank charter value on bank risk-taking was likely to be time-
varying as banking firms underwent significant recapitalization during the study period. Since
our analysis suggests that the disciplining effect of bank charter values would diminish due to the
recapitalization of the banking industry, despite rising charter value over time, we allow the
effects of charter value on bank risk-taking to be completely non-stationary by estimating
equation (9) using only cross-sectional data at each time period.
IV. Data, Descriptive Statistics, and Persistence of Charter Value
To estimate the model, we construct a sample of publicly traded bank holding companies
(BHCs) that file the Consolidated Financial Statements for Bank Holding Companies (FR Y-9C)
with the Federal Reserve from 1986 Q2 to 2003 Q4. Federal regulation requires all BHCs with
total consolidated assets of $150 million or more to file the Y-9C report quarterly. To avoid
double counting of multi-tiered BHCs, only the top tier BHCs are retained for analysis. To be
included in the sample, the daily stock data of a BHC must be available from the Center for
Research in Security Prices (CRSP). Firms that were insolvent, that is, with negative book value
equity, and firms that were near failure, defined as CV being less than 10 percent, were excluded.

23
Our final sample contains 626 publicly traded BHCs that have 22,436 firm-quarter observations.
To control for the large variation in firm size, we group our sample BHCs into three size
classes using their maximum total assets. As indicated earlier, firms in the top tenth percentile
by maximum total assets are classified as LARGE. Firms at the tenth to fiftieth percentile are
MEDIUM, and firms in the bottom fiftieth percentile are SMALL. Table 1 provides descriptive
statistics of the sample BHCs by size classes.
Figure 7 plots the average CV by size class from 1986 to 2003. Notice that the average
CV was not much different across the three size classes during the early sampling period and
dipped well below unity around 1989 and 1990, when interest rates were rising and the banking
industry was plagued with portfolio problems. During the early 1990s, the economic recovery
and falling interest rates were instrumental to banking firms’ slowly rising CV, particularly
among larger banking companies. It was quite possible that the too-big-to-fail provision in the
FDICIA provided an implicit subsidy to large banking firms, contributing to their higher CVs.
During the mid- to late 1990s as massive consolidation took place in the banking industry, rising
concentration and hence market power seemed to lift the CV for all BHCs. Perhaps also because
of scale economies, large BHCs saw their CV rising much faster than medium and small BHCs.
The anticipation and the eventual passage of the Gramm-Leach-Bliley Financial Modernization
Act apparently further widened large banks’ CV relative to their smaller counterparts. Large
BHCs were in a much better position to take advantage of the expansion of banking powers, and
hence scope economies, than medium and small BHCs. The fact that very large BHCs continued
to get even larger may have further substantiated their implicit too-big-to-fail subsidies. Towards
the end of our sampling period, there was some convergence in the average CV across the three

24
size classes. Perhaps the scope economies offered by Gramm-Leach-Bliley were over-estimated
at the time of its passage, and also perhaps some of the technological advances in banking were
gradually filtering down to smaller institutions. Nonetheless, the average CV of large BHCs
remained comfortably above the average CV of medium BHCs which was in turn higher than the
average CV of small BHCs.
To the extent that the observed charter values could reflect both permanent and temporary
shocks to the market values of banking organizations, it would be useful to look into the
persistence of the measured charter values to distinguish the more lasting shifts in bank charter
values from temporary shocks. To do this, we estimate a partial adjustment model in which it is
assumed that the average charter value among bank holding companies adjust to a target value
that reflects the market’s view regarding the present value of rents in banking.
CV i, t - CV i, t-1 = a i, t (CV* i, t - CV i, t-1 ), (10)
where CV i, t is the observed charter value for the ith bank holding company in quarter t; CV* i, t
is the target charter value that is consistent with the market expectations regarding longer-term
rents for bank holding companies; and the coefficient a is the speed of adjustment to the target
charter value, which could be affected by the pace in which innovations affecting rents are
diffused and the serial correlations in innovations for individual banks.
We estimate equation (10) over three time periods: pre-FDICIA (1986-1991), post-
FDICIA/pre-Gramm Leach Bliley (1992-1999:Q2), and post-Gramm Leach Bliley 1999:Q3-
2003). For each sub-period, we use the cross-section time series data to estimate average values
for a and CV* for the three sized groupings of bank holding companies, and the results are
shown in table 2. The top panel of table 2 shows the estimated adjustment speed, a, in the three

25
sub-periods. Bank charter values during the pre-FDICIA period were much less persistent than
in the later two sub-periods, and the differences were statistically significant. During the two
sub-periods after FDICIA, the point estimates of the adjustment parameter indicate corrections in
the charter value of about 5 percent to 12 percent per quarter.
The bottom panel shows the estimated target charter values for the three size classes of
banking firms over the three sub-periods. The findings indicate that there were statistically
significant increase in the target charter values in the second sub-period compared with the first,
an increase by a factor of three for the large bank holding companies and by a factor of two for
the medium and small size groups. The difference in the target charter values between the first
and second sub-periods are significant at the one percent level. In the third sub-period, the target
charter value retraced some of the early rise, most notable among large BHCs. The target charter
values for the medium and small BHCs were not significantly different from the second sub-
period. Overall, these results suggest that the market viewed bank holding companies as a group
as being able to retain the rents from the charters for some period of time. The findings seem to
confirm that bank charter values had increased permanently during our study period.
V. Empirical Evidence
A. Determinants of Charter Value
1. Pooled regressions
Table 3 provides the regression estimates of fitting equation (2) using pooled time-series
cross-section observations. Estimates for the time effect dummies are not reported. The data fit
the model well, with adjusted R-square at 69 percent for large BHCs, and between 30 to 40
percent for medium and small BHCs.

26
In the large firm regression, non-interest revenue share had a positive and very significant
effect on CV, suggesting that large BHCs might have market power in their non-interest revenue
activities. Regarding loan portfolio activities, we find that both commercial lending and real
estate lending had significantly negative effects on CV, whereas the effect of consumer lending
was significantly positive. The negative coefficient of CILOAN might seem to be at odds with
the theory that banking firms have information monopoly on their business borrowers. In
conjunction with the negative coefficient of RELOAN, the results suggest that funding
commercial loans and real estate loans might not generate systematic rents, relative to other
activities, for large banks due to their competitive disadvantage with the largely unregulated
commercial paper market and less regulated financial institutions like the government sponsored
enterprises. On the other hand, for certain business customers, information advantages from
lending might lead to non-interest revenues from providing off-balance sheet services to these
customers.
On liabilities, for the large banking organizations, the coefficients of transaction deposits
and non-transaction deposits are both significantly positive, indicating that banks had market
power in their local deposit markets. However, the estimate of NONTRAN is three times as
large as the estimate of TRAN, suggesting that rents from non-transaction deposits were much
higher than those for transaction deposits. This is consistent with transaction deposits being
more costly to service than non-transaction deposits. The positive and significant coefficient of
BIGCD is puzzling, given that banks were not expected to have any market power in the national
large CD market. Nevertheless, although banks might have relatively little discretion in setting
large CD rates, not all banks had access to the large CD market and perhaps the ability to tap this

16 It is possible that the orthogonal efficiency measure is still affected by differences inmarket power among banks. In that case, we may not have fully isolated the source of rents onEFFCY. But the results still indicate that the accounting measures are related to the market’svaluations of banking organizations.
27
market for funding was valuable to banking firms in managing their liquidities. Finally, the
coefficient of the orthogonal efficiency measure is positive and highly significant, confirming
that bank charter value was significantly related to operating efficiency.16
Broadly similar results are found for medium banking firms, except for a few notable
differences. Although non-interest revenues remain positive and significant, the coefficient
estimate is much smaller than that for large banking firms. At the same time, the coefficients of
commercial loans and real estate loans are significantly positive. The findings are consistent
with our interpretation of the large firm results: banks had market power in business lending but
the stream of rents could be derived from either the loan rate or non-interest revenues. For
medium banks, the coefficient of consumer lending is insignificant. Compared to the large firm
results, it appears that the ability of banking firms to earn rents from consumer lending was
dependent on firm size, consistent with the existence of scale economies in consumer lending.
The coefficient of TRAN for medium banking firms is positive but insignificant, indicating that
medium banks as a group on average did not have market power in transaction deposits. On the
other hand, the coefficient of NONTRAN remains significantly positive, further indicating that
banks had market power in non-transaction deposits–that is savings and small-time deposits.
The coefficient of BIGCD is positive and marginally significant. The orthogonal efficiency
measure is again positive and highly significant.
Turning to small banking firms, the coefficients of non-interest revenue, commercial

28
lending, and consumer lending are all insignificant. Real estate lending is found to have a
significantly positive effect on small firms’ charter values. The coefficient of transaction
deposits is significantly negative but the coefficient of non-transaction deposits is significantly
positive. The coefficient of BIGCD is insignificant. As for larger banking firms, the orthogonal
efficiency measure is found to have a significantly positive effect on small banking firms’ charter
values.
2. Cross-section regressions
To allow for the effects of firm characteristics on charter value to be completely time
dependent, we estimate equation (2) using only cross-sectional data at each quarter and report the
time series pattern of the cross section regression estimates in figure 8 to figure 15. Figure 8
shows the coefficients of non-interest revenue over time for the three size classes. The positive
effect of non-interest revenue on large firms’ CV was clearly rising over time and was significant
mostly during much of the 1990s and the early 2000s, though the impact appears to have
diminished more recently. A similar pattern is found for medium banking firms, but for small
firms the coefficient is bouncing around zero. Banking firms’ off-balance sheet activities,
including over-the-counter derivatives and various kinds of credit enhancement products, grew at
a much faster clip than on-balance sheet activities [Boyd and Gertler (1994) Edwards and
Mishkin (1995)]. This development took place among mostly larger banking firms whose scale
and reputation were necessary for these products. In offering non-traditional products to their
customers, banks initially were able to earn rents from their market power over these products
but the rents were gradually competed away as more firms enter the market. This is evidenced by
the decline in the coefficient towards the later time periods.

29
Figure 9 shows that the effects of commercial loans on charter values were mostly
insignificant. The findings cast some doubt on the information theory of banking firms. For
large firms, the coefficient was significantly negative in recent years when banks’ commercial
and industrial lending was contracting. During this contraction, large banking firms that relied
more on commercial lending apparently were awarded a lower charter value by the market.
The effects of consumer lending and real estate lending on bank charter values were also
found to be mostly insignificant. For large firms, consumer lending was significantly positive
briefly during the mid 1990s. However, consumer loans had a significantly negative effect on
large firms’ CV around the 2001 recession.
Turning to liabilities, transaction deposits and large CDs were found to have insignificant
effects on charter values during most of the sampling period. There is some evidence that non-
transaction deposits contributed to banking firms’ CV but the results are not as strong as in the
pooled regressions.
Finally, the effect of efficiency on charter value is strong and robust across both size and
time. The higher coefficient estimates for large banking firms suggest that efficiency plays a
bigger role in determining large firms’ charter value. The persistence of the efficiency effect
over time is striking, suggesting that efficiency had always been an important determinant of
charter value regardless of the banking industry condition. The findings also suggest that
banking firms appear constantly to innovate to improve their efficiency. To be significant at each
time period, there has to be sufficient variations in efficiency across firms, meaning that the
industry did not converge to a common production platform shared by all firms.

30
B. Charter Value and Risk Taking
1. Pooled regression
Table 4 reports the estimates of equation (9) using pooled time-series cross-section data
for each of the four risk measures, with the omission of the time-effect dummies. On
capitalization, the fitted charter value is found to have a significantly positive effect on book-
value capital for all three size classes of banking firms, suggesting that firms with higher charter
value tended to hold more capital. Regarding credit risk, the fitted charter value is found to have
a significantly negative effect on non-performing loans, and the result again is robust across bank
size. On the idiosyncratic risk of bank stock returns, the fitted charter value is found to have a
significantly negative effect on equity non-systematic risk in all three bank size classes. Finally,
regarding bankruptcy risk, the fitted charter value is insignificant in explaining large BHCs’ Z-
score, but is found to have a significantly positive effect on medium and small BHCs’ Z-score.
Taken together, the pooled time-series cross-section regression results confirm that banking firms
with higher charter values tended to take less risk.
2. Cross-section regression
To study if and how the disciplining effect of bank charter value evolved over time, we
estimated equation (9) using only cross-section data at each time period and report the
coefficients of the fitted charter value in figure 16 to figure 19. In figure 16, the fitted charter
value is found to have a significantly positive effect on the amount of on-book capital held by
large banking firms only during the earlier time periods, from 1986 to about 1995. Thereafter,
charter value is found to have insignificant effects on large BHCs’ book value capitalization.
The findings confirm the diminishing effect of charter value on capital as these banking firms

31
underwent recapitalization since the mid-1990s. For medium banking firms, the effects of
charter value on capital was significantly positive in most quarters. Although the effects were
statistically significant, the point estimates were smaller relative to the other two size classes.
For small banking firms, the effect of fitted charter value on capital was again positive and
significant. There is a noticeable downward trend in the parameter estimates over time since
around 1992. Quite clearly, the effect of charter value on small BHCs’ capital had been
diminishing over time.
Figure 17 shows the effects of fitted charter value on non-performing loans over time.
For all three size classes, bank charter value had strong and significantly negative effects on non-
performing loan ratio during the first half of the sampling period, from 1986 to about 1995.
Thereafter, the disciplining effect of charter value on portfolio risk largely disappeared.
Although the coefficient became significantly negative again in more recent quarters, particularly
among medium and small BHCs, the estimates nonetheless were relatively small.
Figure 18 shows the effects of fitted charter value on bank stocks’ idiosyncratic risk.
Bank charter value had significantly negative effect on idiosyncratic risk during the earlier years,
confirming that stocks of banking firms with higher charter value tended to experience less
idiosyncratic risk. Again, towards the second-half of the study period, the disciplining effect had
diminished and became insignificantly different from zero.
Finally, figure 19 shows the time-series patterns of the effects of charter value on failure
risk. For large banking firms, fitted charter value is found to have a significantly positive effect
on Z-score from 1986 to 1992, insignificant between 1992 to 1999, and significantly negative but
quantitatively small thereafter. For medium banking firms, we found more significantly positive

32
coefficients during the earlier quarters than latter quarters. For smaller BHCs, the time trend was
less evident but the significant coefficients were mostly positive.
Taken together, our findings indicate that bank charter value had a significant disciplining
effect on bank risk-taking during the earlier time periods. Consistent with theory, as banking
firms increased book-value capitalization substantially to become well capitalized in order to
take advantage of greater scope of activities or to avoid restrictions on operations, the
disciplining effect of chart value had diminished despite rising bank charter value. At the same
time, other developments including the reform in banking supervision and regulation, and the
proliferation of market discipline in banking that tended to align bank risk-taking more with the
banking firms’ cost of capital, also are expected to blunt the disciplining effect of bank charter
values.
VI. Conclusions
The disciplining effects of bank charter values on bank risk-taking have received both
theoretical and empirical support in the literature. We provide new empirical evidence on the
disciplining power of charter value since 1986. Over our study period, we have witnessed
tremendous changes in the banking industry, from record failures to record profits. The drastic
improvement in bank performance coincided with landmark changes in banking legislation and
regulations, massive banking consolidation, and a period of rapid advances in information
technology and productivity gains. Using the market-to-book capital ratio to measure banking
firms’ charter value, we found that bank charter value rose significantly in the 1990s. After
peaking at around 1997, bank charter value stayed high relative to averages in the late 1980s.
While it is be difficult to pin down to what degree external changes contributed to the

33
changes in bank charter values, our empirical results show that both bank size and operating
efficiency appear to be strongly related to bank charter value. On bank size, our evidence is
consistent with FDICIA, Riegle-Neal, and Gramm-Leach-Bliley being more favorable to larger
banking firms over smaller ones, which could be traced back to the too-big-to-fail subsidy as well
as scale and scope economies made possible by these legislative measures. The differential
effect on large banking organizations, however, has diminished considerably in recent years.
This may reflect some initial over-estimation of the advantages afforded large banking
organizations relative to other banking firms. It also may reflect the dissipation of the first-
mover advantages to early innovators in banking.
Across all bank size groupings, the most consistent contributor to higher charter values
appears to have been improved operating efficiency. The effect of efficiency on charter value
was quite strong, robust, and persistent. The evidence is consistent with the relentless cost
cutting by banking firms and their wide spread adoption of information technologies. The impact
of efficiency gains on charter values suggests some extant degree of market power among banks.
On the relation between firm characteristics and charter value, we find non-interest
revenue shares to be a significant determinant of larger banking firms’ charter values. The
effects were especially strong among large banking firms, and increased in the 1990s and into the
early 2000s. The findings suggest that banking firms might have market power in these non-
traditional banking activities, albeit there was some sign that these rents were being competed
away in more recent years. That is, the evidence also is consistent with temporary rents
associated with successive innovations. Loan portfolio composition, on balance, had little effect
on bank charter value. Regarding deposit composition, there was some evidence that banking

34
firms had market power in savings and small-denomination time deposits, relative to other
liabilities such as transaction deposits.
Our evidence on the effects of charter value on bank risk-taking is strong, and robust
across risk measures and firm size. For the full period since the mid-1980s, we find strong
evidence that bank charter value disciplined bank risk-taking. However, the disciplining effect
was more evident in the earlier time periods when the average charter value was low and the
banking industry was weak. In more recent years when banking firms have had substantially
higher charter values, charter values seemed to exert less disciplining effect on bank risk-taking.
Consistent with theory, the weakening of the disciplining effect roughly coincided with the
substantial increase in book-value capitalization among U.S. banking organizations as the vast
majority of banking firms chose to hold significantly more capital than the regulatory minimum
to be deemed well-capitalized by regulators. Moreover, other forces including the changes in
banking supervision and regulation that realigned bank risk-taking closer to banking firms’ cost
of capital, and the proliferation of market discipline in banking also are expected to blunt the
disciplining effect of bank charter value.

35
References
Akhavein, J.D., A.N. Berger, and D.B. Humphrey, 1997, The effects of megamergers onefficiency and prices: Evidence from a bank profit function, Review of Industrial Organization12, page 95-139.
Angbazo, L. And A. Saunders, 1996, The effect of TBTF deregulation on bank cost of funds,Salomon Center Working Paper no. S/96/39, New York University
Benston, G. J. And G. G. Kaufman, 1997, FDICIA after five years: A review and evaluation,Journal of Economic Perspectives Vol. 11, No. 3, 139-158.
Berger, A.N. 2003, The Economic Effects of Technological Progress: Evidence from theBanking Industry, Journal of Money Credit and Banking, 35, pp. 141-176.
Berger, A., and L. J. Mester, 2003, Explaining the Dramatic Changes in Cost and ProfitPerformance of the U.S. Banking Industry. Journal of Financial Intermediation, 12,pp.57-95.
Boyd, J. H. and M. Gertler, 1994, Are banks dead? Or, are the reports greatly exaggerated?Federal Reserve Bank of Minneapolis Quarterly Review, Winter, 2-23.
Boyd, J. H. and S. L. Graham, 1988, The profitability and risk effects of allowing bank holdingcompanies to merge with other financial firms: A simulation study, Federal Reserve Bank ofMinneapolis Quarterly Review 12 (2), 3-20.
Carow, K. A., 2001a, The Citicorp-Traveler’s merger: Challenging barriers between banking andinsurance, Journal of Banking and Finance Vol. 25, 1553-1571.
Carow, K. A., 2001b, The wealth effects of allowing bank entry into insurance industry, Journalof Risk and Insurance Vol. 68, 129-150.
Carow, K. A. and R. A. Heron, 1998, The interstate banking and branching efficiency act of1994: A wealth event for acquisition targets, Journal of Banking and Finance Vol. 22, No. 7,1017-1043.
Carow, K. A. and R. A. Heron, 2001, Capital market reactions to the passage of the financialservices modernization act of 1999, Quarterly Review of Economics and Finance Vol. 42, No. 3,465-485.
Carow, K. A. and E. J. Kane, 2001, Event-study evidence of the value of relaxing longstandingregulatory restraints on banks, 1970-2000, Quarterly Review of Economics and Finance Vol. 42,No. 3, 439-463.

36
Collins, M. C., S. A. Kwag and H. S. Yildirim, 2002, An examination of the equity marketresponse to the Gramm-Leach-Bliley Act across commercial banking, investment banking, andinsurance firms, University of Tennessee Working Paper.
Covitz, D. M., D. Hancock and M. L. Kwast, 2002, Market discipline in banking reconsidered:The roles of deposit insurance reform, funding manager decisions and bond market liquidity,Working Paper, Board of Governors of the Federal Reserve System.
Edwards, F. R. and F. S. Mishkin, 1995, The decline of traditional banking: Implications forfinancial stability and regulatory policy, Federal Reserve Bank of New York Economic PolicyReview, July 1995, 27-45.
Federal Reserve System Study Group on Subordinated Notes and Debentures,1999, Usingsubordinated debt as an instrument of market discipline, Staff Study 172, Board of Governors ofthe Federal Reserve System.
Flannery, M. J., 1998, Using market information in prudential bank supervision: A review of theU.S. empirical evidence, Journal of Money, Credit, and Banking Vol.30, 273–305.
Flannery, M. J., S. H. Kwan and M. Nimalendran, 2004, Market evidence on the opaqueness ofbanking firms’ assets, Journal of Financial Economics Vol 71, 419-460.
Flannery, M. J. and S. M. Sorescu, 1996, Evidence of bank market discipline in subordinateddebenture yields: 1983-1991, Journal of Finance Vol. 51, 1347-1377.
Furlong, F. T., 2001, “Productivity in Banking,” Federal Reserve Bank of San FranciscoEconomic Letter, July.
Furlong, F. T.,1992, Capital Regulation and Bank Lending, Federal Reserve Bank of SanFrancisco Economic Review, 3, pp. 23-33.
Furlong, F. T. and M. C. Keeley, 1989, Bank capital regulation and risk taking: A note, Journalof Banking and Finance, November 1989, 13, 883-891.
Hellmann, T. F, K. C. Murdock, and J. E. Stiglitz, 2000, Liberalization, Moral Hazard inBanking, and Prudential Regulation: Are Capital Requirements Enough? The AmericanEconomic Review, Vol. 90, No. 1, March, pp. 147-165.
Humphrey, D. B., 1990, Why do estimates of bank scale economies differ? Federal Reserve Bankof Richmond Economic Review Vol 76, 38-50.
Jorgenson, D. And K. Stiroh, 2000, Raising the speed limit: U.S. economic growth in theinformation age, Brookings Papers on Economic Activity, 1, 125-211.

37
Kaufman, G. G., 2002, Too big to fail in U.S. banking: Quo vadis? Quarterly Review ofEconomics and Finance, Summer, 423-436.
Keeley, M. C., 1990, Deposit insurance, risk, and market power in banking, American EconomicReview Vol. 80, No. 5, 1183-1200.
Kwan, S. H., 1998, Securities activities by commercial banking firms’ section 20 subsidiaries:Risk, return and diversification benefits, Federal Reserve Bank of San Francisco Working Paper.
Kwan, S. H. and R.A. Eisenbeis, 1999, Mergers of Publicly Traded Banking OrganizationsRevisited, Economic Review, Federal Reserve Bank of Atlanta, Volume 84, Number 4, Page 26-37.
Kwan, S. H. and E. Laderman, 1999, On the Portfolio Effects of Financial Convergence -- AReview of the Literature, Economic Review, Federal Reserve Bank of San Francisco, Number 2,Page 18-31.
Laderman E., 2005 Changes in Twelfth District Local Banking Market Structure during a Periodof Industry Consolidation, Federal Reserve Bank of San Francisco Economic Review,forthcoming.
Marcus, A. T., 1984, Deregulation and bank financial policy, Journal of Banking and Finance,December 1984, 8, 557-565.
Merton, R. C., 1977, An analytic derivation of the cost of deposit insurance and loan guarantees,Journal of Banking and Finance 1, 3-11.
Mester, L. J., J.P. Hughes, W. Lang, and C.G. Moon, 1999, The Dollars and Sense of BankConsolidation, Journal of Banking and Finance 23, 291-324.
Mishkin, F. S., 1997, Evaluating FDICIA, in George G. Kaufman, ed., FDICIA: Bank reformfive years later and five years ahead, Greenwich, CT.: JAI Press, 17-33.
Rhoades, S.A., 2000, Bank mergers and banking structure in the United States, 1980-98, FederalReserve Staff Study 174.
Repullo, R., 2004, Capital Requirements, Market Power, and Risk-Taking in Banking, Journal ofFinancial Intermediation, 13, 156-182.
Jayaratne, J., and P. E. Strahan, 1998, Entry Restrictions, Industry Evolution and DynamicEfficiency, Journal of Law & Economics, 41, pp. 239-273.
Stern, G. H. and R. J. Feldman, 2004, Too big to fail: The hazards of bank bailouts, Brookings

38
Institution Press, Washington D.C.
Stiroh, K. J., 2002, Information technology and the U.S. productivity revival: What do theindustry data say? American Economic Review, Vol. 92, No. 5, 1559-1576.
Wall, L., 1993, Too-bog-to-fail after FDICIA, Federal Reserve Bank of Atlanta EconomicReview Vol. 78, No. 1, 1-14.

39
Table 1Mean (Median) of selected variables for 626 sample banking firms,1986-2003
Variable Large Medium Small
Market-to-Book equityratio
1.846(1.592)
1.624(1.509)
1.507(1.407)
Non-Interest RevenuesRatio
35.2%(32.0%)
23.1%(21.6%)
18.3%(17.6%)
Commercial Loans toTotal Assets
15.4%(15.5%)
12.7%(11.7%)
12.5%(10.5%)
Consumer Loans to TotalAssets
11.4%(10.8%)
10.5%(10.0%)
8.4%(6.7%)
Real Estate Loans to TotalAssets
27.1%(26.6%)
35.5%(35.3%)
39.7%(40.4%)
Transaction Deposits toTotal Liabilities
19.9%(20.9%)
22.0%(22.2%)
24.9%(24.2%)
Non-Transaction Depositsto Total Liabilities
41.6%(43.9%)
53.2%(54.1%)
55.4%(55.7%)
Large CDs to TotalLiabilities
8.9%(7.6%)
10.8%(9.4%)
11.2%(10.1%)
Efficiency Ratio 1.577(1.554)
1.564(1.542)
1.510(1.508)
Book Capital to TotalAssets
7.3%(7.2%)
8.1%(7.9%)
8.7%(8.6%)
Pastdue Loans to TotalLoans
1.7%(1.2%)
1.4%(0.9%)
1.5%(0.9%)
Idiosyncratic Risk 23.4%(21.1%)
32.5%(29.2%)
40.4%(36.5%)
Z-Score 5.55(5.18)
4.54(3.98)
3.86(3.30)

40
Table 2Persistence and Shifts in Bank Charter Values
CV i, t - CV i, t-1 = a i, t (CV* i, t - CV i, t-1 )
Adjustment parameters (a)
Large Medium Small
Pre-FDICIA 0.196***(0.016)
0.228***(0.010)
0.143*** (0.010)
Post-FDICA/Pre-GLB 0.052*** (0.010)
0.118*** (0.007)
0.074*** (0.007)
Post-GLB 0.113*** (0.015)
0.105*** (0.066)
0.051*** (0.007)
standard errors are in parentheses*** significantly different from zero at the 1% level.
Target Charter-Value Ratio (CV* )
Large Medium Small
Pre-FDICIA 1.072** (0.036)
1.093*** (0.026)
0.998 (0.044)
Post-FDICIA/Pre-GLB 3.323*** (0.327)
2.066*** (0.049)
2.111*** (0.091)
Post-GLB 2.109*** (0.170)
1.973*** (0.066)
1.947*** (0.108)
standard errors are in parentheses***, ** significantly different from unity at the 1% and 5% levels, pespectively.

41
Table 3CV = f( NIC, CILOAN, CSLOAN, RELOAN, TRAN, NONTRAN, CD, OEFFCY) + 0
Panel A : Large
Variable Coefficient Standard Error
NIC 1.630*** 0.106
CILOAN -2.083*** 0.150
CSLOAN 1.340*** 0.164
RELOAN -1.354*** 0.130
TRAN 0.442*** 0.169
NONTRAN 1.237*** 0.101
CD 0.733*** 0.200
OEFFCY 0.853*** 0.044
# Observations 3,659
Adj. R-Square 0.69
Panel B: Medium
Variable Coefficient Standard Error
NIC 0.201*** 0.059
CILOAN 0.217** 0.091
CSLOAN 0.049 0.096
RELOAN 0.293*** 0.057
TRAN 0.086 0.054
NONTRAN 0.333*** 0.057
CD 0.194** 0.097
OEFFCY 0.146*** 0.010
# Observations 10,382
Adj. R-Square 0.38

42
Panel C: Small
Variable Coefficient Standard Error
NIC -0.009 0.023
CILOAN -0.048 0.097
CSLOAN -0.176 0.108
RELOAN 0.161** 0.068
TRAN -0.287*** 0.064
NONTRAN 0.132*** 0.032
CD 0.106 0.109
OEFFCY 0.747*** 0.025
# Observations 8,300
Adj. R-Square 0.31
***, ** indicates significance at 1% and 5% levels, respectively.

43
Table 4
Panel A : RISK =CAPITAL
Coefficient Standard Error # Observations Adj. R-Square
Large 0.0107*** 0.0005 3,659 0.35
Medium 0.0218*** 0.0016 10,382 0.18
Small 0.0397*** 0.0011 8,300 0.20
Panel B : RISK=PASTDUE
Coefficient Standard Error # Observations Adj. R-Square
Large -0.0070*** 0.0006 3,658 0.25
Medium -0.0078*** 0.0013 10,380 0.17
Small -0.0252*** 0.0008 8,296 0.26
Panel C: RISK=NONSYS
Coefficient Standard Error # Observations Adj. R-Square
Large -0.0014*** 0.0003 3,654 0.31
Medium -0.0091*** 0.0017 10,307 0.12
Small -0.0216*** 0.0010 8,184 0.18
Panel D: RISK=Z-SCORE
Coefficient Standard Error # Observations Adj. R-Square
Large -0.0390 0.0953 3,253 0.49
Medium 1.1403*** 0.1164 10,125 0.27
Small 0.9255*** 0.1247 7,963 0.20
*** indicates significance at the1% level.

44

45
Figure 2: Non-Interest Revenue ShareNon-Interest Revenue / (Non-Interest Revenue + Net Interest Income)

46
Figure 3: Bank Operating Efficiency(Non-Interest Revenue + Net Interest Income) / Non-Interest Expense

47
Figure 4: Book Value Capital to Total Assets

48

49

50
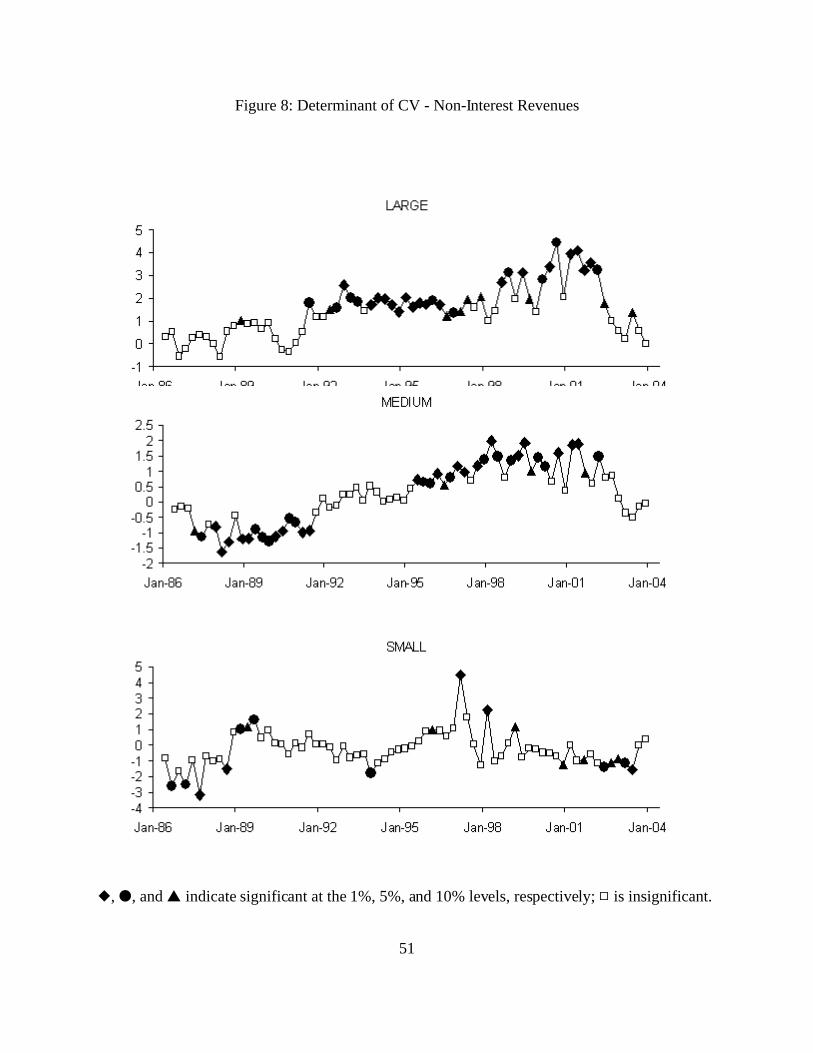
51
Figure 8: Determinant of CV - Non-Interest Revenues
�, �, and � indicate significant at the 1%, 5%, and 10% levels, respectively; 9 is insignificant.

52
Figure 9: Determinant of CV - Commercial Lending
�, �, and � indicate significant at the 1%, 5%, and 10% levels, respectively; 9 is insignificant.

53
Figure 10: Determinant of CV - Consumer Lending
�, �, and � indicate significant at the 1%, 5%, and 10% levels, respectively; 9 is insignificant.

54
Figure 11: Determinant of CV - Real Estate Lending
�, �, and � indicate significant at the 1%, 5%, and 10% levels, respectively; 9 is insignificant.

55
Figure 12: Determinant of CV - Transaction Deposits
�, �, and � indicate significant at the 1%, 5%, and 10% levels, respectively; 9 is insignificant.

56
Figure 13: Determinant of CV - Non-Transaction Deposits
�, �, and � indicate significant at the 1%, 5%, and 10% levels, respectively; 9 is insignificant.

57
Figure 14: Determinant of CV - Certificate of Deposits
�, �, and � indicate significant at the 1%, 5%, and 10% levels, respectively; 9 is insignificant.

58
Figure 15: Determinant of CV - Orthogonal Efficiency
�, �, and � indicate significant at the 1%, 5%, and 10% levels, respectively; 9 is insignificant.

59
Figure 16: Effects of Fitted Charter Value on Capital Ratio
�, �, and � indicate significant at the 1%, 5%, and 10% levels, respectively; 9 is insignificant.
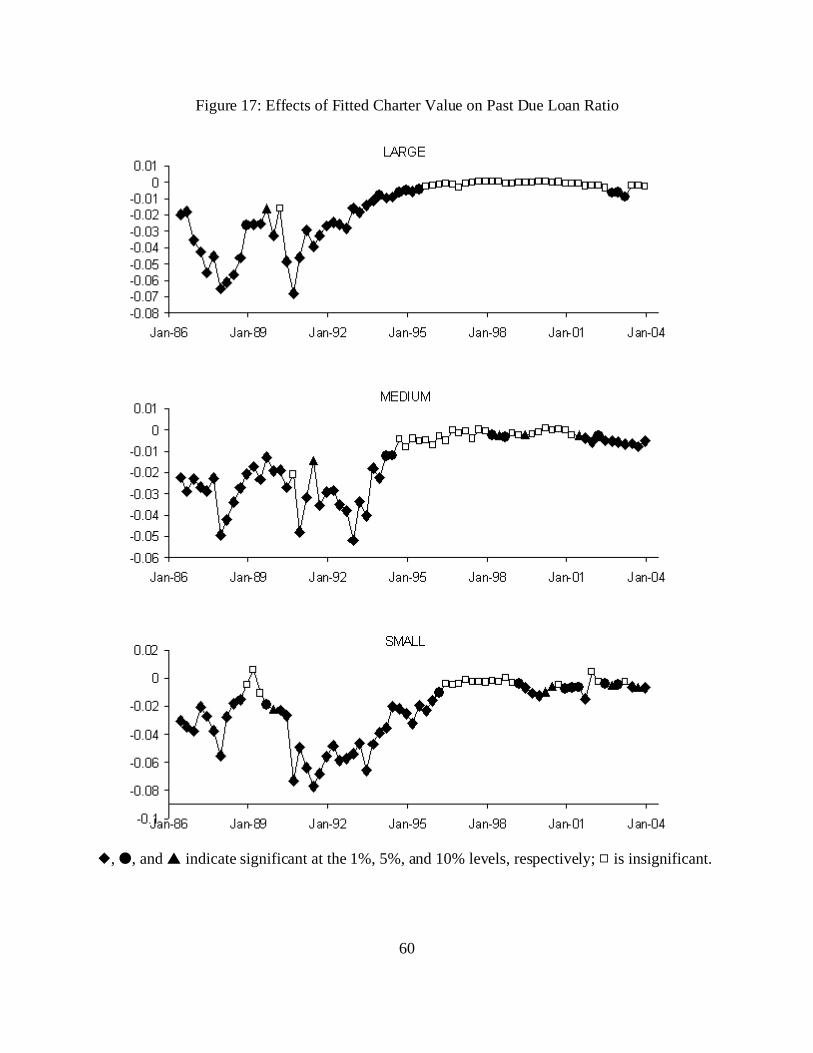
60
Figure 17: Effects of Fitted Charter Value on Past Due Loan Ratio
�, �, and � indicate significant at the 1%, 5%, and 10% levels, respectively; 9 is insignificant.

61
Figure 18: Effects of Fitted Charter Value on Idiosyncratic Risk
�, �, and � indicate significant at the 1%, 5%, and 10% levels, respectively; 9 is insignificant.

62
Figure 19: Effects of Fitted Charter Value on Failure Risk
�, �, and � indicate significant at the 1%, 5%, and 10% levels, respectively; 9 is insignificant.