preliminary developing a mathematical model for · pdf filepreliminary developing a...
TRANSCRIPT
Preliminary Developing A Mathematical Model for Estimating HouseholdSolid Waste Generation Rate: The Case of Ho Chi Minh City, VietnamLe Minh Truong, Tran Thu Trang and Tran Thi My Dieu†Department of Environmental Technology and Management, Van Lang University, 45 Nguyen Khac Nhu Street,Co Giang Ward, District 1, Ho Chi Minh City, Vietnam†Corresponding author: Tran Thi My Dieu
ABSTRACTSolid waste generation rate plays an important role in calculation and design different elements of amunicipal solid waste management system of an urban area. The survey was carried out at 644households living in 6 selected wards of 6 districts in Ho Chi Minh City (HCMC) that have differentpopulation densities to determine generation rates and main composition (food refuses and plasticbags) in domestic solid waste. Composition of household solid waste of HCMC determined from thisstudy will help to develop a model to predict solid waste generation rate in the future. It is also foundfrom the study that, in 2015 household solid waste generation rate of HCMC is 0.41 kg/capita/day (SD= 0.313), food refuse generation rate is 0.23 kg/capita/day, plastic bag generation rate is 0.032 kg/capita/day, and percentages of food refuses and plastic bags in domestic solid wastes of HCMC are61.63% and 7.67%, respectively. Statistical data indicate that generation rates of household solidwaste, food refuses, and plastic bags are inversely proportional to the number of people in a familyand directly proportional to the household income. The rank correlation shows no significance betweenthe household solid waste generation rates and the urbanization levels as well as between householdsolid waste generation rates and days of a week. A linear regression model proposed to determinegeneration rates of household solid waste, household food refuse, and household plastic bagsshows that household size and household income explain only 14.2% of solid waste generation rate(R2 = 0.142) and 11.9% of plastic bag generation rate (R2 = 0.119). Generation rate of food refuse(within the scope of this study) can only be estimated based on household size (R2 = 0.08).
Nat. Env. & Poll. Tech.Website: www.neptjournal.com
Received: 04-05-2016Accepted: 16-07-2016
Key Words:Domestic solid wasteFood refusesPlastic bagsLinear regression model
INTRODUCTION
With more than 2 million households; 10 thousand hotels,restaurants, guesthouses; hundreds of education centres;hundreds of healthcare centres, more than 10 thousand clin-ics and about 12 thousand industrial enterprises, totalamount of household solid waste (HSW) generated in HoChi Minh City (HCMC) is in the range of 10,000-11,000tons/day (DONRE 2013). Of which, the amount of solidwaste generated from residential areas, commercial areas,offices, schools, canteens of enterprises and industrial zones,non-infected medical centres is about 9,000 tons/day, andabout 6,400-7,200 tons/day (equivalent to 2.34-2.64 mil-lion tons/year) is collected, the remaining is separated, tradedand reused or recycled (Dieu et al. 2014).
In recent years, though a great effort has been put ondevelopment and implementation of different policies(socialization and investment incentive), infrastructure in-vestments (of solid waste transfer stations, solid waste treat-ment complexes), capacity building and administrativemanagement structure as well, there have been big chal-lenges for HCMC to fulfil the strategy of integrated solid
waste management of 2015 with a vision of 2025, promul-gated by Vietnamese Prime Minister, especially about solidwaste separation at sources, reducing waste to landfill andmanagement of private solid waste collection system (Viet2013).
Researches on public health and environmental sanita-tion related to solid waste have shown that ineffective andnon-scientific management of solid waste at landfills willattract birds and rodents, create unsanitary environment,cause nuisance, disperse air-born diseases, and emit green-house gases. Therefore, effective solid waste managementtools are necessary to minimize the above mentioned nega-tive impacts, and evaluation of characteristics and genera-tion rate of solid waste is one of the important initial steptowards an effective solid waste management (Gidarakos etal. 2006, Medina 2000, Qu et al. 2009, Thanh et al. 2010).In addition, Suthar et al. (2015) identified that quantity andcharacteristics of municipal solid waste are indicators ofsustainable development of urban areas as well as social -economic conditions of society and household. High reli-ability solid waste management parameters will be efficient
2017pp. 351-362Vol. 16p-ISSN: 0972-6268
No. 2Nature Environment and Pollution TechnologyAn International Quarterly Scientific Journal
Original Research Papere-ISSN: 2395-3454
Open Access

352 Le Minh Truong et al.
Vol. 16, No. 2, 2017 Nature Environment and Pollution Technology
supporting tools for assessment and selection of effectivemanagement alternatives of solid waste management pro-grams (Qdais et al. 1997, Chang & Davila 2008, Hancs et al.2011). In fact, collection, updation and management of sta-tistical data on solid waste management, however, are usu-ally insufficient, especially in developing countries(Buenrostro et al. 2001). In the case where data are avail-able, it might be contradictory because of being gatheredfrom different sources or measured by different methods orinstruments (IPCC 2006, Couth & Trois 2011, Ranjith 2012).One of the most significant influences of this problem isopportunities of investment in solid waste management(Miezah et al. 2015). Lack of data on solid waste generationrate and composition leads to difficulties on determinationof solid waste collection routes and incomplete collectionof solid waste generated from areas which differ from social-economic conditions. So far, several researches have beencarried out to estimate solid waste generation rate, compo-sition and characteristics. Gu et al. (2015) used a multiplelinear regression model to estimate solid waste generationrate from 240 households living in Suzhou, the East regionof China, during different seasons in 2011 and 2012 as wellas evaluating opportunities and predicting benefits of solidwaste reuse from the households. Two important conclu-sions withdrawn from the research of Gu et al. (2015) include(1) solid waste generation rate of household is 208.5 g/capita/day, of which, 89.3% is recyclable and compostablematerials and (2) educational level is a key factor thatinfluences on solid waste generation rate. A study of Miezahet al. (2015) on evaluation of generation rate, compositionand efficiency of waste separation at sources in Ghana showsthat solid waste generation rate is 0.47 kg/capita/day, ofwhich biodegradable solid waste is 0.318 kg/capita/day,non-biodegradable and reusable material is 0.096 kg/capita/day, and the remaining is 0.055 kg/capita/day. The highestvalue of solid waste generation rate is found from house-holds living in the capital of the country (0.63 kg/capita/day), lower values are from households living in urban ar-eas (0.40 kg/capita/day) and lowest values are from house-holds living in undeveloped areas (0.28 kg/capita/day).Suthar et al. (2015) reported that the solid waste composi-tion is an important parameter to develop an effective solidwaste management system for an urban area. A research onsolid waste generation rate and composition from 144 house-holds living in different social-economic conditions inDehradun, India indicates that solid waste generation ratesvary in a large range from 24.5 g/household/day to 4147.1g/household/day with a mean value of 267.17 g/household/day (SD = 38.13) and more than 80% of food refuses werefound in the household solid waste. Dennison et al. (1996a)presented that precision data on solid waste generation rate
plays an important role in management of solid waste man-agement infrastructure. A study in Dublin, Ireland showedthat solid waste generation rate reduced from 0.69 kg/capita/day in 1970s to 0.53 kg/capita/day in 1996. In other words,continuously updating data on solid waste generation rateas well as estimating solid waste generation rate based onchanges in social-economic conditions is essential for wastemanagement. Benitez et al. (2008) has developed a math-ematical model to estimate domestic solid waste generationrate of Mexican City by determining variables as educationlevel, household income, and household size. A linear andmultiple regression model has been developed for each vari-able to describe the influences of proposed variables. It isfound from this research that education level, householdsize and household income are significant factors affectingHSW generation rate. The multiple linear regression modelaccounting for all these variables reached highest R2 valueof 0.51. Thanh et al. (2010) also developed a multiple linearregression model to estimate solid waste generation rate inCan Tho, Vietnam. Results from surveying 100 householdsduring rainy season and dry season indicate that solid wastegeneration rate in Can Tho was 285.3 g/capita/day, and80% compostable materials and 11.7% recyclable materi-als were found in household solid waste composition. Themultiple linear regression model of Thanh et al. (2010) alsoshowed that household income and house-hold size influ-ence the generation rate of commingle solid waste and foodrefuses from households. R2 values of commingle solid wasteand food refuses are 0.361 and 0.374, respectively. In HCMC,Vietnam, it is found from the research of Dieu et al. (2014)that solid waste generation rate from households living inDistrict 1 was in the range of 0.53 -0.63 kg/capita/day. Thecomposition of the separated food waste comprises about80.1%-90.0% of biodegradable food refuse. So far, very fewresearches on methods estimating solid waste generationrate in HCMC have been published. In order to contributeto effective management of solid waste in HCMC, Vietnam,this study aims at: (1) determining generation rate of com-mingle waste, food refuses and plastic bags in HSW inHCMC; (2) developing a multiple linear regression modelto estimate the generation rate of solid waste, food refusesand plastic bags in HCMC; (3) assessing factors that influ-ence the generation rate of solid waste, food refuses andplastic bags from households, including population den-sity, household size, household income and days of a week.
MATERIALS AND METHODS
Sampling network: With total area of 2,095 km2, of which494.01 km2 is urban area, 19 central districts and 5 sub-urban districts, population of 7.97 million people (2014),HCMC is considered as a key administrative economic cen-

353MATHEMATICAL MODEL FOR ESTIMATING HOUSEHOLD SOLID WASTE GENERATION
Nature Environment and Pollution Technology Vol. 16, No. 2, 2017
tre in the southern region of Vietnam (Thanh et al. 2016). Inthe large area as HCMC, selection of sampling network playsan important role in ensuring representation of the researchresults. The studied locations were selected to ensure thatsampling locations are distributed in the whole city, andrepresent the different social-economic characteristics ofdifferent districts in HCMC. Thanh et al. (2010) indicatedthat population density can be used as an indicator of ur-banization level. Statistical data of HCMC (HCMC Statisti-cal Office 2014) provided that it is possible to classify cen-tral districts of HCMC into different areas based on popula-tion density as follows: less than 5,000 person/km2, 5,000-15,000 person/km2, 15,000-25,000 person/km2 and morethan 25,000 person/km2. In the other words, it is possible toclassify the districts in HCMC into 4 groups: (1) District 1and District 9 represent the area with population density of2,495-2,823 persons/km2; (2) District 7, District 12, ThuDuc District, Binh Tan District represent the area with popu-lation density in the range of 7,866-12,628 persons/km2;(3) District 1, District 8, Tan Binh District, Tan Phu Districtrepresent the area with population density in the range of19,797-27,932 persons/km2; and (4) District 3, District 4,District 6, District 10, District 11, Phu Nhuan District repre-sent the area with population density in the range of 36,979-44,452 persons/km2. For each group, one or two districtswere selected for carrying out field surveys. Districts cho-sen for surveying and sampling were District 9 (representedto group 1), District 7 (represented to group 2), District 1(represented to group 3) and District 10 (represented to group4). Besides, Binh Thanh District (belonged to group 3) andDistrict 5 (belonged to group 4) were also selected for sur-veying and sampling because these two Districts partici-pated in “Plastic bag reduction” program organized byHCMC Environmental Protection Fund. Results on compo-sition of household solid waste generated in these districtswere used to assess the influence of propaganda and train-ing program on reduction in usage of plastic bags, in com-parison to other Districts.
There are 83 wards of 6 selected districts. For each se-lected district, a ward is selected by the percentile rank ofthe population density, 10th; 30th; 35th; 50th; 60th and 80th
percentiles, respectively, which defined 6 levels as: level Icorrelates to percentile of 10th and population density of1,803 persons/km2; level II correlates to percentile of 30th
and population density of 14,500 persons/km2; level III cor-relates to percentile of 35th and population density of 17,323persons/km2; level IV correlates to percentile of 50th andpopulation density of 33,444 persons/km2; level V corre-lates to percentile of 60th and population density of 40,956persons/km2, and level VI correlates to percentile of 80th andpopulation density of 49,996 persons/km2. Calculated re-sults are described in Table 1. At each ward, 25 householdsare chosen for delivering plastic bags to collect solid wastesamples and for gathering related information. Thus, totalsamples needed to be collected for each time of survey were25 households/ward × 6 wards = 150 households. In order toavoid insufficient number of samples needed, in case somehouseholds received sampling bags but did not separatesolid waste at source, actual number of households surveyedwere 162 households (27 households/wards × 6 wards). Thesurveying and sampling was conducted for 2 working daysof a week, also on Saturday and Sunday. Therefore, totalnumber of samples are 648 samples [(162 samples/day × 2days)
working days + (162 samples/day × 1 day) Saturday + (162
samples/day × 1 day) Sunday]. Besides, in order to avoidconcentration of sample locations in some places, in thesame street of the same ward, samples were taken from maxi-mum 5 households. Surveyed streets of each ward of eachselected district were randomly chosen. Selected wards forsurveying are described in Table 1.
Survey procedure: For each household, two different col-our plastic bags were delivered, of which the blue one wasfor food waste (food refuse, fruit peel, bulb peel, fish intes-tine, shrimp cover, etc.) and the red one was for other wastes.The sample bags were labelled with detailed informationabout household, including: (1) district name; (2) streetname; (3) number and (4) sampling date. In fact, there areseveral households not following the sampling require-ments. Hence, 14 plastic bags (7 blue bags and 7 red bags)were randomly delivered to 7 households in 2 working-days of a week, from 8:30-10:30, and sample bags werecollected at the same time next day. In order to assess the
Table 1: Sampling locations.
Urbanization level Ward (District) Area (km2) Population density (persons/km2) Percentile
I Ben Thanh (District 1) 1,677 1,803 13.3th
II Hiep Phu (District 9) 32,479 14,500 28.9th
III Ward No. 25 (Binh Thanh District) 31,875 17,323 34.9th
IV Tan Kieng (District 7) 33,444 33,444 49.4th
V Ward No. 3 (District 5) 7,372 40,956 62.7th
VI Ward No. 13 (District 10) 23,498 49,996 78.3th

354 Le Minh Truong et al.
Vol. 16, No. 2, 2017 Nature Environment and Pollution Technology
difference in quantity and composition of waste betweenweekdays (Monday to Friday) and weekends (Saturday andSunday), the sample bags were delivered on Saturday andSunday and collected on the day after as well. The plasticbags are distributed right after the collection of city crewand before the time when they come next day. After trans-ferring the bags, the necessary information to carry out themathematical modelling for estimating HSW generation are:(1) household size and (2) household income. Two samplebags from each household (food waste and other wastes) istied together and analysed in laboratory within the day.
Mathematical modelling for household solid waste gen-eration in Ho Chi Minh City: The mathematical modellingfor estimating HSW generation in HCMC is developed basedon the analytical database of solid waste quantity and com-position from household survey. It can be seen that solidwaste generation rate depends on two factors of householdsize and household income (Ojeda et al. 2008). In this study,a multi-variable regression model also aimed at estimatingthe generation of solid waste per resident in HCMC by twovariables as mentioned above. The variables and methodsto identify variables are given in Table 2. The model ofmulti-variables linear regression is represented as follows:
Yj=α+β1Xhh+β2Xinc+ε Where, is the intercept and it indicates the mean value ofthe response variable when = 0; j is the slope and it indicatesthe average change in the response variable, when the ran-dom variable rise, is the term of the average random error.
Analytical procedure: Solid waste amount and composi-tion were analysed at the ambient laboratory by using ana-lytical balance (accuracy of 100 g for solid waste and 0.01 gfor plastic bag). The statistical analysis and multi-variableslinear regression were analysed by SPSS ver.22.0 software(T-test, ANOVA, single-multi linear regression analysis).
RESULTS AND DISCUSSION
Waste Generation Rate in Ho Chi Minh City
644 households were selected to identify the compositionand generation rate in Ho Chi Minh City (except for cen-tralized generation sources as enterprises, facilities, hospi-tals and schools, etc.). Based on the analysis, the resultsindicate a wide range of HSW generation, ranging from 0.1kg/capita/day (minimum) to 1.47 kg/capita/day (maximum).
In average, the waste generation is 0.41 kg/capita/day(SD = 0.313) (Fig. 1). Transferring to normal distribution, at95% confidence interval of the difference, the generationrate is 0.39-0.43 kg/capita/day. This number is lower in com-parison with the generation rate analysed by Dieu et al.(2014), the average HSW generation rate was 0.60 kg/capita/day which ranged from 0.53-0.63 kg/capita/day, due to twomain reasons: (1) only 90 households in Dieu’s study areselected to survey and almost located in central district withresident’s income as uniform and higher than other areasand (2) Dieu’study assumed that the average household sizeis 4 members. This study, in fact measured that the house-hold size ranges from 1 member/household to more than 8
Table 2: Variables definition.
Variables Symbol Unit Definition
Household size XHHS Persons/household Number of members per householdHousehold income Xinc VND/person.household Total income of all members divided by the total member of householdGeneration rate Yj kg/capital.day Solid waste production per capita per day
Table 3: Waste composition and generation rate in Ho Chi Minh City.
Min - Max SD Mean 95% confidence Referencesinterval of the difference
Total waste generation 0.10-1.47 0.313 0.41 0.39-0.43 This study 2015(kg/capita/day)
0.43-0.75 - 0.6 0.53-0.63 Dieu et al. (2014)- - 0.28 0.15-0.3 Thanh et al. (2010)
Food waste(kg/capita/day) 0.00-1.25 0.216 0.23 0.22-0.25 This study (2015)- - - 0.25-0.34 Dieu et al. (2014)- - 0.228 - Thanh et al. (2010)
Plastic bag(kg/capita/day) 0.00-0.38 0.033 0.032 0.030-0.034 This study (2015)- - - 0.0243-0.0364 Dieu et al. (2014)- - 8.55.10-3-9.067.10-3 - Thanh et al. (2010)

355MATHEMATICAL MODEL FOR ESTIMATING HOUSEHOLD SOLID WASTE GENERATION
Nature Environment and Pollution Technology Vol. 16, No. 2, 2017
member/household. By contrast, the amount of waste in CanTho City, 0.28 kg/capita/day, (Thanh et al. 2010) is lowerthan that of this study (Table 3), and it might be due to GDP-an index playing a significant role in the difference of wastegeneration rates (Xu et al. 2013). Apparently, the GDP valueof Can Tho City was 2800 USD/capita/year which is lowerthan GDP of Ho Chi Minh City (HCMC) with 5100 USD/capita/year. Hence, it is possible to say that the solid wastegeneration rate not only depends on the GDP per capita butalso other factors (Gu et al. 2015). The GDP of Beijing,Mexicali and Dublin is higher than that of HCMC, whereasthe waste generation rate is lower or almost similar to HCMC(Table 4).
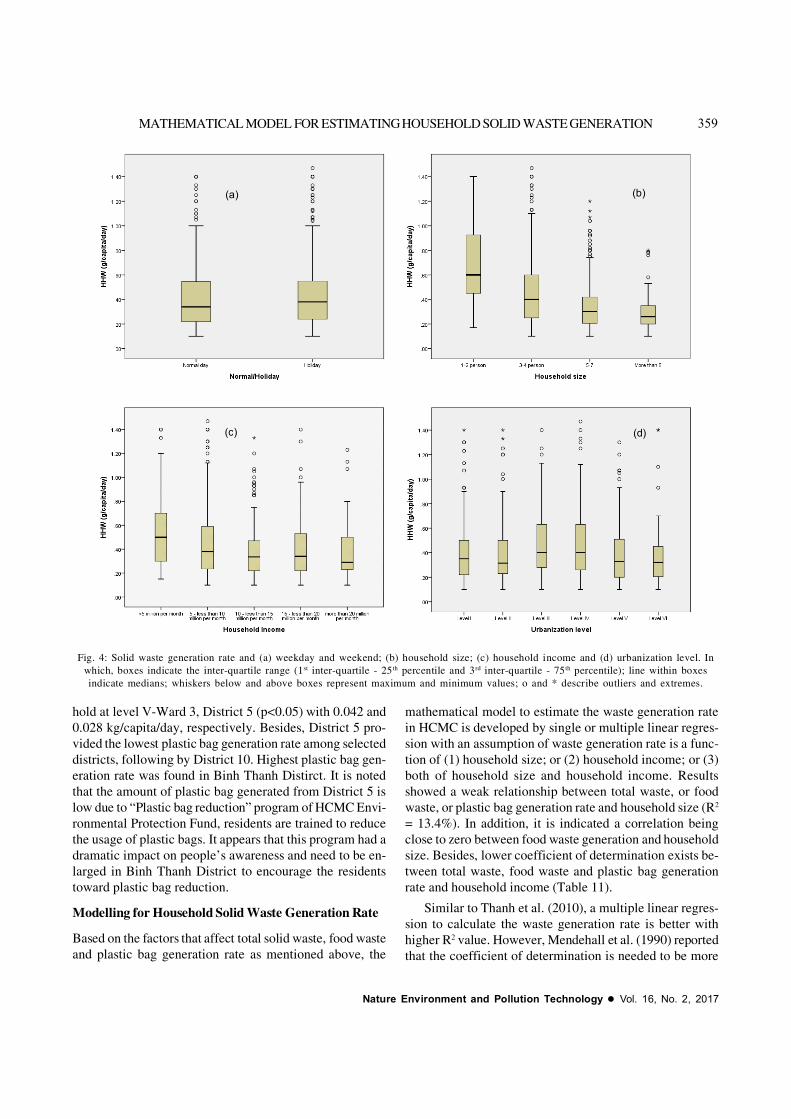
The food waste generation rate fluctuated dramatically,from 0.00-1.25 kg/capita/day with the average of 0.23 kg/capita/day (Fig. 2). Similarly, in normal distribution, thegeneration rate is 0.22-0.25 kg/capita/day ranked the high-est frequency. In terms of plastic bag, the generation rateaverages at 0.032 kg/capita/day (Fig. 3), whereas, in normaldistribution with 95% confidence interval of the difference,the generation rate is 0.030-0.034 kg/capita/day. The foodwaste amount of HCMC stays almost the same in severalstudies (Dieu et al. 2014 and Thanh et al. 2010) while theplastic bag quantity in Can Tho City is lower.
On the other hand, the rate between food waste and totalwaste in this study is 61.63% (SD = 22.79). This result al-most resemble to Dieu’s study (68.8%) but smaller than thatof Thanh’s study (77.31% in dry season and 78.19% in rainyseason). In addition, the mass of plastic bag per total solidwaste is 7.67% (frequency distribution in range of 7.30 and
8.07%) higher than these rates of Dieu et al. (2014), 4.8%,and Thanh et al. (2010), 3.02% in dry season and 3.15% inrainy season, (Table 3). This result points out that there is asignificant difference in waste generation between HCMCand Can Tho. The food to total waste ratio in Ho Chi Minhis lower than that of Can Tho, whereas the plastic bag tototal waste ratio in Can Tho is lower than that of HCMC.Can Tho is a city integrated with urban and rural areas re-sulting in lower waste generation rate when compared withHCMC. This point of view is similar to Miezah’s study(2015), the waste generation rate in developed areas is higherand vice versa. There is a large amount of food waste in thewaste composition of urban-rural combined area due to thehabit of residents, they often buy raw material while in urbanarea, and higher income people often buy fabricated food insupermarkets. Besides, the standard deviation of total waste,food waste and plastic bag generation rate is relatively highbecause of large sample size (644 households).
Factors Affecting Household Solid Waste Generation Rate
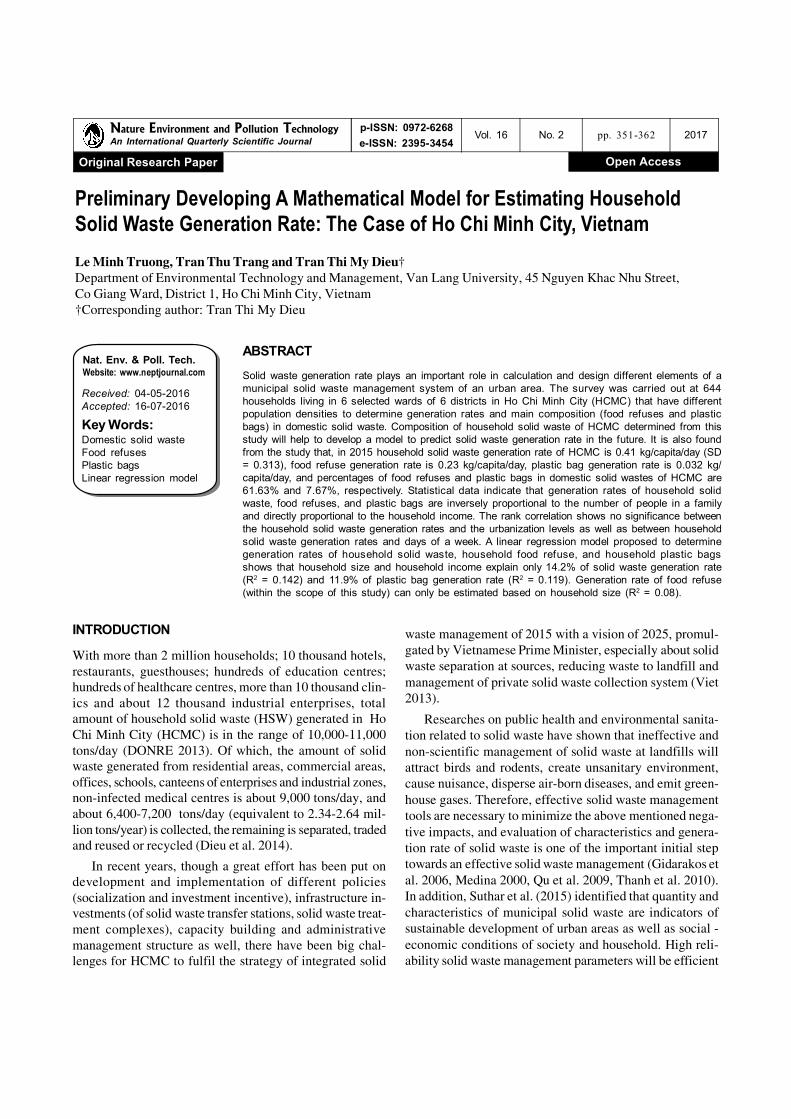
HSW generation between weekday and weekend: Table 5and Fig. 4(a) present results of household waste generationrate among days of week. It can be seen that the largestquantity of total waste and food waste were both producedat weekends (0.44 and 0.29 kg/capita/day), but comparingto weekdays (0.42 and 0.26 kg/capita/day), the difference isnot significant. By contrast, the generation rate of plasticbag on weekdays is higher than at weekends (0.039 and0.036 kg/capita/day, respectively). Likewise, the total wasteand food waste generation rate from Thanh et al. (2010) was
Mean = .41 Std.Dev. = .313 N = 644
HSW (kg/capita/day)
Freque
Mean = .23 Std.Dev. = .216 N = 644
Fig. 1: Distribution frequency of HSW generation in HCMC.Fig. 2: Distribution frequency of household food waste
generation rate in HCMC.

356 Le Minh Truong et al.
Vol. 16, No. 2, 2017 Nature Environment and Pollution Technology
0.31 and 0.26 kg/capita/day and the rate of weekend is higherthan its weekday that can be explained by living character-istic of HCMC residents. On weekdays, almost all membersare in their offices, factories, companies and schools, onlychildren and old/retired people are at home. Solid waste isonly produced in the evening after they come back home.The residents often spend weekends together that results in
the larger solid waste generation rate. Besides, several house-holds are in the habit of buying and preliminary treatingfood at the weekends to preparing for next week, hence itleads to the increase in HSW at weekends. However, theplastic bags generation is higher on weekdays compared toweekends due to the habit of using cooked speciality andplastic bags. On the weekend, people do not buy the cooked
Table 4: GDP and waste generation rate in comparison with different studies.
Studied area Average(kg/capita/day) GDP(USD/capita.year) References
Total waste Ho Chi Minh, Vietnam 0.41 5100 This study (2015)Can Tho, Vietnam 0.28 2800 Thanh et al. (2010)Mexicali, Mexico 0.59 14300 Benitez et al. (2013)Beijing, China 0.23 6000 Qu et al. (2009)Dublin, Ireland 0.53 45500 Denninson et al. (1996b)
Table 5: Waste generation rate between weekday and weekend.
Parameter Sample size Total waste Food waste Plastic bag
Mean SD Mean SD Mean SD
Weekdays 319 0.4223 0.27720 0.2605 0.20093 0.0385 0.03353Weekends 325 0.4422 0.28822 0.2876 0.22870 0.0362 0.03271Sig. 0.372 0.111 0.377
Table 6: Waste generation rate from different household size.
Parameter Sample size Total waste Food waste Plastic bagMean r Mean r Mean r
(kg.capita-1.day-1) (kg.capita-1.day-1) (kg.capita-1.day-1)
1-2 members 6 4 0.7019 -0.368* 0.4205 -0.278* 0.0684 -0.339*3-4 members 275 0.4695 0.2993 0.04055-7 members 260 0.3470 0.2263 0.0283>8 members 4 5 0.3144 0.1891 0.0256
*Use the Spearman’s correlation factor at significant level of 0.01
Table 7: Multiple comparisons between waste generation rate and household size.
Household Household Total waste Food waste Plastic bag size - I size - J Mean of difference Sig. Mean of difference Sig. Mean of difference Sig.
(I-J) (I-J) (I-J)
1-2 member 3-4 member 0.23242* 0.000 0.12116* 0.010 0.02793* 0.0025-7 member 0.35484* 0.000 0.19416* 0.000 0.04017* 0.000>8 member 0.38743* 0.000 0.23136* 0.000 0.04288* 0.000
3-4 member 1-2 member -0.23242* 0.000 -0.12116* 0.010 -0.02793* 0.0025-7 member 0.12242* 0.000 0.07300* 0.000 0.01224* 0.000> 8 member 0.15501* 0.000 0.11020* 0.000 0.01495* 0.000
5-7 member 1-2 member -0.35484* 0.000 -0.19416* 0.000 -0.04017* 0.0003-4 member -0.12242* 0.000 -0.07300* 0.000 -0.01224* 0.000> 8 member 0.03259 0.851 0.03720 0.483 0.00271 0.951
> 8 member 1-2 member -0.38743* 0.000 -0.23136* 0.000 -0.04288* 0.0003-4 member -0.15501* 0.000 -0.11020* 0.000 -0.01495* 0.0005-7 member -0.03259 0.851 -0.03720 0.483 -0.00271 0.951
*The mean difference is significant at the 0.05 level

357MATHEMATICAL MODEL FOR ESTIMATING HOUSEHOLD SOLID WASTE GENERATION
Nature Environment and Pollution Technology Vol. 16, No. 2, 2017
speciality so the amount of plastic bags reduces. In term ofstatistics, the difference of total waste, food waste and plas-tic bag generation rate between weekdays and weekend isnot significant (p>0.05) and look similar to Qu et al. (2009).The standard deviation is large, meaning that there is un-equal amount of waste quantity among different house-holds, which is also showed in other studies (Thanh et al.2010, Suthar 2015).
Difference of HSW generation in household size: In orderto evaluate the influence of household size on wastegeneration rate, household size was classified into 4 cat-egories which are (1) 1-2 members; (2) 3-4 members; (3) 5- 7members and (4) 8 members and more. Household solidwaste generation rate at different household size is illus-trated in Fig. 4(b). The mean values of total solid waste,food waste and plastic bag generation rate are summarizedin Table 6. It is apparent that almost all households in HCMChas 3-7 residents in which 275/644 households and 260/644 household are in the size of 3-4 residents and 5-7 resi-dents, respectively. In addition, the results indicate that thegeneration rate of total waste, food waste and plastic bagfrom 1-2 household size are higher than 3 and more house-hold size (accounted for 0.70; 0.42 and 0.06 kg/resident/day, respectively). The ANOVA results represented signifi-cant differences in total waste, food waste and plastic baggeneration rate between 4 categories (p<0.05). However,there is no significant distinction between household in thesize of 5-7 members and 8 members and more (p>0.05) (Ta-ble 7).
It can be seen that the household solid waste generationrate is inversely proportional to household size. The smallerthe household is, the larger the waste generation rate is.These data are adequate to correlation statistical analysisbetween household size and waste generation rate. Also,similar phenomenon was found in other studies (Thanh etal. 2010, Dennison et al. 1996b, Bandara et al. 2007, Qu etal. 2009). The result of correlation analysis is presented inTable 6.
Difference of household solid waste generation in house-hold income: Household income was divided into fivegroups to evaluate the influence of household income onwaste generation rate, named (1) under 5 million VND/month.household; (2) 5-10 million VND/month.household;(3) 10-15 million VND/month.household; (4) 15-20 mil-lion VND/month.household and (5) more than 20 millionVND/month.household with the waste generation rate ofeach group as shown in Fig. 4(c). The difference of house-hold solid waste generation in household income is sum-marized in Table 8. The ANOVA results represented signifi-cant differences in waste generation rate between 5 groups
(p<0.05). There are differences in total waste generationbetween household with income of under 5 million VND/month and household with income of 10-15 and more than20 million VND/month (p < 0.05). Similarly, differences inplastic bag generation rates were also found between thehousehold with income under 5 million VND/month andhousehold with income more than 20 million VND/month.However, in terms of food waste generation, significant dif-ference cannot be found (p>0.05). It can be seen from theresult of rank correlation analysis (p<0.01) that householdincome is proportional to the quantity of total waste, foodwaste and plastic bag. This result is same to that of the re-sults from the studies of Thanh et al. (2010), Denninson etal. (1996a,b) and Bandara et al. (2007). Plastic bag genera-tion rate is in correlation with household income (rank cor-relation coefficient is 0.177) which is higher than rank cor-relation coefficient of total waste generation rate (0.169)and food waste generation rate (0.120). It is noted that thestudy conducted by Thanh et al. (2010) in Can Tho couldnot provide the correlation between HSW generation andhousehold income.
Household income of 10-15 and 15-20 million VND/month ranked the highest ratio of food waste and total wastewith 65.49% and 61.18%, respectively, whereas income ofunder 5 million VND/household.month occupied the low-est ratio (56.08%). Hence, it is apparent to conclude thatfood waste is the main composition of total waste, and theratio of food waste and total waste among 5 groups of house-
Mean = .032 Std.Dev. = .033 N = 644
Fig. 3: Distribution frequency of household plastic baggeneration rate in HCMC.

358 Le Minh Truong et al.
Vol. 16, No. 2, 2017 Nature Environment and Pollution Technology
hold size is not markedly different (p>0.05). Unlikely, thelargest percentage of plastic bags in the total waste is fromhousehold income of under 5 million VND/month with10.37% and the lowest is from household income of 5-10million VND/month (8.93%). However, ANOVA results rep-resented no significant differences in plastic bag percentilebetween 5 groups (p>0.05). The results of these ratios aresimilar to the study of Suthar et al. (2015), and are indicatedin Table 9.
Difference of household solid waste generation in urbani-zation level: The urbanization level is classified into 6 cat-egories and their effect on household solid waste genera-tion rate is described in Table 10 and Fig. 4(d).
The total waste, food waste and plastic bag generationrate among 6 urbanization levels range from 0.37-0.48 kg/capita/day; 0.25-0.3 kg/capita/day and 0.027-0.048 kg/
capita/day, respectively. The result of rank correlation analy-sis show no relationship between urbanization level andhousehold waste, food waste, and plastic bag (p > 0.01). TheANOVA results illustrate significant differences (p<0.05)existed between the household at level III-Ward 25, BinhThanh District-having a population density of 17.323capita/km2 and HSW generation rate of 0.48 kg/capita/day,and household at level VI-Ward 13, District 10-having apopulation density of 49.996 capita/km2 and HSW genera-tion rate of 0.37 kg/capita/day. Besides, Ward 13, District10 (belongs to level VI) shows the lowest HSW generationrate among surveyed districts. Results indicated no signifi-cant differences in the food waste generation rate amongurbanization levels (p>0.05). However, there are significantdifferences in the plastic bag generation between house-hold at level III-Ward 25, Binh Thanh District and house-
Table 8: Waste generation rate from different household income.
Parameter Total waste Food waste Plastic bag
Mean Rank Mean Rank Mean Rank(kg.capita-1 correlation (kg.capita-1 correlation (kg.capita-1 correlation.day-1) coefficienta .day-1) coefficienta .day-1) coefficienta
Under 5 million VND/month 0.5961 0.3618 0.05675-10 million VND/month 0.4644 0.22970 0.038810-15 million VND/month 0.3962 0.169** 0.19598 0.120** 0.0331 0.177**15-20 million VND/month 0.4144 0.21110 0.0361More than 20 million VND/month 0.3862 0.17874 0.0360
**p < 0.01; acorrelation analysis using Spearman’s correlation
Table 10: Waste generation rate from different population density.
Parameter Total waste (kg.capita-1.day-1) Food waste (kg.capita-1.day-1) Plastic bag (kg.capita-1.day-1)
Mean SD Rank Mean SD Rank Mean SD Rankcorrelation correlation correlationcoefficienta coefficienta coefficienta
Level I 0.4097 0.26716 * * 0.2589 0.20588 * * 0.0362 0.03037 * *Level II 0.4182 0.28661 0.2755 0.21585 0.0399 0.03262Level III 0.4803 0.29262 0.2988 0.22489 0.0416 0.03544Level IV 0.4862 0.30199 0.3011 0.23536 0.0407 0.02983Level V 0.4096 0.27817 0.2536 0.20544 0.0284 0.02703Level VI 0.3742 0.24935 0.2520 0.19880 0.0370 0.04421
**p < 0.01; acorrelation analysis using Spearman’s correlation
Table 9: Ratio of food waste and total waste, plastic bag and total waste from different household income.
Food waste/Total waste Plastic bag/Total waste
Mean (%) SD Mean (%) SD
Under 5 million VND/month 56.0807 25.47467 10.3667 5.672975 -10 million VND/month 60.4211 23.65518 8.9321 5.8886810 -15 million VND/month 65.4923 21.91109 9.2395 8.4742315-20 million VND/month 62.1791 20.95550 9.1973 6.08513More than 20 million VND/month 58.5525 23.11676 9.4428 5.44233
359MATHEMATICAL MODEL FOR ESTIMATING HOUSEHOLD SOLID WASTE GENERATION
Nature Environment and Pollution Technology Vol. 16, No. 2, 2017
hold at level V-Ward 3, District 5 (p<0.05) with 0.042 and0.028 kg/capita/day, respectively. Besides, District 5 pro-vided the lowest plastic bag generation rate among selecteddistricts, following by District 10. Highest plastic bag gen-eration rate was found in Binh Thanh Distirct. It is notedthat the amount of plastic bag generated from District 5 islow due to “Plastic bag reduction” program of HCMC Envi-ronmental Protection Fund, residents are trained to reducethe usage of plastic bags. It appears that this program had adramatic impact on people’s awareness and need to be en-larged in Binh Thanh District to encourage the residentstoward plastic bag reduction.
Modelling for Household Solid Waste Generation Rate
Based on the factors that affect total solid waste, food wasteand plastic bag generation rate as mentioned above, the
(a)
(c) (d)
(b)
mathematical model to estimate the waste generation ratein HCMC is developed by single or multiple linear regres-sion with an assumption of waste generation rate is a func-tion of (1) household size; or (2) household income; or (3)both of household size and household income. Resultsshowed a weak relationship between total waste, or foodwaste, or plastic bag generation rate and household size (R2
= 13.4%). In addition, it is indicated a correlation beingclose to zero between food waste generation and householdsize. Besides, lower coefficient of determination exists be-tween total waste, food waste and plastic bag generationrate and household income (Table 11).
Similar to Thanh et al. (2010), a multiple linear regres-sion to calculate the waste generation rate is better withhigher R2 value. However, Mendehall et al. (1990) reportedthat the coefficient of determination is needed to be more
Fig. 4: Solid waste generation rate and (a) weekday and weekend; (b) household size; (c) household income and (d) urbanization level. Inwhich, boxes indicate the inter-quartile range (1st inter-quartile - 25 th percentile and 3rd inter-quartile - 75 th percentile); line within boxesindicate medians; whiskers below and above boxes represent maximum and minimum values; o and * describe outliers and extremes.

360 Le Minh Truong et al.
Vol. 16, No. 2, 2017 Nature Environment and Pollution Technology
Table 11: Modeling for household waste generation rate.
Generation rate Household sizeEstimated model R2 R p
Total waste Ytotal= 0.690 - 0.056XHHS 0.134 0.367 <0.05
Food waste Yfood= 0.425 - 0.033XHHS 0.08 0.282 <0.05
Plastic bag Ynylon= 0.064 - 0.006XHHS 0.101 0.318 <0.05
Generation rate Household incomeEstimated model R2 R p
Total waste Ytotal= 0.329 + 3.404×10⁻⁸Xinc 0.042 0.205 <0.05
Food waste Yfood=0.221 + 1.766 × 10⁻⁸Xinc 0.019 0.139 <0.05
Plastic bag Yfood= 0.024+ 4.511×10⁻⁹Xinc 0.054 0.232 <0.05
Generation rate Household size and incomeEstimated model R2 R p
Total waste Ytotal= 0.621 - 0.051XHHS+ 1.547×10⁻⁸Xinc 0.142 0.377 <0.05
Food waste Yfood= 0.397 - 0.031XHHS+6.468×10⁻⁹Xinc 0.082 0.286 pinc = 0.204
phhs< 0.05
Plastic bag Ynylon=0.051 - 0.005XHHS + 2.753×10⁻⁹Xinc 0.119 0.345 <0.05
than 35% to obtain a higher accuracy level. It can be con-cluded that the proposed modelling for generating totalwaste and plastic bag [Y
n = (X
hhs, X
inc)] achieve higher con-
fidence interval of the difference. However, it is announcedthat in term of household size, household member shouldrange from 1 to13 members. Household of more than 14members will result of waste generation rate going belowzero. The formulas to calculate household solid waste gen-eration are represented as follows:
Ytotal= 0.621 - 0.051XHHS + 1.547×10⁻⁸Xinc ...(1)
Ynylon= 0.051 - 0.005XHHS + 2.753×10⁻⁹Xinc ...(2)
The results given in Table 11 provide that householdsize and household income explain 14.2% of householdwaste generation, and 11.9% of plastic bag generation.Hence, there must be other factors contributing to HCMCHSW generation. A research carried out by Talalaj et al.(2015) phased out that waste generation rate (kg/capita/day) is more dependant on the number of unemployedwomen (R2 = 0.70) and female to male ratio (R2 = 0.81).Thus, further studies should consider these factors whenestimating the household waste generation rate in HCMC.As per the equation (1) and (2), the interpretation of linearequation for each of its coefficient is as follows: (1) keepingvariable X
incunchanged means that, on average, household
waste and plastic bag generation rate will decrease 0.051 kgand 0.005 kg, respectively, when the number of householdmember increases by one person; and (2) keeping variableX
HHS unchanged means that, on average, the quantity of
household waste and plastic bag will increase 1.547×10⁻⁸
kg and 2.753×10⁻⁹ kg, respectively, when the householdincome per capita increases by 1,000,000 VND. Besides,regression coefficient () of all models means that there isa relationship existing among variables. This relationship,however, is very weak, especially the relationship withthe household income variable shows the weakest ( < 3.5× 10⁻⁸). On the top of that, household income variable mustbe considered carefully when seeking for an explanation ofHSW in an area, especially in the Asian region. Similar toThanh’s (2010) point of view, people normally are not will-ing to answer the information or propose an imprecise an-swer. The household income variable in a multiple regres-sion model for estimating food refuse generation shows nosignificance (p > 0.05). Hence, it is obvious to say that house-hold income and household size demonstrate its statisticalsignificance to predict food refuse generation when beingexplained separately, whereas, when combined together,only household size variable gets closer to a better interpre-tation of the food remnant generation rate of a household.
CONCLUSIONS AND RECOMMENDATIONS
Conclusions
1. The average HSW generation rate in Ho Chi Minh (notaccounted for centralized generation sources) is 0.41kg/capita/day (SD = 0.313) with the 95% confidenceinterval of the difference of 0.39-0.43 kg/capita/day.
2. GDP is not a main driving force behind HSW generationrate in Ho Chi Minh. In fact, in terms of GDP, the HSW

361MATHEMATICAL MODEL FOR ESTIMATING HOUSEHOLD SOLID WASTE GENERATION
Nature Environment and Pollution Technology Vol. 16, No. 2, 2017
generation rate in Ho Chi Minh is much higher whencompared with other foreign regions (China, Mexico,Ireland).
3. The average generation rate of household food refusesin Ho Chi Minh is 0.23 kg/capita/day, and that of plas-tic bags is 0.032 kg/capita/day. The ratio of food refusesto total solid waste is 61.63% while that ratio of plasticbags and total waste is 7.67%.
4. Household habits give tremendous influence on the gen-eration of HSW, food refuse and plastic bags.
5. Practically, household solid waste generation on week-days is 0.422 kg/capita/day while the rate of weekends(Saturday and Sunday) is 0.442 kg/capita/day. For foodrefuses, the generation rate during weekdays and holi-days is 0.260 kg/capita/day and 0.287 kg/capita/day,respectively. Similarly, the plastic bag generation rateis 0.0385 kg/capita/day (weekdays) and 0.0362kg/capita/day (holidays). However, the study found no sig-nificant differences of these rates between weekdays andweekends.
6. ANOVA analysis results provide the average significantdifferences for all household size categories. The differ-ences, however, were not found for the household sizeof 5-7 residents and more than 8 residents. The studyalso phases out that the larger the household size is, theless the waste generation rate is.
7. Waste generation rate of different household incomesindicates the significant differences between house-hold having an income of less than 5 million/house-hold. month and those having an income ranging from10-15 and more than 20 million/household.month. Thismeans that the income can ever be considered as animportant factor if the difference in income/capita.household is significant. In addition, theANOVA test shows the significant difference in theplastic bag generation between household having anincome of less than 5 million/month and household ofincome of more than 20 million/month. For food rem-nant generation among household incomes, however,the study found no significant difference. The resultsalso figure that waste generation rate is proportional tothe household income.
8. Rank correlation analysis shows no significant correla-tion between population density and household waste,food refuse, and plastic bag generation. When comparedwith Binh Thanh district in terms of plastic bag genera-tion rate, the amount of plastic bag generated in BinhThanh district (kg/capita/day) is much higher than thatof District 5, and highest among the districts involved
in the study, whereas District 5 shows the smallest plas-tic bag generation rate;
9. Models for estimating waste generation rate based onhousehold size, or household income, or a combinationof these two variables indicates a low relationship amongthe variables and household waste, food refuse, and plas-tic bag generation. Within the scope of the study, re-gression model indicates that changes in household sizeand household income can only explain for 14.2% ofthe changes in waste generation rate and for 11.9% ofthe changes of plastic generation rate. In other words,among the variables affecting waste generation rate,household size and income account for only 14.2% and11.9%, and that of plastic bag is 11.9%. Hence, there areother reasons which can explain the waste generation inHCMC.
Recommendations: In order to improve the model for esti-mating household waste generation in Ho Chi Minh, fol-lowing issues should be considered in the next study:
1. For establishing a sampling network, selection of thestudy areas should be based on the local socio-economicconditions or the city master plan.
2. Considering the method for gathering household incomedata. In this study, household income is obtained byface to face interview approach. Hence, the results arenot close to the real, and that leads to a low reliabilitymodel. A proposal to approach a reliability study in thefuture is to know the job details of those who are consid-ered as the main income earner of the household. Conse-quently, household income will be counted based onthe basic salary regulated by the government.
3. Age structure (including age of working member, post-working age women/men) should be considered as avariable having strong relationship to the waste genera-tion rate.
4. The model should regard a variable of female to house-hold member ratio, number of female of age of less than18, 18-64, and more than 64, and the number of unem-ployed women (including part-time working women).Talalaj et al. (2015) provided that the more women inthe household is, the more waste the household gener-ates due to various reasons (single woman, their habitat,etc.).
5. The model should view the effect of education level onwaste generation. Education level is assessed as thenumber of years the main household income earner at-tended school. It is expected that the education level isproportional to the awareness, hence affects the house-hold waste generation.

362 Le Minh Truong et al.
Vol. 16, No. 2, 2017 Nature Environment and Pollution Technology
ACKNOWLEDGEMENT
The study was supported by the “Plastic Bag Reduction”program in HCMC funded by the HCM Environmental Pro-tection Fund - Ho Chi Minh City Department of NaturalResources and Environment (HCMC-DONRE). The authorsappreciate the staff of Ho Chi Minh Environmental Protec-tion Fund-HCM DONRE and students at K19M01-Depart-ment of Environmental Technology and Management atVan Lang University, including Hieu. N.M., Hoang. T.N.,Long. T.H., Luan. N.T., Quan. H.T., Sang. L.H., Toan. N.M.,và Tu. B.T., for their assistance in the study.
REFERENCESBandara, N.J.G.J., Hettiaratchi, J.P.A., Wirasinghe, S.C. and Pilapiiya,
S. 2007. Relation of waste generation and composition to socio-economic factors: a case study. Environ. Monit. Assess., 135(1-3): 31-39.
Benitez, S.O., Gabriela Lozano-Olvera, Raúl Adalberto Morelo, Caro-lina Armijo de Vega 2008. Mathematical modelling to predictresidential solid waste generation. Waste Management, 28: S7-S13.
Gu, B., Wang, H., Chen, Z., Jiang, S., Zhu, W., Liu, M., Chen, Y., Wu,Y., He, S., Cheng, R. and Yang, J. 2015. Characterization,qualification and management of household solid waste: A casestudy in China. Resources, Conservation and Recycling, 98: 67-75.
Buenrostro, O., Bocco, G. and Vence, J. 2001. Forecasting generationof urban solid waste in developing countries-A case study inMexico. J. Air Waste Manage. Assoc., 51: 86-93.
Chang, N.B. and Davila, E. 2008. Municipal solid waste characteriza-tions and management strategy for the Lower Rio Grandle Val-ley: Texas. Waste Manag., 28(5): 776-94.
Couth, R. and Trois, C. 2011. Waste management activities and car-bon emissions in Africa. Waste Manage., 31(1): 131-137.
Dennison, G.J., Dodd, V.A. and Whelan, B. 1996a. A socio-eco-nomic based survey of household waste characteristics in the cityof Dublin, Ireland. I. Waste composition. Resour. Conserv. Recycl.,17(3): 227-44.
Dennison, G.J., Dodd, V.A. and Whelan, B. 1996b. A socio-eco-nomic based survey of household waste characteristics in the cityof Dublin, Ireland-II. Waste quantities. Resour. Conserv. Recycl.,17(3): 245-57.
Dieu, T.T.M., Truong, L.M. and Viet, N.T. 2014. Composition andgeneration rate of household solid waste: Reuse and recyclingability. A case study in district 1st, Ho Chi Minh City, Vietnam.Internal Journal of Environmental Protection, 4: 73-81.
DONRE, 2013. Report on Solid Waste Management in Ho Chi MinhCity.
Gidarakos, E., Havas, G. and Ntzamilis, P. 2006. Municipal solidwaste composition determination supporting the integrated solidwaste management system in the island of Crete. Waste Manage-ment, 29: 2227-2239.
Hancs, A., Novak, P., Dvorak, M., Habart, J. and Svehla, P. 2011.Composition and parameters of household bio-waste in fourseasons. Waste Manage., 31: 1450-1460.
HCMC Statistical Office 2014. Statistical Yearbook of Ho Chi MinhCity 2013. Youth Publishing House.
IPCC 2006. IPCC Guidelines for Greenhouse Gas Inventories. Inter-governmental Panel on Climate Change (IPCC).
Mendenhall, W., Wackerly, D.D. and Scheaffer, R.L. 1990. Math-ematical Statistics with Applications. Brooks/Cole.
Miezah, K., Obiri-Danso, K., Kádár, Z., Fei-Baffoe, B. and Mensah,M. Y. 2015. Municipal solid waste characterization and qualifi-cation as a measure towards effective waste management inGhana. Waste Management, 46: 15-27.
Medina, M. 2000. Scavenger cooperatives in Asia and Latin America.Resour. Conserv. Recycl., 31: 59-61.
Qdais, H.A., Hamonda, M.F. and Newham, J. 1997. Analysis ofresidential solid waste at generation sites, Waste Manage. Res.,15: 395-406.
Qu, X.Y., Li, Z.S., Xie, X.Y., Sui, Y.M., Yang, L. and Chen, Y.2009. Survey of composition and generation rate of householdwastes in Beijing: China, Waste Manag., 29(10): 2618-24.
Ranjith, K.A. 2012. Sustainable Solid Waste Management in India.A thesis submitted to the Department of Earth and Environmen-tal Engineering, in partial fulfillment of the requirement for thedegree of MSc in Earth Resource Engineering, Fu FoundationSchool of Engineering and Applied Science, Columbia Univer-sity.
Suthar, Surindra and Singh, Pavitra 2015. Household solid wastegeneration and composition in different family size and socio-economic groups: A case study. Sustainable Cities and Society,14: 56-63.
Thanh, N.P., Matsui and Fujiwara, T. 2010. Household solid wastegeneration and characteristic in Mekong Delta city: Vietnam. J.Environ. Manag., 91(11): 2307-21.
Thanh, B.N., D. Ary A. Samsura, Erwin van der Krabben and Anh-Duc Le 2016. City profile. Saigon-Ho Chi Minh City. Cities, 50:16-27.
Talalaj, I.A. and Walery, M. 2015. The effect of gender and agestructure on municipal waste generation in Poland. Waste Man-agement, 40: 3-8.
Viet, T.N. 2013. Assessment of possibility of establishing a zeroinvestment solid waste management. A financial feasibility as-pect. Internal Journal of Environmental Science and Sustain-able Development-Department of Environmental Technologyand Management, Van Lang University, 3: 14-21.
Xu, L.L., Yan, Z. and Cui, S.H. 2013. Path analysis of influencingfactors on municipal waste generation: A case study of Xiamencity. J. Environ. Sci., 2(33): 1180-5.