preface - dag vikan, it-konsulent · web viewbiofuels and specifically ethanol are part of the...
TRANSCRIPT
NORWEGIAN UNIVERSITY OF SCIENCE AND TECHNOLOGYTKP4852 – EXPERTS IN TEAMWORK (CO2 CAPTURE)
Conversion of duckweed to bioethanol and animal feed in Brazilian
integrated farming
Christiansen, Ida Gracey, Erik
Nazarpour, RasaRondón, Pedro
Skjerstad, Peter
Abtract
Duckweed species offer remarkable potential for biological carbon reduction solutions.
Duckweeds are tiny aquatic plants that grow optimally on swine wastewater with extremely
high yields per hectare. High starch species of duckweed can be refined into bioethanol, while
high protein varieties are viable substitutes for soybean protein. The goal of this report is to
explore and analyze the mitigation potential of integrated duckweed farming solutions. The
scope is the pig farming industry in Brazil. Industrial ecology principles and life cycle analysis
are used to analyze mitigation potential using a robust literature scan.
PrefaceThis opportunity was provided by the Norwegian University of Science and Technology
(NTNU), Faculty of Natural Sciences and Technology, Department of Chemical Engineering.
The project was conducted during Experts in Teamwork in a period from 16 th of January until
2nd of May.
Thank you to our village supervisor Hanna Knuutila for constructive advice during this process
and to Isak Fossland for providing us with duckweed.
NTNU, Trondheim, 02.05.13
(Signature) (Signature) (Signature)
Ida Christiansen Peter Skjerstad Erik Gracey
(Signature) (Signature)
Pedro Rondón Rasa Nazarpour
I

SummaryWhat makes this project unique is the use of a methodology called industrial ecology. This
means organizing production to mimic how nature works. In nature nothing is wasted and this
is also the goal of the project. With this in mind, an opportunity to capture carbon emissions
from the transport sector were looked at. Biological sequestration of carbon is earth's only
native technology and also the best. Biofuels and specifically ethanol are part of the answer for
solving the carbon problem in the transportation sector. This project therefore focused on
finding the best feedstock for bioethanol production.
Duckweed is the world's fastest growing flowering plant, able to double its biomass in 24 hours
under ideal conditions. Duckweed has many advantages over other feedstocks like corn and
sugar cane, which make it a cheap and effective carbon capture solution. Duckweed floats, it
grows on highly concentrated wastewater, and can be grown to either produce high protein
varieties or high starch varieties. High starch is perfect for ethanol production and high protein
has been shown to be equivalent to soy protein in animal feed. The highest yields in pilot
studies come from the use of swine wastewater from pork production.
Brazil was the perfect place for a feasibility study as it is the world's 2nd largest producer of
ethanol and 4th in pork. Our feasibility splits Brazil into two production zones. Zone E is the
region with over 75 % of biorefinery infrastructure and 34 % of swine production. Zone E is
therefore the only zone where we can produce low, cost carbon ethanol from duckweed. This
study estimates savings in CO2 emissions could reach up to 13.5 ktonnes CO2 by taking
advantage of the ideal conditions to produce duckweed bioethanol in this region.
On the other hand, the rest of Brazil has a high capacity for duckweed production, but lacks the
capability to produce ethanol. High protein duckweed can therefore be used in this zone to
produce animal feed. The result of zone P production is high quality animal feed that replaces
soy production, reducing carbon emissions by 249 ktonnes and eliminating other important
environmental impacts.
II

Table of Contents
PREFACE....................................................................................................................................I
SUMMARY................................................................................................................................II
TABLE OF CONTENTS.........................................................................................................III
GLOSSARY..............................................................................................................................IV
1 INTRODUCTION...............................................................................................................1
2 CLIMATE DATA AND TRANSPORTATION...............................................................3
3 BIOFUELS...........................................................................................................................5
3.1 BIOETHANOL..................................................................................................................6
4 DUCKWEED.......................................................................................................................9
4.1 DUCKWEED AS A FEEDSTOCK FOR BIOETHANOL PRODUCTION..................................10
4.2 HIGH PROTEIN DUCKWEED GROWN ON SWINE WASTEWATER AS ANIMAL FEED......10
5 INDUSTRIAL ECOLOGY..............................................................................................11
6 FEASIBILITY STUDY.....................................................................................................13
6.1 METHODS.....................................................................................................................14
6.2 SOYBEAN PRODUCTION AND SUBSTITUTION METHODS..............................................17
7 RESULTS...........................................................................................................................18
7.1 CALCULATIONS AND ASSUMPTIONS............................................................................18
7.2 CO2 REDUCTION FROM ZONE E BIOETHANOL............................................................20
7.3 DUCKWEED AS A REPLACEMENT FOR SOYBEAN PROTEIN..........................................21
8 DISCUSSION....................................................................................................................24
9 CONCLUSION..................................................................................................................27
REFERENCES..........................................................................................................................28
III

Glossary
CCS Carbon Capture and Storage
CED Cumulative Energy Demand
CH4 Methane
CO2 Carbon Dioxide
DDGS Distiller Dried Grains Soluble
GHGs Green House Gasses
GWP Global Warming Potential
LCA Life Cycle Analysis
NCF Net Carbon Flux
WSP Waste Stabilization Ponds
IV

1 IntroductionThe evidence compiled during the IPCC Fourth Assessment Report on Climate Change 2007
(AR4) suggests that humans are very likely to blame for global climate change. Increasing
emissions of anthropogenic greenhouse gasses (GHGs) since the industrial revolution, have led
to a marked increase in atmospheric concentrations of the GHG carbon dioxide (CO2), methane
(CH4), nitrous oxide (N2O) perfluorocarbons (PFCs), hydrofluorocarbons (HFCs) and sulphur
hexafluoride (SF6) (Edenhofer et al., 2012).
These GHGs affect climate change in different ways and are weighted with an indicator called
global warming potential (GWP). The standard measure of global warming is GWP, which
calculates the time dependent radiative forcing (absorption of outgoing long-wave radiation) of
a GHG relative to the reference gas CO2. All GHGs have a higher GWP value than CO2 with
some, such as SF6 reaching GWP values more than 22,800 times more powerful than CO2 at a
100 year time horizon (Edenhofer et al., 2012). In technical terms, GWP is the ratio of
integrated radiative forcing of a substance compared to the integrated radiative forcing of the
reference gas. In practice, GWP measures the relative power of a GHG to increase global
warming relative to CO2.
CO2 is not the most potent GHG, but does have the
largest cumulative radiative forcing of any GHG, due
to its volume and persistence. The chart to the left
shows world trends of GHG emissions per annum
and displays an overwhelming prevalence of CO2
emissions compared to other greenhouse gasses.
Many of the synthetic gasses in the blue category
have been banned by the Organisation for Economic
Co-operation and Development, but are still used in
developing nations. The cyclical appearance of CO2
emissions tends to follow economic growth and
decline as shown in the graph.
Figure 1.1 World GHG per annum breakdown (Edenhofer et al., 2012)
1
Carbon capture and storage (CCS) solutions are an important part of climate change mitigation
strategy. Most CCS technologies focus on separating CO2 from flue gasses post-combustion or
removing it chemically pre-combustion. The CO2 is then transported via pipeline to an
underground geologic storage site. If CCS technologies continue to improve, it could allow
humans to continue using fossil fuels well past current predictions.
The drawbacks of CCS follow the same logic. Fossil fuels release many of the other GHGs
discussed in the opening paragraph, which are not mitigated by CCS technology. Delucchi and
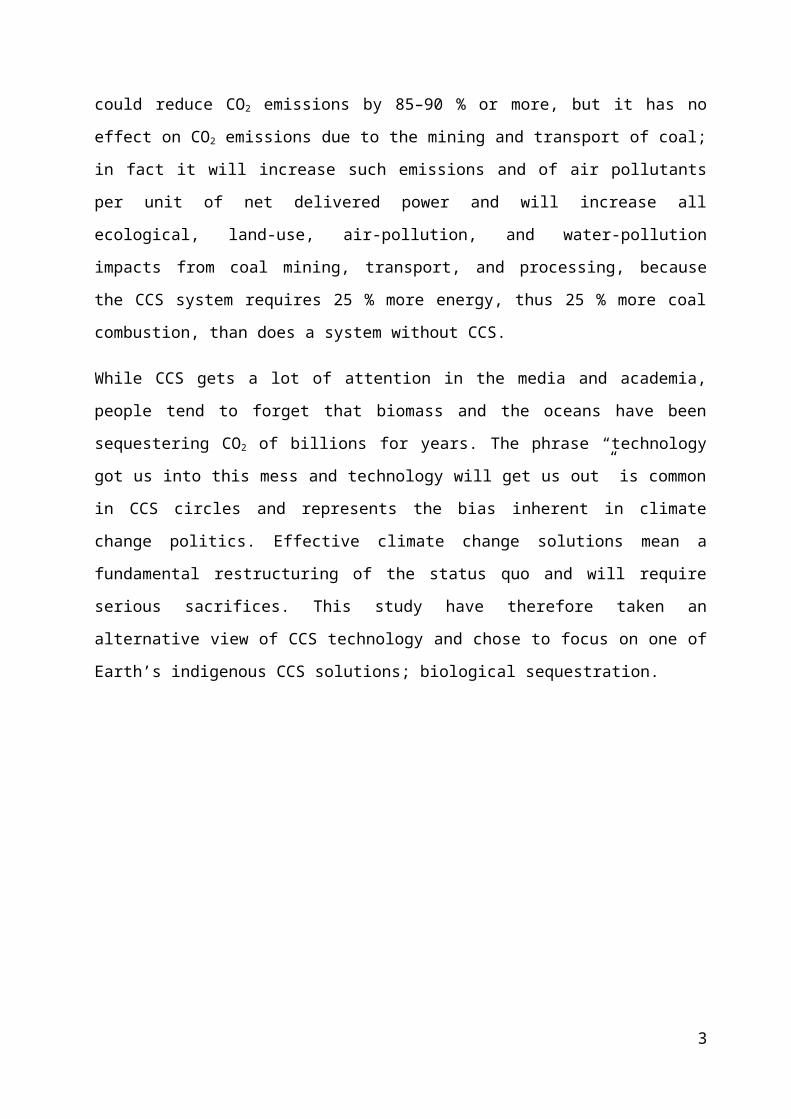
Jacobson (2010) report that CCS at coal fired power plants could reduce CO2 emissions by 85–
90 % or more, but it has no effect on CO2 emissions due to the mining and transport of coal; in
fact it will increase such emissions and of air pollutants per unit of net delivered power and will
increase all ecological, land-use, air-pollution, and water-pollution impacts from coal mining,
transport, and processing, because the CCS system requires 25 % more energy, thus 25 % more
coal combustion, than does a system without CCS.
While CCS gets a lot of attention in the media and academia, people tend to forget that biomass
and the oceans have been sequestering CO2 of billions for years. The phrase “technology got us
into this mess and technology will get us out” is common in CCS circles and represents the bias
inherent in climate change politics. Effective climate change solutions mean a fundamental
restructuring of the status quo and will require serious sacrifices. This study have therefore
taken an alternative view of CCS technology and chose to focus on one of Earth’s indigenous
CCS solutions; biological sequestration.
2

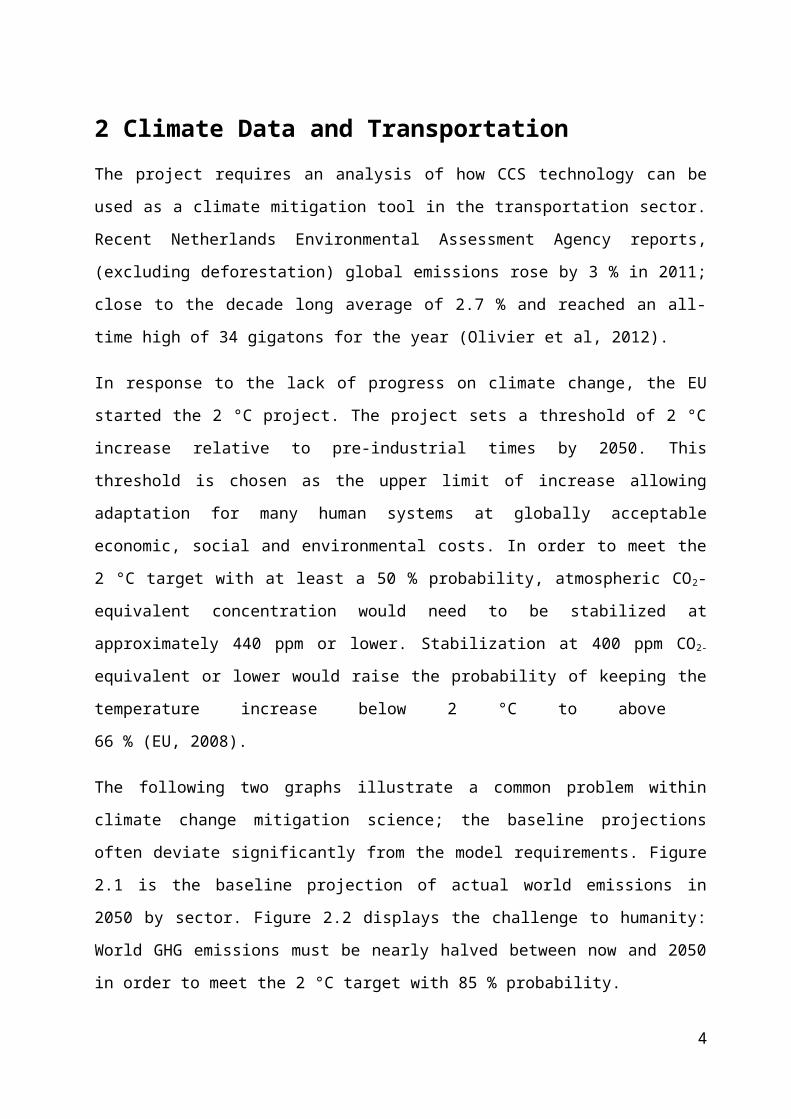
2 Climate Data and TransportationThe project requires an analysis of how CCS technology can be used as a climate mitigation
tool in the transportation sector. Recent Netherlands Environmental Assessment Agency
reports, (excluding deforestation) global emissions rose by 3 % in 2011; close to the decade
long average of 2.7 % and reached an all-time high of 34 gigatons for the year (Olivier et al,
2012).
In response to the lack of progress on climate change, the EU started the 2 °C project. The
project sets a threshold of 2 °C increase relative to pre-industrial times by 2050. This threshold
is chosen as the upper limit of increase allowing adaptation for many human systems at
globally acceptable economic, social and environmental costs. In order to meet the 2 °C target
with at least a 50 % probability, atmospheric CO2-equivalent concentration would need to be
stabilized at approximately 440 ppm or lower. Stabilization at 400 ppm CO2-equivalent or
lower would raise the probability of keeping the temperature increase below 2 °C to above
66 % (EU, 2008).
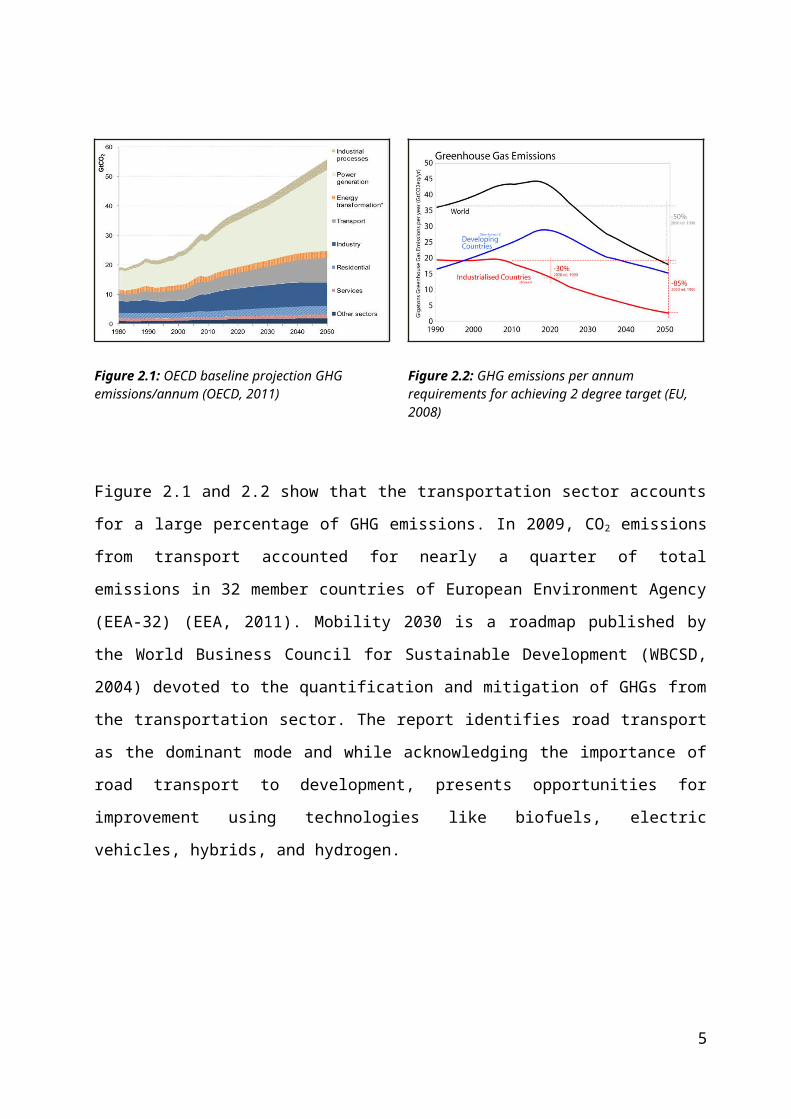
The following two graphs illustrate a common problem within climate change mitigation
science; the baseline projections often deviate significantly from the model requirements.
Figure 2.1 is the baseline projection of actual world emissions in 2050 by sector. Figure 2.2
displays the challenge to humanity: World GHG emissions must be nearly halved between now
and 2050 in order to meet the 2 °C target with 85 % probability.
Figure 2.1: OECD baseline projection GHG emissions/annum (OECD, 2011)
Figure 2.2: GHG emissions per annum requirements for achieving 2 degree target (EU, 2008)
3

Figure 2.1 and 2.2 show that the transportation sector accounts for a large percentage of GHG
emissions. In 2009, CO2 emissions from transport accounted for nearly a quarter of total
emissions in 32 member countries of European Environment Agency (EEA-32) (EEA, 2011).
Mobility 2030 is a roadmap published by the World Business Council for Sustainable
Development (WBCSD, 2004) devoted to the quantification and mitigation of GHGs from the
transportation sector. The report identifies road transport as the dominant mode and while
acknowledging the importance of road transport to development, presents opportunities for
improvement using technologies like biofuels, electric vehicles, hybrids, and hydrogen.
Figure 2.3: Transport sector contribution to total GHG emissions in EEA-32 (EEA, 2011)
4

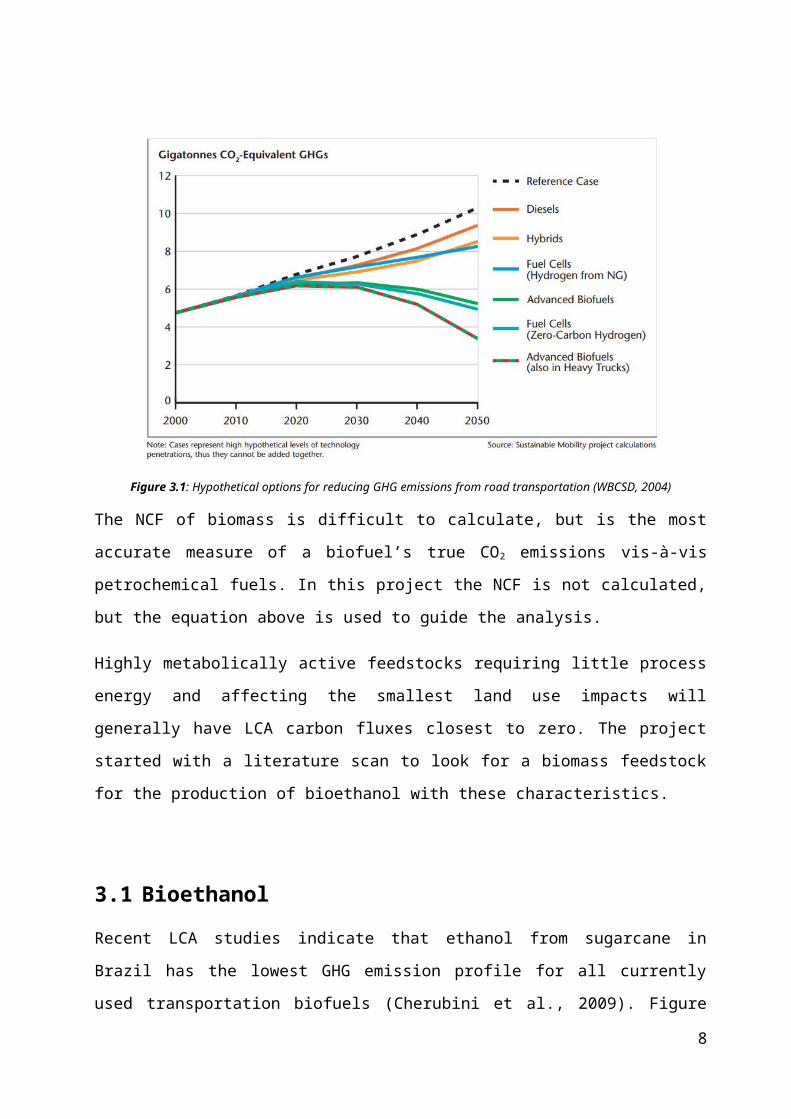
3 BiofuelsWith interest in biological CCS solutions well entrenched in the projects vision, the attention
was turned to biofuels. Mobility 2030 (WBCSD, 2004) identified biofuels and particularly
ethanol as technologies that must be a part of the GHG reduction strategy. Figure 3.1 show that
the reduction potential of advanced biofuels exceeds even zero-carbon hydrogen fuel cells.
Biofuels utilize the concept of carbon neutrality to create useful fuels for the transportation
sector. Plant biomass requires CO2 for photosynthesis, drawing it from the environment for
metabolic use. When the biomass is converted to energy, it is known as a feedstock. The basic
premise of bioenergy is that the CO2 released upon combustion has been balanced by the CO2
stored in the plant during the growing cycle. This is superior to fossil fuels because the net
carbon release to the atmosphere is closer to zero for bioenergy. While energy from biomass is
typically treated as carbon neutral in regulatory frameworks; in practice the variance around
“neutral” can be substantial. To truly determine whether a biomass feedstock is carbon neutral,
one must calculate the life cycle net carbon flux of the biomass using life cycle analysis (LCA).
Assuming minimal land use changes, net carbon flux (NCF) is roughly calculated as such:
NCF = Carbon sequestered during growth by feedstock - process CO2 released during cultivation,
harvesting, and processing into bioenergy - CO2 released from combustion.
Figure 3.1: Hypothetical options for reducing GHG emissions from road transportation (WBCSD, 2004)
5

The NCF of biomass is difficult to calculate, but is the most accurate measure of a biofuel’s
true CO2 emissions vis-à-vis petrochemical fuels. In this project the NCF is not calculated, but
the equation above is used to guide the analysis.
Highly metabolically active feedstocks requiring little process energy and affecting the smallest
land use impacts will generally have LCA carbon fluxes closest to zero. The project started
with a literature scan to look for a biomass feedstock for the production of bioethanol with
these characteristics.
3.1 Bioethanol
Recent LCA studies indicate that ethanol from sugarcane in Brazil has the lowest GHG
emission profile for all currently used transportation biofuels (Cherubini et al., 2009). Figure
3.2 show a rapid increase in the production of biogasoline and biodiesel since the 1990s.
Biogasoline includes bioethanol, bio-ETBE (ethyl tertiary butyl ether), biomethanol and bio-
MTBE (methyl tertiary buthyl ether) (Guerrero-Lemus et al. 2013). For the purposes of this
paper, all alcohol based products derived from the fermentation of biomass is treated as
bioethanol.
Figure 3.2: World supply of biogasoline and biodiesel (Guerrero-Lemus et al. 2013)
6
Bioethanol is produced by microbial fermentation of glucose, usually with the help of yeasts
(e.g. Saccharomyces cerevisiae) as production microorganisms (Lens et al., 2005). The glucose
substrate can be obtained from many different carbohydrate containing feedstocks, such as
sugar cane, wheat, corn or agricultural co-products. Carbohydrates may be in the form of
cellulose, hemicellulose, or starch when entering the biorefinery. These carbohydrates are
broken down into simple sugars by thermal, enzymatic, or combination reactions. Simple
sugars are converted into alcohol with the help of yeast under the right conditions. This alcohol
is typically in a concentration of around 8–10 % before distillation removes the water to a
purity of 95-96 %. Wastes from ethanol production such as distillers dried grain solubles
(DDGS) are obtained as co-products. DDGS have many possible applications depending on the
chemical characteristics of the DDGS, but are commonly used as animal feed or burned for
heat (Lens et al., 2005).
The production process for bioethanol can be difficult and costly. Sugar cane is the cheapest
feedstock due to high yields per hectare, cheap fermentation requirements, use of waste bagasse
for heat production, and cheap labor. The net carbon flux GHG emissions from sugarcane
bioethanol result in over 80 % GHG savings when compared to fossil fuels, but other indicators
are not so favorable (Cherubini et al. 2009).
The cultivation of sugarcane increases land use impacts, surface water usage, heavy metals, and
fertilizer leakage. These problems are generally aggregated into the 1st generation debate.
Biofuels in this class are criticized because they compete for arable land with the food market.
With more than a billion people without adequate nourishment, arable land should be used for
food production. According to the International Energy Agency (IEA, 2008), biofuels can be
classified in the following categories:
1st generation: Those that have reached a stage of commercial production. In general,
they are obtained from crops grown following similar techniques to food crops and
consequently, compete with them for agricultural land.
2nd generation: They do not compete for agricultural land, since they are obtained from
lignocellulosic biomass such as straw, grass, stems, stalks, roots, woods, shells, etc.
3rd generation: They mainly consist of oils from algae and hydrogen from biomass.
They are still at an early stage of development and far from large-scale production.
Therefore, it is not expected to reach large production in the short term.
7
In summary, bioethanol has a much smaller GHG footprint than gasoline for road transport, but
land use impacts and competition with food production must be avoided to scale up production.
Sugarcane is the best 1st generation biofuel, but 2nd generation and 3rd generation biofuels are
the future. The best feedstock for bioethanol production will utilize waste streams instead of
fertilizer, occupy non-arable or marginal lands, require less process energy, and be inexpensive
to refine.
8
4 Duckweed Duckweeds are the name of several species of plants from the Lemnaceae family. They are the
smallest and fastest-growing flowering plants in the world, able to double their biomass within
a period of 24 hours under ideal conditions (Zhao et al., 2012, Xumeng Ge. et al., 2012).
Duckweed has many characteristics that give it an advantage over sugarcane. Duckweed is a
free-floating aquatic plant that grows in characteristic green mats on top of heavily eutrophic
freshwater. Free floating duckweed requires less process energy because it is easier to harvest
and cultivate. The yields per hectare compare favorably with other feedstocks, and on par with
sugarcane. The ideal growth medium for duckweed is wastewater (effluent) from swine
production.
Figure 4.1 Duckweed (Missouri Botanical Garden, 2013)
Chemical composition varies widely for duckweed species, allowing for the selection of either
high starch or high protein varieties. Duckweed co-products could provide a multitude of
flexible low-carbon solutions. Duckweed can be harvested continually where the average
ambient temperature is between 18 to 28 °C, which allows for year round biomass production
in places with such conditions (Duan et al., 2013).
9

4.1 Duckweed as a Feedstock for Bioethanol Production
Duckweed carbohydrates must be converted to simple sugars for fermentation before
bioethanol can be produced. The starch and other carbohydrates found in dried duckweed are
broken down into simple sugars by a process called saccharification. This process uses
enzymes to break down starch and other carbohydrates into simple sugars. Sugarcane in
comparison requires no conversion. Commercial grade amylases and cellulases used in the
saccharification process are expensive and the chemical conversion of carbohydrates to simple
sugars is an efficiency loss compared to sugarcane. With is constraint in mind, the key to
making duckweed competitive is very high carbohydrate levels. Certain duckweed species have
been able to obtain a starch content of nearly 70 % in the laboratory (Xu et al. 2011). Two
separate pilot plant studies were able to obtain theoretical yields for duckweed bioethanol of ca.
6,420 liters per hectare, which is 50 % greater than for maize ethanol and on par with sugarcane
(Keim, 2009, Xu et al., 2011).
4.2 High Protein Duckweed Grown on Swine Wastewater as Animal Feed
The studies of Xu et al. (2010), shows that duckweed should be grown on 50 % swine lagoon
effluent for efficient nutrient removal and optimal duckweed growth. This will result in clean
water which can be released to the environment or reused, resulting in a closed loop water
system. High protein duckweed strains like Lemna gibba 8578, or Lemna minor 8627 have
protein concentrations ranging from 15 % to a maximum of 50 %. The amino acid profile of the
protein from these species was evaluated favorably for animal feed, with a nutritional value
comparable to soy (Xu et al., 2010). The protein from this system could either be fed back to
the pigs in dry milled form or exported to Europe as a substitute for soy protein meal. We will
explore these two options later in the report.
10

5 Industrial EcologyThe concept of industrial ecology is extremely useful when performing feasibility analysis.
Industrial ecology is based on the “ecological metaphor” for organizing human production. The
idea is that anthropogenic activities have deviated far from the principles that have governed
sustainable ecosystems for billions of years. The symptoms of this deviation are the world’s
most critical problems today. Pollution, climate change, inequality, excessive waste, and even
geopolitical issues can be attributed to anthropocentric production starting with the industrial
revolution. The field of industrial ecology calls for a reorganization of production to mimic the
way natural ecosystems function.
In a natural ecosystem at equilibrium, nutrient flows cascade and ascend the food web,
appearing and reappearing in different organisms in a closed loop cycle. Sunlight, CO2, and
nutrients are used to create photosynthetic organisms, which form backbone of the trophic
layers.
The other layers are characterized by competition, predation, mutualism, and symbiotic
relationships. Nutrients created by organisms at various levels move up and down the food
chain according to natural selection, which in Darwinian terms is nature’s measure of
efficiency. Reallocating resources in a closed loop system entails linking waste back to the
production process and diverting virgin resources such as wood, ore, oil, and gas to the most
efficient processes. A production system closer to the ecological metaphor would result in
emissions and waste reductions, increased productive efficiency, longer resource lifetimes, and
more stable growth.
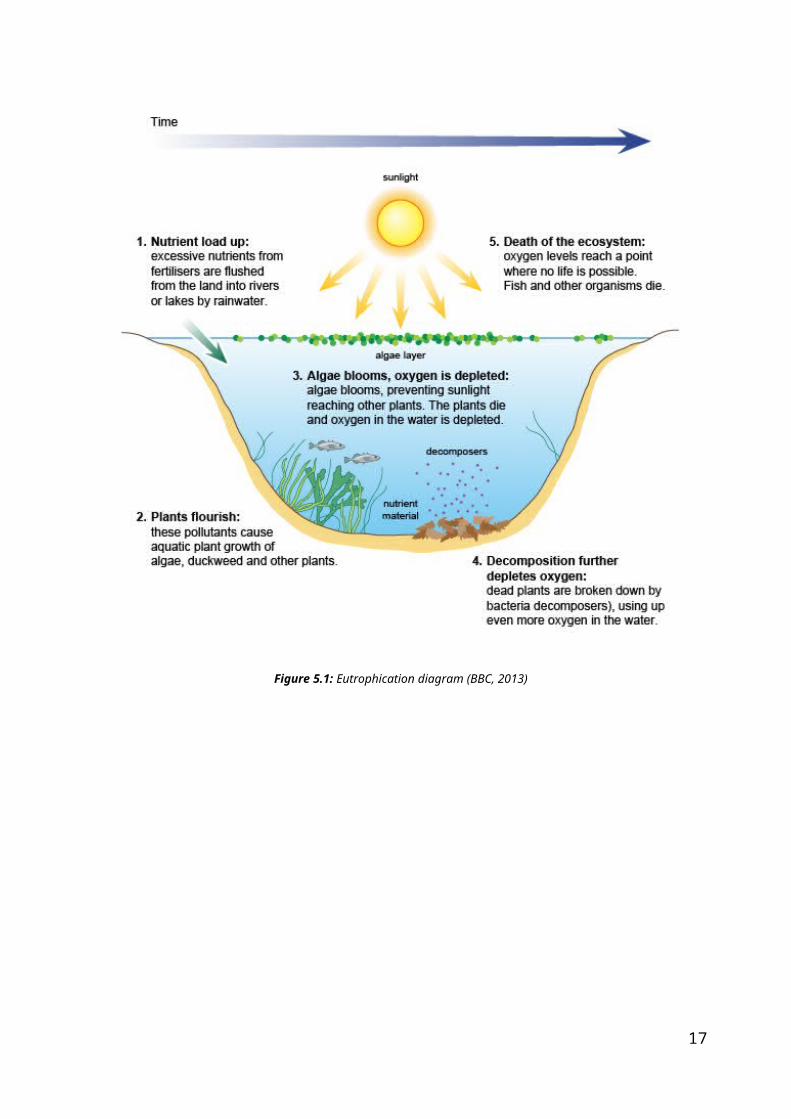
The eutrophication diagram in figure 5.1 is an excellent example of how industrial ecologists
think. Eutrophication occurs when water becomes saturated with nutrients that are otherwise
limiting factors for plant and bacterial growth. The limiting nutrient for freshwater is
phosphorous, and nitrogen for saltwater. When these nutrients occur in abundance, it causes a
growth explosion in the local community by the organisms with the highest metabolisms. In
natural ecosystems the resulting algal or duckweed blooms can prove fatal to biodiversity by
causing anoxic conditions.
11
The problem arises because the ecosystem becomes unbalanced with the sudden
overabundance of biomass. By using swine nutrients as a food source, we are taking advantage
of explosive biomass growth in a controlled environment. The excess nutrients are turned into
biomass by duckweed in a succession of waste treatment lagoons before being released into a
river or lake.
Figure 5.1: Eutrophication diagram (BBC, 2013)
12

6 Feasibility StudyA feasibility analysis using industrial ecology principles revealed that Brazil is an excellent
candidate for developing integrated closed loop duckweed farming. Brazil has an abundance of
highly nutrified agricultural wastewater as the world’s 4th largest producer of swine.
Conveniently Brazil is also the 2nd largest producer of ethanol in the world. Swine wastewater
is duckweed’s preferred growth medium and is treated in this study as the only source of
nutrients to make the numbers realistic. In practice, duckweed could also be grown on
wastewater from industry, households, and other organic sources.
Being the world 2nd largest ethanol producer means Brazil has well developed existing
infrastructure. The results of the study depend on the assumption that Brazil has existing
capacity for increased ethanol production without requiring a significant investment in new
refineries. In Brazil today, swine production is the main source of animal protein for human
consumption and occupies a strategic position in the global food market (Mohedano et al.
2012). Brazil has large pig herd consisting of approximately 35 million pigs, 4 th largest in the
world. Most of this production is concentrated in the Southern regions, but in later years a rapid
growth has taken place in the Central-West region (Kunz et al. 2009).
The environmental threat from intensive swine production is substantial, due to the amount of
waste excreted during the lifespan of the animal. Improperly treated swine effluent can cause
explosive eutrophic algal growth in native environments. Farmers must have access to an
affordable and sustainable solution to treat this waste. The average Brazilian pig farmer
transfers the liquid manure into a biodigester where it is broken down by anaerobic bacteria.
After this process the liquid manure is transformed into the co-products biogas (CH 4 and CO2
mainly), solid manure and a liquid effluent. The untreated effluent is high in ammonium,
nitrates, phosphorous, chemical oxygen demand (COD) and biological oxygen demand (BOD)
(Mohedano et al., 2012).
In Brazil it is common to treat this effluent in reception pits or covered lagoons called waste
stabilization ponds (WSPs). WSPs constitute the simplest and the most common biological
wastewater treatment in Brazil (Ambiente Brazil, 2013). The common use of WSPs in Brazil is
a fundamental part of this analysis. The utilization of WSPs to produce bioethanol and animal
feed from duckweed means that land use impacts are avoided, while removing nutrients from
the system and providing an extra revenue stream for farmers.
13
6.1 Methods
The theoretical basis for this study is derived from a recently completed pilot project in Santa
Catarina State in Southern Brazil (Mohedano et al., 2012). The study was developed on a small
farm with 300 pigs generating 3 m3 of waste daily. This waste composed mainly of manure,
urine, and leftover food, passes through a biodigester with a hydraulic retention time of 30
days, a storage pond, and finally two duckweed waste stabilization ponds for nutrient removal.
The duckweed ponds received about 30% of the waste effluent, about 1 m3 per day. The rest
was diverted from the storage pond to the fields for fertilizer. The entire process is depicted in
figure 6.1.
Figure 6.1:Duckweed pilot study setup (Mohedano et al., 2012)
BD=Biodigester ,SP=Storage pond, DP1 and DP2 =Duckweed pond 1 and 2.
The authors harvested the fresh duckweed every other day, obtaining yields of 27 kg/day from
DP1 and 7.5 kg/day from DP2. The difference in yield can be explained by scale (DP1 = 153
m2, DP2 = 90 m2) and nutrient availability; DP1 had access to the full strength effluent, while
DP2 received the leftover nutrients from DP1. The average yield per day for DP1 was 18 grams
dry duckweed/m2/day. The protein content from this experiment reached 40 % in DP1, the level
required for soybean protein substitution. The protein yield per hectare was the most
astounding result of this study.
If using the results from DP1 only, the theoretical protein yield per hectare/year is 26.3 tons, 22
times larger than the average soybean protein productivity in Brazil, as seen in equation 1.
14

18 grams dry duckweedm2
day∗10,000 m2
hectare∗365 days
year∗1ton dry duckeweed
1000000 grams∗0,400T protein
1 tondry duckweed=
26.3tons proteinhectare
year
(1)
The amount of manure effluent required by the duckweed for this growth was 1 m3 per day and
is factored into the yield achieved by the authors. Equation 2 shows how to obtain the
theoretical duckweed production estimate in table 6.1.
18 gramsm2
day∗1kg duckweed
1000 grams∗365 days
year∗243 m2
300 pigs∗1 pig
93 kg pork→
kgduckweedkg p ork
year∗kg pork= t h eoretical yield
year
(2)
The parameters entered into excel are theoretical numbers based on the yield from DP1. The
pond size of 243 m2 is the size of the both ponds added together. The assumption made here is
that it is possible to achieve DP1 yields by joining both ponds together, thus increasing the total
yield. Adding extra effluent to match the demand of a bigger pond is not a problem because the
pilot study is using only 30% of the effluent.
Table 6.1: Theoretical duckweed co-product yield
Geographic Area Kt Swine Production
Annual production of sugarcane ethanol (L / yr)
Duckweed Production Estimate (dry T / year)
Estimated Duckweed Ethanol Yield (L /year)
Paraná 478 1,40E+09 1,04E+07 2,67E+06São Paulo 156 1,16E+10 3,38E+06 8,72E+05Minas Gerais 397 2,08E+09 8,60E+06 2,22E+06
15

Zone E Total 1032 1,51E+10 2,23E+07 5,77E+06
Zone P Total 2229 N/A 4,83E+07 N/A
Brazil Total 3260 N/A 7,06E+07 1,06E+07
Key assumptions and references for table 6.1
1. The estimated ethanol yield is calculated using the dry duckweed to ethanol ratio of 25.8% from (Cheng and Stomp, 2009).2. Annual ethanol production in Zone E is added for comparative purposes, data is from the Brazilian Ministry of Agriculture.3. Swine production is from the Brazilian Pork Industry and Exporter Association.4. Duckweed yield is adjusted to 37.9% of maximum to reflect current availability of WSPs used in Brazilian wastewater treatment (Trata Brazil Institute, 2013).
This analysis divides Brazil into two production zones. Zone E (ethanol) consists of the states
Minas Gerais, Paraná, and São Paulo. This region contains 75 % of Brazil’s biorefinery
infrastructure and 34 % of swine production. The three states of Zone E have the necessary
refinery capacity and the effluent required to produce low cost, low-carbon ethanol from
duckweed. The rest of the biorefineries are located in the Northeast where intensive swine
production is undeveloped. This region could produce some bioethanol from duckweed, but is
excluded from this study.
Most of the remaining swine production is found in the Southern and Central West regions
shown in figure 6.2. These two regions have high capacity for duckweed production, but lack
the infrastructure to produce ethanol. A stipulation of low cost, low-carbon bioethanol is a short
distance from the field to the refinery to limit transportation impacts. Therefore, into this zone
into this zone (Zone P) high protein duckweed is substituted for the production of animal feed.
16

Figure 6.2: Duckweed production zones
17

6.2 Soybean Production and Substitution Methods
Soybeans have grown to become Brazil’s most important agricultural product. Brazil is the
second largest producer of soybeans in the world with a growth rate twice the world average.
Brazilian soybean growth is stimulated by an increasing demand for soy protein meal for the
animal feed industry in Europe, where 70 % of Brazil’s soybean exports end up (Cavalett et al.,
2009).
This rapid growth has resulted in an increase of soybean plantation areas from roughly 1
million hectares in 1970 to 23 million hectares in 2010. For comparative purposes, the area of
Norway is about 32 million hectares (Garrett et al. 2012). Today almost 50 % of the soybean
production in Brazil is in the Amazon and Central West regions. Native savannas, planted
pastures and rainforest are turned into areas for intensive agriculture as a result of the crop area
expansion. Soybean farming is a resource intensive industry with high process inputs of energy
and fertilizers in addition to the considerable land use impacts affecting both biodiversity and
human livelihood.
The academic literature is rich in information about duckweed farming for animal feed, but
currently there are no extensive LCA based studies to determine the impacts of full scale
duckweed production. Life cycle analysis captures the environmental impacts of the full life
cycle of a product or service from raw materials extraction to end of life disposal. The
methodology has evolved in the last decade as an invaluable tool for environmental analysis.
Due to the complexity of building a life cycle inventory for every process in the duckweed
production value chain, existing LCA studies were used for soybeans as a framework and
utilized substitution methods to remove inputs avoided by producing duckweed. The LCA
results for Zone P reflect the substitution method applied to a domestic use – export model to
reflect current market trends.
18

7 ResultsIn order for this feasibility study to produce results, some calculations and assumptions had to
be made. The following chapters describe these assumptions, and the results are presented for
Zone E and Zone P where ethanol and animal feed can be produced, respectively.
7.1 Calculations and Assumptions
The following assumptions were taken into consideration in order to do the LCA and the
construction of graphs presented in this chapter:
1. Functional unit represents Norwegian soy protein import for 2008 as estimated by
Germiso (2008).
2. Impact categories originally calculated for 1 metric ton of soy (Da Silva et al. 2010)
3. Impacts have been aggregated from Da Silva et al’s. (2010) publication for simplicity
4. The two processes with significant LCA impacts for duckweed are protein milling from
dry duckweed and transportation from field to milling station and back to farm.
5. Transportation emissions are vital for differentiating the domestic vs. export scenarios
Domestic land transport emissions are calculated from field to protein milling
station and back to the field. The key parameter from Da Silva et al. (2010) is
75.6 kg CO2 per ton of protein round trip.
Soy or duckweed protein exported to the EU has one way CO2 emission from
field to port plus ocean transport to the EU. Da Silva et al (2010) calculated
ocean transport at 220 kg CO2 equivalents per ton.
6. The protein milling process is assumed to be equivalent to soybean processing. The
soybean LCA impacts for this process have been included in both duckweed scenarios.
The calculation of the milling process requirements was not included in Da Silva et al.
(2010) and derived based on estimates of milling energy requirements from Dalgaard et
al. (2008) and Brazil energy mix from the International Energy Agency (2008).
Equation 3 was used to calculate CO2 emissions per ton of soybeans in Brazil.
470 MJ process energytonof soybeans
∗0.04kgCO2
MJ Brazilian grid energy=18.8
kgCO2
ton of soybeans (3)
19

In table 7.1 four main areas in where duckweed is compared to soybean is presented.
Table 7.1: LCA indicator descriptions
Heavy metals to soil Heavy metals from soybean production are cadmium from fertilizer usage,
lead, mercury, manganese, and nickel from farming equipment and fossil
fuels. Deposition of heavy metals affects terrestrial, freshwater, and
marine ecosystems depending on the deposition site and concentration.
Land Use Change Land use changes in Brazil refer to permanent alteration of Cerrado
tropical savannah and Rainforest.
Cumulative Energy Demand Total life cycle energy requirements for producing soybeans or duckweed.
CO2 eq Total life cycle GHG emissions measured in CO2 equivalents
20
7.2 CO2 Reduction from Zone E Bioethanol
As seen in table 6.1 the estimated duckweed ethanol yield from Zone E was 5.77 ·106 Lyear .
Seeing how one liter of petrol emits 2.34 kg of CO2, the emission savings can be estimated to
13.5 ktonnes CO2. This is based on the assumption that duckweed ethanol is a carbon neutral
source. The top 10 largest sources of emission on the mainland of Norway are introduced in
table 7.2 to put these numbers into context.
Table 7.2: The ten largest emissions of CO2 in mainland Norway (Karoliussen, 2012)
The CO2 reduction from Zone E is calculated to be 13.5 ktonnes per year. As seen in figure 7.1
this accounts for 3 % of Alcoa’s CO2 emissions, which has the 10th largest emissions in
Norway.
Emissions from Alcoa, Mosjøen
Reduction from growing duckweed in Zone E:
3 % of Alcoa's emissions
CO2 reduction from Zone E, compared to emissions from Alcoa, Mosjøen
Figure 7.1: Comparison between CO2 reduction from Zone E and CO2 emissions from Alcoa, Mosjøen, Norway
21

7.3 Duckweed as a Replacement for Soybean Protein
Figure 7.2 shows the results from the LCA study where exported soybean meal was replaced by
duckweed. In this case, there would not be any discharges of heavy metals to soil, since
duckweed production does not need any type of fertilizers. Also, the results show that there
would be significant savings in terms of land use, energy input to the production process and
CO2 emissions to the environment.
CO2 eq.
CED MJ
Land (Ha)
Kg heavy metals to
soil
0% 10% 20% 30% 40% 50% 60% 70% 80% 90% 100%
3.68E+08
4.91E+09
9.88E+04
1.98E+06
1.19E+08
2.68E+09
1.21E+04
0.00E+00
LCA Impacts Soybean vs. Duckweed Export to Norway
Soybean, Norway Duckweed, Norway
Figure 7.2: LCA export impacts functional unit 500 000 metric tons of protein
22

Assuming that duckweed protein stays in Brazil as a feedstock for animals, the CO 2 reduction
will be smaller. However, there would be less usage of land since the fuel needed for
transportation will be out of the calculation. Therefore the energy demand will be lowered as
well. Figure 7.2 shows the estimated numbers.
CO2 eq.
CED MJ
Land (Ha)
Kg heavy metals to
soil
0% 10% 20% 30% 40% 50% 60% 70% 80% 90% 100%
2.58E+08
2.98E+09
9.63E+04
1.70E+06
4.72E+07
7.44E+08
9.63E+03
0.00E+00
LCA Impacts Soybean vs. Duckweed domestic use
Soybean, Brazil Duckweed, Brazil
Figure 7.2: LCA domestic impacts functional unit 500 000 metric tons of protein
In terms of CO2 savings obtained by replacing the exporting product (figure 7.1), the number
would be around 2.23E+8 CO2eq. Likewise, using duckweed in a close cycle to feed swine in
Brazil would save 2.1E+8 CO2eq.
23

To put these results into context with the bioethanol production, figure 7.3 compare CO2
reduction from growing duckweed in Zone P with the CO2 emissions from Alcoa in Mosjøen,
Norway. As stated above, this company has the 10th largest CO2 emission in Norway. Zone P
has the potential to reduce CO2 emissions by an equal amount as 59 % of Alcoa’s annual
emissions.
Reduction from growing duckweed
in Zone P:59 % of Alcoa's
emissions
Emissions from Alcoa, Mosjøen
CO2 reduction from Zone P, compared to emissions from Alcoa, Mosjøen
Figure 7.3: Comparison between CO2 reduction from Zone P and CO2 emissions from Alcoa, Mosjøen, Norway
24

8 DiscussionFirst off, we would like to acknowledge that our results underestimate duckweed impacts by an
unknown amount. Many processes were unknowingly omitted in addition to the enzyme and
thermal starch breakdown process in the biorefinery for Zone E. The saccharification process
LCA impacts were not included due to lack of reliable data. The methods used in this study
attempt to ensure the utmost academic integrity within the time constraints of the project. With
that disclaimer, we believe these results to be within reason. The results clearly demonstrate the
potential for significant improvements in key environmental indicators by implementing
integrated duckweed farming in Brazil. The reduction in CO2 emissions is the most obvious and
relevant to our village, but the complete elimination of heavy metals from the environment
cannot be underestimated.
An LCA analysis of the co-product duckweed integrated farming system was determined to be
unfeasible due to lack of data. A deeper understanding of the LCA methodology allowed our
group to circumvent the lack of data by using a system substitution method to estimate LCA
impacts of duckweed in the most academically defensible manner within time constraints. A
feasibility study was set up using data from multiple credible sources. The model divided
duckweed production into Zone E for the production of bioethanol and Zone P for the
production of protein for animal feed. The reasoning for this division was the availability of
biorefinery infrastructure in Zone E and not in Zone P. The feasibility study was set up to
analyze the LCA impacts of duckweed protein from Zone E. Results were calculated using a
domestic and an export scenario to simulate current market conditions. Results showed an
unequivocal improvement in every duckweed LCA indicator over soybean, but it showed a less
significant reduction in CO2 from the bioethanol produced in Zone E. However, there are
several other positive features by implementing duckweed to Zone E such as waste water
treatment. Seeing how implementation to Zone E has a very low cost, the idea should not be
discarded.
This feasibility analysis offers a different solution for biofuels production. Brazil has a clear
and present challenge facing its agricultural sector. Brazil is already an agricultural
powerhouse, ranking close to the top with the United States and China in soybean production,
pigs, chickens, and beef. Brazil is also an ecological wonder, home to 14 % of the world’s
surface waters and one of the last undeveloped sources of biodiversity. The Amazon and
Cerrado regions are massive carbon sinks and sources of tremendous ecological value. The goal 25

of this project did not start with these things in mind, but evolved organically with the literature
available.
The reduction in CO2 by switching to duckweed is obvious when one considers the life cycle of
soybean production. Da Silva et al. (2010) was quick to point out that most soybeans produced
today are grown on existing cropland or pasture land cleared decades ago. However the same
author estimated that 2 to 4 % of soybeans are grown on recently cleared land, either Cerrado
or Rainforest. The clearing of new land for soybean cultivation has huge CO2 impacts both
from the loss of trees as carbon sinks and from machinery used to clear the land and prepare the
soil for planting. Soil spanning a landmass nearly the size of Norway must be de-weeded,
fertilized, and seeded for planting. As the soybean crops grow they receive maintenance inputs
of fertilizer, pesticides, water, and weeding. Harvest is another large impact for soybean
production. Heavy machinery and human labor requiring transport must separate the pods from
the plant residues, clean and sort the pods, dispose of the plant residues, and recondition the
soil for the next planting cycle. There are CO2 impacts spanning every step of soybean
production. It is important to recall that soybeans produce protein 22 times less efficiently than
duckweed.
Land use impacts are related to the clearing of land as reported by Da Silva et al. (2010). The
impacts of land use from soybeans were touched upon above and explained more thoroughly in
the conclusion. Land use impacts from duckweed are admittedly underestimated in the model,
but the results are not unreasonable. The integrated farming model recommended by our team
used industrial ecology methods to uncover an unused resource in Brazil; waste stabilization
ponds. Wastewater treatment in Brazil is underdeveloped, but significant potential duckweed
habitat is already in existence. Due to time constraints, we only considered co-production of
duckweed with pork. An exponential scale up of duckweed production is theoretically possible
by considering wastewater from poultry, beef, and human waste. A significant scale up of
duckweed production would increase land use impacts and other LCA indicators by an amount
correlated with the construction of new duckweed wastewater treatment facilities.
CED impacts are explained by many of the same life cycle factors mentioned in the CO2
section above. Duckweed and soybeans both share the protein milling and domestic
transportation processes. Duckweed and soybeans both have a protein content of approximately
40 %. In order to be used in animal feed this protein must be extracted from the bean itself. The
separation process is a mechanical process that also extracts lipids and other valuable co-
products as described in Dalgaard et al. (2008). As seen from figure 8.1, Brazil has an excellent 26

energy mix due to extensive hydropower production so CED is lower than it would be
elsewhere. Brazil was chosen as a case study because their agricultural products rank at the top
of the world class in terms of LCA impacts. CED is therefore a competitive advantage in Brazil
for all agricultural products, including duckweed.
Figure 8.1: World Energy Mix ( IEA, 2008)
Mineral fertilizers are the largest source of cadmium deposition in most countries. Cadmium
has been shown to be extremely toxic to freshwater ecosystems at high concentrations. Brazil
has one of the world’s most extensive networks of rivers and freshwater lakes. This makes
dilution a common practice for industrial and agricultural pollutants. This problem may go
unnoticed for long periods of time because the effects of deposition will occur far from the
source. Over time however, the effects of diffuse pollutants will start to build up at river deltas
and in sediments on lake bottoms. Heavy metals and other environmental toxins can have
effects over several generations and are difficult to mitigate. The zero result for duckweed in
the heavy metals category is extrapolated from Da Silva et al. (2010) after substituting out the
soybean processes not applicable to duckweed production. In reality this value will not be zero,
but should be very close.
The framework for this project was inspired by Mobility 2030 and the EU 2 °C project. These
projects represent the highest level of human understanding of climate change mitigation. Both
reports highlighted the importance of the transportation sector to achieving climate goals.
Mobility 2030 and the EU emphasize the importance of biofuels to current mitigation strategy
while also outlining the problems with 1st generation biofuels.
27
9 ConclusionDuckweed has the potential to solve many environmental challenges simultaneously. Human
population growth will put increasing pressure on Brazil as a world leader in food and energy
production. Wastewater problems, emissions of GHGs and the deposition of other pollutants
must be proactively mitigated to preserve arguably the world’s most important source of
biodiversity. We recommend the scientific community to consider more projects inspired by
industrial ecology. Technology is a marvelous wonder and will play an important role in
climate change mitigation, but we cannot forget the potential contribution of the earth’s
indigenous technologies.
Our group agreed that 2nd or 3rd generation biofuels offer better environmental benefits than
current technologies. Using industrial ecology and LCA as a framework, our group was able to
determine that sugarcane bioethanol from Brazil is currently the world’s most environmentally
friendly fuel, but room for improvement exists. Duckweed was discovered as having all of the
characteristics required for a 2nd or 3rd generation biofuel.
By implementing duckweed to both Zone E and Zone P, the total reduction in CO2 emissions
was calculated to 262 ktonnes, which is a substantial amount. Seeing how the implementation
also has other positive environmental impacts, it has the potential to be carried out to a real life
scenario.
28
References
Ambiente Brasil Magazine (2013) Produção de Lodo em Lagoas de Estabilização e o seu Uso no Cultivo de Espécies Florestais na Região Sudoeste do Brasil. Available from: http://ambientes.ambientebrasil.com.br/florestal/artigos/producao_de_lodo_em_lagoas_de_estabilizacao_e_o_seu_uso_no_cultivo_de_especies_florestais_na_regiao_sudoeste_do_brasil.html [Cited 02.05.13]
BBC (2013) Eutrophication diagram. Available from: http://www.bbc.co.uk/schools/gcsebitesize/science/edexcel/problems_in_environment/pollutionrev4.shtml [Cited 02.05.13]
Cavalett, O., Ortega, E. (2009) “Emergy, nutrients balance, and economic assessment of soybean production and industrialization in brazil”. Journal of Cleaner Production, 17, p. 762-771, Elsevier Ltd.
Cheng J.J., Stomp A.M. (2009) “Growing duckweed to recover nutrients from wastewaters and for production of fuel ethanol and animal feed”. CLEAN – Soil, Air, Water, 37(1), p.17-26.
Cherubini, F., Strømman, A.H. (2011) “Life cycle assessment of bioenergy systems: State of the art and future challenges”. Bioresource Technology, 102(2), p. 437-451
Dalgaard, R., Schmidt, J., Halberg, N., Christensen, P., Thrane, M., Pengue, W.A. (2008): “LCA of Soybean Meal”. The International Journal of Life Cycle Assessment, 13(3), p. 240–254. Ecomed.
Da Silva, V.P., Van der Werfa, H.M.G., Spiesd, A., Soaresc, S.R. (2010) “Variability in environmental impacts of Brazilian soybean according to crop production and transport scenarios”. Journal of Environmental Management, 91(9), p. 1831–1839. Elsevier Ltd.
Delucchi, M.A., Jacobson, M.Z. (2010) “Providing all global energy with wind, water and solar power, Part II: Reliability, system and transmission cost, and policies”. Energy Policy, 39, p. 1170-1190. Elsevier Ltd.
Duan, P., Chang, Z., Xu, Y., Bai, X., Wang, F., Zhang, L. (2013) “Hydrothermal processing of duckweed: Effect of reaction conditions on product distribution and composition”. Bioresource Technologym, 135, p. 710-719. Elsevier Ltd.
Edenhofer, O., Madruga, R.P., Sokona, Y. (2012). Renewable energy sources and climate change mitigation: special report of the Intergovernmental Panel on Climate Change. Cambridge University Press. p.161–208. Available from:
29

http://srren.ipcc-wg3.de/report/IPCC_SRREN_Full_Report.pdf [Downloaded 02.05.13]EEA (European Environment Agency) (2011) Laying the foundations for greener transport — TERM 2011: transport indicators tracking progress towards environmental targets in Europe. Available from: http://www.eea.europa.eu/publications/foundations-for-greener-transport [Cited 02.05.13]
EU (2008) The 2 °C Target: Information Reference Document. Available from: http://ec.europa.eu/clima/policies/international/negotiations/future/docs/brochure_2c_en.pdf [Downloaded 02.05.13]
Garrett, R.D., Lambin, E.F., Naylor, R.L. (2012) “Land institutions and supply chain configurations as determinants of soybean planted area and yields in Brazil”. Land Use Policy, 31, p. 385-396, Elsevier Ltd.
Germiso, M. (2008) Økt soyaforbruk spiser skogen. Available from: http://www.framtiden.no/200806162312/rapporter/forbruk/okt-soyaforbruk-spiser-skogen.html [Updated 16.06.08] [Cited 02.05.13]
Guerrero-Lemus, R., Martínez-Duart, J.M., (2013). “Renewable Energies and CO2: Cost Analysis, Environmental Impacts and Technological Trends”. 3 .Springer London.
IEA (International Energy Agency) (2008). Worldwide Trends in Energy Use and Efficiency. Available from: http://www.iea.org/publications/freepublications/publication/Indicators_2008-1.pdf [Downloaded 02.05.13]
Karoliussen, H. (2012) “KMT600T Fornybar Energi: Energiforbruk CO2-utslipp”. Høgskolen I Sør-Trøndelag, Avdeling for Teknologi, Program for Kjemi og Material.
Keim, B. (2009) Tiny Flower Turns Pig Poop into Fuel. Wired Science. Available from: http://www.wired.com/wiredscience/2009/04/doubleduckweed/ [Updated 04.08.09] [Cited 02.05.13]
Kunz, A., Miele, M., Steinmetz R.L.R (2009) “Advanced swine manure treatment and utilization in Brazil”. Bioresource Technology, 100(22), p. 5485-5489, Elsevier Ltd.
Lens, P., Westermann, P., Haberbauer, M., Moreno, A. (2005) “Biofuels for Fuel Cells. Renewable energy from biomass fermentation”. IWA Publishing.
Missouri Botanical Garden (2013) The Charms of Duckweed. Available from: http://www.mobot.org/jwcross/duckweed/duckweed.htm [Cited 02.05.13]
Moheadno, R.A., Costa, R.H.R., Tavares, F.A., Filho, P.B. (2012) “High nutrient removal rate from swine wastes and protein biomass production by full-scale duckweed ponds”. Bioresource
30

Technology, 112, p. 98-104, Elsevier Ltd.Olivier, J.G.J., Janssens-Maenhout, G., Peters, J.A.H.W. (2012) Trends in global co2 emissions 2012 report, The Hague/Bilthoven. Available from: http://edgar.jrc.ec.europa.eu/CO2REPORT2012.pdf [Downloaded 02.05.13].
Trata Brazil Institute (2013) ”Situção do Saneamento no Brasil”. Available from: http://www.tratabrasil.org.br/situacao-do-saneamento-no-brasil [Cited 02.05.13]
WBCSD (World Business Council for Sustainable Development) (2004) Mobility 2030: Meeting the challenges to sustainability.
Xu, J., Cui, W., Cheng, J.J., Stomp, A.M. (2011) “Production of high-starch duckweed and its conversion to bioethanol”. Biosystems Engineering, 110(2), p. 67-72. Elsevier Ltd.
Xu, J., Shen, G. (2010) "Growing duckweed in swine wastewater for nutrient recovery and biomass production". Bioresource Technology, 102(2), p. 848-853. Elsevier Ltd.
Xumeng Ge, Ningning Zhang, Gregory C. Phillips, Jianfeng Xu (2012) “Growing Lemna minor in agricultural wastewater and converting the duckweed biomass to ethanol”. Bioresource Technology, 124, p. 485–488. Elsevier Ltd.
Zhao X., Elliston A., Collins S.R.A., Moates G.K., Coleman M.J., Waldron K.W. (2012) “Enzymatic saccharification of duckweed (Lemna minor) biomass without thermophysical pretreatment”. Biomass and Bioenergy, 47, p. 354–361. Elsevier Ltd.
31