prediction of the world cup soccer winner: using two
TRANSCRIPT

PREDICTION OF THE WORLD CUP SOCCER WINNER: USING TWO STATISTICAL METHODS
A Paper Submitted to the Graduate Faculty
of the North Dakota State University
of Agriculture and Applied Science
By
Mohamed Dit Mody Sylla
In Partial Fulfillment of the Requirements for the Degree of
MASTER OF SCIENCE
Major Department: Statistics
May 2016
Fargo, North Dakota

North Dakota State University Graduate School
Title
PREDICTION OF THE WORLD CUP SOCCER WINNER: USING TWO
STATISTICAL METHODS
By
Mohamed Dit Mody Sylla
The Supervisory Committee certifies that this disquisition complies with
North Dakota State University’s regulations and meets the accepted
standards for the degree of
MASTER OF SCIENCE
SUPERVISORY COMMITTEE: Dr. Rhonda Magel
Chair Dr. Abraham Ayebo
Dr. Ronald Degges
Approved: 5/2/2016 Dr. Rhonda Magel
Date Department Chair

iii
ABSTRACT
Soccer is considered the most popular sport on earth and applying statistical models to
analyze small soccer data has been of a keen interest to modern researchers. Statistical
modeling of soccer data also provides guidance and assistance to stakeholders. The goal of this
paper is to establish a consistent statistical approach to help in the prediction of future World
Cup championships. Ordinary least squares regression is used to develop models which predict
goal margin of games and logistic regression is used to develop models which estimate the
probability of a team winning the game. Discriminant Analysis was also used to determine
which variables significantly influence individual game wins. The Fisher classification procedure
allows for interpretability while providing a robust approach to classifying the 32 contestants of
the 2014 World Cup using the previous data from 2006 and 2010 World Cup Championships.

iv
ACKNOWLEDGEMENTS
First I am indubitably grateful to my Committee Chairman, Dr. Rhonda Magel, for her
excellent guidance, caring, and patience; for providing me with an opportunity for completing
this paper.
Although it is impossible to list everyone to whom I am indebted, several persons
deserve special mention such as my mentor Dr. Abraham Ayebo, and Dr. Ron Degges for
accepting to serve in this committee. Without all their kind assistance, continuous support, and
insightful feedback, I would not achieve and accomplish what seems to be too far to reach in a
lifetime.
Throughout the writing of this paper, I have had the love, full support and tenacity of my
wife Fatoumata Diawara, my daughter Mariam Iman Sylla and my son Carter James. They are
the love of my life, the rock that I can lean on and the ones who shares my best and worst
moments. I greatly appreciate each one of them, for their compassionate encouragement
throughout this tortuous journey. Without them, this proud and victorious episode would not
have been achievable.

v
DEDICATION
I would like to dedicate this Master paper to my loving parents, brothers and sisters, and of
course, my wife, daughter and my son. Thanks so much for their never-ending love, support,
and spirit, during this tedious period.
vi
TABLE OF CONTENTS ABSTRACT ........................................................................................................................................ iii
ACKNOWLEDGEMENTS ................................................................................................................... iv
DEDICATION ..................................................................................................................................... v
LIST OF TABLES ................................................................................................................................ ix
LIST OF FIGURES .............................................................................................................................. xi
CHAPTER 1. INTRODUCTION ........................................................................................................... 1
CHAPTER 2. LITERATURE REVIEW ................................................................................................... 3
CHAPTER 3. DESIGN OF STUDY ....................................................................................................... 7
World Cup Format ....................................................................................................................... 7
Phase 1: Models Development ................................................................................................... 8
Phase 2: Models Validation ....................................................................................................... 11
Phase 3: Models Prediction ....................................................................................................... 11
Fisher’s Classification Procedure ............................................................................................... 12
CHAPTER 4. RESULTS ..................................................................................................................... 13
Phase 1: Models Development ................................................................................................. 13
Point model development for round robin stage (Round 1). ................................................ 13
Goal margin model development for round robin stage (Round 1). .................................... 14
Goal margin model development for Round 2 or knock-out stage. ..................................... 15
Logistic regression model development for Round 2 or knock-out stage. ........................... 16

vii
Goal margin model development for Rounds 3-5. ................................................................ 18
Logistic regression model development for Rounds 3-5. ...................................................... 18
Phase 2: Models Validation ....................................................................................................... 20
Validation of the point model for round robin...................................................................... 20
Validation of Goal Margin model for round robin ................................................................ 23
Validation of goal margin model for Round 2 or knock-out stage ........................................ 25
Validation of logistic regression for Round 2. ....................................................................... 27
Validation of goal margin model for Rounds 3-5. ................................................................. 29
Validation of logistic regression for Round 3-5. .................................................................... 31
Phase 3: Models Prediction ....................................................................................................... 33
Actual prediction of the Point model (Round 1) ................................................................... 33
Actual prediction 2014 for the Goal Margin model .............................................................. 37
Actual prediction from Round 2 for the Goal Margin model for 2014 ................................. 40
Actual 2014 prediction from Round 2 for Logistic Regression model. .................................. 42
Actual 2014 prediction from the Goal Margin Rounds 3-5. .................................................. 44
Actual 2014 prediction from logistic regression of Rounds 3-5. ........................................... 46
Fisher’s Classification Procedure ............................................................................................... 48
CHAPTER 5. CONCLUSIONS ........................................................................................................... 50
REFERENCES .................................................................................................................................. 52
APPENDIX A. LIST OF VARIABLES .................................................................................................. 53

viii
APPENDIX B. SAS CODE ................................................................................................................. 55
APPENDIX C. R CODE ..................................................................................................................... 58
APPENDIX D. SPPS CODE ............................................................................................................... 60
APPENDIX E. 2006 DATA ............................................................................................................... 61

ix
LIST OF TABLES
Table Page
4.1. Linear Regression with a Stepwise Selection .............................................................. ….…14
4.2. R-Square and Adjusted R-Square Values. ......................................................................... 15
4.3. Parameter Estimate for Goal Margin Model. ................................................................... 15
4.4. Parameter Estimate for Goal Margin Model. ................................................................... 16
4.5. Parameter Estimate Values for Logistic Regression Round 2 ........................................... 17
4.6. Parameter Estimate Value for Goal Margin Model. ......................................................... 18
4.7. Parameter Estimate for Logistic Regression for Rounds 3-5. ........................................... 19
4. 8. Result from Point Model Round Robin 2010. ................................................................... 20
4.9. Example for Point Model. ................................................................................................. 22
4.10. Overall Correct Prediction Table. ...................................................................................... 23
4.11. Result from the Goal Margin Model. ................................................................................ 24
4.12. Example of Two Goal Margin Models. ............................................................................. 26
4.13. 2010 Results from the Goal Margin Model. ..................................................................... 27
4.14. Example of Two Matches for Logistic Regression Round 2. ............................................. 28
4.15. 2010 Validation Results from the Logistic Regression. ..................................................... 29
4.16. Example of Two Matches for Goal Margin Model. ........................................................... 30
4.17. Validation from Goal Margin. ........................................................................................... 31
4.18. Example of Logistic Regression for Rounds 3-5. ............................................................... 32
x
4.19. Validation for Logistic Regression for Rounds 3-5. ........................................................... 33
4.20. Example of Actual Prediction of Teams Who Qualify in Group A. .................................... 34
4.21. Example of Actual Prediction of Teams Who Did Not Qualify in Group A. ...................... 34
4.22. Example of Actual Prediction of Teams Who Qualified in Group F. ................................. 35
4.23. Example of Actual Prediction of Teams Who Did Not Qualify in Group F. ....................... 35
4.24. Results for Point Model 2014. .......................................................................................... 36
4.25. Example of a Goal Margin Model. .................................................................................... 38
4.26. Example of a Goal Margin Model. .................................................................................... 38
4.27. 2014 Results from Goal Margin Model Round Robin. ...................................................... 39
4.28. Examples of Two Matches for the Goal Margin Model. ................................................... 41
4.29. 2014 Results from the Goal Margin Model . .................................................................... 42
4.30. Example of Two Matches for Logistic Regression Round 2. ............................................. 43
4.31. Actual Results from Logistic Regression Model. ............................................................... 44
4.32. Example of Two Matches for Goal Margin Rounds 3-5. ................................................... 45
4.33. Results from Goal Margin Model Rounds 3-5 2014. ........................................................ 45
4.34. Prediction Examples of a Logistic Regression for Rounds 3-5. ......................................... 46
4.35. Results from Logistic Regression. ..................................................................................... 47
4.36. Standardized Canonical Discriminant Function Coefficients. ........................................... 48
4.37. Fisher’s Linear Discriminant Functions. ............................................................................ 49
4.38. Cross-validation Classification Table. ................................................................................ 49

xi
LIST OF FIGURES
Figure Page
4.1. ROC Curve for Logistic Regression of Round 2…… ............................................................ 17
4.2. ROC Curve for Logistic Regression of Rounds 3-5… .......................................................... 19
1
CHAPTER 1. INTRODUCTION
World Cup is the most widely viewed sport event in the world with an estimated of 715
million spectators, broadcasted to 204 countries around the globe [FIFA.com]. On June 12,
2014, the mind of soccer fanatics was geared towards Brazil not only dancing samba in the
beach of Rio del Janeiro and Sao Paulo but also cheering for their teams. Paul, the octopus, was
the only cephalopod that could predict a winner of the World Cup but unfortunately died in
October 2010. However, in this paper we will try to replace Paul by statistical models.
The purpose of this paper is to predict the champion of the Brazil World Cup 2014.
Before embarking on the details let us introduce the general format of the competition.
Preliminary games are organized among the national teams of the countries of all seven
continents and the best 32 teams are qualified for the World Cup. There is then a random
drawing that puts the 32 teams into eight groups of four teams each. After each team has
played a total of 3 games (Round Robin), the first two best teams with the maximum points in
each group will make it to Round 16 (Knock out stage); followed by the quarter-final, semi-final
and the final. The final game is played between the last two teams that have not been knocked
out of the competition. During the Round Robin stage if there is a tie within a group the team
with the greatest goal difference moves to Round 16. The point allocation during the Round
Robin stage follows this format: 3 points for a win, 1 point for a draw and no points for a lost
game.

2
This paper will focus on considering various variables that will help us predict the winner
of the World Cup from the Round Robin until the Final Round. Models will be developed to
estimate the number of points in the Round Robin and the goal margin for every game. Models
will also be developed to estimate the probability of a particular team winning the game. These
models were developed using information from the 2006 World Cup and validated using the
2010 World Cup. They will be used to predict results in the 2014 World Cup.
3
CHAPTER 2. LITERATURE REVIEW
Extensive research in forecasting soccer outcomes has been conducted using direct and
indirect approaches. The direct approach uses regression methods such as logistic regression
with Win/Draw/Lost treated as a dependent variables. This method has been favored by Koning
(2000). The indirect forecasting approach originally proposed by Moroney (1956) and revisited
by Karlis and Ntzoufras (2003) models the distributions of Goals Scored by each team. It
assumes Goals Scored follows a bivariate Poisson model. The disadvantage of this model is that
it underestimates the number of draws in a Round Robin tournament. In addition, the model
allows only for positive correlation and if there is any negative correlation in the data, the
model cannot handle it (Karlis & Ntzoufras, 2003).
Despite this popular method of Moroney (1956), his method was followed 12 years later
by a method proposed by Reep and Benjamin (1968). Reep and Benjamin (1968) also used an
indirect forecasting approach but by fitting a Negative Binomial distribution to the number of
Goal Scored (GS) by each team during soccer match instead of a Poisson model. Reep and
Benjamin (1968) gathered data from 3,213 matches between 1953 and 1968. They found that
80% of Goals Scored occurred after a sequence of three passes or less, which leads to believe
that shots into goals are triggered by the number of passes between players from the same
team.
4
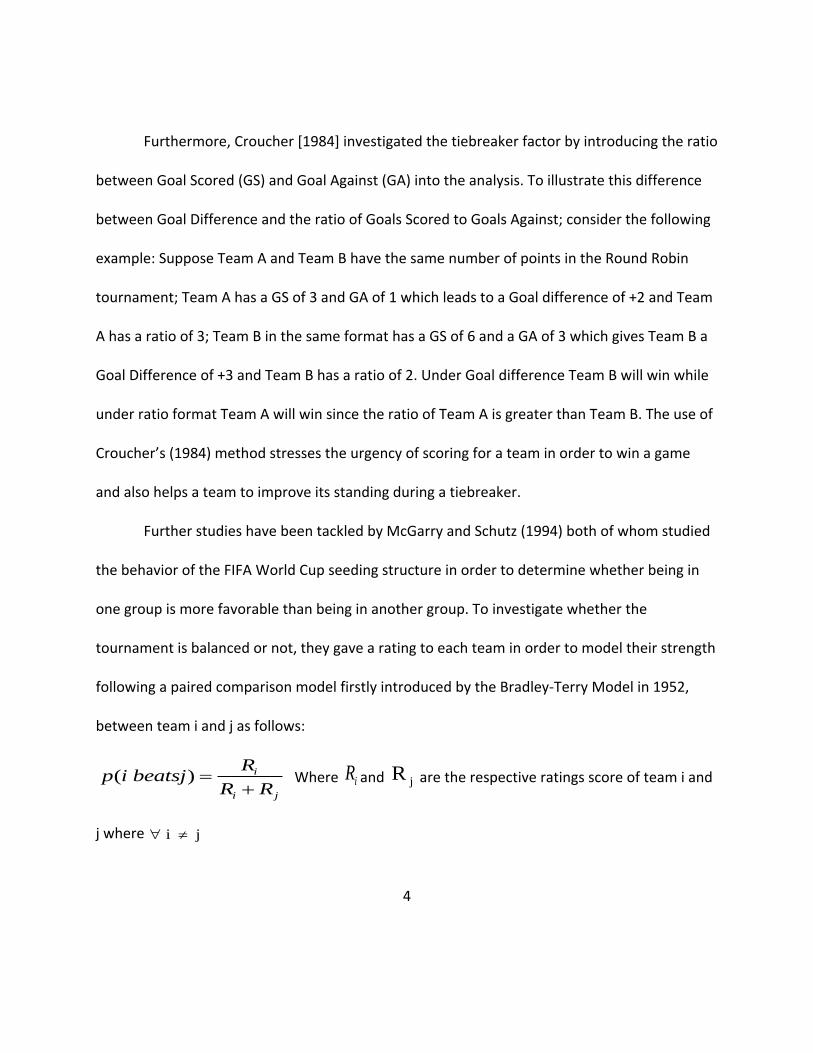
Furthermore, Croucher [1984] investigated the tiebreaker factor by introducing the ratio
between Goal Scored (GS) and Goal Against (GA) into the analysis. To illustrate this difference
between Goal Difference and the ratio of Goals Scored to Goals Against; consider the following
example: Suppose Team A and Team B have the same number of points in the Round Robin
tournament; Team A has a GS of 3 and GA of 1 which leads to a Goal difference of +2 and Team
A has a ratio of 3; Team B in the same format has a GS of 6 and a GA of 3 which gives Team B a
Goal Difference of +3 and Team B has a ratio of 2. Under Goal difference Team B will win while
under ratio format Team A will win since the ratio of Team A is greater than Team B. The use of
Croucher’s (1984) method stresses the urgency of scoring for a team in order to win a game
and also helps a team to improve its standing during a tiebreaker.
Further studies have been tackled by McGarry and Schutz (1994) both of whom studied
the behavior of the FIFA World Cup seeding structure in order to determine whether being in
one group is more favorable than being in another group. To investigate whether the
tournament is balanced or not, they gave a rating to each team in order to model their strength
following a paired comparison model firstly introduced by the Bradley-Terry Model in 1952,
between team i and j as follows:
( ) i
i j
Rp i beatsj
R R
Where iR and jR are the respective ratings score of team i and
j where i j

5
Let us recall that eight teams in the drawing process are seeded according to FIFA top
seven ranking teams and the host country is naturally placed on top of a group A; the remaining
24 teams are randomly drawn to fill the empty spot of each group. However, in the World Cup
1994, only 24 teams were participating in the championship in which teams were divided into
six groups of four teams each and the first two best teams with the maximum points in each
group will make it to Round 16, including the four best third teams in the Round Robin will also
make it to Round 16.
McGarry and Schutz (1994) gave a rating score of 100 for the team in the first seed, the
second seeds a score of 80, the third seeds a score of 60, and the final seeds a score of 40,
which respectively corresponds to first ranked teams A-1, B-1, C-1, D-1. The first ranked teams
(A-1, B-1, C-1, D-1) played against possible opponents from the third ranked teams while the
first ranked of group E and F were matched to play against second ranked teams for Round 2.
In their study, McGarry and Schutz (1994) established that group structure was biased,
principally due to the seeding of the Round 16 since the first rank teams of group A, B, C, D
were to played against the third ranked teams, whereas, group E and F were to play against
second rank teams in the knock out stage with the assumption of first rank teams being
stronger than third ranked teams.
They found that being in groups A and C were more beneficial for the rest of the World
Cup than being in groups E and F (McGarry & Schutz, 1994).

6
Magel and Melnykov (2014) studied factors that were significant in predicting the
outcomes of European soccer games. They found that differences between goals scored and
goals against based on K previous games of both teams were significant. The differences in
cards received by both teams and their opponents based on K previous games were also
significant.
This paper will extend the findings of Magel and Melnykov (2014) for European soccer
games to the World Cup. The research will focus on considering Goals Scored, Goals Against,
and number of cards received the last k games, as well as the winning probability prior to
entering the competition in order to develop models to predict the results of the World Cup.

7
CHAPTER 3. DESIGN OF STUDY
The purpose of this research is to develop models to predict the champion of future
World Cup matches. Our research will include three phases. In phase 1, models were developed
based on samples obtained from the 2006 World Cup. In phase 2, the models were tested using
data from the 2010 World Cup. In phase 3, predictions were made for the 2014 World Cup.
World Cup Format
The World Cup has five rounds of play. The first round has 32 teams placed in eight
groups each having four members. Every team in the group plays each other once. Therefore,
each team plays three games and there are six games played within each of the eight groups. A
team is awarded 3 points for a win, 1 point for a tie and no points for a loss at the end of
regulation time. The two teams from each group with the largest number of points made it into
the second round with tied number of points being broken by the difference in total number of
goals scored between the team and their opponents. Round 2 through 5 are knockout rounds in
which the loosing team goes home and the winning team goes to the next round. The highest
seven ranked teams based on FIFA ranking system including 2006 World Cup champion are
placed on top of the eight groups; and then the remaining three teams of each group are
randomly filled. The knockout Round 2 is seeded in the following fashion:

8
A winner of Group A plays against the second best team of Group B and the second best
team of Group A plays against the winner of Group B; the precedent scheme is achieved up to
Group G.
Phase 1: Models Development
Two models were developed for Round 1. The first model developed is a point model to
predict the total number of points that a team will get in Round 1. Ordinary Least Squares
regression with no intercept; using the stepwise selection procedure was used with and alpha
value of entry equal to 0.25 and an alpha value of stay equal to 0.20 to determine which
variables should be included in the model. The independent variables considered for inclusion
in the model were:
Average Goals Scored per game by a team before the 2006 World Cup
Average Goals Scored against a team before the 2006 World Cup
Average Cards given by a referee before the 2006 World Cup
Winning probability of a team before the 2006 World Cup
The data were abstracted from the official FIFA web site of FIFA (www.fifa.com) for the period
of August 18, 2004 through November 16, 2005 in which the preliminaries took place.
The second model developed for Round 1 was a model to predict the goal margin for
each of the 48 games in Round 1. Ordinary Least squares regression with the intercept term set
to zero was used to develop this model with the dependent variable being the goal margin. The

9
stepwise selection procedure with alpha entry equal to 0.25 and alpha stay equal to 0.20 was
used to determine which independent variables to include in the model. The independent
variables considered for inclusion in the model were:
Differences in Average Goals Scored between two teams before the World Cup
2006.
Differences in Average Goals Against between two teams before the World cup
2006.
Differences in Average number of Cards given by a referee between two teams
before the World Cup 2006.
Differences in winning probability before the World Cup 2006
The estimated value of y from the goal margin model was rounded to the nearest integer. Two
models were developed for Round 2, a goal margin model using Ordinary Least Squares
regression and a Logistic Regression model estimating the probability that Team A would win.
The intercept terms were set to zero for both models. Stepwise selection was again used in
developing the models. Only data on teams playing in the second round of the 2006 World Cup
was used. The following variables were considered for possible entry into the goal margin
model:
Differences in Average Goals Scored between two teams before World Cup 2006
Difference in Average Goals Scored Against two teams before World Cup 2006

10
Differences in Average disciplinary Cards given by a referee before World Cup 2006
Difference in Average winning percentage between two teams before World Cup
2006
Differences in Average Goals Scored during Round Robin of the World Cup 2006
Differences in Average Goal Scored against during Round Robin of the World Cup
2006
Difference in Average disciplinary cards given during Round Robin of the World Cup
2006
Difference in Average Number of wins in the Round Robin World Cup 2006.
If the estimated probability was larger than 0.5, we would predict that team A to win. If
the estimated probability was less than 0.5, we would predict Team A to lose.
Two models were developed for Rounds 3-5. These models were developed based on
data from teams playing in the World Cup in Rounds 3-5 in 2006. A goal margin model and a
logistic regression model were developed using the stepwise selection technique. The
intercepts were set to zero for both models. The following variables, starting with the first
game in the World Cup were considered for possible entry into goal margin:
Difference in average Goals Scored between two teams up to this present round
Difference in average Goals Scored against between two teams up to this present
round
11
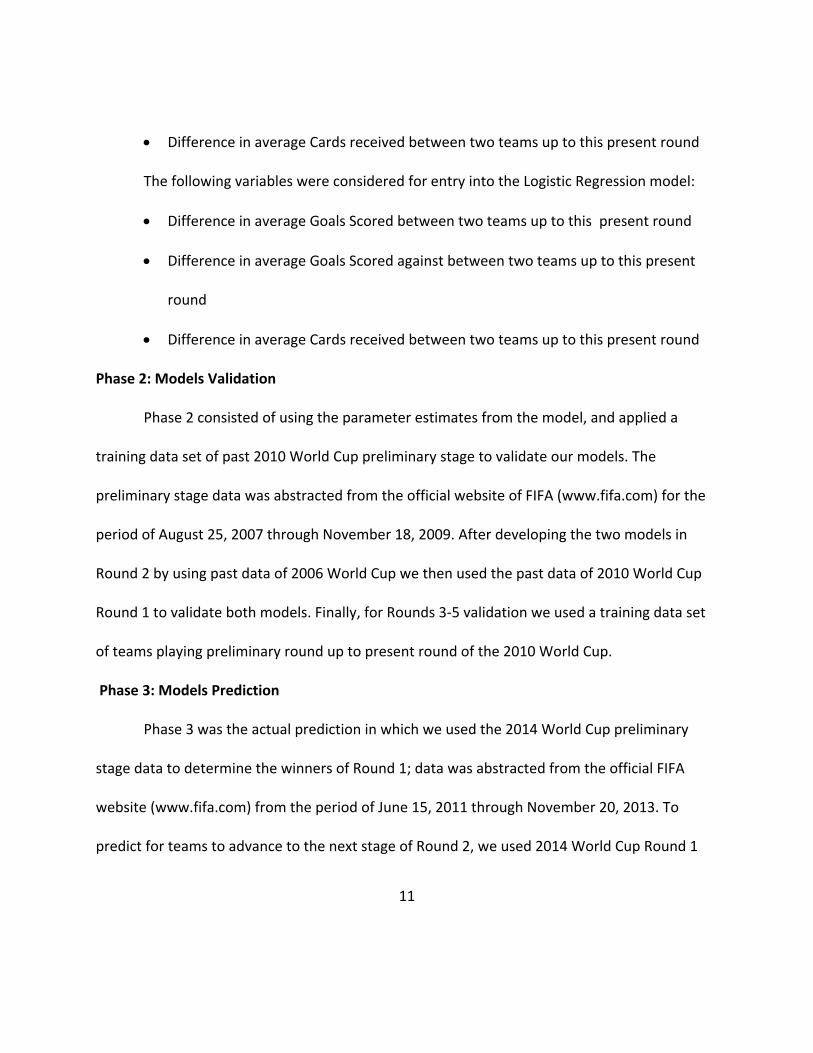
Difference in average Cards received between two teams up to this present round
The following variables were considered for entry into the Logistic Regression model:
Difference in average Goals Scored between two teams up to this present round
Difference in average Goals Scored against between two teams up to this present
round
Difference in average Cards received between two teams up to this present round
Phase 2: Models Validation
Phase 2 consisted of using the parameter estimates from the model, and applied a
training data set of past 2010 World Cup preliminary stage to validate our models. The
preliminary stage data was abstracted from the official website of FIFA (www.fifa.com) for the
period of August 25, 2007 through November 18, 2009. After developing the two models in
Round 2 by using past data of 2006 World Cup we then used the past data of 2010 World Cup
Round 1 to validate both models. Finally, for Rounds 3-5 validation we used a training data set
of teams playing preliminary round up to present round of the 2010 World Cup.
Phase 3: Models Prediction
Phase 3 was the actual prediction in which we used the 2014 World Cup preliminary
stage data to determine the winners of Round 1; data was abstracted from the official FIFA
website (www.fifa.com) from the period of June 15, 2011 through November 20, 2013. To
predict for teams to advance to the next stage of Round 2, we used 2014 World Cup Round 1

12
data. Finally, we used data from preliminary round up to present round of 2014 World Cup to
predict the champion of 2014 World Cup.
Fisher’s Classification Procedure
Linear Discriminant Analysis was used to elucidate the difference between Teams who
qualify and Teams who do not qualify for the knock-out stage of the 2006 and 2010 World Cups
and also to identify which variables mostly contributed to the separations of successful and
non-successful Teams. 2006 and 2010 World Cups data (Fifa.com) with the following variables
were considered:
Average Goals Scored during Round Robin of the World Cup 2006
Average Goal Scored against during Round Robin of the World Cup 2006
Average disciplinary cards given during Round Robin of the World Cup 2006
Average Goals Scored during Round Robin of the World Cup 2010
Average Goal Scored against during Round Robin of the World Cup 2010
Average disciplinary cards given during Round Robin of the World Cup 2010
13
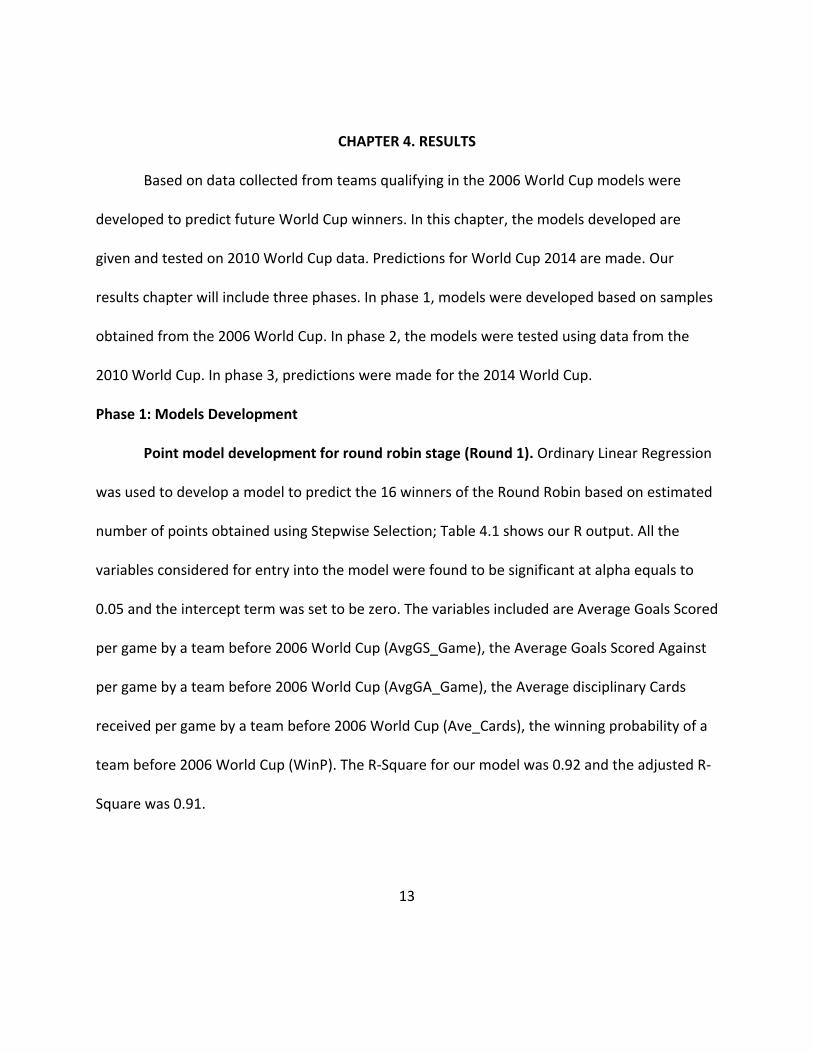
CHAPTER 4. RESULTS
Based on data collected from teams qualifying in the 2006 World Cup models were
developed to predict future World Cup winners. In this chapter, the models developed are
given and tested on 2010 World Cup data. Predictions for World Cup 2014 are made. Our
results chapter will include three phases. In phase 1, models were developed based on samples
obtained from the 2006 World Cup. In phase 2, the models were tested using data from the
2010 World Cup. In phase 3, predictions were made for the 2014 World Cup.
Phase 1: Models Development
Point model development for round robin stage (Round 1). Ordinary Linear Regression
was used to develop a model to predict the 16 winners of the Round Robin based on estimated
number of points obtained using Stepwise Selection; Table 4.1 shows our R output. All the
variables considered for entry into the model were found to be significant at alpha equals to
0.05 and the intercept term was set to be zero. The variables included are Average Goals Scored
per game by a team before 2006 World Cup (AvgGS_Game), the Average Goals Scored Against
per game by a team before 2006 World Cup (AvgGA_Game), the Average disciplinary Cards
received per game by a team before 2006 World Cup (Ave_Cards), the winning probability of a
team before 2006 World Cup (WinP). The R-Square for our model was 0.92 and the adjusted R-
Square was 0.91.
14
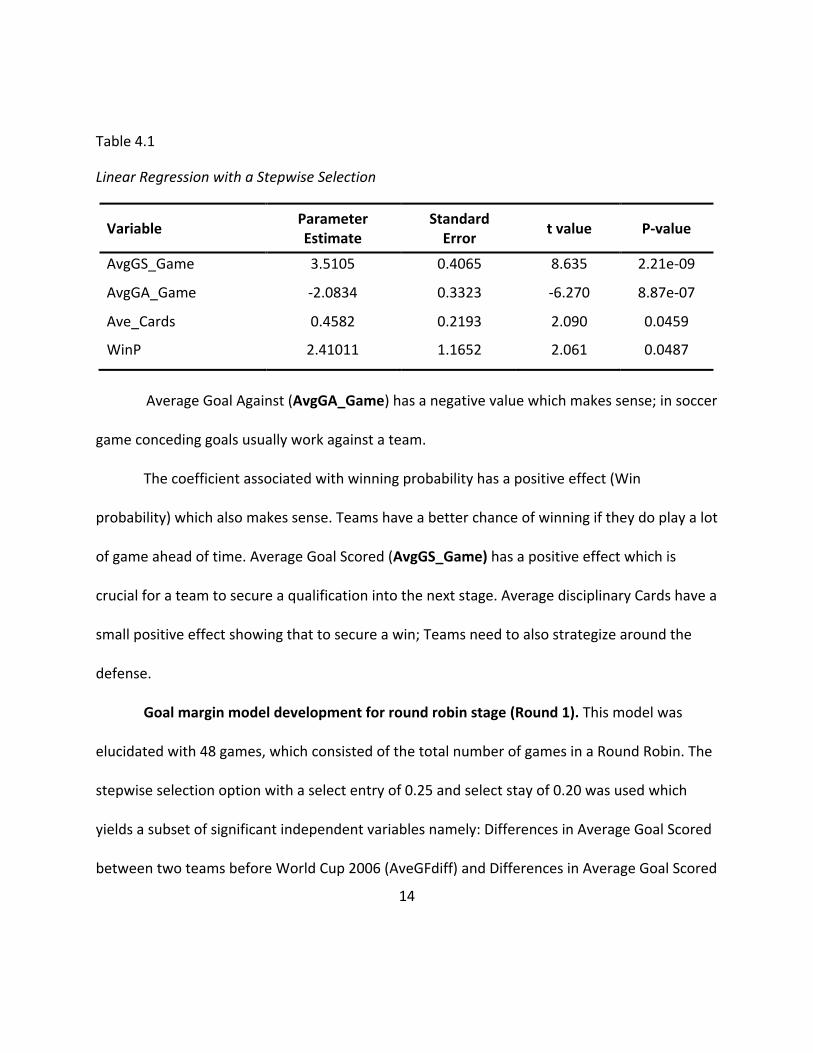
Table 4.1
Linear Regression with a Stepwise Selection
Average Goal Against (AvgGA_Game) has a negative value which makes sense; in soccer
game conceding goals usually work against a team.
The coefficient associated with winning probability has a positive effect (Win
probability) which also makes sense. Teams have a better chance of winning if they do play a lot
of game ahead of time. Average Goal Scored (AvgGS_Game) has a positive effect which is
crucial for a team to secure a qualification into the next stage. Average disciplinary Cards have a
small positive effect showing that to secure a win; Teams need to also strategize around the
defense.
Goal margin model development for round robin stage (Round 1). This model was
elucidated with 48 games, which consisted of the total number of games in a Round Robin. The
stepwise selection option with a select entry of 0.25 and select stay of 0.20 was used which
yields a subset of significant independent variables namely: Differences in Average Goal Scored
between two teams before World Cup 2006 (AveGFdiff) and Differences in Average Goal Scored
Variable Parameter Estimate
Standard Error
t value P-value
AvgGS_Game 3.5105 0.4065 8.635 2.21e-09
AvgGA_Game -2.0834 0.3323 -6.270 8.87e-07
Ave_Cards 0.4582 0.2193 2.090 0.0459
WinP 2.41011 1.1652 2.061 0.0487
15
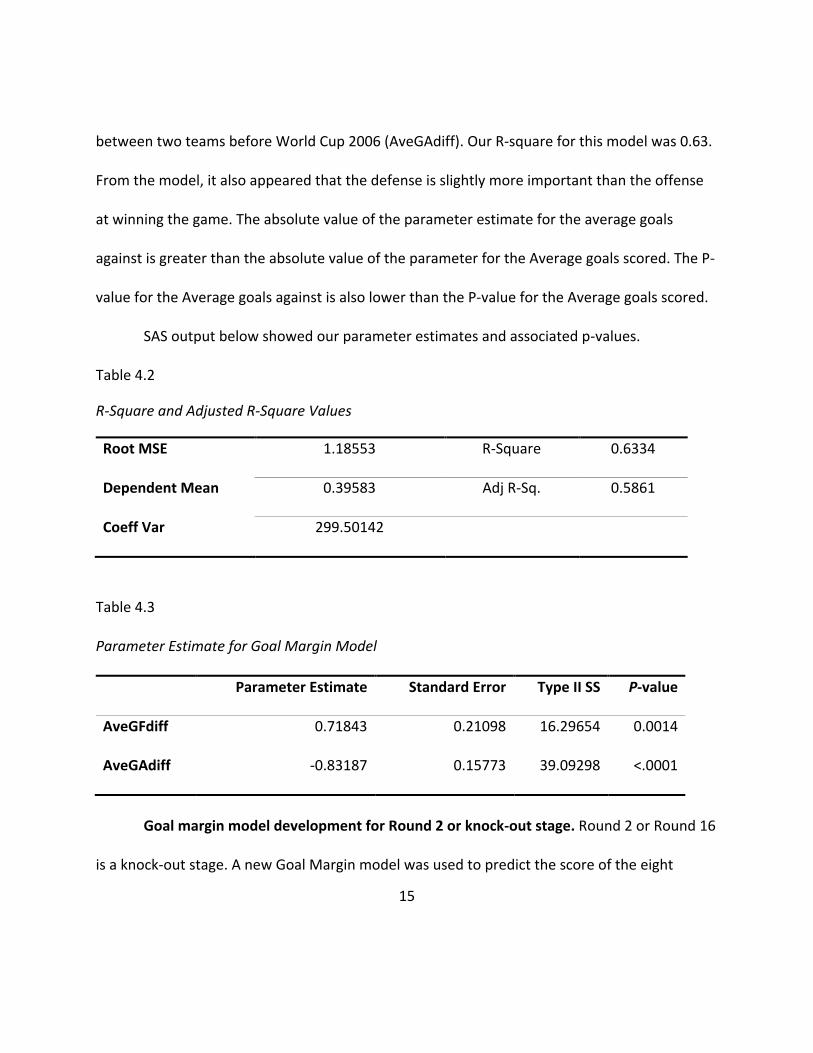
between two teams before World Cup 2006 (AveGAdiff). Our R-square for this model was 0.63.
From the model, it also appeared that the defense is slightly more important than the offense
at winning the game. The absolute value of the parameter estimate for the average goals
against is greater than the absolute value of the parameter for the Average goals scored. The P-
value for the Average goals against is also lower than the P-value for the Average goals scored.
SAS output below showed our parameter estimates and associated p-values.
Table 4.2
R-Square and Adjusted R-Square Values
Root MSE 1.18553 R-Square 0.6334
Dependent Mean 0.39583 Adj R-Sq. 0.5861
Coeff Var 299.50142
Table 4.3
Parameter Estimate for Goal Margin Model
Parameter Estimate Standard Error Type II SS P-value
AveGFdiff 0.71843 0.21098 16.29654 0.0014
AveGAdiff -0.83187 0.15773 39.09298 <.0001
Goal margin model development for Round 2 or knock-out stage. Round 2 or Round 16
is a knock-out stage. A new Goal Margin model was used to predict the score of the eight

16
games played in this round using data from the 2006 Past World Cup
(http://www.fifa.com/worldcup/archive/germany2006/matches). We found that three
variables were significant: Difference in Average Goals Scored during Round Robin of 2006
World Cup (ADiffGF), Difference in Average Goals Scored against during Round Robin of 2006
World Cup (ADiffGA), Difference in Average disciplinary Cards given during Round Robin of 2006
World Cup (ADiffCards). Below is the R output and it is noted that the adjusted R-square had a
value of 0.67.
Table 4.4
Parameter Estimate for Goal Margin Model
Variable Parameter Estimate
Standard Error
t value P-value
ADiffGF 2.0226 0.5352 3.7979 0.012
ADiffGA -0.9351 0.6899 -1.6781 0.133
ADiffCards -1.1514 0.7818 -1.9852 0.105
Logistic regression model development for Round 2 or knock-out stage. We used the
past data of 2006 World Cup (fifa.com) to develop a logistic regression to predict which teams
are going to move to the Round 3. Out of possible predictors variables given in Chapter 3 only
three were significant (α = 0.20) : Difference in average Goals Scored between two teams
during Round 1 (AdiffGF); Difference in average Goals Scored against between two teams
during Round 1 (AdiffGA); and Difference in average Cards received between two teams during

17
Figure 4.1. ROC Curve for Logistic Regression of Round 2. Area under the curve = 0.78
Round 1 (AdiffGA). Hosmer-Lemeshow was used to assess the goodness of fit, where the null
Hypothesis indicates that our current model fits well and the alternative hypothesis indicates
the model does not fit well. The output displays a P-value of 0.544 meaning that we do no
reject the null hypothesis and we concluded that the model is a good fit.
Table 4.5
Parameter Estimate Values for Logistic Regression Round 2
Variable Parameter Estimate
Standard Error
Z value P-value
ADiffGF 1.2135 0.9667 1.255 0.2093
ADiffGA -2.5469 1.0284 -2.477 0.0133
ADiffCards -0.6724 0.3374 -1.993 0.0463

18
Goal margin model development for Rounds 3-5. One Goal Margin model was
developed for Rounds 3- 5. Past World Cup 2006 (fifa.com) data were used to develop a model.
Again the stepwise technique was used with a select entry of 0.25 and select stay of 0.20; the
significant variables found were: Difference in average Goals Scored between two teams up to
this Round (AdiffGF) and Difference in average Goals Scored against between two teams up to
this Round (AdiffGA) (Chapter 3). Our adjusted R-square value was 0.62.
Table 4.6
Parameter Estimate Value for Goal Margin Model
Variable Parameter Estimate
Standard Error t-value P-value
ADiffGF 1.0067 0.2642 3.81 0.000329
ADiffGA -0.7044 0.1845 -3.818 0.000318
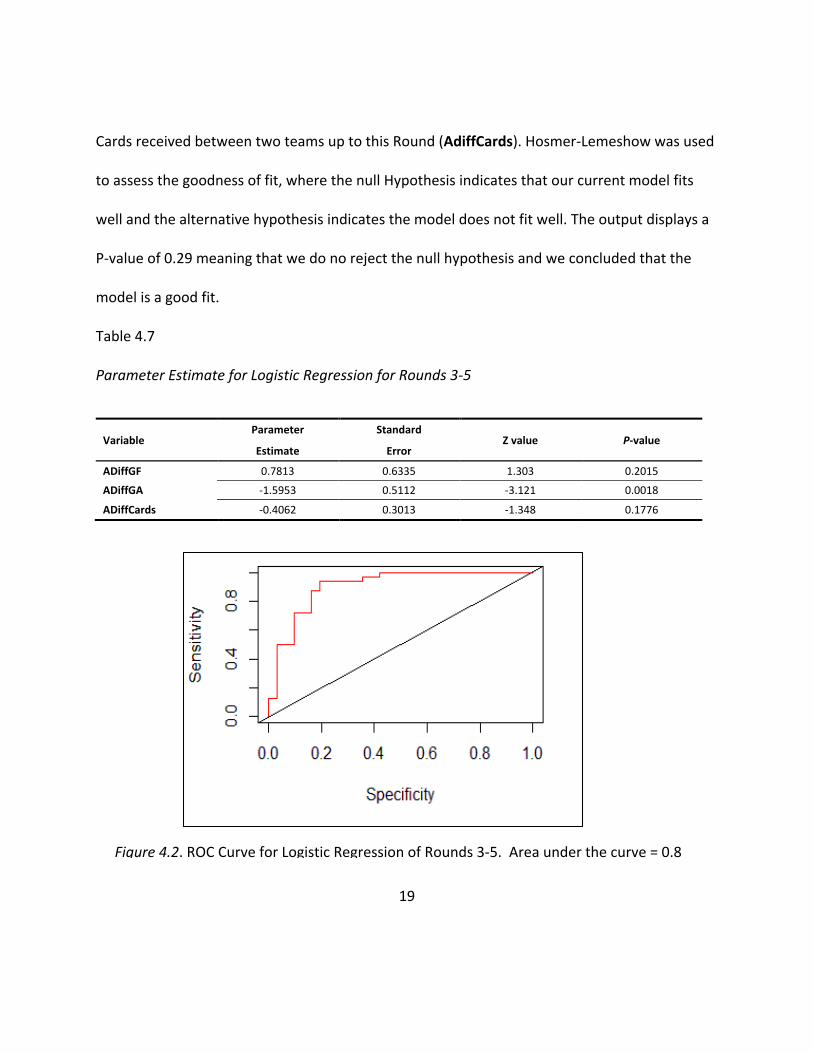
Logistic regression model development for Rounds 3-5. A Logistic regression was
developed to predict the probability of a team winning the World Cup. We used past data of
World Cup 2006 to build our model. After using the stepwise selection technique with a select
entry of 0.25 and select stay of 0.20, we found the following variables significant: Difference in
average Goals Scored between two teams up to this Round (AdiffGF), Difference in average
Goals Scored against between two teams up to this Round (AdiffGA), and Difference in average
19
Figure 4.2. ROC Curve for Logistic Regression of Rounds 3-5. Area under the curve = 0.8
Cards received between two teams up to this Round (AdiffCards). Hosmer-Lemeshow was used
to assess the goodness of fit, where the null Hypothesis indicates that our current model fits
well and the alternative hypothesis indicates the model does not fit well. The output displays a
P-value of 0.29 meaning that we do no reject the null hypothesis and we concluded that the
model is a good fit.
Table 4.7
Parameter Estimate for Logistic Regression for Rounds 3-5
Variable Parameter Standard
Z value P-value Estimate Error
ADiffGF 0.7813 0.6335 1.303 0.2015
ADiffGA -1.5953 0.5112 -3.121 0.0018
ADiffCards -0.4062 0.3013 -1.348 0.1776
20
Phase 2: Models Validation
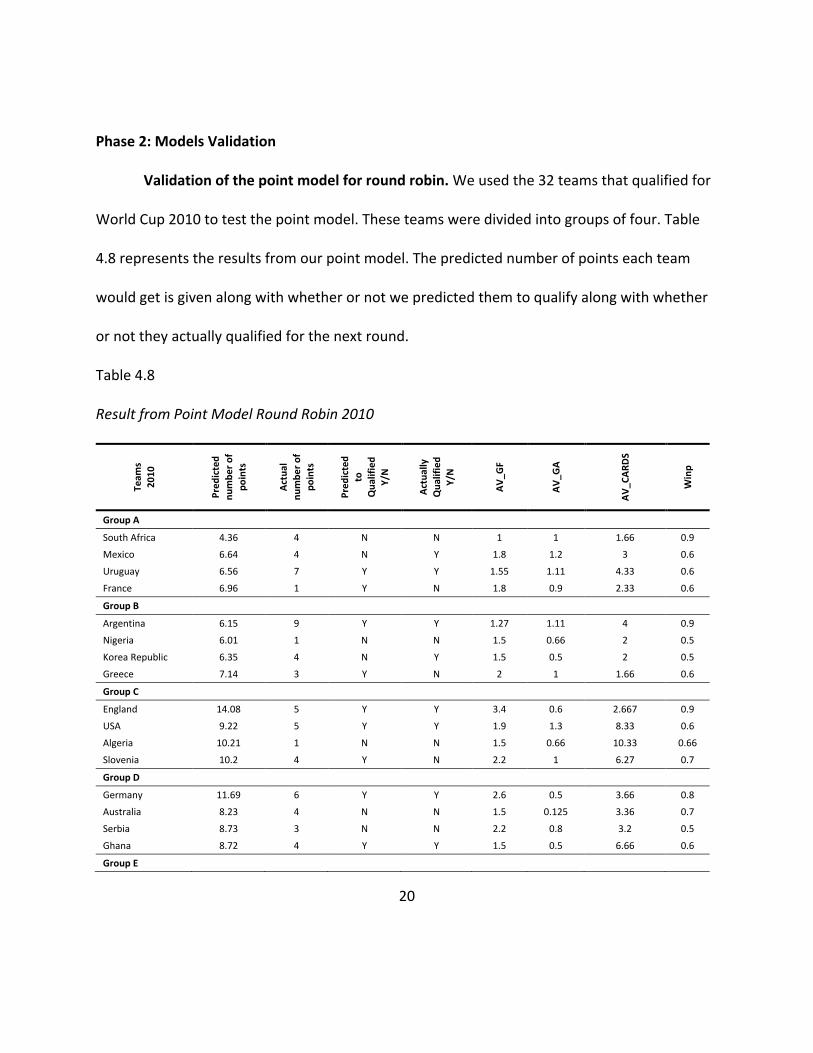
Validation of the point model for round robin. We used the 32 teams that qualified for
World Cup 2010 to test the point model. These teams were divided into groups of four. Table
4.8 represents the results from our point model. The predicted number of points each team
would get is given along with whether or not we predicted them to qualify along with whether
or not they actually qualified for the next round.
Table 4.8
Result from Point Model Round Robin 2010
Team
s
20
10
Pre
dic
ted
nu
mb
er
of
po
ints
Act
ual
nu
mb
er
of
po
ints
Pre
dic
ted
to
Qu
alif
ied
Y/N
Act
ual
ly
Qu
alif
ied
Y/N
AV
_GF
AV
_GA
AV
_CA
RD
S
Win
p
Group A
South Africa 4.36 4 N N 1 1 1.66 0.9
Mexico 6.64 4 N Y 1.8 1.2 3 0.6
Uruguay 6.56 7 Y Y 1.55 1.11 4.33 0.6
France 6.96 1 Y N 1.8 0.9 2.33 0.6
Group B
Argentina 6.15 9 Y Y 1.27 1.11 4 0.9
Nigeria 6.01 1 N N 1.5 0.66 2 0.5
Korea Republic 6.35 4 N Y 1.5 0.5 2 0.5
Greece 7.14 3 Y N 2 1 1.66 0.6
Group C
England 14.08 5 Y Y 3.4 0.6 2.667 0.9
USA 9.22 5 Y Y 1.9 1.3 8.33 0.6
Algeria 10.21 1 N N 1.5 0.66 10.33 0.66
Slovenia 10.2 4 Y N 2.2 1 6.27 0.7
Group D
Germany 11.69 6 Y Y 2.6 0.5 3.66 0.8
Australia 8.23 4 N N 1.5 0.125 3.36 0.7
Serbia 8.73 3 N N 2.2 0.8 3.2 0.5
Ghana 8.72 4 Y Y 1.5 0.5 6.66 0.6
Group E

21
Team
s
20
10
Pre
dic
ted
nu
mb
er
of
po
ints
Act
ual
nu
mb
er
of
po
ints
Pre
dic
ted
to
Qu
alif
ied
Y/N
Act
ual
ly
Qu
alif
ied
Y/N
AV
_GF
AV
_GA
AV
_CA
RD
S
Win
p
Netherlands 10.24 9 Y Y 2.125 0.25 3 0.8
Denmark 8.16 3 N N 1.6 0.5 4.66 0.6
Japan 6.6 6 N Y 1.375 0.75 4.66 0.5
Cameroon 8.77 0 Y N 1.5 0.33 6 0.6
Group F
Italy 9.6 2 N N 1.8 0.7 6.66 0.7
Paraguay 8.68 5 N Y 1.33 0.833 8.33 0.8
New Zealand 10.51 3 Y N 2.33 0.833 4.66 0.8
Slovakia 9.77 3 Y Y 2 1 6.33 0.8
Group G
Brazil 9.26 7 Y Y 1.83 0.61 6.33 0.5
Korea DPR 6.31 0 N N 0.875 0.625 8.33 0.3
Ivory Coast 6.76 4 N N 1.16 0.66 4.66 0.8
Portugal 8.12 5 Y Y 1.7 0.5 4.33 0.5
Group H
Spain 12.94 6 Y Y 2.8 0.5 4.33 0.9
Switzerland 8.54 4 N N 1.8 0.8 5.33 0.6
Honduras 7.33 1 N N 0.7 1.1 13 0.5
Chile 8.67 6 Y Y 2 1 5 0.6
The validation process of our test data allowed us to have an overall correct prediction
of 71.8 % accuracy (Table 4.9). In fact in World Cup 2010 in group G, Brazil was in the same
group stage as Portugal, Korea DPR, Ivory Coast; and our model predicted 9.26 points for Brazil
and 8.12 points for Portugal.
The results from the model are given as follows:
Table 4.8 Result from Point Model Round Robin 2010 (Continued)
22
Table 4.9
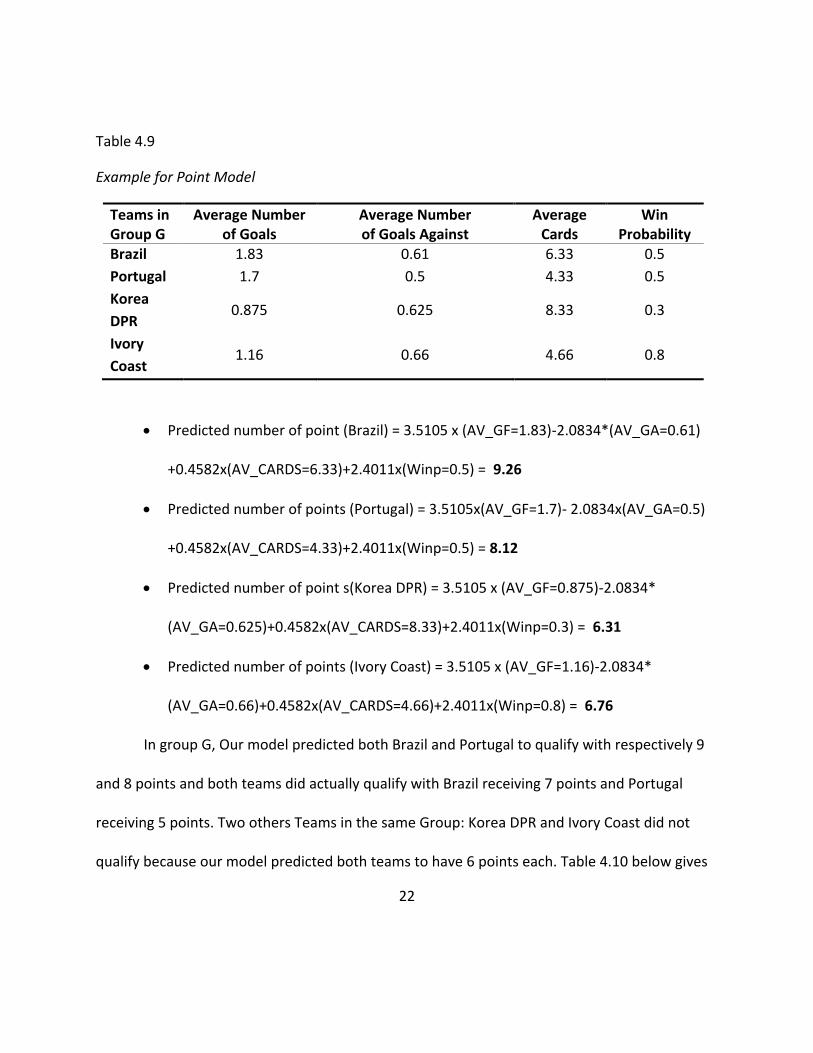
Example for Point Model
Teams in Group G
Average Number of Goals
Average Number of Goals Against
Average Cards
Win Probability
Brazil 1.83 0.61 6.33 0.5
Portugal 1.7 0.5 4.33 0.5
Korea
DPR 0.875 0.625 8.33 0.3
Ivory
Coast 1.16 0.66 4.66 0.8
Predicted number of point (Brazil) = 3.5105 x (AV_GF=1.83)-2.0834*(AV_GA=0.61)
+0.4582x(AV_CARDS=6.33)+2.4011x(Winp=0.5) = 9.26
Predicted number of points (Portugal) = 3.5105x(AV_GF=1.7)- 2.0834x(AV_GA=0.5)
+0.4582x(AV_CARDS=4.33)+2.4011x(Winp=0.5) = 8.12
Predicted number of point s(Korea DPR) = 3.5105 x (AV_GF=0.875)-2.0834*
(AV_GA=0.625)+0.4582x(AV_CARDS=8.33)+2.4011x(Winp=0.3) = 6.31
Predicted number of points (Ivory Coast) = 3.5105 x (AV_GF=1.16)-2.0834*
(AV_GA=0.66)+0.4582x(AV_CARDS=4.66)+2.4011x(Winp=0.8) = 6.76
In group G, Our model predicted both Brazil and Portugal to qualify with respectively 9
and 8 points and both teams did actually qualify with Brazil receiving 7 points and Portugal
receiving 5 points. Two others Teams in the same Group: Korea DPR and Ivory Coast did not
qualify because our model predicted both teams to have 6 points each. Table 4.10 below gives
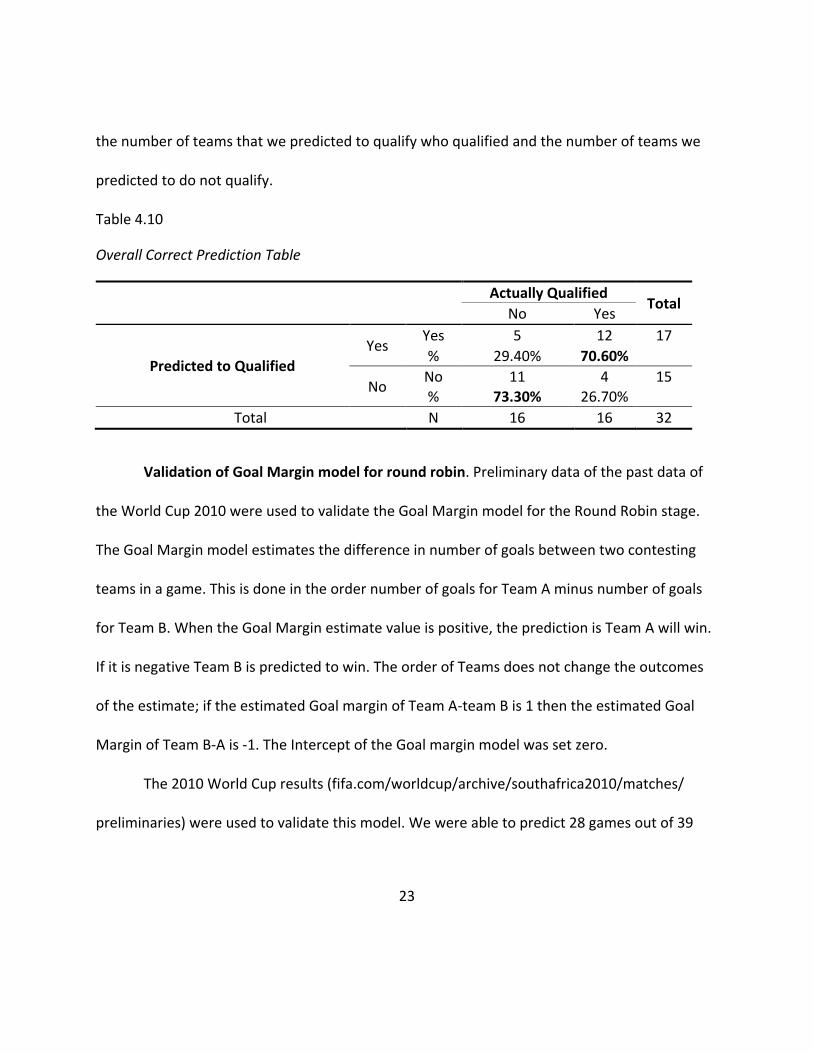
23
the number of teams that we predicted to qualify who qualified and the number of teams we
predicted to do not qualify.
Table 4.10
Overall Correct Prediction Table
Actually Qualified
Total No Yes
Predicted to Qualified
Yes Yes 5 12 17
% 29.40% 70.60%
No No 11 4 15 % 73.30% 26.70%
Total N 16 16 32
Validation of Goal Margin model for round robin. Preliminary data of the past data of
the World Cup 2010 were used to validate the Goal Margin model for the Round Robin stage.
The Goal Margin model estimates the difference in number of goals between two contesting
teams in a game. This is done in the order number of goals for Team A minus number of goals
for Team B. When the Goal Margin estimate value is positive, the prediction is Team A will win.
If it is negative Team B is predicted to win. The order of Teams does not change the outcomes
of the estimate; if the estimated Goal margin of Team A-team B is 1 then the estimated Goal
Margin of Team B-A is -1. The Intercept of the Goal margin model was set zero.
The 2010 World Cup results (fifa.com/worldcup/archive/southafrica2010/matches/
preliminaries) were used to validate this model. We were able to predict 28 games out of 39

24
games right (71%); If our model gave us a value between -0.05 and +0.05 we predicted a draw.
Table 4.11 below shows our 2010 validation results.
Table 4.11
Result from the Goal Margin Model
Ave
GFd
IFF
Ave
GA
dif
f
Esti
mat
ed
Go
al
Mar
gin
(A-B
)
Pre
dic
ted
Team
to
Win
Act
ual
Te
am
wh
ich
Wo
n
Group A
South Africa vs Mexico -0.8 -0.2 -0.41 Mexico Draw
Uruguay vs France -0.25 0.21 -0.35 France Draw
South Africa vs Uruguay -0.55 -0.1 -0.3 Uruguay Uruguay
France vs Mexico 0 -0.3 0.25 France Mexico
Mexico vs Uruguay 0.25 -0.1 0.25 Mexico Uruguay
France vs South Africa 0.8 -0.1 0.66 France South Africa
Group B
Nigeria vs Argentina 0.23 -0.5 0.54 Nigeria Argentina
Korea Republic vs Greece -0.5 -0.5 0.06 Korea Republic Korea Republic
Nigeria vs Greece -0.5 -0.3 -0.08 Greece Greece
Korea Republic vs Argentina 0.23 -0.6 0.67 Korea Republic Argentina
Korea Republic vs Nigeria 0 -0.2 0.13 Korea Republic Draw
Argentina vs Greece 0.73 0.11 0.43 Argentina Argentina
Group C
England vs USA 1.5 -0.7 1.66 England Draw
Algeria vs Slovenia -0.7 -0.3 -0.22 Slovenia Slovenia
Slovenia vs USA 0.3 0.3 -0.03 Draw Draw
England vs Algeria 1.9 -0.1 1.41 England Draw
Slovenia vs England -1.2 0.4 -1.19 England England
USA vs Algeria 0.4 0.7 -0.29 Algeria USA
Group D
Germany vs Australia 1.1 -0.4 1.1 Germany Germany
Serbia vs Ghana 0.7 0.3 0.25 Serbia Ghana
Germany vs Serbia 0.4 -0.3 0.54 Germany Serbia
Ghana vs Australia 0 0.38 -0.31 Australia Draw
Ghana vs Germany -1.1 0 -0.79 Germany Germany
Australia vs Serbia -1.1 -0.7 -0.23 Serbia Australia
Group E
Netherlands vs Denmark 0.525 -0.3 0.59 Netherlands Netherlands
Japan vs Cameroon -0.125 -1.3 1.02 Japan Japan
Netherlands vs Japan 0.75 -1.7 1.92 Netherlands Netherlands
Cameroon vs Denmark -0.17 -0.2 0.02 Draw Denmark
25
Ave
GFd
IFF
Ave
GA
dif
f
Esti
mat
ed
Go
al
Mar
gin
(A-B
)
Pre
dic
ted
Team
to
Win
Act
ual
Te
am
wh
ich
Wo
n
Denmark vs Japan 0.225 -0.2 0.35 Denmark Japan
Cameroon vs Netherlands -0.71 0.08 -0.58 Netherlands Netherlands
Group F
Italy vs Paraguay 0.47 -1.3 1.44 Italy Draw
New Zealand vs Slovakia -1 -0.1 -0.62 Slovakia Draw
Slovakia vs Paraguay 0.33 0.17 0.1 Slovakia Paraguay
Italy vs New Zealand -0.53 0 -0.38 New Zealand Draw
Slovakia vs Italy 0.2 0.3 -0.11 Italy Slovakia
Paraguay vs New Zealand -1 0 -0.72 New Zealand Draw
Group G
Ivory Coast vs Portugal -0.54 0.16 -0.52 Portugal Draw
Brazil vs Korea DPR 0.99 -0 0.72 Brazil Brazil
Brazil vs Ivory Coast 0.67 -0.1 0.52 Brazil Brazil
Portugal vs Korea DPR 0.825 -0.1 0.7 Portugal Portugal
Portugal vs Brazil -0.13 -0.1 0 Draw Brazil
Korea DPR vs Ivory Coast -0.285 -0 -0.18 Ivory coast Ivory Coast
Group H
Honduras vs Chile -1.3 1 -1.77 Chile Chile
Spain vs Switzerland 1 -0.3 0.97 Spain Switzerland
Chile vs Switzerland 0.2 -1.8 1.64 Chile Switzerland
Spain vs Honduras 2.1 -0.6 2.01 Spain Spain
Chile vs Spain -0.8 0.5 -0.99 Spain Spain
Switzerland vs Honduras 1.1 -0.3 1.04 Switzerland Draw
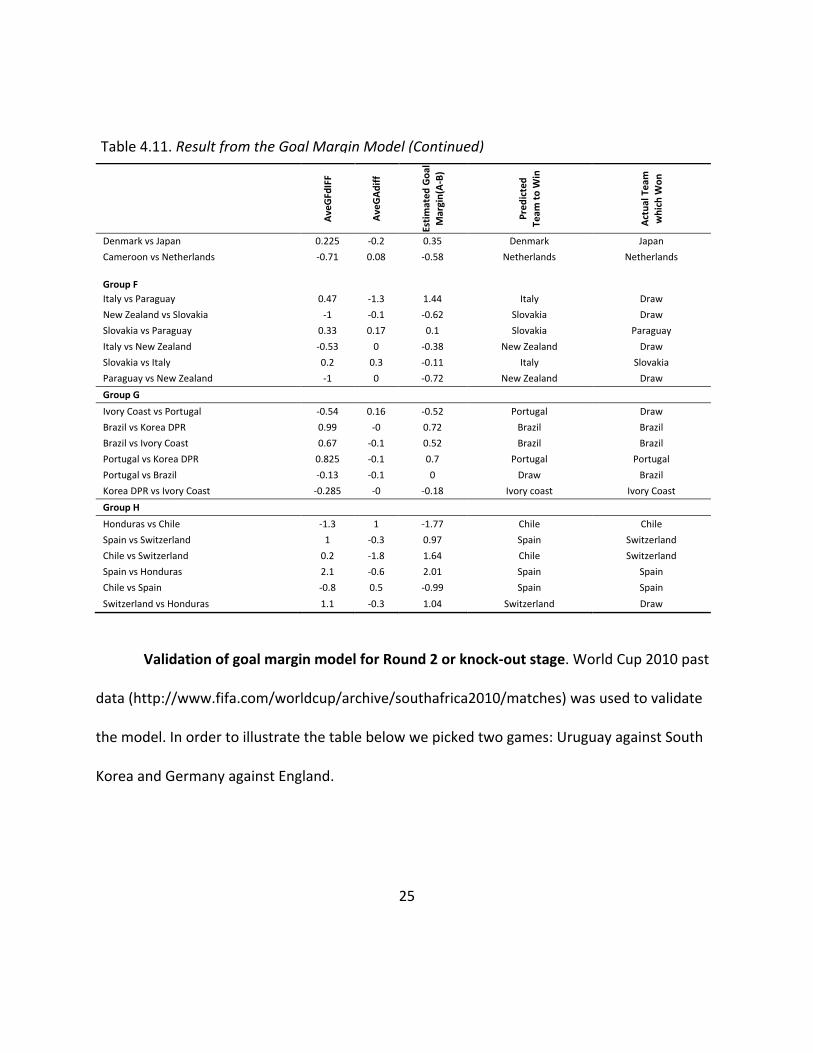
Validation of goal margin model for Round 2 or knock-out stage. World Cup 2010 past
data (http://www.fifa.com/worldcup/archive/southafrica2010/matches) was used to validate
the model. In order to illustrate the table below we picked two games: Uruguay against South
Korea and Germany against England.
Table 4.11. Result from the Goal Margin Model (Continued)
26
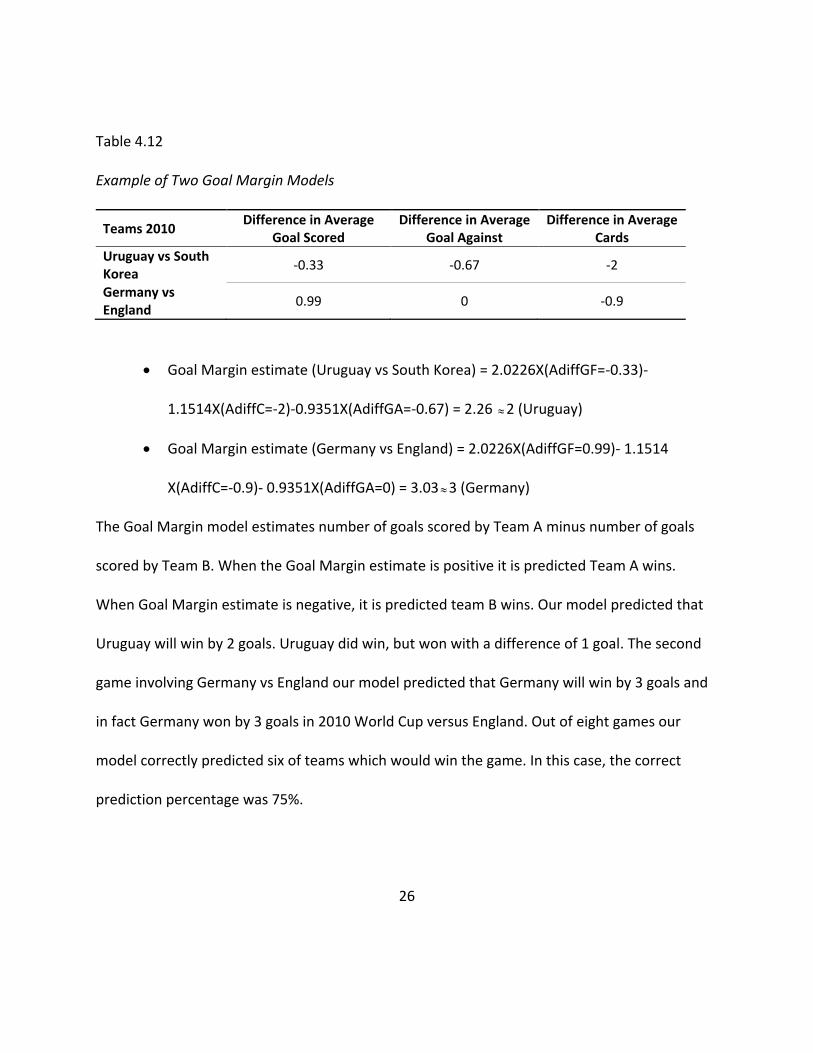
Table 4.12
Example of Two Goal Margin Models
Teams 2010 Difference in Average
Goal Scored Difference in Average
Goal Against Difference in Average
Cards
Uruguay vs South Korea
-0.33 -0.67 -2
Germany vs England
0.99 0 -0.9
Goal Margin estimate (Uruguay vs South Korea) = 2.0226X(AdiffGF=-0.33)-
1.1514X(AdiffC=-2)-0.9351X(AdiffGA=-0.67) = 2.26 2 (Uruguay)
Goal Margin estimate (Germany vs England) = 2.0226X(AdiffGF=0.99)- 1.1514
X(AdiffC=-0.9)- 0.9351X(AdiffGA=0) = 3.033 (Germany)
The Goal Margin model estimates number of goals scored by Team A minus number of goals
scored by Team B. When the Goal Margin estimate is positive it is predicted Team A wins.
When Goal Margin estimate is negative, it is predicted team B wins. Our model predicted that
Uruguay will win by 2 goals. Uruguay did win, but won with a difference of 1 goal. The second
game involving Germany vs England our model predicted that Germany will win by 3 goals and
in fact Germany won by 3 goals in 2010 World Cup versus England. Out of eight games our
model correctly predicted six of teams which would win the game. In this case, the correct
prediction percentage was 75%.

27
Table 4.13
2010 Results from the Goal Margin Model
Team
A v
s B
20
10
Go
al A
Go
al B
Act
ual
Go
al
Mar
gin
(A-B
)
Esti
mat
e G
oal
Mar
gin
Pre
dic
ted
Te
am t
o
Win
Act
ual
Te
am
wh
ich
Wo
n
AD
iffG
F
AD
iffG
A
AD
iffC
ard
s
Uruguay vs South Korea
2 1 1 2.26 Uruguay Uruguay -0.33 -0.67 -2
United States vs Ghana
1 2 -1 0.94 United States Ghana 0.67 0.02 0.34
Nethelands vs Slovania
2 1 1 1.38 Netherlands Netherlands 0.33 -1.165 0.33
Brazil vs Chile 3 0 3 1.6 Brazil Brazil 0.66 -0.49 0.17
Argentina vs Mexico
3 1 2 2.91 Argentina Argentina 1.33 -1.0833 0.69
Germany vs England
4 1 3 3.04 Germany Germany 0.99 0 -0.9
Paraguay vs Japan 5 3 2 0.3 Paraguay Paraguay 0.33 0.8 -0.327
Spain vs Portugal 1 0 1 -3.01 Portugal Spain -1 0.247 0.66
Validation of logistic regression for Round 2. In order to test our above model, we used
data from 2010 World Cup (fifa.com) by estimating our probability of a team advancing to the
next stage. If the estimated probability of a given team winning the game was more than 0.5
our model had the team advancing to the next round. To illustrate the validation process, we
will consider the 2010 World Cup game between Uruguay and South Korea. The equation we
developed for estimating the probability that a given team will win the Soccer game is given
below and also Data from this game is given in Table 4.14

28
y
1( )
1p win
e
where ŷ= 1.2135xAdiffGF-2.5469xAdiffGA-0.6724*AdiffCards
Table 4.14
Example of Two Matches for Logistic Regression Round 2
Teams 2010 Difference in
Average Goal
Scored
Difference in
Average Goal
Against
Difference in
Average Cards
Uruguay vs South
Korea -0.33 -0.67 -2
P (Uruguay) =
P (South Korea) =
Uruguay did win the game.
Since the estimated probability that Uruguay will win the game is greater than 0.5, our
model is predicting Uruguay to be the winner and Uruguay did win the game. All of the results
for this round are given in Table 4.15.
1+ exp (-1.235x-0.33+2.5469x-0.67+0.6724x-2)
1
1+ exp (-1.235x0.33+2.5469x0.67+0.6724x-
1)
= 0.06
1 = 0.93

29
Table 4.15
2010 Validation Results from the Logistic Regression
Team
A v
s
B 2
01
0
AD
iffC
ard
s
AD
iffG
A
AD
iffG
F
Esti
mat
ed
P
rob
abili
ty
of
Win
nin
g
Team
A
Esti
mat
ed
Pro
bab
ility
of
Team
B
Pre
dic
ted
to
A
dva
nce
d
Act
ual
Team
wh
ich
W
on
Uruguay vs South Korea
-2 -0.67 -0.33 0.93 0.06 Uruguay Uruguay
United States vs Ghana
0.34 0.02 0.67 0.63 0.37 United States
Ghana
Nethelands vs Slovania
0.33 -1.165 0.33 0.96 0.04 Netherlands Netherlands
Brazil vs Chile 0.17 -0.49 0.66 0.87 0.13 Brazil Brazil
Argentina vs Mexico
0.69 -
1.0833 1.33 0.98 0.01 Argentina Argentina
Germany vs England
-0.9 0 0.99 0.86 0.14 Germany Germany
Paraguay vs Japan
-0.327 0.8 0.33 0.19 0.8 Japan Paraguay
Spain vs Portugal
0.66 0.247 -1 0.09 0.91 Portugal Spain
Our model correctly predicted 5 out of 8 games for an overall 63% correct prediction rate.
Validation of goal margin model for Rounds 3-5. We used the past data of the World
Cup 2010 (fifa.com) to validate our Goal Margin model for Rounds 3-5. We correctly predicted 5

30
out of 7 games for a 71% correct prediction rate. Table 4.16 gives values of the significant
variables needed for the equation for two games. One game is between Uruguay and Ghana
and another game is between Argentina and Germany.
Table 4.16.
Example of Two Matches for Goal Margin Model
Teams A-2010
Teams B-2010
Average Goal For Team A
Average Goal For Team B
Difference Average GF
Average Goal Against A
Average Goal Against B
Difference Average GA
Estimated Goal Margin
Predicted Team to win
Uruguay Ghana 1.5 1 0.5 0.25 0.75 -0.5 0.85555 Uruguay
Argentina Germany 2.5 2.75 -0.25 0.5 0.5 0 -0.251675 Germany
Estimated Goal Margin (Uruguay vs Ghana) = 1.0067x(AdiffGF=0.5)-0.7044x
(AdiffGA=-0.5)=0.86 (Uruguay)
Estimated Goal Margin (Argentina vs Germany) = 1.0067x(AdiffGF=-0.25)-0.7044x
(AdiffGA=0)=-0.25 (Germany)

31
Table 4.17.
Validation from Goal Margin
Ro
un
ds
Team
s A
vs
B
20
10
Ad
iffG
f
Ad
iffG
A
Ad
iffC
ard
s
Esti
mat
ed
pro
bab
ility
of
Win
nin
g Te
am A
Esti
mat
ed
pro
bab
ility
of
Win
nin
g Te
am B
Pre
dic
ted
to
ad
van
ced
Act
ual
Te
am
wh
o w
on
3 Uruguay vs
Ghana 0.5 -0.5 -0.5 0.8 0.2 Uruguay Uruguay
3 Netherlands vs
Brazil 0.25 0 -1 0.65 0.35 Netherlands Netherlands
3 Argentina vs
Germany -0.25 0 -2.25 0.67 0.33 Argentina Germany
3 Paraguay vs
Spain -0.5 0.5 0.25 0.21 0.78 Spain Spain
4 Uruguay vs
Netherlands -0.75 0.25 0.5 0.23 0.73 Netherlands Netherlands
4 Germany vs
Spain 1.5 0 3 0.49 0.51 Spain Spain
5 Netherlands vs
Spain 1 0 0.25 0.66 0.33 Netherlands Spain
Validation of logistic regression for Round 3-5. We used past data of 2010 World Cup
data up to present Round in order to validate our model. Table 4.19 gives the values of the
variables found to be significant in the model for estimating the probability of a team winning
the game; if the estimated probability of a given team winning the game was more than 0.5 our
model had the team advancing to the next round. To illustrate the validation process, we will
consider the 2010 World Cup game between Netherlands and Brazil. The equation we
developed for estimating the probability that a given team will win the Soccer game is given

32
below and also Data from this game is given in Table 4.18. We correctly predicted 5 out of 7
games for 71 % correct prediction rate (Table 4.19).
Table 4.18.
Example of Logistic Regression for Rounds 3-5
Ro
un
ds
Team
s A
vs B
20
10
Avera
ge G
oal
for
Te
am
A
Avera
ge G
oal
for
Te
am
B
Ad
iffG
F
Avera
ge G
oal
Ag
ain
st
Team
A
Avera
ge G
oal
Ag
ain
st
Team
B
Ad
iffG
A
Avera
ge C
ard
s
Team
A
Avera
ge C
ard
s
Team
B
Ad
iffc
ard
s
3 Netherlands vs
Brazil 2.25 2 0.25 0.25 0.25 0 3.5 4.5 -1
P (Netherlands) =
P(Brazil) =
The Netherlands did win the game
1+ exp(-0.7813x0.25+1.5953x0+0.406x-1)
)
1 = 0.65
1
1+ exp(-0.7813x-0.25+1.5953x0+0.406x1)
= 0.35

33
Table 4.19
Validation for Logistic Regression for Rounds 3-5
Ro
un
ds
Team
s A
vs
B 2
01
0
Ad
iffG
f
Ad
iffG
A
Ad
iffC
ard
s
Esti
mat
ed p
rob
abili
ty
of
Win
nin
g Te
am A
Esti
mat
ed p
rob
abili
ty
of
Win
nin
g Te
am B
Pre
dic
ted
to
ad
van
ced
Act
ual
Te
am w
ho
w
on
3 Uruguay vs Ghana
0.5 -0.5 -0.5 0.8 0.2 Uruguay Uruguay
3 Netherlands vs Brazil
0.25 0 -1 0.65 0.35 Netherlands Netherlands
3 Argentina vs Germany
-0.25 0 -2.25 0.67 0.33 Argentina Germany
3 Paraguay vs Spain
-0.5 0.5 0.25 0.21 0.78 Spain Spain
4 Uruguay vs Netherlands
-0.75 0.25 0.5 0.23 0.73 Netherlands Netherlands
4 Germany vs Spain
1.5 0 3 0.49 0.51 Spain Spain
5 Netherlands vs Spain
1 0 0.25 0.66 0.33 Netherlands Spain
Phase 3: Models Prediction
Actual prediction of the Point model (Round 1). We predicted the number of points per
groups during the 2014 Brazil World Cup Round Robin. In Group A of the 2014 World Cup our
model predicted that Brazil and Mexico will qualify with respectively 12 and 10 points while
Cameroon and Croatia will not qualify with respectively 6 and 4 points.

34
Table 4.20
Example of Actual Prediction of Teams Who Qualify in Group A
Predicted number of point s(Brazil) = 3.5105x(AV_GF=3)-2.0834x(AV_GA=0.4)
+0.4582x(AV_CARDS=1.6)+2.41011x( Win Probability =0.9) = 12.60
Predicted number of points (Mexico) = 3.5105x(AV_GF=2.5)- 2.0834x(AV_GA=0.66) +
0.4582x(AV_CARDS=2)+ 2.41011 x(Win Probability=0.66)= 10.72
Table 4.21
Example of Actual Prediction of Teams Who Did Not Qualify in Group A
Teams Average Number of Goals
Average Number of Goals Against
Average Cards Win Probability
Croatia 1.2 0.9 2.6 0.5
Cameroon 1.33 0.5 2.16 0.66
Predicted number of points (Croatia) = 3.5105x(AV_GF=1.2)-2.0834x
(AV_GA=0.90)+0.4582x(AV_CARDS=2.6)+2.41011x(Win Probability=0.5) = 4.73
Predicted number of points (Cameroon) = 3.5105*(AV_GF=1.33)- 2.0834x
(AV_GA=0.5)+ 0.4582 x(AV_CARDS=2.16)+2.41011*(Win Probability=0.66) = 6.20
Teams Average Number of Goals Average Number of Goals
Against Average Cards
Win Probability
Brazil 3 0.4 1.6 0.9
Mexico 2.5 0.66 2 0.66

35
In group F, we predicted that Argentina and Bosnia-Herzegovina to advance to the next
stage while Iran and Nigeria were predicted to do not advance to the next stage. Table 4.22 and
Table 4.23 illustrate the example.
Table 4.22
Example of Actual Prediction of Teams Who Qualified in Group F
Teams 2 Average Number of
Goals Average Number of Goals
Against Average
Cards Win
Probability Argentina 2.18 0.93 1.973 0.56 Bosnia-Herzegovina
3 0.6 0.9 0.8
Predicted number of points(Argentina) = 3.5105x(AV_GF=2.18)-2.0834x
(AV_GA=0.93)+0.4582x(AV_CARDS=1.973)+2.41011x(Win Probability=0.56) = 7.96
Predicted number of points (Bosnia-Herzegovina) = 3.5105*(AV_GF=3)- 2.0834x
(AV_GA=0.6)+ 0.4582 x(AV_CARDS=0.9)+2.41011*(Win Probability=0.8) = 11.62
Table 4.23
Example of Actual Prediction of Teams Who Did Not Qualify in Group F
Team Average Number of
Goals Average Number of Goals
Against Average
Cards Win Probability
Iran 1 0.25 0.33 0.625
Nigeria 1.16 0.5 1.5 0.5
Predicted number of point (Iran) = 3.5105x(AV_GF=1)-2.0834x(AV_GA=0.25)
+0.4582x(AV_CARDS=0.33)+2.41011x(Win Probability=0.625) = 4.64

36
Predicted number of point (Nigeria) = 3.5105*(AV_GF=1.16)- 2.0834x (AV_GA=0.5)+
0.4582 x(AV_CARDS=1.5)+2.41011*(Win Probability=0.5) = 4.92
Table 4.24
Results for Point Model 2014
Team
s 2
01
4
Pre
dic
ted
nu
mb
er
of
po
ints
Act
ual
nu
mb
er
of
po
ints
Pre
dic
ted
to
Qu
alif
y Y
/N
Act
ual
ly
Qu
alif
ied
Y/N
AV
_GF
AV
_GA
AV
_CA
RD
S
Win
p
Group A
Brazil 12.6 7 Y Y 3 0.4 1.6 0.9
Croatia 4.73 3 N N 1.2 0.9 2.6 0.5
Mexico 10.73 7 Y Y 2.5 0.66 2 1
Cameroon 6.21 0 N N 1.33 0.5 2.16 0.66
Group B
Spain 7.54 3 Y N 1.75 0.375 0.8 0.75
Netherlands 13.89 9 Y Y 3.4 0.5 1.8 0.9
Chile 5.45 6 N Y 1.81 1.56 2.18 0.56
Australia 5.87 0 N N 1.5 0.875 3.33 0.375
Group C
Colombia 10.16 9 Y Y 2.5 0.83 3.33 0.66
Greece 8.09 4 Y Y 2 0.625 1.5 0.7
Ivory Coast 6.63 3 N N 1.68 0.81 2.33 0.56
Japan 8.09 1 N N 2 0.625 1.5 0.7
Group D Uruguay
4.46
6
N
Y
1.56
1.56
2.62
0.43
Costa Rica 6.85 7 Y Y 1.3 0.7 5.53 0.5
England 12.14 1 Y N 3.1 0.4 1.4 0.6
Italy 6.84 3 N N 1.9 0.9 1.3 0.6
Group E
Switzerland 7.32 6 Y Y 1.7 0.6 2 0.7
Ecuador 4.34 4 N N 1.25 1 2.1875 0.43
France 7.39 7 Y Y 1.875 0.75 1.7 0.66
Honduras 4.7 0 N N 1.3 1.2 3.66 0.4
Group F
Argentina 7.97 9 Y Y 2.18 0.93 1.973 0.56
Bosnia 11.62 3 Y N 3 0.6 0.9 0.8
Iran 4.65 1 N N 1 0.25 0.33 0.625

37
Table 4.24 Results for Point Model 2014 (Continued)
Table 4.24 Results for Point Model 2014 (Continued)
Te
ams
20
14
Pre
dic
ted
nu
mb
er
of
po
ints
Act
ual
nu
mb
er
of
po
ints
Pre
dic
ted
to
Qu
alif
y Y
/N
Act
ual
ly
Qu
alif
ied
Y/N
AV
_GF
AV
_GA
AV
_CA
RD
S
Win
p
Nigeria 4.92 4 N Y 1.16 0.5 1.5 0.5
Group G
Germany 13.46 7 Y Y 3.6 1 1.6 0.9
Portugal 7.51 4 N N 2 0.9 2 0.6
Ghana 12.57 1 Y N 3 0.5 2.33 0.833
USA 7.81 4 N Y 1.83 0.83 4.167 0.5
Group H
Belgium 7.96 9 N Y 1.8 0.4 1.2 0.8
Algeria 9.31 4 Y Y 2.16 0.66 2.4 0.83
Russia 8.17 2 Y N 2 0.5 1.1 0.7
Korea Rep. 6.53 1 N N 1.625 0.875 3.16 0.5
The prediction of our point model allowed us to have an overall correct prediction of 22
games out of 32 or 70% (Table 4.24).
Actual prediction 2014 for the Goal Margin model. After validation of our Goal Margin
model above; we used the model to predict the winner of each of the 48 games during the
Round Robin stage for the 2014 World Cup. Table 4.27 below illustrates the predicted results of
2014 Round Robin stage. We were able to predict 28 games out of 37 games right (76%) by
omitting 11 draws out of 48 games. In order to illustrate how the Goal Margin model works, we
estimated the goal margin for the game between Spain and the Netherlands (Group B) and for
the game between Germany and Portugal (Group G) as follows:

38
Table 4.25
Example of a Goal Margin Model
Teams Difference in Average Goal
For Difference in Average Goal
Against
Spain vs Netherlands -1.65 -0.125
Estimate Goal Margin (Spain vs Netherlands) = 0.711843x(AveGFdiff=-1.65)-
0.83187*(AveGAdiff=-0.125) =-1.08 so we predicted Netherlands to win by 1 goal
Table 4.26
Example of a Goal Margin Model
Teams Difference in Average Goal
For
Difference in Average Goal
Against
Germany vs Portugal 1.6 0.09
Estimate Goal Margin (Germany vs Portugal) = 0.711843x (AveGFdiff=1.6)-0.83187x
(AveGAdiff=0.090) = 1.07 so we predicted Germany to win by 1 goal.

39
Table 4.27
2014 Results from Goal Margin Model Round Robin Te
am A
vs
B
20
14
Ave
GFd
iff
Ave
GA
dif
f
Esti
mat
ed
Go
al
Mar
gin
(A-B
)
Pre
dic
ted
Team
to
Win
Act
ual
ly T
eam
wh
o w
in
Group A
Brazil vs Croatia 1.8 -0.5 1.71 Brazil Brazil
Mexico vs Cameroon 1.17 0.16 0.71 Mexico Mexico
Brazil vs Mexico 0.5 -0.4 0.69 Brazil Draw
Cameroon vs Croatia 0.13 -0.4 0.43 Cameroon Croatia
Cameroon vs Brazil -1.7 0.1 -1.3 Brazil Brazil
Croatia vs Mexico -1.3 0.24 -1.13 Mexico Mexico
Group B
Chile vs Australia 0.31 0.685 -0.35 Australia Chile
Spain vs Netherland -1.65 -0.125 -1.08 Netherlands Netherland
Australia vs Netherland -1.9 0.375 -1.68 Netherlands Netherland
Spain vs Chile -0.06 -1.185 0.94 Spain Chile
Australia vs Spain -0.25 0.5 -0.6 Spain Spain
Netherland vs Chile 1.59 -1.56 2.44 Netherlands Netherland
Group C
Colombia vs Greece 0.5 0.205 0.19 Colombia Colombia
Japan vs Ivory Coast 0.32 -0.185 0.38 Japan Ivory Coast
Ivory Coast vs Colombia -0.82 -0.02 -0.57 Colombia Colombia
Japan vs Greece 0 0 0 Draw Draw
Colombia vs Japan 0.5 0.205 0.19 Colombia Colombia
Greece vs Ivory Coast 0.32 -0.185 0.38 Greece Greece
Group D
Uruguay vs Costa Rica 0.26 0.86 -0.53 Costa Rica Costa Rica
England vs Italy 1.2 -0.6 1.36 Italy Italy
Italy vs Costa Rica 0.6 0.2 0.26 Italy Costa Rica
Uruguay vs England -1.54 1.16 -2.07 England Uruguay
Costa Rica vs England -1.8 0.3 -1.54 England Draw
Italy vs Costa Rica 0.6 0.2 0.26 Italy Costa Rica
Group E
Switzerland vs Ecuador 0.45 -0.4 0.66 Switzerland Switzerland
France vs Honduras 0.625 0.25 0.24 France France
Honduras vs Ecuador 0.05 0.2 -0.13 Ecuador Ecuador

40
Table 4.27. 2014 Results from Goal Margin Model Round Robin (Continued)
Te
am A
vs
B
20
14
Ave
GFd
iff
Ave
GA
dif
f
Esti
mat
ed
Go
al
Mar
gin
(A-B
)
Pre
dic
ted
Team
to
Win
Act
ual
ly T
eam
wh
o w
in
Switzerland vs France -0.175 -0.15 0 Draw France
Honduras vs Switzerland -0.4 0.6 -0.79 Switzerland Switzerland
Ecuador vs France -0.625 0.25 -0.66 France Draw
Group F
Argentina vs Bosnia Herzegovina
-0.82 0.33 -0.86 Bosnia Herzegovina Argentina
Iran vs Nigeria -0.16 -0.2 0.05 Draw Draw
Argentina vs Iran 1.18 0.68 0.28 Argentina Argentina
Nigeria vs Bosnia Herzegovina -0.84 -0.1 -0.52 Bosnia Herzegovina Nigeria
Nigeria vs Argentina 1.02 -0.473 1.13 Nigeria Argentina
Bosnia Herzegovina vs Iran 2 0.35 1.15 Bosnia Herzegovina Bosnia
Herzegovina
Group G
Germany vs Portugal 1.6 0.09 1.07 Germany Germany
Ghana vs USA 1.17 -0.33 1.12 Ghana USA
Germany vs Ghana 0.6 0.5 0.02 Draw Draw
USA vs Portugal -0.17 0.33 -0.4 Portugal Draw
Portugal vs Ghana -1 0.4 -1.05 Ghana Ghana
USA vs Germany -1.77 -0.17 -1.13 Germany Germany
Group H
Belgium vs Algeria -0.36 -0.26 -0.04 Draw Belgium
Russia vs Korea Republic 0.375 -0.375 0.58 Russia Draw
Korea vs Algeria -0.535 1.2 -1.38 Algeria Algeria
Belgium vs Russia -0.2 -0.1 -0.06 Russia Belgium
Algeria vs Russia 0.16 0.16 -0.02 Draw Draw
Korea vs Belgium -0.175 0.475 -0.52 Belgium Belgium
Actual prediction from Round 2 for the Goal Margin model for 2014. We used the
teams that we predicted to advance to Round 2 by the Round Robin point model. We then used
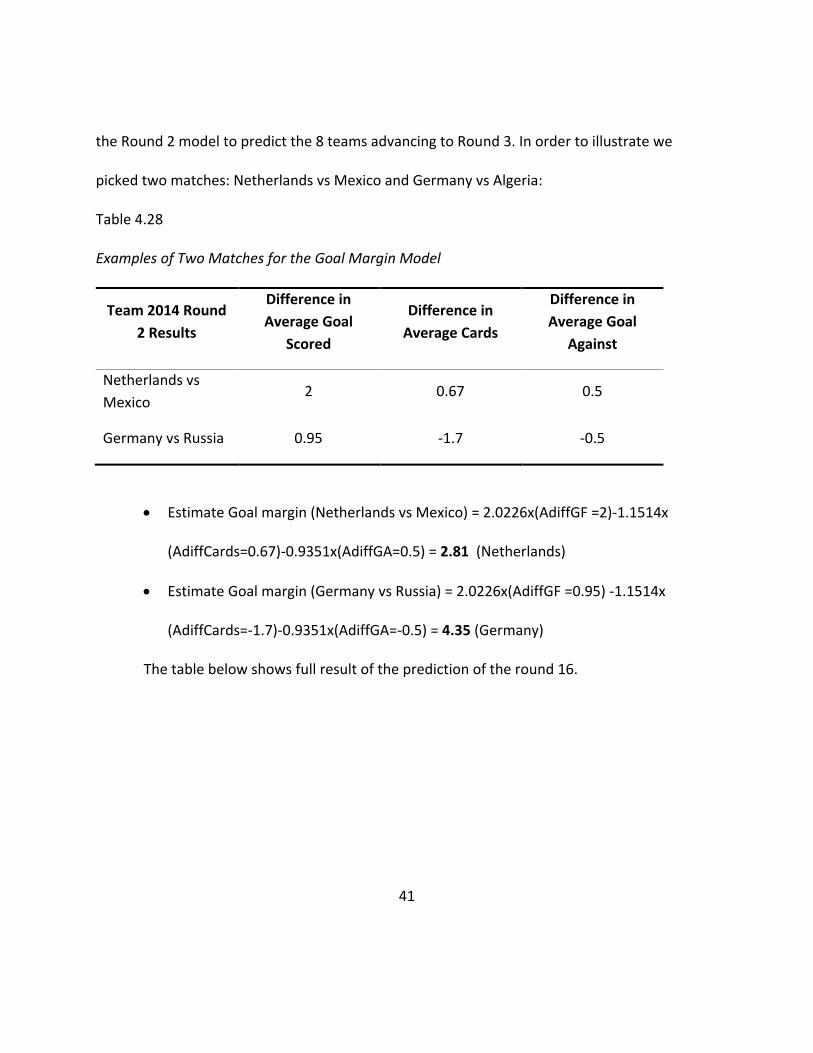
41
the Round 2 model to predict the 8 teams advancing to Round 3. In order to illustrate we
picked two matches: Netherlands vs Mexico and Germany vs Algeria:
Table 4.28
Examples of Two Matches for the Goal Margin Model
Team 2014 Round
2 Results
Difference in
Average Goal
Scored
Difference in
Average Cards
Difference in
Average Goal
Against
Netherlands vs
Mexico 2 0.67 0.5
Germany vs Russia 0.95 -1.7 -0.5
Estimate Goal margin (Netherlands vs Mexico) = 2.0226x(AdiffGF =2)-1.1514x
(AdiffCards=0.67)-0.9351x(AdiffGA=0.5) = 2.81 (Netherlands)
Estimate Goal margin (Germany vs Russia) = 2.0226x(AdiffGF =0.95) -1.1514x
(AdiffCards=-1.7)-0.9351x(AdiffGA=-0.5) = 4.35 (Germany)
The table below shows full result of the prediction of the round 16.

42
Table 4.29
2014 Results from the Goal Margin Model
Team 2014 Round 2 Results
AdiffGF AdiffCards AdiffGA Estimate Goal
Margin Predicted Team
to win Actual Results
Brazil vs Spain 1 -1.67 1 3.01 Brazil Brazil
Netherlands vs Mexico
2 0.67 0.5 2.81 Netherlands Netherlands
Colombia vs Costa Rica
0 1.34 2 -3.41 Costa Rica Costa Rica
England vs Greece
0 -0.67 -2.3 2.92 England X
France vs Argentina
0.33 -0.33 1.67 -0.51 Argentina Argentina
Bosnia vs Switzerland
-1 0.67 -1.4 -1.48 Switzerland X
Germany vs Russia
0.95 -1.7 -0.5 4.35 Germany Germany
Ghana vs Algeria 1.1 -1.9 1 3.48 Ghana X
Out of eight games our Round 2 Goal Margin model correctly predicted five of the
teams which would win the game. In this case, the correct prediction percentage is 63%.
Actual 2014 prediction from Round 2 for Logistic Regression model. Point model was
used to predict the 16 teams making it to Round 2. We used the model above to predict the 8
winning teams of this round. For our analysis we considered the significant independent
variables given in the model: Difference in average Goals Scored between two teams during
Round 1 (AdiffGF), Difference in average Goals Scored against between two teams during

43
Round 1 (AdiffGA), and Difference in average Cards received between two teams during Round
1(AdiffGA) of the past World Cup 2010 (Chapter 3).
Using the model above we predicted which teams are going to advance to the next
stage; again if the estimated probability is greater than 0.5 we are predicting that the team will
go to the next stage; otherwise, the team will go home. To illustrate the prediction process for
this round, we selected a game between Mexico and Netherlands which had been.
Table 4.30
Example of Two Matches for Logistic Regression Round 2
Team 2014 Round 2 Average Goal
For
Average
Cards
Average Goal
Against
Netherlands 4.33 1 1
Mexico 2.33 0.33 0.5
Difference in Averages between
Netherlands and Mexico 2 0.67 0.5
Difference in Averages between
Mexico and Netherlands -2 -0.67 -0.5
P (Netherlands) =
P (Netherlands) =
1+ exp(-1.235x2+2.5469x0.5+0.6724x0.67)
) 1
= 0.67
0.67 1+ exp (-1.235x-2+2.5469x-0.5+0.6724x-
0.67)
)
1
= 0.33
44
The Netherlands did actually win.
Table 4.31
Actual Results from Logistic Regression Model
Team A vs B 2014
AdiffGf AdiffCards AdiffGA
Estimated Probability of Winning
Team A
Estimated Probability of Team B
Predicted to Advanced
Actual Results
Brazil vs Spain
1 -1.67 1 0.448 0.552 Spain x
Netherlands vs Mexico
2 0.67 0.5 0.669 0.331 Netherlands Netherlands
Colombia vs Costa Rica
0 1.34 2 0.002 0.998 Costa Rica Costa Rica
England vs Japan
0 -0.67 -2.3 0.998 0.002 England x
France vs Argentina
0.33 -0.33 1.67 0.026 0.974 Argentina Argentina
Bosnia vs Switzerland
-1 0.67 -1.4 0.87 0.13 Bosnia x
Germany vs Russia
0.95 -1.7 -0.5 0.97 0.03 Germany Germany
Ghana vs Algeria
1.1 -1.9 1 0.52 0.47 Ghana x
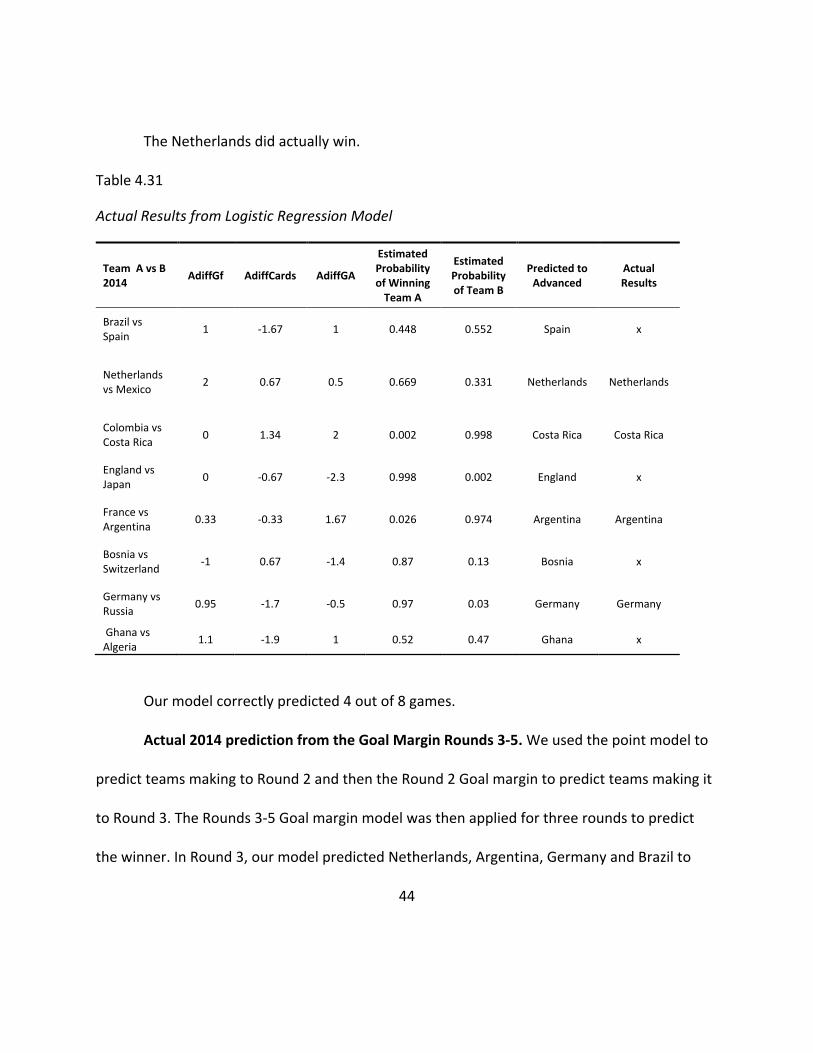
Our model correctly predicted 4 out of 8 games.
Actual 2014 prediction from the Goal Margin Rounds 3-5. We used the point model to
predict teams making to Round 2 and then the Round 2 Goal margin to predict teams making it
to Round 3. The Rounds 3-5 Goal margin model was then applied for three rounds to predict
the winner. In Round 3, our model predicted Netherlands, Argentina, Germany and Brazil to
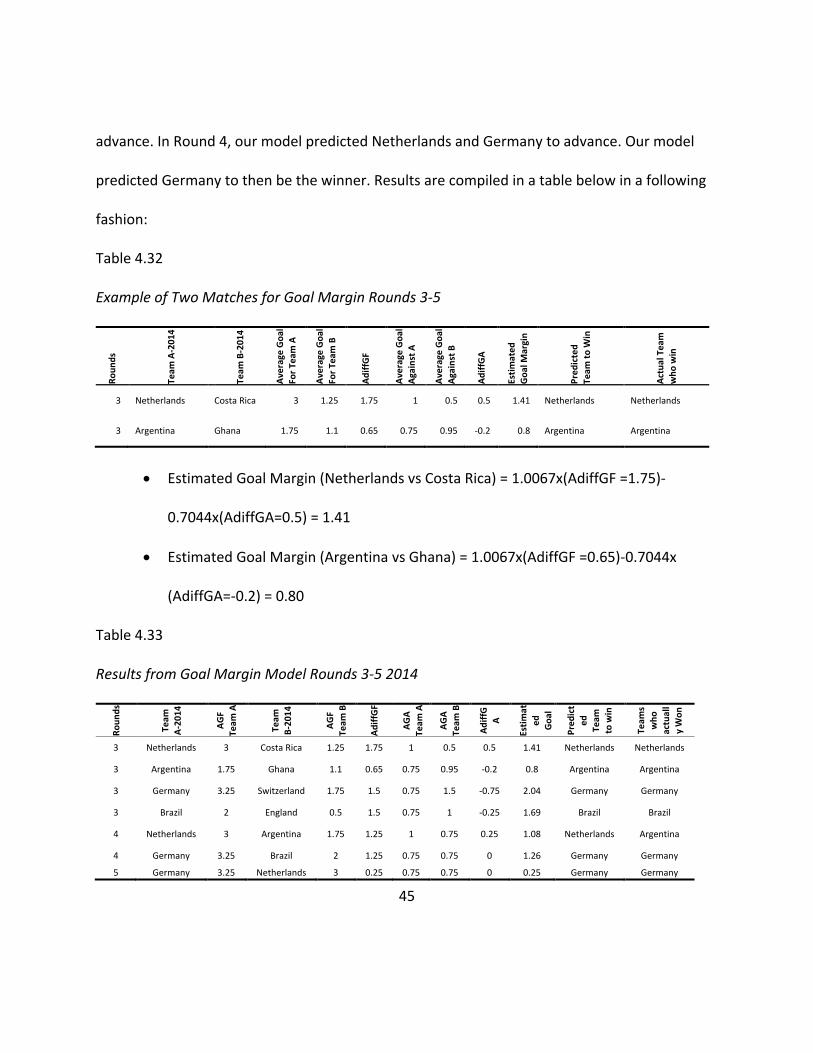
45
advance. In Round 4, our model predicted Netherlands and Germany to advance. Our model
predicted Germany to then be the winner. Results are compiled in a table below in a following
fashion:
Table 4.32
Example of Two Matches for Goal Margin Rounds 3-5
Ro
un
ds
Team
A-2
01
4
Team
B-2
01
4
Ave
rage
Go
al
For
Team
A
Ave
rage
Go
al
For
Team
B
Ad
iffG
F
Ave
rage
Go
al
Aga
inst
A
Ave
rage
Go
al
Aga
inst
B
Ad
iffG
A
Esti
mat
ed
G
oal
Mar
gin
Pre
dic
ted
Team
to
Win
Act
ual
Te
am
wh
o w
in
3 Netherlands Costa Rica 3 1.25 1.75 1 0.5 0.5 1.41 Netherlands Netherlands
3 Argentina Ghana 1.75 1.1 0.65 0.75 0.95 -0.2 0.8 Argentina Argentina
Estimated Goal Margin (Netherlands vs Costa Rica) = 1.0067x(AdiffGF =1.75)-
0.7044x(AdiffGA=0.5) = 1.41
Estimated Goal Margin (Argentina vs Ghana) = 1.0067x(AdiffGF =0.65)-0.7044x
(AdiffGA=-0.2) = 0.80
Table 4.33
Results from Goal Margin Model Rounds 3-5 2014
Ro
un
ds
Team
A
-20
14
AG
F Te
am A
Team
B
-20
14
AG
F
Team
B
Ad
iffG
F
AG
A
Team
A
AG
A
Team
B
Ad
iffG
A
Esti
mat
ed
Go
al
Mar
gin
P
red
ict
ed
Team
to
win
Team
s
wh
o
actu
all
y W
on
3 Netherlands 3 Costa Rica 1.25 1.75 1 0.5 0.5 1.41 Netherlands Netherlands
3 Argentina 1.75 Ghana 1.1 0.65 0.75 0.95 -0.2 0.8 Argentina Argentina
3 Germany 3.25 Switzerland 1.75 1.5 0.75 1.5 -0.75 2.04 Germany Germany
3 Brazil 2 England 0.5 1.5 0.75 1 -0.25 1.69 Brazil Brazil
4 Netherlands 3 Argentina 1.75 1.25 1 0.75 0.25 1.08 Netherlands Argentina
4 Germany 3.25 Brazil 2 1.25 0.75 0.75 0 1.26 Germany Germany
5 Germany 3.25 Netherlands 3 0.25 0.75 0.75 0 0.25 Germany Germany

46
Our Goal Margin model for Round 3-5 predicted 6 out of 7 games for an overall 86%
prediction rate.
Actual 2014 prediction from logistic regression of Rounds 3-5. We used the Round 2
Goal Margin model to predict teams that are making it to Round 3. The Rounds 3-5 Logistic
Regression model will be applied for the 3 rounds to predict the winner; again if the estimated
probability is greater than 0.5 we are predicting that the team will go to the next stage. In
Round 3, our model predicted Netherlands, Argentina, Germany and Brazil to advance. In
Round 4, our model predicted Netherlands and Germany to play the final Round 5 and also
Germany to be the winner of the World Cup 2014.To illustrate we picked two teams in Round 4,
Germany and Brazil. The Logistic equation below was used to compute a probability of winning.
y
1( )
1pwin
e Where, Ŷ= 0.7813*AdiffGF-1.5953*AdiffGA-0.4062*AdiffCards
Table 4.34
Prediction Examples of a Logistic Regression for Rounds 3-5
Ro
un
ds
Team
s A
vs
B
20
14
Ave
rage
Go
al
for
Team
A
Ave
rage
Go
al
for
Team
B
Ad
iffG
F
Ave
rage
Go
al
Aga
inst
Te
am A
Ave
rage
Go
al
Aga
inst
Te
am B
Ad
iffG
A
Ave
rage
Car
ds
Team
A
Ave
rage
Car
ds
Team
B
Ad
iffc
ard
s
4 Germany vs Brazil
3.25 2 1.25 0.67 0.67 0 4.33 4.82 -0.49
P (Germany ) =
1+ exp(-0.7813x1.25+1.5953x0+0.406x-0.49)
)
1 = 0.76

47
P(Brazil) =
Germany did win the game.
Our Logistic Regression model for Round 3-5 predicted 6 out of 7 games for an overall
86% prediction rate.
Table 4.35
Results from Logistic Regression
Ro
un
ds
Team
s A
vs B
2014
Ad
iffG
F
Ad
iffG
A
Ad
iffC
ard
s
Esti
mate
d
pro
bab
ilit
y o
f
Win
nin
g
Team
A
Esti
mate
d
pro
bab
ilit
y o
f
Win
nin
g
Team
B
Pre
dic
ted
to
Ad
van
ce
d
Team
s
wh
o
actu
ally
Wo
n
3 Netherlands
vs Costa Rica
1.75 0.5 -0.34 0.67 0.33 Netherlands Netherlands
3 Argentina vs Ghana
0.65 -0.2 -1.03 0.78 0.22 Argentina Argentina
3 Germany vs Switzerland
1.5 -0.75 -1.29 0.95 0.05 Germany Germany
3 Brazil vs England
1.5 -0.25 0.2 0.82 0.18 Brazil Brazil
4 Netherlands
vs Argentina
1.25 0.25 0.06 0.63 0.37 Netherlands Argentina
4 Germany vs
Brazil 1.25 0 -0.49 0.76 0.24 Germany Germany
5 Germany vs Netherlands
0.5 0 -0.95 0.68 0.32 Germany Germany
1
1+ exp(-0.7813x-1.25+1.5953x0+0.406x0.49)
= 0.24

48
Fisher’s Classification Procedure
We considered the 2006 and the 2010 World cup Round 1 data (www.fifa.com). The
following variables were used: Average Goals Scored by a Team (AGF), Average Goals against
(AGA) and the Average Cards (ACARDS). The homogeneity of the within group of the population
covariance was tested and satisfied with Box ’M test. The variables Average Goals Scored by a
Team (AGF), and Average Goals against (AGA) were found to be the most important factors
contributing to the separations of the two groups; and also the absolute value of standardized
canonical discriminant functions coefficients (Table 4.36) for AGF is slightly greater than the
absolute value of the AGA which lead us to believe that for a Team to advance to the knock-out
stage needs to score more goals while maintaining a strong defense (Table 4.37). A
classification analysis using a cross validation technique correctly grouped qualifies Teams or
not qualifies Teams 81.3 % of the time when considering AGF and AGA. Furthermore, only 22%
of the Teams were classified to advance but did not while 14% were classified as not making it
but actually made to the next stage (Table 4.38).
Table 4.36
Standardized Canonical Discriminant Function Coefficients
Variables Function
Average Goal For (AGF) 0.806
Average Goal Against (AGA) -0.638
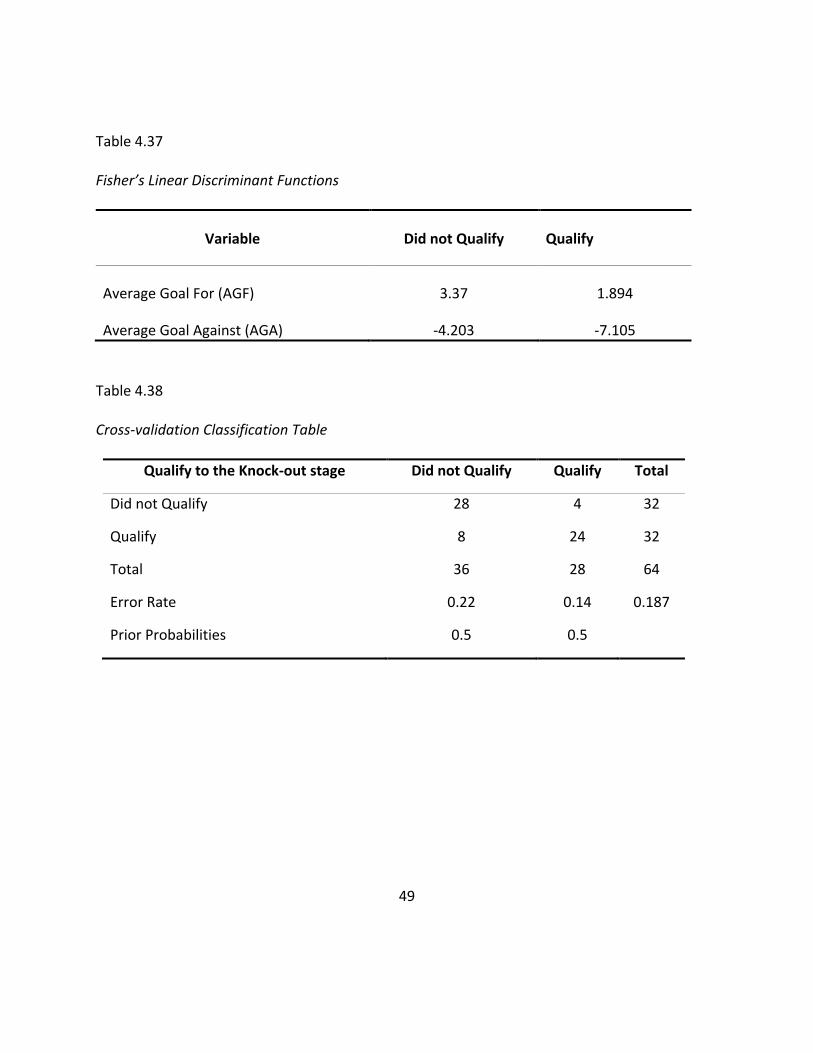
49
Table 4.37
Fisher’s Linear Discriminant Functions
Variable Did not Qualify Qualify
Average Goal For (AGF) 3.37 1.894
Average Goal Against (AGA) -4.203 -7.105
Table 4.38
Cross-validation Classification Table
Qualify to the Knock-out stage Did not Qualify Qualify Total
Did not Qualify 28 4 32
Qualify 8 24 32
Total 36 28 64
Error Rate 0.22 0.14 0.187
Prior Probabilities 0.5 0.5

50
CHAPTER 5. CONCLUSIONS
The purpose of this paper was to establish a statistical approach to predicting the
winner of the World Cup 2014 and future World Cups. In our model development process we
have noticed that Goals scored, Goals against and the Average yellow and red cards received
were usually significant.
Looking further into the results one can see that a successful team needs to have the
ability of scoring goals and being able to maintain a good defense. It appears that defense may
be slightly more important than offense at winning a game in the World Cup. The absolute
value of the estimated coefficient associated with goals against is a little larger than the
estimated coefficient associated with Goals for in the Goal margin model for Round 1 and also
for the Logistic Regression model for Rounds 3-5. A further look into the results have shown
that the Fisher linear function discriminates Teams that qualify to Round 2 by having as much
as twice a stronger defense than Teams who did not qualify; which is leading us to believe that
defense is a key performance indicator for a team to advance to the next stage.
A high winning probability for a team during the preliminary leads a higher chance of a
team doing good during the Round Robin and also a team who has a large winning probability
in Round Robin will more likely outperform on Round 2; it is often said that ball possession
percentage and shot in target are good performance indicators for a winning team; however
some teams such as Brazil, Netherlands fit into this category but did not guarantee a World Cup
51
win lately. In today’s abundance of data Soccer research; we need to focus more into objectives
variables which trigger off a win of a game.
In our prediction process, The Goal Margin Model outperformed the Logistic Regression
Model in Round 2 while maintaining the same prediction rate in Rounds 3-5; it is also important
to note that the Point Model for Round 1 did slightly better than the Goal Margin Model.
Overall, our developed models did well at predicting for 2014 World Cup than the validation
process of 2010 World Cup.
Although Logistic Regression and Point Model seem to be a better performer models in
predicting the winner of the World Cup, the Goal Margin model plays an important role in
determining the exact prediction score of a soccer match which can be helpful for bookmakers
to set bets because Goal Margin has the advantage of predicting the number of Goals in a
Soccer matches.
The use of this paper goes somewhat beyond the prediction aspects; it’s also contains a
strategical utility for coaches, In fact Soccer coaches need to establish a systematic defense
tactics to prevent opposing team to develop an offensive game which consists of developing a
sequence of three passes and more after the ball has crosses the center point according to
Reep and Benjamin (1968).
In our prediction model, 2014 Brazil World Cup winner will be Germany; Germany will
win the final versus Netherlands by 1 goal difference.

52
REFERENCES
Bradley, R. A., & Terry, M. E. (1952). Rank analysis of incomplete block designs I: The method of
paired comparisons. Biometrika, 39, 324-345.
Croucher, J. S. (1984). The effect of changing competition in the English football league.
Teaching Statistics, 6, 39-42.
Karlis, D., & Ntzoufras, J. (2003). Analysis of sports data using bivariate poisson models. The
Statistician, 52, 381-393.
Koning, R. H. (2000). Balance in competition in Dutch soccer. Journal of the Royal Statistical
Society: Series D (The Statistician), 49, 419-431. doi: 10.1111/1467-9884.00244
Magel, R., & Melnykov, Y. (2014, June). Examining influential factors and predicting outcomes in
European soccer games. International Journal of Sports Science, 4(3), 91-96.
McGAarry, T., & Schutz, R. W. (1994). Analysis of the 1986 and 1994 World Cup Soccer
tournament. In ASA Proceedings from the 1994 Joint Statistical Meeting in Toronto,
Statistics in Sports, pp. 61-65.
Moroney, M. J. (1956). Facts from figures (3rd ed.). London: Penguin.
Reep, C., & Benjamin, B. (1968). Skill and chance in association football. Journal of the Royal
Statistical Society, 134, 581-585.
The Official Website of the FIFA World CupTM –FIFA.com. Retrieved March 7, 2014, from
http://www.fifa.com.

53
APPENDIX A. LIST OF VARIABLES
Goal Against
Goal For
Penalty Goal
Matches Played
Cards
Average difference goals scored before World Cup
Average difference goals against before World Cup
Average difference cards before World Cup
Difference total goal scored round 1
Difference total goal against round 1
Difference total cards round 1
Number of game wins in 2006
Average goal scored
Average goal scored against
Average cards
Winning percentage
Total goal scored Round 1
Total goal scored against Round 1
Total goal scored Round 2

54
Total goal scored against Round 2
Total goal scored Round 3
Total goal scored against Round 3
Difference Cards Round 1
Difference Cards Round 2
Difference Cards Round 3

55
APPENDIX B. SAS CODE
proc import datafile="F:\Master_Paper_Data\First_Round_2006_Wc.csv" out=firstround2006 dbms=csv replace; getnames=yes; run; proc print data =firstround2006; Title 'read dataset 2006'; run; data round2006; set firstround2006; if Qualified = 'yes' then Qualified = 1; if qualified = 'no' then Qualified = 0; proc print data = round2006; run; proc logistic data= round2006 descending; title 'Predicting wins using logistic regression'; model Qualified = AvgGF_Game AvgGA_Game Ave_Cards WinP Number_win_2006 / selection = stepwise noint ctable pprob = (0 to 1 by 0.1) lackfit risklimits; run; proc logistic data=round2006 descending outest=betas covout plots=all; title 'new year eve'; model Qualified = AvgGF_Game AvgGA_Game Ave_Cards WinP Number_win_2006 / selection=stepwise details lackfit scale=none noint rsquare; output out=pred p=phat lower=lcl upper=ucl predprob=(individual crossvalidate);

56
run; proc import datafile="F:\Master_Paper_Data\Round_3_WC2006.csv" out=round3_2006 dbms=csv replace; getnames=yes; run; proc print data = round3_2006; Title 'round 3 2006'; run; proc reg data = round3_2006; ; model Y = AdiffGF AdiffGA AdiffCard winA_B Difftotascore number_of__wins DifftotalGoalScore DifftotalGoalAgainst difcard / NOINT cp selection = stepwise ; run; proc import datafile="F:\Master_Paper_Data\Quarter_final_wc_2006_LR.csv" out=quarterfinal2006 dbms=csv replace; getnames=yes; run; proc print data =quarterfinal2006; Title 'read dataset 2006'; run; data QF2006; set quarterfinal2006; if Qualified = 'yes' then Qualified = 1; if qualified = 'no' then Qualified = 0; proc print data = QF2006; run; proc logistic data=QF2006 descending outest=betas covout plots=all; title 'Quarter Final';

57
model Qualified = Goal_Scored GoalS_Against Cards WinP Number_win_2006 / selection=stepwise slentry=0.25 slstay=0.20 details lackfit scale=none noint rsquare; output out=pred p=phat lower=lcl upper=ucl predprob=(individual crossvalidate); run;

58
APPENDIX C. R CODE
mydata = read.csv("F:/Master_Paper_Data/Point_spread_2006.new.csv") # read csv file pointmodel= lm(mydata$points ~ mydata$AvgGoalScored+mydata$AvgGoalagainst+mydata$AvgCards+mydata$Winning_Probability-1) # Assessing Outliers outlierTest(pointmodel) summary(pointmodel) plot(pointmodel) par(mfrow=2) mydata = read.csv("F:/Master_Paper_Data/Point_spread_2006.new.csv") # read csv file mydata2 = read.csv("F:/Master_Paper_Data/goalmargin2006.csv") # read csv file head(mydata2) pointmodel2= lm(mydata2$Y ~ mydata2$AveGFdiff+mydata2$AveGAdiff+mydata2$AveCards+mydata2$winndiff-1) summary(pointmodel2) par(mfrow=2) Round2_LR_WC_2006 <- read.csv ("C:/Users/W703534/Desktop/Master_Paper_Data/MSPAPERSAVED/Round2_LR_WC_2006.csv") mylogit <- glm(Qualified ~ AdiffGF + AdiffGA + AdiffCards , data = mydata, family = "binomial") summary(mylogit) lrtest(mylogit) Round2_LR_WC_2006 <- read.csv("C:/Users/W703534/Desktop/Master_Paper_Data/MSPAPERSAVED/Round2_LR_WC_2006.csv") head(Round2_LR_WC_2006) mydata=Round2_LR_WC_2006 mylogit <- glm(Qualified ~ AdiffGF + AdiffGA + AdiffCards -1, data = mydata, family = "binomial") summary(mylogit) lrtest(mylogit) library(ResourceSelection)
59
hoslem.test(mydata$Qualified, fitted(mylogit2)) R35MODEL2<-lm(R3_5_GM$Goal_Margin ~ R3_5_GM$DIFFTOTALGF+R3_5_GM$DIFFTOTALGA+R3_5_GM$DIFFTOTALCARDS-1) ####### LR_3_5 <- read.csv("F:/LR_3_5.csv") View(LR_3_5) mydata2=LR_3_5 mylogit2 <- glm(Qualified ~ AdiffGF + AdiffGA + AdiffCards , data = mydata2, family = "binomial") summary(mylogit2) hoslem.test(mydata2$Qualified, fitted(mylogit2)) auc(mydata2$Qualified,mydata2$AdiffGF) auc(mydata2$Qualified,mydata2$AdiffGA)

60
APPENDIX D. SPPS CODE
DATASET ACTIVATE DataSet1.
DISCRIMINANT /GROUPS=Q(0 1)/VARIABLES=AGF AGA ACARDS /ANALYSIS ALL/METHOD=WILKS /FIN=3.84/FOUT=2.71/PRIORS EQUAL /HISTORY /STATISTICS=BOXM COEFF TABLE CROSSVALID
/CLASSIFY=NONMISSING POOLED.

61
APPENDIX E. 2006 DATA

Preliminary

63
Gam
e
Go
alM
AR
G
IN
Ave
GFd
iff
Ave
GA
dif
f
Ave
Car
ds
Win
Team
P
r.
Loss
inP
r.
win
p
Germany vs Costa Rica 2 1 -2.1 0 1 0 1
Poland vs Ecuador -2 -0.6 0.3 2.2 0.66 0.33 0.33
Germany vs Poland 1 1.3 -0.4 -3 1 0.33 0.67
Ecuador vs Costa Rica 3 0.3 -2 -0.3 0.66 0 0.66
Costa Rica vs Poland -1 0.3 1.7 0.6 0.33 0 0.33
Ecuador vs Germany -3 -0.7 -0.46 0.5 1 0.66 0.34
England vs Paraguay 1 0.5 0.4 0.56 0.66 0.33 0.33
Trinidad vs Sweden 0 -3 0.63 0.75 0.33 0 0.33
England vs Trinida 2 1.2 -0.93 -2 0.66 0 0.66
Sweden vs Paraguay 0 0.1 0.3 -0.66 0.33 0.33 0
Sweden vs England 0 -0.4 0.6 1.25 0.495 0 0.495
Paraguay Vs Trinida 2 0.7 -0.63 -0.34 0.33 0.33 0
Argentina vs Ivory Coast 1 0.5 -1.4 -1.95 0.66 0.33 0.33
Serbia and Montenegro vs Netherlands
-1 -0.1 2.8 3 0.66 0.66 0
Argentina vs Serbia and Montenegro
6 1.5 -2.7 -3.28 0.66 0 0.66
Netherlands vs Ivory Coast 1 -0.9 -1.5 -1.67 0.66 0.66 0
Netherlands vs Argentina 0 -1.4 -0.1 0.28 0.66 0 0.66
Ivory Coast vs Serbia and Montenegro
1 1 -1.3 -1.33 0.33 0.33 0
Mexico vs Iran 2 0.6 -0.7 0.33 0.33 0 0.33
Angola vs portugal -1 -0.7 0 -1.67 1 0 1
Mexico vs Angola 0 1 0.6 1.244 0.33 0 0.33
Portugal vs Iran 2 0.3 -1.3 0.34 1 0 1
Portugal vs Mexico 1 -0.3 -0.6 0 1 0.33 0.67
Iran vs Angola 0 0.37 1.34 0.244 0 0 0
Italy vs Ghana 2 0.7 -1.2 -0.3 0.66 0.66 0
USA vs Czech Republic -3 -0.3 0.7 -1.93 0 0 0
Italy vs USA 0 1 -1.7 0.9 0.66 0 0.66
Czech Republic vs Ghana -2 0 -0.2 0.73 0.66 0.33 0.33
Czech Republic vs Italy -2 -0.7 1 1.73 0.66 0.33 0.33
Ghana vs USA 1 0.3 -0.5 1.2 0.66 0 0.66
Brazil vs Croatia 1 1.3 -0.6 -0.09 1 0 1
Australia vs Japan 2 0.6 -0.8 0.6333 0.33 0 0.33
Brazil vs Australia 2 0.7 -1.1 -1.19 1 0.33 0.67

64
Gam
e
Go
alM
AR
G
IN
Ave
GFd
iff
Ave
GA
dif
f
Ave
Car
ds
Win
Team
P
r.
Loss
inP
r.
win
p
Japan vs Croatia 0 0 1.3 0.4667 0 0 0
Japan vs Brazil -3 -1.3 1.9 1.0559 1 0 1
Croatia Vs Australia 0 -0.6 -0.5 -1.1 0.33 0 0.33
France vs Switzerland 0 0.3 0.4 0.5 0.495 0.33 0.165
Korea Republic vs Togo 1 1.2 0 -1.5 0.33 0 0.33
France vs Korea Republic 0 -0.2 -1.6 0.2 0.33 0.33 0
Togo vs Switzerland -2 -0.7 2 1.8 0.66 0 0.66
Togo vs France -2 -1 1.6 0 0.33 0 0.33
Switzerland vs Korea Republic
2 -0.5 -2 1.2 0.66 0.33 0.33
Spain Vs Ukraine 4 1.3 -0.4 -2 1 0.66 0.34
Tunisia vs Saudi Arabia 0 0.3 -0.3 2.67 0 0 0
Spain vs Tunisia 2 1.3 -1 -3.4 1 0 1
Saudi Arabia vs Ukraine -1 -0.3 0.9 -1.27 0.66 0 0.66
Saudi Arabia vs Spain -1 -1.6 1.3 0.73 1 0 1
Ukraine vs Tunisia 1 0 -0.6 -1.4 0.66 0 0.66
Team AveGoalF AveGoalA AveCa winp ptwins ptdraws
Algeria 0.80 1.50 5.00 0.10 3.00 5.00
Cameroon 1.80 1.00 4.33 0.60 18.00 3.00
Ivory Coast 2.00 0.70 4.33 0.70 21.00 1.00
Ghana 1.70 0.40 4.33 0.60 18.00 3.00
Nigeria 2.00 0.70 4.33 0.60 18.00 3.00
Australia 4.20 0.60 3.33 0.80 12.00 1.00
Iran 1.17 0.50 2.67 0.67 12.00 1.00
Korea Republic 1.00 0.67 3.00 0.67 12.00 2.00
Japan 1.50 0.67 2.33 0.83 15.00 0.00
Belgium 1.60 1.10 3.33 0.30 9.00 3.00
Croatia 2.10 0.50 3.00 0.70 21.00 3.00
France 1.40 0.20 5.67 0.50 15.00 5.00
Greece 1.25 0.75 2.67 0.50 18.00 3.00
Netherlands 2.25 0.25 4.67 0.83 30.00 2.00

65
Gam
e
Go
alM
AR
G
IN
Ave
GFd
iff
Ave
GA
dif
f
Ave
Car
ds
Win
Team
P
r.
Loss
inP
r.
win
p
Russia 1.92 1.00 3.33 0.50 18.00 5.00
Switzerland 1.40 0.50 4.00 0.50 15.00 5.00
Bosnia and Herzegovina 1.20 0.90 3.33 0.40 12.00 4.00
England 1.70 0.50 3.33 0.80 24.00 1.00
Italy 1.70 0.80 5.00 0.70 21.00 2.00
Portugal 2.92 0.42 7.33 0.75 27.00 3.00
Spain 1.60 0.10 2.00 0.60 18.00 4.00
Costa Rica 1.50 1.40 2.67 0.50 15.00 1.00
Mexico 4.50 0.17 3.67 1.00 18.00 0.00
Honduras 1.50 0.80 4.33 0.70 21.00 1.00
USA 1.60 0.60 5.00 0.70 21.00 1.00
Argentina 1.61 0.94 4.33 0.56 30.00 4.00
Chile 1.00 1.22 4.00 0.28 15.00 7.00
Ecuador 1.00 0.44 3.00 0.44 24.00 4.00
Colombia 1.33 0.89 3.33 0.33 18.00 6.00
Uruguay 1.28 1.56 3.00 0.33 18.00 7.00
Brazil 1.94 0.94 3.67 0.50 27.00 7.00

66
Game AGFTEAMA AGFTEAMB ADGF AGATEAMA AGATEAMB DAGA ACTEAMA ACTEAMB ADIFFCARDS Qualified
Germany vs Costa Rica 2 1.00 1.00 0.85 3.00 -2.15 1.71 2.67 -0.95 1
Poland vs Ecuador 0.67 1.25 -0.58 1.00 1.00 0.00 3.33 2.25 1.08 0
Germany vs Poland 2 2.00 0.00 1.33 1.33 0.00 1.71 3.33 -1.62 1
Ecuador vs Costa Rica 1.25 1.00 0.25 3.00 3.00 0.00 2.25 2.67 -0.42 1
Costa Rica vs Poland 1 0.67 0.33 3.00 1.00 2.00 2.67 3.33 -0.67 0
Ecuador vs Germany 1.25 2.00 -0.75 1.00 0.85 0.15 2.25 1.71 0.54 0
England vs Paraguay 1.2 0.67 0.53 0.40 0.40 0.00 2.00 2.67 -0.67 1
Trinidad vs Sweden 0 0.75 -0.75 1.33 1.00 0.33 3.33 2.50 0.83 0
England vs Trinida 1.2 0.00 1.20 0.40 1.33 -0.93 2.00 3.33 -1.33 1
Sweden vs Paraguay 0.75 0.67 0.08 1.00 0.67 0.33 2.50 2.67 -0.17 0
Sweden vs England 0.75 1.20 -0.45 1.00 1.33 -0.33 2.50 2.00 0.50 0
Paraguay Vs Trinida 0.67 0.00 0.67 0.66 1.33 -0.67 2.67 3.33 -0.67 1
Argentina vs Ivory Coast 2.2 1.67 0.53 0.60 2.00 -1.40 2.60 3.00 -0.40 1
Serbia and Montenegro vs Netherlands 0.67 0.75 -0.08 3.33 0.50 2.83 4.00 4.00 0.00 0
Argentina vs Serbia and Montenegro 2.2 0.67 1.53 0.60 3.33 -2.73 2.40 4.00 -1.60 1
Netherlands vs Ivory Coast 0.75 1.67 -0.92 0.50 2.00 -1.50 3.00 3.00 0.00 1
Netherlands vs Argentina 0.75 2.20 -1.45 0.50 0.60 -0.10 3.00 2.40 0.60 0
Ivory Coast vs Serbia and Montenegro 1.67 0.67 1.00 2.00 3.33 -1.33 3.00 4.00 -1.00 1
Mexico vs Iran 1.25 0.67 0.58 1.25 2.00 -0.75 3.00 2.67 0.33 1
Angola vs portugal 0.33 1.00 -0.67 0.66 0.71 -0.05 3.67 1.14 2.52 0
Mexico vs Angola 1.25 0.33 0.92 1.25 0.67 0.58 3.00 3.67 -0.67 0
Portugal vs Iran 1 0.67 0.33 0.70 2.00 -1.30 3.43 2.67 0.76 1
Portugal vs Mexico 1 1.25 -0.25 0.70 1.25 -0.55 3.43 3.00 0.43 1
Iran vs Angola 0.67 0.33 0.34 2.00 0.67 1.33 2.67 3.33 -0.67 0
Italy vs Ghana 1.71 1.00 0.71 0.28 1.50 -1.22 1.57 4.50 -2.93 1
USA vs Czech Republic 0.67 1.00 -0.33 2.00 1.33 0.67 1.67 2.33 -0.67 0
Italy vs USA 1.71 0.67 1.04 0.28 2.00 -1.72 1.57 1.67 -0.10 0
Czech Republic vs Ghana 1 1.00 0.00 1.33 1.50 -0.17 2.33 4.50 -2.17 0
Czech Republic vs Italy 1 1.71 -0.71 1.33 0.29 1.04 2.33 1.57 0.76 0
Ghana vs USA 1 1.00 0.00 1.50 2.00 -0.50 4.50 1.33 3.17 1
Brazil vs Croatia 2 0.67 1.33 0.40 1.00 -0.60 2.20 3.67 -1.47 1
Australia vs Japan 1.25 0.67 0.58 1.50 2.33 -0.83 2.75 2.33 0.42 1
Brazil vs Australia 2 1.00 1.00 0.40 1.50 -1.10 2.20 2.75 -0.55 1
Japan vs Croatia 0.67 0.67 0.00 2.33 1.00 1.33 2.33 3.67 -1.33 0
Japan vs Brazil 0.67 2.00 -1.33 2.33 0.40 1.93 2.33 2.20 0.13 0
Croatia Vs Australia 0.67 1.00 -0.33 1.00 1.50 -0.50 3.67 2.75 0.92 0
France vs Switzerland 1.29 1.00 0.29 0.40 0.00 0.40 2.29 3.00 -0.71 0
Korea Republic vs Togo 1 0.33 0.67 1.33 2.00 -0.67 3.00 3.33 -0.33 1
France vs Korea Republic 1.29 1.00 0.29 0.40 1.33 -0.93 2.29 3.00 -0.71 0
Togo vs Switzerland 0.33 1.00 -0.67 2.00 0.00 2.00 3.33 3.00 0.33 0
Togo vs France 0.33 1.29 -0.96 2.00 0.42 1.58 3.33 2.29 1.05 0
Switzerland vs Korea Republic 1 1.00 0.00 0.00 1.33 -1.33 3.00 3.00 0.00 1
Spain Vs Ukraine 2.25 1.00 1.25 1.00 1.40 -0.40 1.50 2.60 -1.10 1
Tunisia vs Saudi Arabia 1 0.67 0.33 2.00 2.33 -0.33 4.67 1.67 3.00 0
Spain vs Tunisia 2.25 1.00 1.25 1.00 2.00 -1.00 1.50 4.67 -3.17 1
Saudi Arabia vs Ukraine 0.67 1.00 -0.33 2.33 1.40 0.93 1.67 2.40 -0.73 0
Saudi Arabia vs Spain 0.67 2.25 -1.58 2.33 1.00 1.33 1.67 1.50 0.17 0
Ukraine vs Tunisia 1 1.00 0.00 1.40 2.00 -0.60 2.40 4.67 -2.27 1
Germany vs Sweeden 2 0.75 1.25 0.85 1.00 -0.15 1.71 3.00 -1.29 1
Argentina vs Mexico 2.2 1.25 0.95 0.60 1.25 -0.65 2.40 3.00 -0.60 1
England vs Ecuador 1.2 1.25 -0.05 0.40 1.00 -0.60 1.80 2.25 -0.45 1
Portugal vs Netherlands 1 0.67 0.33 0.71 0.50 0.21 1.43 4.00 -2.57 1
Italy vs Australia 2.2 1.25 0.95 0.28 1.50 -1.22 1.57 2.75 -1.18 1
Switzerland vs Ukraine 1 1.00 0.00 0.00 1.40 -1.40 3.00 2.40 0.60 0
Brazil vs Ghana 2 1.00 1.00 0.40 1.50 -1.10 2.20 4.25 -2.05 1
Spain vs France 2.25 1.29 0.96 1.00 0.43 0.57 1.50 2.29 -0.79 0
Germany vs Argentina 2 2.20 -0.20 0.85 0.60 0.25 1.71 2.40 -0.69 1
Italy vs Ukraine 1.71 1.00 0.71 0.28 1.40 -1.12 1.57 2.40 -0.83 1
England vs Portugal 1.2 1.20 0.00 0.40 0.71 -0.31 1.80 3.43 -1.63 0
Brazil vs France 2 1.29 0.71 0.40 0.43 -0.03 2.20 2.29 -0.09 0
Germany vs Italy 2 1.71 0.29 0.85 0.29 0.56 1.71 1.57 0.14 0
Portugal vs France 1 1.29 -0.29 0.71 0.43 0.28 3.43 2.29 1.14 0
Italy vs France 1.71 1.29 0.42 0.28 0.42 -0.14 1.57 2.29 -0.71 1

67
Teams 2006 Qualified AdiffGF AdiffGA AdiffCards
Germany vs Sweden 1 1.66 0 0.2
Argentina vs Mexico 1 1.33 -0.67 0.04
England vs Ecuador 1 0.33 -0.34 -0.425
Portugal vs netherlands 1 0.33 0 0.16
Swiss vs Ukraine 0 -0.33 -1.33 0.2
Australia vs Italy 0 -0.36 1.33 -0.18
Ghana vs Brazil 0 -1 0 0.54
France vs Spain 0 -1.66 0 0.1
Germany vs Costa Rica 1 -2.1 -2.1 0
Poland vs Ecuador 0 0.3 0.3 2.2
Germany vs Poland 1 -0.4 -0.4 -3
Ecuador vs Costa Rica 1 -2 -2 -0.3
Costa Rica vs Poland 0 1.7 1.7 0.6
Ecuador vs Germany 0 -0.46 -0.46 0.5
England vs Paraguay 1 0.4 0.4 0.56
Trinidad vs Sweden 0 0.63 0.63 0.75
England vs Trinidad 1 -0.93 -0.93 -2
Sweden vs Paraguay 0 0.3 0.3 -0.66
Sweden vs England 0 0.6 0.6 1.25
Paraguay Vs Trinidad 1 -0.63 -0.63 -0.34
Argentina vs Ivory Coast 1 -1.4 -1.4 -1.95 Serbia and Montenegro vs Netherlands 0 2.8 2.8 3 Argentina vs Serbia and Montenegro 1 -2.7 -2.7 -3.28
Netherlands vs Cote d'Ivoire 1 -1.5 -1.5 -1.67
Netherlands vs Argentina 0 -0.1 -0.1 0.28 Cote d'ivoire vs Serbia and Montenegro 1 -1.3 -1.3 -1.33
Mexico vs Iran 1 -0.7 -0.7 0.33
Angola vs portugal 0 0 0 -1.67
Mexico vs Angola 0 0.6 0.6 1.244
Portugal vs Iran 1 -1.3 -1.3 0.34
Portugal vs Mexico 1 -0.6 -0.6 0
Iran vs Angola 0 1.34 1.34 0.244
Italy vs Ghana 1 -1.2 -1.2 -0.3
USA vs Czech Republic 0 0.7 0.7 -1.93
Italy vs USA 0 -1.7 -1.7 0.9
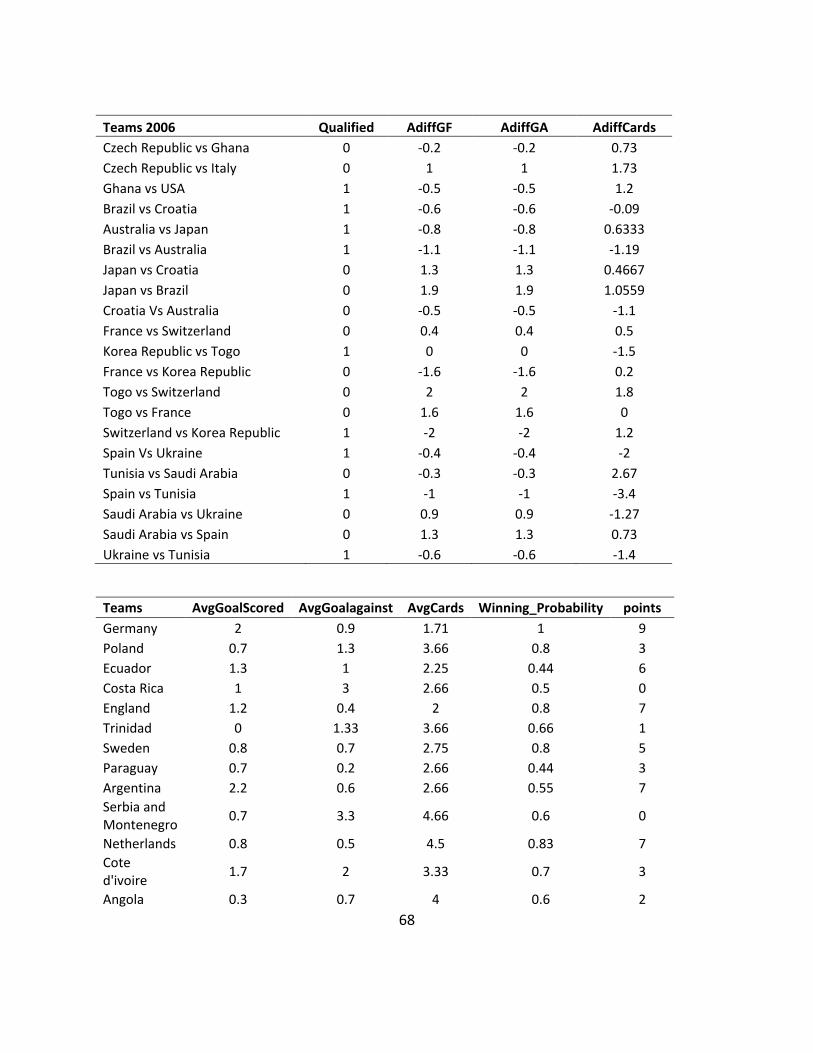
68
Teams 2006 Qualified AdiffGF AdiffGA AdiffCards
Czech Republic vs Ghana 0 -0.2 -0.2 0.73
Czech Republic vs Italy 0 1 1 1.73
Ghana vs USA 1 -0.5 -0.5 1.2
Brazil vs Croatia 1 -0.6 -0.6 -0.09
Australia vs Japan 1 -0.8 -0.8 0.6333
Brazil vs Australia 1 -1.1 -1.1 -1.19
Japan vs Croatia 0 1.3 1.3 0.4667
Japan vs Brazil 0 1.9 1.9 1.0559
Croatia Vs Australia 0 -0.5 -0.5 -1.1
France vs Switzerland 0 0.4 0.4 0.5
Korea Republic vs Togo 1 0 0 -1.5
France vs Korea Republic 0 -1.6 -1.6 0.2
Togo vs Switzerland 0 2 2 1.8
Togo vs France 0 1.6 1.6 0
Switzerland vs Korea Republic 1 -2 -2 1.2
Spain Vs Ukraine 1 -0.4 -0.4 -2
Tunisia vs Saudi Arabia 0 -0.3 -0.3 2.67
Spain vs Tunisia 1 -1 -1 -3.4
Saudi Arabia vs Ukraine 0 0.9 0.9 -1.27
Saudi Arabia vs Spain 0 1.3 1.3 0.73
Ukraine vs Tunisia 1 -0.6 -0.6 -1.4
Teams AvgGoalScored AvgGoalagainst AvgCards Winning_Probability points
Germany 2 0.9 1.71 1 9
Poland 0.7 1.3 3.66 0.8 3
Ecuador 1.3 1 2.25 0.44 6
Costa Rica 1 3 2.66 0.5 0
England 1.2 0.4 2 0.8 7
Trinidad 0 1.33 3.66 0.66 1
Sweden 0.8 0.7 2.75 0.8 5
Paraguay 0.7 0.2 2.66 0.44 3
Argentina 2.2 0.6 2.66 0.55 7
Serbia and Montenegro
0.7 3.3 4.66 0.6 0
Netherlands 0.8 0.5 4.5 0.83 7
Cote d'ivoire
1.7 2 3.33 0.7 3
Angola 0.3 0.7 4 0.6 2
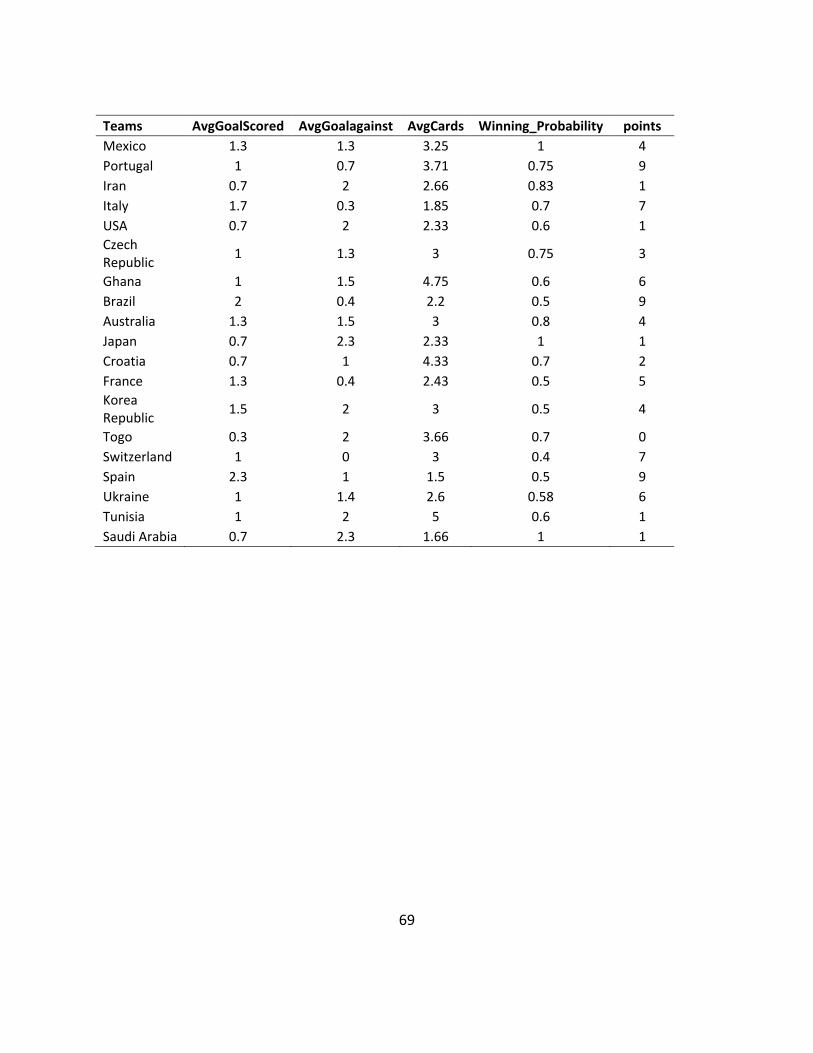
69
Teams AvgGoalScored AvgGoalagainst AvgCards Winning_Probability points
Mexico 1.3 1.3 3.25 1 4
Portugal 1 0.7 3.71 0.75 9
Iran 0.7 2 2.66 0.83 1
Italy 1.7 0.3 1.85 0.7 7
USA 0.7 2 2.33 0.6 1
Czech Republic
1 1.3 3 0.75 3
Ghana 1 1.5 4.75 0.6 6
Brazil 2 0.4 2.2 0.5 9
Australia 1.3 1.5 3 0.8 4
Japan 0.7 2.3 2.33 1 1
Croatia 0.7 1 4.33 0.7 2
France 1.3 0.4 2.43 0.5 5
Korea Republic
1.5 2 3 0.5 4
Togo 0.3 2 3.66 0.7 0
Switzerland 1 0 3 0.4 7
Spain 2.3 1 1.5 0.5 9
Ukraine 1 1.4 2.6 0.58 6
Tunisia 1 2 5 0.6 1
Saudi Arabia 0.7 2.3 1.66 1 1