predicting the main resistance of belt ... the main resistance of belt conveyors c.a. wheeler the...
TRANSCRIPT

Copyright is vested with IMHC 1
PREDICTING THE MAIN RESISTANCE OF BELT CONVEYORS
C.A. Wheeler
The Centre for Bulk Solids and Particulate Technologies The University of Newcastle, Australia
1 INTRODUCTION Mining and mineral processing industries throughout the world rely on the efficient transportation of bulk solid. Belt conveyors have been used for the transportation of bulk solid over relatively short distances for many years, but with significant developments in analytical procedures to describe the dynamic properties of belt conveying systems, the utilisation of belt conveyors for long distance overland transportation is becoming more economically viable. Belt conveyor installations are becoming progressively longer and belt speeds significantly faster, and as these trends continue it becomes increasingly important that the motion resistances associated with the operation of belt conveyors be minimised for optimum performance and efficiency. In the energy conscious world in which we live, no longer is it acceptable for a belt conveyor to simply transport bulk solid from one point to another, the operation must be economically viable, environmentally friendly and energy efficient. The energy consumed in raising bulk solid from one level to another is typically a parameter that cannot be easily changed, and is usually determined by plant constraints or the terrain over which the conveyor is travelling. As a result the primary area of focus in order to minimise power consumption is the resistances associated with the motion of the belt conveyor. The energy consumed during the operation of a long horizontal belt conveyor is primarily due to the frictional resistance that occurs along the length of the conveyor. This resistance is known as the main resistance and includes the belt and bulk solid flexure resistance, the rotational resistance of the idler rolls, and the indentation rolling resistance of the conveyor belt. This paper will discuss each component of the main resistance and provide details of methods to calculate the contribution of each component. A finite difference solution that applies orthotropic plate mechanics is described to calculate the deflection of the conveyor belt due to the loading induced from the weight of the belt and bulk solid, and the loading induced from the relative movement of the bulk solid. Given the displacement of the belt and bulk solid the flexure resistance of each component can be calculated. The rotational resistance of the idler rolls is briefly discussed and an apparatus to measure the resistance is presented. A finite element model is then discussed which calculates the indentation rolling resistance occurring at each idler set from the viscoelastic properties of the bottom cover of the conveyor belt.
2 BELT AND BULK SOLID FLEXURE RESISTANCE
As the conveyor belt moves from one idler set to the next the belt and bulk solid being conveyed undergo deflections due to the sag of the belt. Flexure resistance of the conveyor belt and bulk solid occurs due to the cyclic transverse and longitudinal movement as the belt progresses from one idler set to the next. The losses attributable to the belt flexure resistance occur due to the hysteresis losses associated with the induced bending of the conveyor belt, while the flexure resistance of the bulk solid occurs due to internal friction and friction at the belt interface. In order to calculate the flexure resistance of the belt and bulk solid an accurate prediction of the deflection of the troughed belt between idler sets is required. Orthotropic plate mechanics is used to model the belt, which in addition to longitudinal tensile loading is also subjected to a pressure distribution resulting from the weight of the belt and bulk solid and loading induced from the relative movement of the bulk solid.

Copyright is vested with IMHC 2
2.1 Orthotropic Plate Mechanics
A conveyor belt may be considered to consist of three elements which include the top and bottom covers and a carcass that carries the tensile load. For the purpose of analysis the conveyor belt may be considered an elastic homogeneous orthotropic medium subjected to forces, Q per unit length and moments, M per unit length that cause the belt to bend, in addition to in-plane (membrane) forces acting on the middle surface. The theory of orthotropic plate mechanics can therefore be applied to calculate the deflection of the belt between idler sets, which was first adopted by Harrison [1] to analyse bending vibrations in steel cord conveyor belts. Fig.1 details a differential element of belt, dx by dy subjected to a pressure distribution, Pz
(x,y) and a longitudinal tensile force, Tx per unit length. While transverse and shear in-plane forces will also be present due to friction between the belt and bulk solid these are considered negligible and will not be included in the present analysis. The pressure distribution acting on the carry side results from the self-weight of the belt and the loading induced by the weight and relative movement of the conveyed bulk solid. The pressure distribution acting on the return side is due to the weight of the belt alone. Due to the action of the in-plane force, Tx resulting from longitudinal belt tension the differential element will develop some curvature resulting in a projection of the force Tx acting on the z-axis, as shown in Fig.1.
Fig.1: Differential belt element
Equilibrium analysis of the differential element provides the governing differential equation for the belt deflection, w, as
2
2
4
4
22
4
4
4
x 2Dx
wTy,xP
y
wD
yx
wH
x
wxzy (1)
Where; yxxyxy DDDH 42 (2)
Dx and Dy are flexural rigidities of the belt, Dxy the torsional rigidity, while x and y are Poisson’s ratios. The flexural rigidities can be approximated from the bending moduli or measured experimentally using techniques described by Timoshenko [2].
dx
t
dydxx
QQ x
x
dxQy
dxMy
y z
x + +
dy
dydxx
MM x
x
dxdyy
QQ y
y
dydxx
MM xy
xy
dyQx
dxdyy
MM yx
yx
dyMx
dyMxy
dxMyx
dxdyy
MM y
y
dxdy)y,x(Pz
dydxx
TT x
x
dxx
w
x
w2
2
dyTx
x
w

Copyright is vested with IMHC 3
The governing differential equation for the belt allows the calculation of a deflection profile based upon the orthotropic properties of the conveyor belt and the induced loading. Due to the non-uniform pressure distribution induced by the relative movement of the bulk solid the solution of the governing differential equation approximating the deflection of the belt is not possible using classical plate mechanics. Consequently a numerical approximation has been developed using the method of finite differences. In particular, central differences will be used to replace the derivatives in the governing differential equation of the belt in order to approximate the deflection of the belt w(x,y) at selected nodes within the finite difference mesh. 2.2 Finite Difference Solution
The finite difference method involves replacing the derivatives in the governing differential equation by their central difference approximations. The span of conveyor belt between idler sets is modelled as a mesh of discrete nodes as shown in Fig.2. The governing differential equation, in conjunction with the imposed boundary conditions is applied at each node within the allocated mesh. The deflection of the belt is then refined to the solution of a system of simultaneous equations which is solved numerically.
Fig.2: Modelled span of conveyor belt showing allocated boundary conditions
The general finite difference mesh pattern for the belt analysis in relation to the pivotal node
(m,n) is shown in Fig.3. An equally spaced square mesh (ie: x= y= xy) is assumed in order to simplify the analysis. Substituting the central difference relations into Eq. (1) the finite difference representation of the belt deflection at the pivotal node (m,n) is then given by
y,xPxy
Dww
xy
Dww
xy
Hwwww
xy
H
xy
Dww
xy
T
xy
H
xy
Dww
xy
T
xy
D
xy
H
xy
Dw
zy
n,mn,mx
n,mn,m
n,mn,mn,mn,my
n,mn,m
xxn,mn,m
xyxn,m
422422
4111111114411
244112444
244
442686
(3)
y (n)
z
x (m)
m = 1
m = mmax
Free Edge
Fixed Edge
Guided Edge
Fixed Edge

Copyright is vested with IMHC 4
Fig.3: General finite difference mesh pattern for conveyor belt at pivotal node (m,n) Due to the transverse symmetry of the conveyor belt under general conveying conditions the boundary conditions are selected to model only one half of the belt, as shown in Fig.2. The outer edge of the belt is analysed as a free edge, while the edge along the centreline of the belt is treated as a guided or sliding support to represent the continuation of the belt across the boundary. The belt directly above the idler rolls represented by m=1 and m=mmax are analysed as fixed edges and modelled as pseudo continuous by mirroring nodes across the boundaries to simulate the continuation of the belt directly before and after the modelled span of belt. From the finite difference representation of the belt deflection given by Eq. (3) and the nominated boundary conditions a system of simultaneous equations is derived to model the deflection of the belt. The system of simultaneous equations is then solved numerically. 2.3 Pressure Distribution due to Bulk Solid
Calculating the pressure distribution due to the self-weight and relative movement of the bulk solid is essential in order to calculate the belt deflection and therefore the flexure resistance. The cyclic transverse and longitudinal deformation of the bulk solid generates a complex problem to predict the transition and magnitudes of the induced stress states. As an element of bulk solid moves from one idler set to the next the bulk solid experiences variations in height and cross-sectional shape due to the sag of the belt. As the belt progresses from one idler set to the next the bulk solid undergoes cyclic expansion and contraction in the transverse direction, as shown in Fig.4. When the belt is supported by an idler set, as indicated by positions A and E, the belt and bulk solid are forced to conform to the troughing profile resulting in transverse compressive stresses. Upon leaving the idler and moving to position B, the troughed belt opens under the action of gravity allowing the bulk solid to relax transversely forming an active stress state. Longitudinally however the bulk solid is undergoing compressive stresses due to the contraction of the bulk solid arising from the longitudinal sag of the belt. Upon reaching approximately half to two thirds the carry side idler spacing, ac as indicated by position C, the stress states theoretically reverse. A passive stress state is induced in the transverse direction resulting from the compressive stresses due to the narrowing profile of the belt, while the bulk solid in the longitudinal direction dilates generating an active stress state as it moves away from the point of maximum sag.
(m, n) (m+1, n) (m+2, n) (m-1, n) (m-2, n)
(m, n-1) (m+1, n-1) (m-1, n-1)
(m, n+1) (m+1, n+1) (m-1, n+1)
(m, n+2)
(m, n-2)
x
y
x
y
Where: x = y = xy

Copyright is vested with IMHC 5
Fig.4: Active and passive stress states Krause and Hettler [3] applied Coulomb’s earth pressure theory to calculate the forces acting on the conveyor belt due to the active and passive stress states. Fig.5 details the force analysis applied for the active stress state, which provides an equilibrium analysis of the forces acting on the wedge at the point of sliding to determine the normal force, Fsna acting on the belt due to the active stress state.
Fig.5: Normal force analysis for the active stress case
β w
Belt Opening
Fms
i
a
Fina
Fisa Fia
Fsna
Fssa
Fsa
Lss
Lss
1
3
Lss
2
3
L
a 2 3
L
a 1 3
L
a
Failure
Plane
Fia
Fms
Fsa
a - i
a - w
Pas Pas Act
C to E: Belt Closing
A B C D E
Transverse Stress State
Longitudinal Stress State
Active Passive
Active Passive
Belt Direction
Transverse Belt Movement Closing Opening
ac
A to C: Belt Opening
Act Act Pas

Copyright is vested with IMHC 6
Krause and Hettler [3] derive the transverse active pressure factor, Kta for the opening of the
conveyor belt in terms of the troughing angle , the bulk solid internal friction angle i, the belt
and bulk solid friction angle w, and the conveyor surcharge angle . The pressure factor, Kta is given by
2
sin/sinsinsin
sin/sinK
iwiw
ita (4)
Similarly, the transverse passive pressure factor for the closing of the conveyor belt, Ktp is given by
2
sin/sinsinsin
sin/sinK
iwiw
itp (5)
The normal force per unit length, Fsn acting on the side idler roll due to the bulk solid is then approximated as
wtpta
sssn cosKK
gLF22
1 2 (6)
Where ρ is bulk density, Lss is the length of bulk solid in contact with the inclined side of the conveyor belt, and the active and passive stress states are assumed to act over half the idler spacing. Rather than calculating the resultant normal force acting on the conveyor belt due to the induced stress states, as shown in Fig.5 the present analysis requires the pressure distribution over the surface area of the conveyor belt. The pressure due to the bulk solid, (Pz_bs)m,n acting on each node (m,n) along the inclined sides of the conveyor belt (ie; njunct <
n nmax ) is shown in Fig.6, which represents the transverse cross-section at longitudinal position m. The shaded region parallel to the failure plane details the segment of bulk solid
of width ∆ xy by length ∆xy acting on each node along the inclined side of the belt.
Fig.6: Pressure distribution acting on inclined side of conveyor belt
xy
h n
h
n+1
a
2
1 Lcs
z
y
n+1
n=njunct n=1
n=nmax n
(Pz_bs)m,n
xy Failure
Plane

Copyright is vested with IMHC 7
The pressure distribution is derived from the normal force, (Fsn)m,n acting on each node (m,n) and is given by
xy
cosKnjunctnhsina
xy
FP
wtnn,mn,msn
n,mbs_z2
2
2 for; njunct < n nmax (7)
Where the transverse pressure factor, Kt is equal to Kta or Ktp for the active and passive stress states respectively and (h)n is the projected height of bulk solid above the node as shown in Fig.6. To accommodate for the dynamic loading effects the acceleration due to the rate of belt deflection at each node, (a)m,n is calculated from the central difference approximation and is given by
n,mn,mn,mn.m wwwtt
wa 1122
2
21
(8)
where;bv
xyt and vb = belt speed
The pressure distribution acting on the conveyor belt directly above the centre idler roll is then
calculated from a vertical force balance. The normal force, (Fcn)m per length xy acting on the conveyor belt above the centre idler roll at longitudinal position m, is calculated by summing the vertical forces acting on each node and is equal to
maxn
njunctnn,mbs_zmmcn xyPcosgxyqF
22 (9)
Where qm is the mass per unit length of bulk solid. The normal force distribution across the centre of the belt is distributed according to the ratio of the cross-sectional area of bulk solid above each node to the total cross-sectional area of bulk solid above the centre idler and is given by
tanLtancossinLL
nxycosLLtansinLxyFF
cssscs
sscsssmcnn,mcn 2
81
21
21
21
for; 1 n njunct (10)
Where Lcs is the projected contact length of the centre idler roll shown in Fig.6. The pressure
distribution across the centre of the belt (ie: 1 n njunct) due to the bulk solid is then equal to
2xy
FP
n,mcn
n,mbs_z for; 1 n njunct (11)
Applying the pressure distributions given in Eqs. (7) and (11) into Eq. (3) over the relevant intervals allows the deflection of the conveyor belt at each node, wm,n to be calculated from the derived system of simultaneous equations. The process involves an iterative solution since the acceleration experienced at each node, (a)m,n is dependent on the rate of deflection, which in turn determines the pressure distribution and thereby the deflection.

Copyright is vested with IMHC 8
2.4 Bulk Solid Flexure Resistance
For the purpose of analysis and explanation the bulk solid flexure resistance can be considered to consist of both transverse and longitudinal components. The losses attributable to the transverse flexure of the bulk solid are approximated by calculating the difference between the work done in deflecting the bulk solid during the active and passive stress states, as noted by Spaans [4]. Predicting the transition between the active and passive stress states is complex and is often approximated as half the idler spacing, ac. A significant benefit of the finite difference model is the ability to accurately predict the transition between the opening and closing belt, which is calculated from the point of maximum sag along the inclined side of the conveyor belt. The location of the transition is signified by m=mtrans. For the present analysis the transverse flexure resistance of the bulk solid, Ftrans_flex_bs acting over the idler spacing, ac is approximated by
maxn
njunctnmtrans
m
n,mwtann,m
maxm
mtransm
n,mwtpnn,m
cbs_f lex_trans
wcosKnjunctnhsinaxy
wcosKnjunctnhsinaxy
aF
11
1
2
21
2
21
2 (12)
The longitudinal flexure resistance of the bulk solid is also calculated from the difference between the work done in deflecting the bulk solid during the active and passive stress states. Spaans [4] provides an approximation for the longitudinal flexure resistance of the bulk solid for a flat belt by calculating the energy required to deform by angular rotation, a volume element subjected to a linearly increasing pressure. For the present analysis the angular
deflection, ( )m,n that the element of bulk solid is subjected to is determined from the radius of curvature, (r)m,n and is given by
n,mn,m
r
xy (13)
where; n,mn,mn,m w/wr3 2
1 (14)
and, w m,n and w m,n are approximated by the finite difference derivatives. For a troughed belt the volume of bulk solid considered when calculating the longitudinal flexure resistance is restricted to the cross-section above the centre idler roll. The longitudinal flexure resistance of the bulk solid, Flong_flex_bs is then approximated as
2
1
1
1
2
612
61
njunct
n
mtrans
mnbsn,mlan,mbs_z
maxm
mtransmnbsn,mlpn,mbs_z
cbs_flex_long hxyKPhxyKP
aF (15)
Where; i
ilp
sin
sinK
1
1 and
i
ila
sin
sinK
1
1 (16)
Klp and Kla represent the longitudinal passive and active pressure factors and (hbs)n is the height of the bulk solid above the centre idler roll. The total bulk solid flexure resistance for the idler spacing is calculated from the sum of Eqs. (12) and (15). 2.5 Conveyor Belt Flexure Resistance
The flexure resistance of the conveyor belt occurs due to the asymmetric longitudinal deflection of the belt coupled with hysteresis bending losses. This section offers an approximation to the flexure resistance for the carry side based upon the calculated belt

Copyright is vested with IMHC 9
deflections and induced bending moments. Similar calculations may also be made for the returns side conveyor belt. Spaans [4] describes a theoretical model to predict the flexure resistance for a flat belt in which the hysteresis loss of the belt is measured under a dynamic bending moment. The flexure resistance per idler set is given by
2
2
1
1
r
M
r
MF f lex_belt (17)
Where the energy loss factor due to bending is given by, and lies between 0.4 to 0.9 for
most belts, with = 0.6 commonly used. M1 and M2 are the bending moments occurring within the belt at the point directly above the idler roll and at the point of maximum sag respectively. The longitudinal profile of the flat belt is approximated by two discrete radii of curvature, the radius of curvature over the idler roll, r1 and the radius of curvature at the point of maximum sag, r2. Rather than approximating the longitudinal profile of the conveyor belt as two discrete radii the deflection profile for the troughed belt is derived from the finite difference solution. The total flexure resistance of the belt as it moves from one idler set to the next is approximated by summing the flexure resistance occurring at each node along the length of the conveyor belt, which may be expressed as
maxn
n
maxm
m n,m
n,mxflex_belt
r
MF
1 1
(18)
The finite difference approximation of the conveyor belt deflection provides each of these components for each node within the finite difference mesh. The radius of curvature (r)m,n is given by Eq. (14) while the finite difference form of the longitudinal bending moment (Mx)m,n, acting on node (m,n) is given by
11112 22 n,mn,myn,mn,mn,my
xn,mx wwwww
xy
DM (19)
2.6 Overview of Flexure Resistance Calculations
The preceding analysis provides an approximation for the belt and bulk solid flexure resistance for a troughed conveyor. A finite difference solution using orthotropic plate mechanics is used to model the deflection of the conveyor belt while subjected to a tensile load and a non-uniform pressure distribution. The pressure distribution applied to the belt results from the self-weight of the belt and the loading induced by the weight and movement of the conveyed bulk solid. The flexure resistance of the bulk solid is calculated from the relative movement of the bulk solid in both the transverse and longitudinal directions. While the sum of the quotient of the bending moment and the radius of curvature for each node is calculated and multiplied by a hysteresis loss factor for bending to give the total belt flexure resistance for the modelled belt span.

Copyright is vested with IMHC 10
3 IDLER ROTATIONAL RESISTANCE The rotational resistance of the idler rolls consists of the rotational resistance of the bearings and seals, and may be considered to be dependent on the following parameters:
Bearing type, usually deep groove ball or tapered roller
Bearing pre-load when considering tapered roller bearings
Seal type and configuration
Grease viscosity
Bearing and ambient temperature
Rotational speed
Vertical and axial load Due to the relative ease of measuring the rotational resistance of an idler roll it is preferable to measure the resistance of the idler roll under simulated operating conditions, such as the equivalent belt speed, ambient temperature and vertical load. Fig.7 shows a schematic of an apparatus developed by the author to measure the rotational resistance of idler rolls. The idler to be tested is supported on knife-edge supports that enable the vertical force at each end of the shaft to be measured independently. Collars are attached to each end of the idler shaft that rest on the knife-edge supports and allow the shaft to rotate freely about the knife-edge. A flat drive belt applies a vertical load and a driving torque to the idler through a variable speed drive which can be ramped up to the required belt speed to represent the starting characteristics of the conveyor. The resistance torque is continuously monitored by measuring the force resisting rotation about the knife-edge supports. The measurement apparatus is housed within a temperature controlled room where the ambient temperature can be set from -10
oC to +60
oC. Additionally, if required the bearing temperature can be
monitored using a thermocouple located beneath the inner race of the bearing.
Fig.7: Idler rotational resistance measurement apparatus.

Copyright is vested with IMHC 11
If idler rolling resistance measurements are not available then theoretical approximations may be made by considering the contribution of each component. 3.1 Labyrinth Seal Viscous Drag
Grease filled labyrinth seals form the boundary between dust and water ingress into the rolling elements of the bearings. The labyrinth seals are usually fully packed with lubricating grease to optimise the sealing efficiency of the labyrinth. The lubricating grease serves a dual purpose, to lubricate the rolling elements of the bearings and to provide an effective seal from the ingress of contaminants. The labyrinth consists of a stationary section fitted to the shaft of the idler roll, and a rotating part housed into the idler shell. Due to the nature of the sealing mechanism viscous drag is generated due to the shearing of the grease between the layers of rotating and stationary surfaces. The magnitude of the retarding moment depends on the viscosity of the lubricating grease which is temperature dependent, the rotational speed of the idler and physical configuration of the labyrinth seal. The lubricating grease may be considered a Newtonian fluid under normal operating conditions and the resistance to rotation approximated using a force momentum balance for a Newtonian fluid. 3.2 Ball and Roller Bearing Friction
Bearing friction is generated due to the elastic hysteresis formed within the contact zone. The pressure distribution within the contact zone is asymmetric since the surface pressure is higher leading the centreline of the rolling element than lagging the centreline. Additionally, the dampening of elastic vibrations that occur due to uneven pressure at the contact zone also adds to bearing friction, as noted by Palmeren [5]. Bearings operating in an idler roll of a convention belt conveyor will experience a combination of hydrodynamic and boundary lubrication. Therefore the total friction moment is determined from the sum of the no-load and load dependent moments. The reader is referred to the bearing manufacturer’s handbooks, such as SKF [6] for detailed calculations. 3.3 Breakaway Torque
The breakaway torque, or the starting torque is the frictional moment required to start the idler roll rotating from the stationary position. The breakaway torque can be considerably higher than the running values. The reasons for the larger values on starting can be attributable to lower lubricating grease temperature, which are less than the operational bearing temperatures resulting in lubricants operating at higher dynamic viscosities, and also the transition from static to dynamic friction of the contact seals. SKF [6] suggests that the starting torque of a rolling bearing is approximately twice as high as the load dependent friction moment for deep groove ball bearings, and up to four times higher for tapered roller bearings.

Copyright is vested with IMHC 12
4 INDENTATION ROLLING RESISTANCE Excluding the power required to lift the bulk solid the belt indentation component is generally considered to be the greatest proportion of the main resistance. Research by Hager and Hintz [7] has indicated that the belt indentation resistance can comprise up to 60% of the overall power consumption on long horizontal belt conveyor installations. This section describes a linear viscoelastic finite element analysis developed by Wheeler [13] to model the indentation rolling resistance of a belt conveyor. The numerical analysis described models the viscoelastic rolling contact problem as the bottom cover of the conveyor belt is indented due to the weight of the belt and bulk material. The analysis predicts a rolling resistance factor as a result of the asymmetric pressure distribution generated in the indentation zone. Indentation rolling resistance occurs due to the viscoelastic nature of the bottom cover of the belt, which is typically made from rubber compounds. Rubber is a viscoelastic material and may be considered to exhibit properties intermediate between an elastic solid and a viscous liquid. Characteristics include the rigidity of an elastic solid, but the ability to flow and dissipate energy by frictional losses as a viscous fluid. As the rubber belt travels over the idler roll the bottom cover of the belt is indented due to the weight of the belt and bulk material. The contact area consists of an area of increasing pressure as the belt drives into the rigid roll, followed by an area of decreasing pressure as the belt travels over the roll. The cyclic indentation of the bottom cover of the belt as it passes over the idler rolls generates a resistance to motion due to the formation of an asymmetric pressure distribution within the contact area of the idler roll and belt. The rolling contact between a rigid cylinder and a viscoelastic medium is a situation that occurs in many engineering applications, including the interface between an idler roll and the bottom cover of a conveyor belt. As a result various experimental measurement techniques and theoretical analyses have been published on the topic, however of significance is research by Jonkers [8] and Spaans [4] that provided direct analysis of the topic in relation to a conveyor belt. Jonkers [8] models the indentation resistance by first considering the indentation profile in the contact region as an arc that is approximated by a half sine curve. The pressure distribution acting within the contact region due to the weight of the belt and the bulk material is then calculated, with the assumption that the highest pressure occurs at the centreline of the idler. The hysteresis work in the indentation zone is then modelled using the measured hysteresis loop for the particular conveyor belt material with an indentation frequency determined by the belt speed and idler spacing. Spaans [4] provides a linear analysis accompanied by hysteresis in order to model the indentation rolling resistance. The distribution of surface pressure within the contact region is a function of the radius of the idler roll and the curvature of the belt. The compressive stresses within the indentation region are considered directly proportional to the depth of indentation by assuming the deformation of the belt only occurs perpendicular to the surface of the roll. To model the hysteresis losses within the indentation process a sample of belt was compressed between two parallel plates and mechanically loaded through a sine wave generator. The indentation depth, frequency and time of indentation during the hysteresis loss measurements are equivalent to those of the modelled conveyor installation. Theoretical predictions of the indentation rolling resistance by Jonkers [8] and Spaans [4] are reported to provide close approximation with experimentally measured values. However, as discussed by Lodewijks [9] the limitations of both methods are within the predicted distribution of the surface pressure within the contact region, and the assumption that the peaked stress occurs at the idler centreline. While this may be the case for low and high belt speeds the pressure profile tends to become more offset during typical belt conveyor operating speeds. Lynch [10] and Batra et al. [11] apply finite element methods to determine the solution of viscoelastic rolling contact problems, with the later incorporating thermomechanical properties. Lynch [10] provides a numerical solution to the rolling of a viscoelastic sheet between two rigid rolls. Batra et al. [11] provides a thermoviscoelastic numerical solution to

Copyright is vested with IMHC 13
the rolling contact of a rigid cylinder with a viscoelastic layer bonded to a rotating cylinder. In each of the solutions provided the depth of indentation is prescribed by virtue of the process being modelled, ie: two rolls a set distance apart with a viscoelastic layer in rolling contact. 4.1 Finite Element Analysis
In view of the successful application of finite element methods to the viscoelastic rolling contact problem by Lynch [10] and Batra et al. [11] a similar approach has been adopted by the author to model the stress profile at the roll and belt contact region to predict the resultant belt indentation rolling resistance. A particular advantage of the finite element method is the ability to model the viscoelastic memory effect of the belt since the stress in a given control volume is influenced by the strain in each control volume through which the material previously passed. This removes the limitations imposed by the closed form solutions described previously, and allows the asymmetric pressure distribution within the contact region to be effectively predicted. The modelling technique described incorporates the asymmetric loading profile with the added advantage of not having to specify an indentation depth or contact length since the roll diameter will prescribe the lower boundary conditions, while the upper surface of the belt will be subjected to an external uniform load due to the weight of the belt and bulk material. The finite element representation of the indentation zone is shown schematically in Fig.8. The continuum is divided into a finite number of triangular elements each connected at nodes, and depending if the node is a boundary or internal node, either the displacement or load is specified in each co-ordinate direction.
Fig.8: Finite element representation of the interface between the belt and idler roll.
The numerical method of viscoelastic stress analysis described is derived from the analysis of Lynch [10] and Batra et al. [11] with the primary distinction being a non-prescribed indentation depth. The analysis that follows assumes that the lower cover of the belt is homogeneous and isotropic. The speed of the belt is considered to be constant so a steady state viscoelastic stress analysis may be applied, where the deformation of the rubber in the indentation zone is sufficiently small to apply linear constitutive laws. The isotropic forms of the viscoelastic stress strain relations in terms of the shear G1, and bulk relaxation moduli G2
are given by Christensen [12] as:
dd
detGs
ijt
ij 1 (20)
Indentation Length
Uniform Pressure Distribution
Idler Roll Radius
Belt Flexure Radius
Analysis Zone
Belt Carcass
Bottom Cover

Copyright is vested with IMHC 14
and,
dd
dtG kk
t
kk 2 (21)
Where the deviatoric components of stress sij and strain eij are given by
kkijijijs31 (22)
kkijijije31 (23)
where, δij is the Kronecker symbol. Lynch [10] derives an overall stiffness of the structure by integrating Eqs. (20) and (21) by finite differences in equal time increments. Both Lynch [10] and Batra et al. [11] consider the viscoelastic structure to be “flowing”, utilising a coordinate system fixed to the loads acting on
the structure. Lynch [10] provides the stress,{ }R at the Rth element as the sum of the
stresses imposed by the preceding elements through which the element has passed, which is given by
KRK
R
KR B1
(24)
where,
200
0
0
RKRK
RKRK
RKRK
RK
baab
ba
B (25)
and,
RK
R,K
KR
KR
tGtGtGtG
tGtGtGtG
tGtGGG
GG
a
R,KR,KR,KR,K
R,R,R,R,
R,RR,RRK
1
11
1
1
2121
2121
211211
1211
131
132
131
132
21
131
132
231
232
21
131
132
31
32
21
31
32
(26)
and, similarly bRK is obtained by replacing ⅔G1 by ⅓G2. By applying the theorem of virtual work to the strains in the elements as a result of the nodal displacements, Lynch [10] derives the loads {P}R acting on an element R of volume VR as
RTRRR AVP (27)
Where TRA is the transpose of the matrix RA , which is given by
R
RR
rA (28)
Where Rr represents the nodal displacements. Therefore by combining equations (24), (27)
and (28) Lynch derives the stiffness relation as
KKRK
R
K
TRRR rABAVP
1 (29)
or,
Copyright is vested with IMHC 15
KRK
R
KR rkP 1
(30)
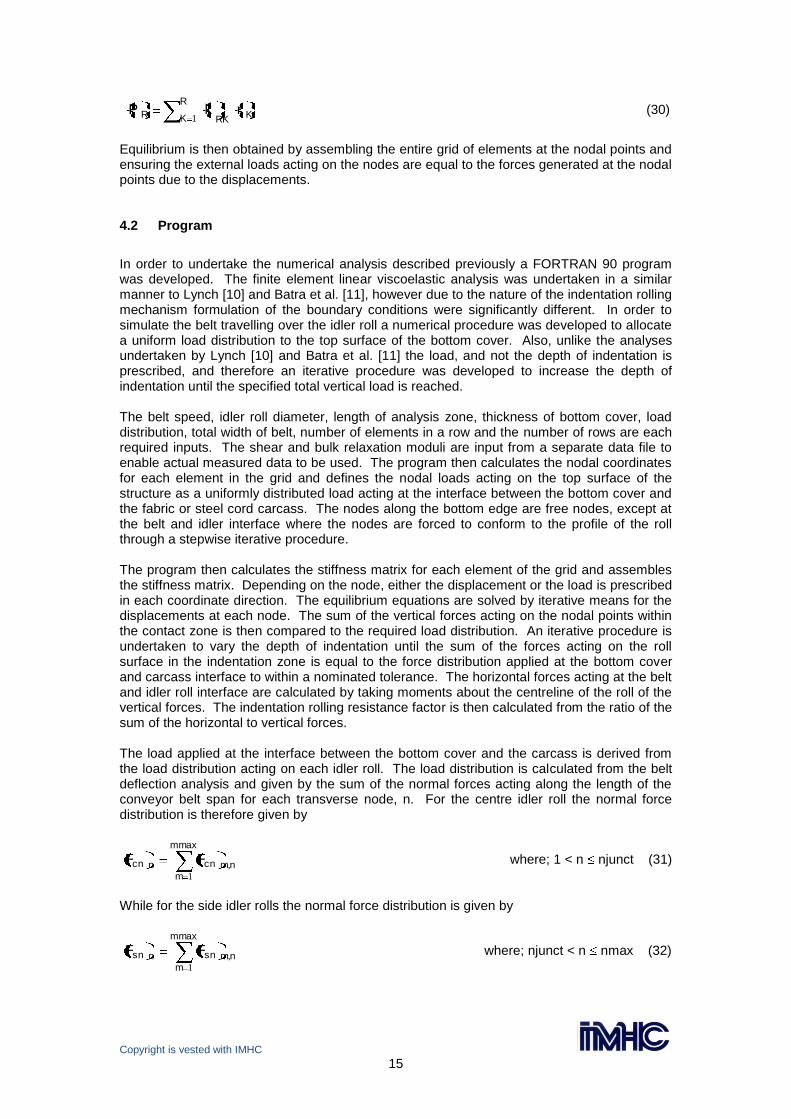
Equilibrium is then obtained by assembling the entire grid of elements at the nodal points and ensuring the external loads acting on the nodes are equal to the forces generated at the nodal points due to the displacements. 4.2 Program
In order to undertake the numerical analysis described previously a FORTRAN 90 program was developed. The finite element linear viscoelastic analysis was undertaken in a similar manner to Lynch [10] and Batra et al. [11], however due to the nature of the indentation rolling mechanism formulation of the boundary conditions were significantly different. In order to simulate the belt travelling over the idler roll a numerical procedure was developed to allocate a uniform load distribution to the top surface of the bottom cover. Also, unlike the analyses undertaken by Lynch [10] and Batra et al. [11] the load, and not the depth of indentation is prescribed, and therefore an iterative procedure was developed to increase the depth of indentation until the specified total vertical load is reached. The belt speed, idler roll diameter, length of analysis zone, thickness of bottom cover, load distribution, total width of belt, number of elements in a row and the number of rows are each required inputs. The shear and bulk relaxation moduli are input from a separate data file to enable actual measured data to be used. The program then calculates the nodal coordinates for each element in the grid and defines the nodal loads acting on the top surface of the structure as a uniformly distributed load acting at the interface between the bottom cover and the fabric or steel cord carcass. The nodes along the bottom edge are free nodes, except at the belt and idler interface where the nodes are forced to conform to the profile of the roll through a stepwise iterative procedure. The program then calculates the stiffness matrix for each element of the grid and assembles the stiffness matrix. Depending on the node, either the displacement or the load is prescribed in each coordinate direction. The equilibrium equations are solved by iterative means for the displacements at each node. The sum of the vertical forces acting on the nodal points within the contact zone is then compared to the required load distribution. An iterative procedure is undertaken to vary the depth of indentation until the sum of the forces acting on the roll surface in the indentation zone is equal to the force distribution applied at the bottom cover and carcass interface to within a nominated tolerance. The horizontal forces acting at the belt and idler roll interface are calculated by taking moments about the centreline of the roll of the vertical forces. The indentation rolling resistance factor is then calculated from the ratio of the sum of the horizontal to vertical forces. The load applied at the interface between the bottom cover and the carcass is derived from the load distribution acting on each idler roll. The load distribution is calculated from the belt deflection analysis and given by the sum of the normal forces acting along the length of the conveyor belt span for each transverse node, n. For the centre idler roll the normal force distribution is therefore given by
maxm
mn,mcnncn FF
1
where; 1 < n njunct (31)
While for the side idler rolls the normal force distribution is given by
maxm
mn,msnnsn FF
1
where; njunct < n nmax (32)

Copyright is vested with IMHC 16
4.3 Results
The following results are presented for the purpose of demonstrating the numerical analysis technique described. The results presented are for a natural rubber cover, 5mm thick with a shear relaxation modulus G(t) derived from the storage moduli, G' and the loss moduli G'' obtained from dynamic viscoelastic tests. Fig.9 shows the calculated indentation rolling resistance factor for a Ø150mm idler roll under simulated loads up to 2.5kN/m for a belt speed of 6m/s. The calculated relationship allows the total horizontal force due to the indentation rolling resistance to be calculated by integrating over the idler roll set given the normal force distribution from Eqs. (31) and (32).
0.000
0.002
0.004
0.006
0.008
0.010
0 500 1000 1500 2000 2500
Normal Force (N/m)
Ind
en
tati
on
Ro
llin
g R
esis
tan
ce F
acto
r
150mm Idler Roll
6m/s Belt Speed
20Deg.C Cover Temp
5mm Cover Thickness
Fig.9: Calculated indentation rolling resistance factor versus normal force Analysis has shown the importance of modelling the whole area affected by the indentation, including the lagging tail within the recovery zone, which can be over 100mm at high belt speeds. An underestimation of the length of the affected zone tends to overestimate the calculated rolling resistance since the full uplifting effect of the lagging tail is not accounted for. The results show good correlation to tests undertaken on a recirculating conveyor belt test rig at The University of Newcastle, where the roll diameter, vertical load, belt speed, bottom cover thickness and type of belt can be changed. 5 CONCLUSION This paper has discussed each component of the main resistance and provided methods to calculate the contribution of each component. In practice the iterative process to calculate the deflection of the conveyor belt is undertaken first. The flexure resistance of the conveyor belt and bulk solid per idler set is then calculated, as is the normal force distribution acting along the length of each idler roll. Given the normal force distribution the viscoelastic finite element model is then applied to calculate the indentation rolling resistance force per idler set. The resistance component due to the rotational resistance of the idler rolls is then added to give the total resistance per idler set. Due to the change in belt tension along the length of a conveyor the flexure resistance of the belt and bulk solid will vary and should be calculated over a range of belt tensions derived from a dynamic analysis. Belt tension has little influence on the indentation rolling resistance or the rotational resistance of the idler rolls.

Copyright is vested with IMHC 17
6 REFERENCES [1] Harrsion, A.: Dynamic Measurement and Analysis of Steel Cord Conveyor Belts, Ph.D
Thesis, Chapters 5 & 6, The University of Newcastle, Australia, 1984. [2] Timoshenko, S and Woinowsky-Krieger, S.: Theory of Plates and Shells, 2nd Ed.,
McGraw-Hill, New York, pp.84-86, 1959. [3] F, Krause and W, Hettler.: Die Belastung der Tragrollen von Gurtbandforderern mit
dreiteiligen Tragrollenstationen infolge Fordergut unter Beachtung des Fordervorganges und der Schuttguteigenschaften, Wissenschaftliche Zeitschrift der Technischen Hochschule Otto von Guericke, Magdeburg, Germany, Heft 6/7, 18 pp.667-674, 1974.
[4] Spaans, C.: The Calculation of Main Resistance of Belt Conveyors, Bulk Solids
Handling, Vol. 11, No.4, pp.809-826, 1991. [5] Palmgren, A.: Ball and Roller Bearing Engineering, SKF Industries, Inc, Philadelpia,
1959. [6] SKF Web Site: skf.com [7] Hager, M. and Hintz, A.: The energy saving-design of belts for long conveyor systems;
Bulk Solids Handling Vol. 13, No.4, pp.749-758, 1993. [8] Jonkers, C.: The indentation rolling resistance of belt conveyors: Fordern und Heben
Vol.30, No.4, pp312-318, 1980. [9] Lodewijks, G.: Dynamics of belt systems; Ph.D Thesis, Chapter 5, Delft University of
Technology, Netherlands, 1996. [10] Lynch, F.: A finite element method of viscoelastic stress analysis with application to
rolling contact problems; International Journal for Numerical Methods in Engineering Vol.1, pp.379-394, 1969.
[11] Batra, R., Levinson, M. and Betz, E.: Rubber covered rolls – The thermoviscoelastic
problem. A finite element solution; International Journal for Numerical Methods in Engineering. Vol. 10, pp.767-785, 1976.
[12] Christensen, R.: Theory of viscoelasticity an introduction, Academic Press, United
States, pp.7, 1982. [13] Wheeler, C.: Analysis of the Indentation Rolling Resistance of Belt Conveyors; Proc. 7th
International Conference on Bulk Materials Storage, Handling and Transportation, The University of Newcastle, Australia, pp559-567, 3-5 October 2001.
7 CURRICULUM VITAE The author is currently employed as a Lecturer in Mechanical Engineering at The University of Newcastle, Australia and undertakes industrial research and consulting work through The Centre for Bulk Solids and Particulate Technologies.