precipitation p: water (solid, liquid) falling from atmosphere to ground p includes rain, drizzle,...
Post on 22-Dec-2015
218 views
TRANSCRIPT

Precipitation
P: water (solid, liquid) falling from atmosphere to ground P includes Rain, Drizzle, Snow, Hail, Sleet, Ice crystals
Measurement: Container to collect P in a storm event Radar, digital recorders Accuracy depends on physical setting, disturbances…etc Weather data available from government agencies:
PME (MEPA), MWE (MAW), …

Formation Of Precipitation
Conditions:
1. Humid air cooled to dew-point T
2. Nuclei
3. Droplets to raindrops
4. Size of raindrops
Adiabatic expansion
due to pressure change


Standard Rain Gages (SRG)
Standard Rain Gages (SRG)
8 in (20.32 cm)
30
in (
76
.2 c
m)
Accuracy?

ESTIMATION OF PRECIPITATION OVER AN AREA
Effective Depth of Drecipitation (EUD)
1. Arithmetic average:
for evenly distribute stations (uniform density)
3. Thiessen method
area-weighted averaging
2. Isohyetal lines
contouring
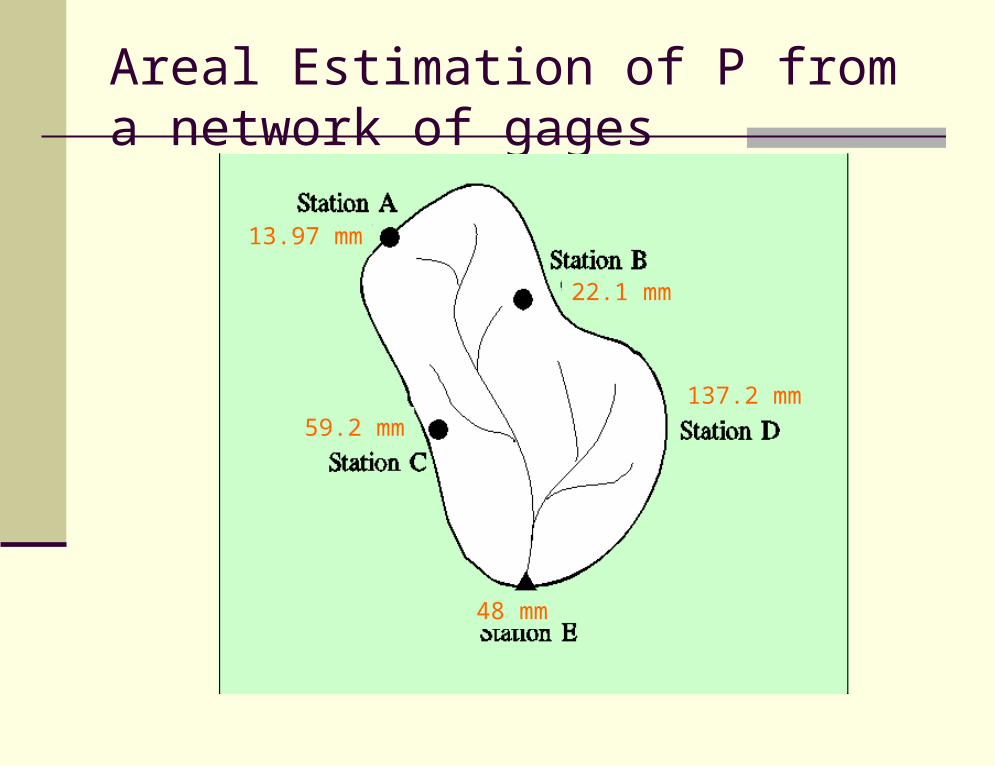
Areal Estimation of P from a network of gages
13.97 mm
48 mm
59.2 mm
22.1 mm
137.2 mm

(1) Arithmetic average
Pa = 1/N ∑ Pi
(13.97 + 22.1 + 59.2 + 48.0+ 137.2)/5
= 56.1

(2) Thiessen Polygon Method
Area-weighted average
(every gage represents best the area immediately around the gage)
Constructing Thiessen Network:
1. Plot stations on a map
2. Connect adjacent stations by straight lines
3. Bisect each connecting line perpendicularly
4. Perpendicular lines define a polygon around each station
5. P at a station is applied to the polygon closest to it

St.No P Polygon area
Weighted area
Weight-ed P
1 13.97 15 0.128 1.788
2 22.1 33 0.281 9.273
3 59.2 28.8 0.245 14.5
4 48 16.4 0.139 6.672
5 137.2 24.3 0.207 28.4
Totals 280.47
117.5 1.00 60.633

)3) isohyetal method
Based on areas calculated from contoured P map
(check first for effect of elevation by plotting P vs elevation)
STEPS:
1. Plot a contour map of P based on gage readings at station
2. Compute area between each successive contour lines
Pa = PaiAi/ Ai

Isohyetal method

Isohyetal method procedure
Determine contours of equal P:
(Isohyetal lines) Estimate representative P
for each region Calculate Pav
P = Pi*Ai/AT
= P(1)*A(1)/AT + P(2)*A(2)/AT + P(3)*A(3)/AT +P(4)*A(4)/AT
28
22
17
11
30
25
20
1526
)1()2(
)3(
)4(

Example
P was measured at several stations.
Characterize the precipitation over the area as the arithmetic average, Thiessen-weighted average, and isohyetal average.

Example, solution
1. Arithmetic average:
Pa = (4.5+4.4+4.4+4.1+4.0+3.7+3.5+2.5+2.7)/9 = 3.76 in

Example, solution2. Thiessen-Weighted average:

Example, solution3. Isohyetal Method:

Events During Precipitation
Interception (8- 35% for densely vegetated) Stem flow Infiltration
infiltration capacity how fast water is absorbed into soil. effected greatly by soil type. Water infiltrates faster into sand than it does
clay. Low infiltration capacity causes more runoff and
more erosion.

Depression storage
Overland flow (P rate > If rate)
Interflow (horizontal flow in unsaturated zone)
Baseflow

Evaporation

Evaporation
It’s the physical process by which liquid is transformed to gas (vapor) due to the release of the bonds holding the molecules together
In Hydrology: it’s the amount of water lost from soils and open water bodies to the atmosphere
Evaporation stops when air is saturated with moisture Absolute humidity:
Grams of water/cubic meter of air Saturation humidity
max amount of moisture air can hold at any T
Relative humidity:Absolute humidity/saturation humidity
H = H
HX100%R
A
S

Evaporation contd.
Dew point:T at which condensation will begin
Rate of E depends on: T (air), T(water), absolute humidity, wind.
Estimation and Measurement: No direct measurement Water budget method
E = I - O (+/-) S Evaporation pan
Standard: US weather service class A Pan

Evaporation estimation
4 ft (1.22 m)
10” (25.4 cm)

Evaporation Pan operation:
Pans placed on supports to allow air circulation A water depth of 7-8 in (18 - 20 cm) is maintained. Water depth in pan is measured with time Max, min, T recorded Water is added or removed from pan to adjust for
rain and E, its volume recorded E from a pan is higher than actual E from a lake Pan coefficient:
Empirical correction factor 0.58 – 0.78 (depending on month)
Transpiration
Mass transfer of water from ground to the air through plants
Transpiration can exceed evaporation in heavily wooded areas
Transpiration is only important during growing season (in cultivated areas)
wilting point: soil moisture is low causing surface tension of soil-water interface to exceed osmotic pressure water will not enter roots
Transpiration is measured in carefully controlled lab conditions Phytometer: is a sealed container partially filled w/ soil.
Transpiration is measured as the increase in humidity in the air space around the plant

Evapotranspiration (ET)
any transfer of moisture to the air 90% of P in arid regions! In field conditions, not possible to separate
evaporation from transpiration Potential ET: maximum evapotranspiration if
there is infinite supply of water available in the soil for the vegetation.
Actual ET: amount of ET under field conditions

Potential ET

Theoretical estimation (empirical formulas)
Thornthwaite's method
a =0.492+0.0179I – 0.0000771I2 + 0.000000675I3
ET is potential evapotranspiration in cm/month
Tai is mean monthly air temperature in C for month I
I is annual heat index
a is s constant
a
aiT I
TE
10
62.1
12
1
5.1
5i
aiTI

ET measurement
field measurementLarge watertight caisson buried in ground, filled w/ soil
and planted with vegetation.
Example 2.2

Infiltration
Overland Flow
Interflow

2.3 Infiltration, Overland Flow, and Interflow


2.5 Runoff Estimation- Rational Method
Q = C i A
Q: Peak discharge ft3/s
C: runoff coefficient
i : average intensity of rainfall (in/hr) for a selected frequency of occurrence or return period for the time of concentration (Tc) (min)
Tc: estimated time required for runoff to flow from most remote part of the area under consideration to the point under consideration
A: drainage area (acres)


Example 2.3
For a drainage area of 80 acres30% rooftops
10% streets and driveways
20% lawn on sandy soil
40% woodlands
Height of most remote point is 100 ft
Maximum travel length of 3000 ft
Calculate peak runoff from a 10-year frequency storm.

Example 2.3 solution
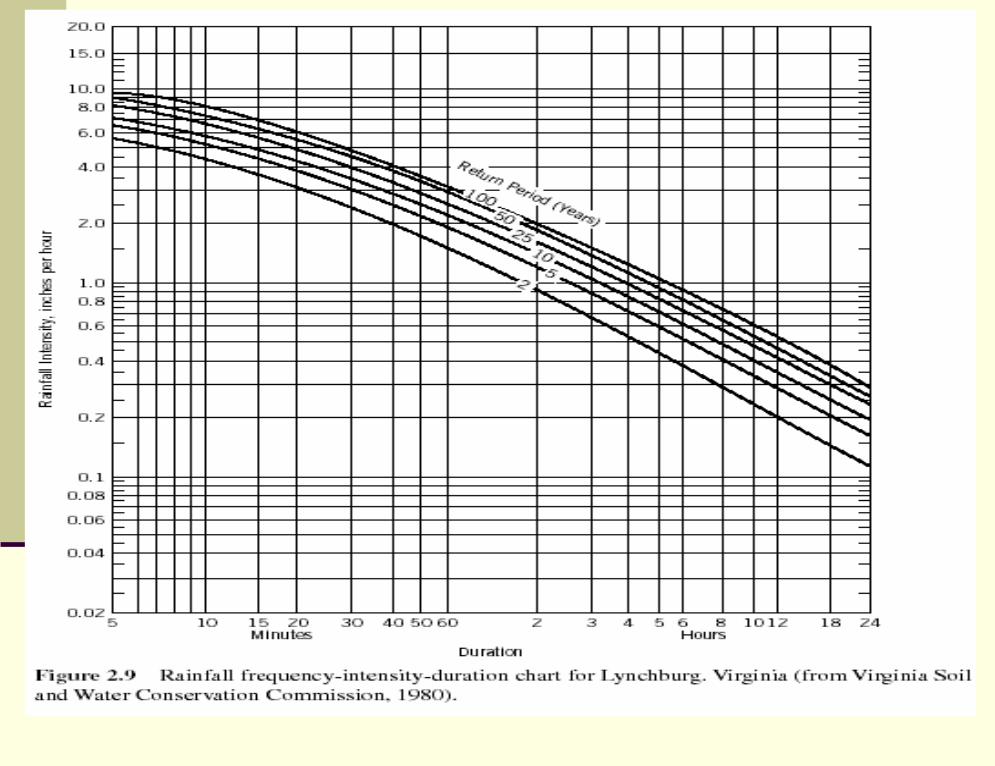
We need C, Tc, I
C = 0.43Tc from figure 2.8 = 14 mini from fig. 2.9 (for 10 year return period, 14 min duration) =
4.9 in/hr
Q = C i A = 0.43 x 4.9 x 80 = 169 cfs

Figure 2.8 Nomograph for estimating Tc for a small basin

Chapter Highlights
1. Precipitation can occur in different forms-rain, drizzle, snow, and sleet.
2. The standard U.S. precipitation gage and various types of recording gages (for example, tipping bucket) form the basis for regional, station-based measurements.
3. New NEXRAD radars provide a capability of continuous precipitation measurements over thousands of square miles.
4. Various statistical techniques are available to estimate average precipitation from several stations scattered across an area. Simplest technique is arithmetic average. More sophisticated Thiessen polygon and isohyetal methods provide different ways of weighting the individual data points according to their area of influence.

Chapter Highlights6. Evaporation and evapotranspiration lead to water losses from the
surface and subsurface. Evaporation from surface-water bodies is estimated from pan measurements. Evapotranspiration can be measured using a lysimeter. Empirical methods (for example, Thornthwaite, 1948) provide a useful alternative for estimating potential evapotranspiration.
7. Infiltration, overland flow, and interflow processes occur at or close to the ground surface. Of the precipitation falling to the ground, some fraction moves downward and enters the soil as infiltration. Sometimes a small proportion of infiltrated water flows in the unsaturated zone to a nearby stream as interflow. As a rainstorm continues, overland flow moves some of the water on the ground surface to nearby streams. All of these processes vary with time and space and depend on rainfall rate, soil characteristics, vegetation, and topography.
8. A key parameter of interest to hydrologists is the stream discharge, which is defined as the volume of water flowing past some location per unit time (units like ft3/s).