prasad - otago.ac.nz · current research-level b studies negative binomial regression model falls...
TRANSCRIPT

Trends, propensity score matching and
comparative safety using real world data
Prasad
Research in Pharmacoepidemiology (RiPE) @ National School of Pharmacy, University of Otago
Outline
• Background on real world data
• How are we using it for current research ?
• Initiatives in furthering research
• Conclusions
• Acknowledgments

Background
• Pharmacoepidemiology uses real world data to
answer effectiveness-how does a treatment
work in the real world?
• Randomised controlled trials demonstrate
efficacy-can a treatment work under ‘ideal
circumstances’

Background- Why use real world data?
• No inclusion/exclusion criteria
• Treatment outcome derived from actual practice
• Estimates of treatment impact are close to reality
• Not analysed by intent-to-treat vs ‘as treated’
• Provides insight to off-labelled use, prescribing behaviour
• Examine safety within the context of doses,
multimorbidity in special populations ( e.g. older people)

Background- Why use real world data?
“A clinical trial is the best way to assess whether an
intervention works, but it is arguably the worst way
to assess who will benefit from it” David Mant
Current research-How are we using real
world data?
• Level A studies- prescribing trend, adherence
• Level B studies- examining adverse outcomes
• Level C studies- comparative safety

Level A studies- prescribing trend, adherence

Current research-Level A studies
Prescribing trend
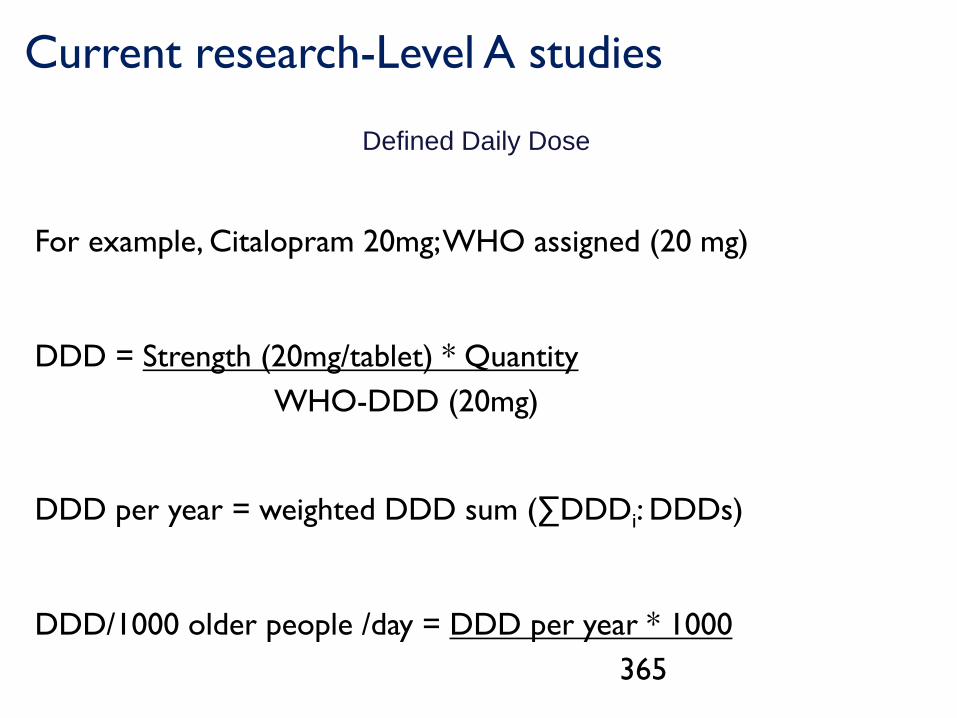
Current research-Level A studies
Defined Daily Dose
For example, Citalopram 20mg; WHO assigned (20 mg)
DDD = Strength (20mg/tablet) * Quantity
WHO-DDD (20mg)
DDD per year = weighted DDD sum (∑DDDi: DDDs)
DDD/1000 older people /day = DDD per year * 1000
365

Current research-Level A studies
0
20
40
60
80
100
120
140
160
0
20
40
60
80
100
120
140
160
DD
D/1
00
0 o
lde
r p
eo
ple
/da
y
Age groups in years
Utilization of antidepressant medicines normalized by gender and five-year age group
Female Male
2005 2013
Current research-Level A studies
0
20
40
60
80
100
120
140
0
20
40
60
80
100
120
140
DD
D/1
00
0 o
lde
r p
eo
ple
/da
y
Age groups in years
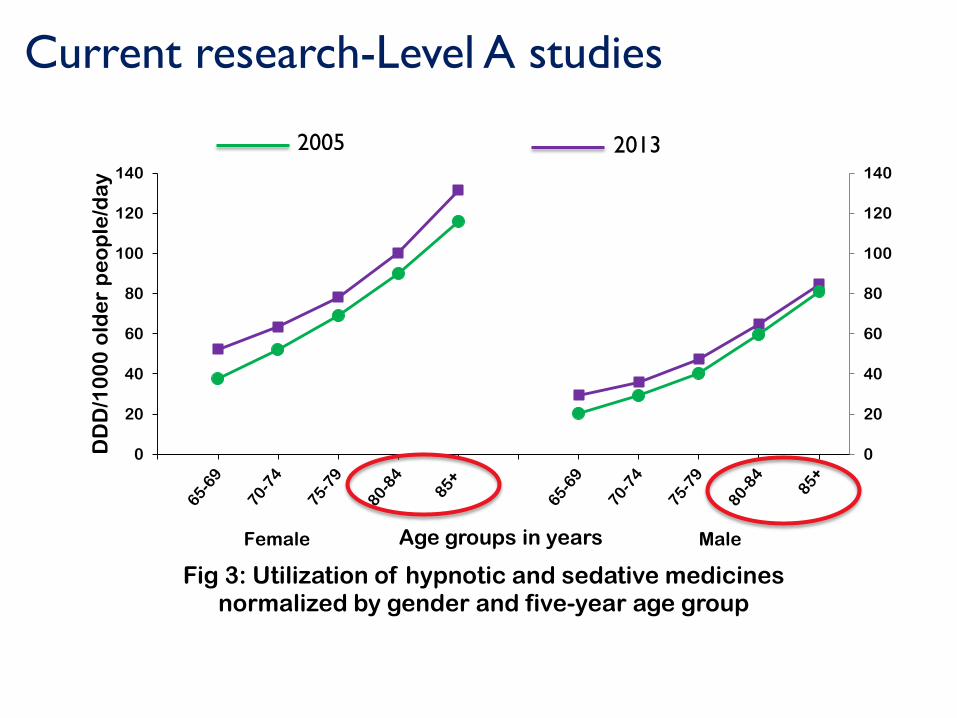
Fig 3: Utilization of hypnotic and sedative medicines normalized by gender and five-year age group
Female Male
2005 2013

Current research-Level A studies
Psychotropic drug utilisation (in DDD/TOPD) compared by therapeutic class and
subclass between 2005 and 2013 calendar years
Current research-Level A studies
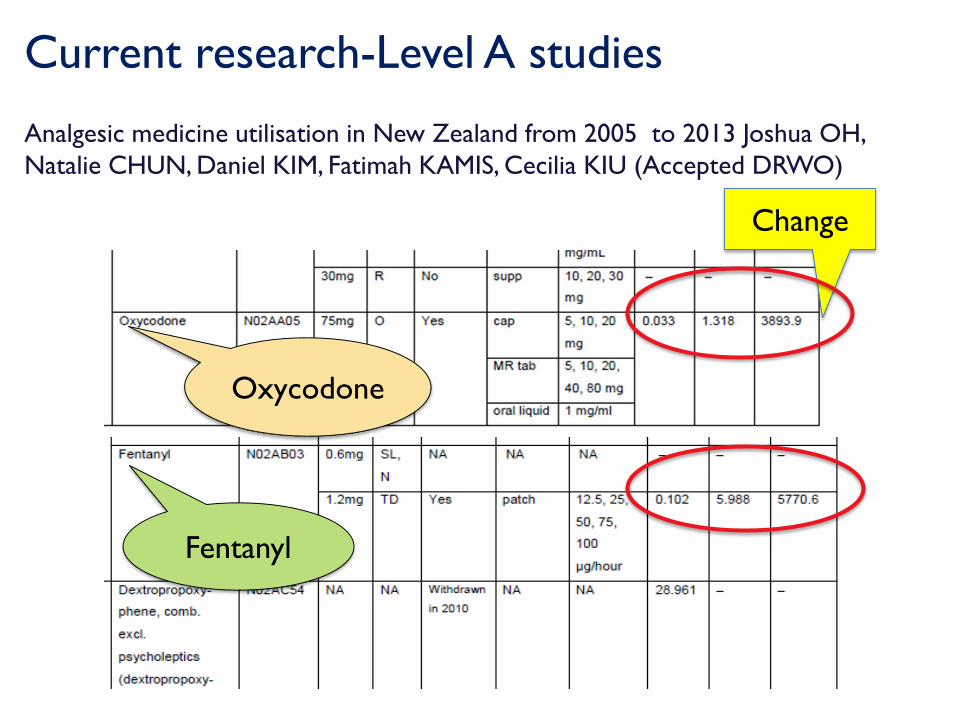
Analgesic medicine utilisation in New Zealand from 2005 to 2013 Joshua OH,
Natalie CHUN, Daniel KIM, Fatimah KAMIS, Cecilia KIU (Accepted DRWO)
Change
Oxycodone
Fentanyl

Current research-Level A studiesPreventive medicine utilisation in New Zealand from 2005 to 2013 Narayan et al
0
1000
2000
3000
4000
5000
6000
7000
8000
9000
10000
65-69 70-74 75-79 80-84 ≥ 85 65-69 70-74 75-79 80-84 ≥ 85
Dabigatran Warfarin
No
. o
f in
div
idu
als
Age categories
Dabigatran and Warfarin
2005 2006 2007 2008 2009 2010 2011 2012 2013

Current research-Level A studiesPrevalence of Potentially Inappropriate Medicine use in older New Zealanders: A
population-level study (>half a million) using the updated 2012 Beers criteria
Narayan et al
The updated
Beers 2012
criteria
uncovered that
a number of
older New
Zealanders
were prescribed
NSAIDs,
amitriptyline
and zopiclone.

Level B studies- examining drug exposures and
adverse outcomes

Current research-Level B studies

Current research-Level B studies
• The drug burden attributable to each anticholinergic
or sedative medication was calculated using the
equation,
𝐷𝑟𝑢𝑔 𝑏𝑢𝑟𝑑𝑒𝑛 = 𝐷 ÷ (𝜕 + 𝐷)
where D is the daily dose taken by the patient, and δis the minimum efficacious dose.
• The total drug burden for an individual was
calculated as the sum of the drug burden using a
linear additive model.

Current research-Level B studies
Characteristic
(n=537,387)
Value
(95% CI) Age (yrs) mean 74.72 (74.70-74.74)
Sex (% female) 54.90 (54.77-55.03)
DBI group (%) 43.22 (43.09-43.35)
DBI exposure
0.177 (0.176-0.178)
Polypharmacy (%) 55.58 (55.45-55.72)
Medicines 5.64 (5.63-5.65)
Chronic Disease
Score
6.04 (6.03-6.05)

Current research-Level B studies
N=537,387 DBI group (n = 232,291) Control (n = 305,096)
Sex
Male n(%) 103,031(44.4%) 139,295(55.6%)
Female n(%) 129,260(55.7%) 165,801(54.3%)
Ethnicity
NZ-European n(%) 192,488(50%) 232,690(76.2%)
Māori n(%) 9,903(4.2%) 15,386(5.0%)
Age groups
Group A n(%) 115,415(49.7%) 180,613(55.1%)
Group B n(%) 81,057(34.9%) 91,404(27.9%)
Group C n(%) 35,819(15.4%) 33,079(10.9%)
Polypharmacy
Value = 1 n(%) 54,742(23.6%) 183,925(60.3%)
Value = 2 n(%) 177,549(76.4%) 121,171(39.7%)
CDS scores
0-5 n(%) 104,005(33.0%) 178,365(58.4%)
6-10 n(%) 73,741(25.9%) 89,004(29.1%)
IMB
AL
AN
CE

Current research-Level B studies
𝑦~𝑁𝑒𝑔𝑏𝑖𝑛 𝜇𝑖, 𝑘
log𝜇𝑖=𝛽0+ 𝛽1𝑥1 + 𝛽2𝑥2 +⋯… .

Current research-Level B studies
Negative binomial regression model
Falls GP visits
NB Model
IRR (95% CI)
NB Model
IRR (95% CI)
Age (linear)
Age (quadratic)
1.366 (1.289-1.447)
0.998 (0.998-0.998)
1.021 (1.016-1.025)
0.999 (0.999-0.999)
Female 1.197 (1.135-1.263) 1.042 (1.038-1.046)
Ethnicity
European
Māori 0.852 (0.738-0.983) 0.972 (0.963-0.980)
CDS scores 1.043 (1.037-1.048) 1.021 (1.020- 1.021)
Polypharmacy 1.792 (1.659-1.936) 1.238 (1.232-1.244)
DBI>0 1.561 (1.476-1.651) 1.125 (1.121-1.129)
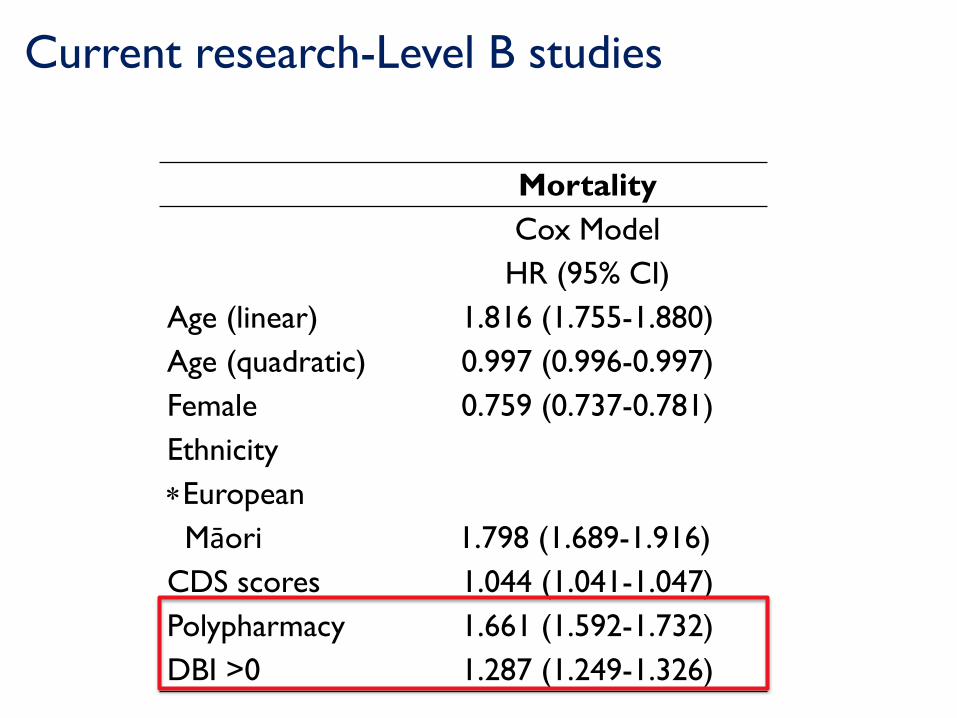
Current research-Level B studies
Mortality
Cox Model
HR (95% CI)
Age (linear)
Age (quadratic)
1.816 (1.755-1.880)
0.997 (0.996-0.997)
Female 0.759 (0.737-0.781)
Ethnicity
European
Māori 1.798 (1.689-1.916)
CDS scores 1.044 (1.041-1.047)
Polypharmacy 1.661 (1.592-1.732)
DBI >0 1.287 (1.249-1.326)

Current research-Level B studies
Using apposite regression models, we found that
higher DBI was associated with greater primary
care visits, falls and mortality
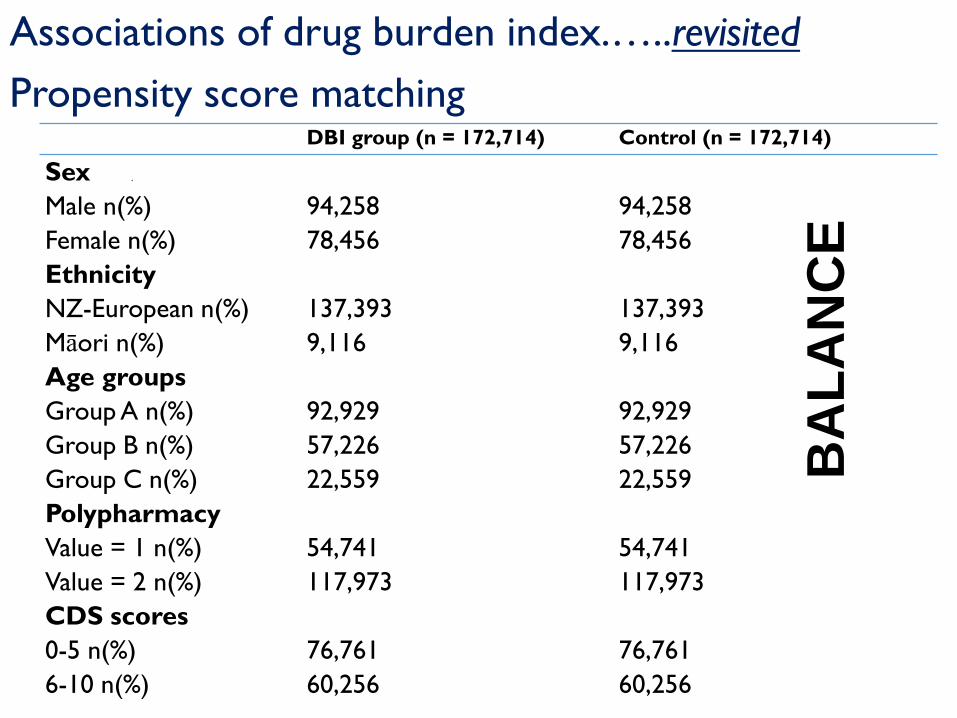
Associations of drug burden index.…..revisited
Propensity score matchingDBI group (n = 172,714) Control (n = 172,714)
Sex
Male n(%) 94,258 94,258
Female n(%) 78,456 78,456
Ethnicity
NZ-European n(%) 137,393 137,393
Māori n(%) 9,116 9,116
Age groups
Group A n(%) 92,929 92,929
Group B n(%) 57,226 57,226
Group C n(%) 22,559 22,559
Polypharmacy
Value = 1 n(%) 54,741 54,741
Value = 2 n(%) 117,973 117,973
CDS scores
0-5 n(%) 76,761 76,761
6-10 n(%) 60,256 60,256
.
BA
LA
NC
E

Propensity Score Matching
• Propensity score is the conditional probability of
receiving treatment given a set of pre-treatment
characteristics.
• Propensity scores are computed using Probit/Logit
models.
• Individuals in the treatment group are matched with
control group that have similar (or close) propensity
scores.

Propensity score matching
Ṕi= exp (βˆXi)
1+exp(βˆXi)
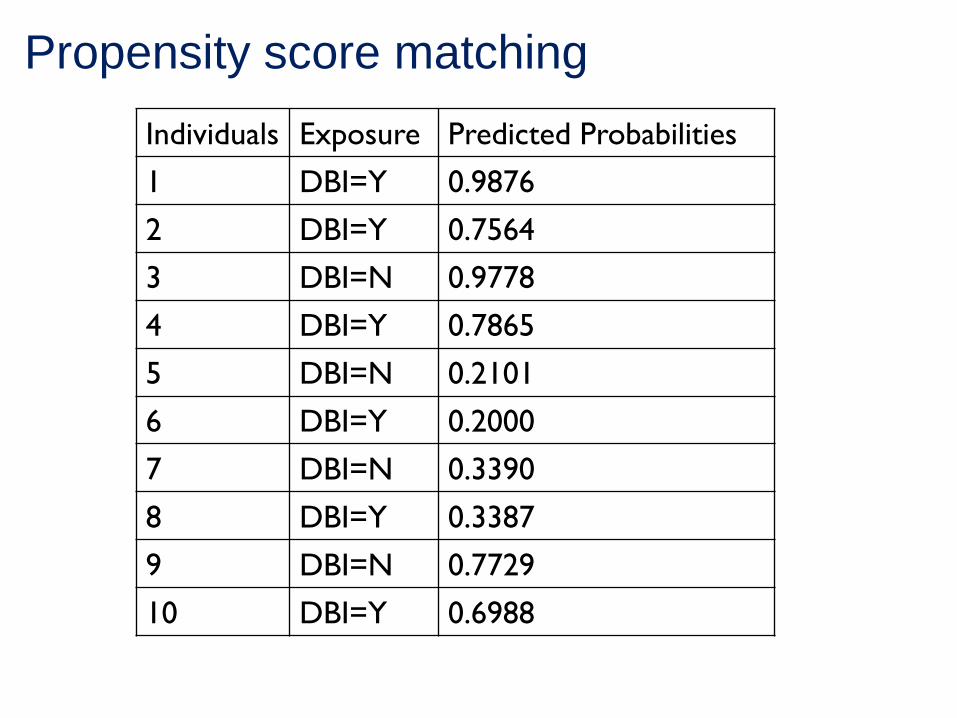
Propensity score matching
Individuals Exposure Predicted Probabilities
1 DBI=Y 0.9876
2 DBI=Y 0.7564
3 DBI=N 0.9778
4 DBI=Y 0.7865
5 DBI=N 0.2101
6 DBI=Y 0.2000
7 DBI=N 0.3390
8 DBI=Y 0.3387
9 DBI=N 0.7729
10 DBI=Y 0.6988

1
0.8
0.6
0.4
0.2
0
Nearest neighbour matching
Treated
group
Control
group

Treated group Control group
1
0.8
0.6
0.4
0.2
0
Kernel matching

Propensity score matching assumptions
Eq1 Y1=ū1 (X) + Z1 ū = Mean effect
Eq2 Y0=ū0 (X) + Z0 Z=error term
▲=(Y1-Y0)= {ū1 (X) -ū0(X)} + ū1-ū0
ATE
Eq3 Y=T*Y1 + (1-T)*Y0
if T=1, then Y=Y1, if T=0 then Y=Y0
Eq4 Y=Z0(X) + ▲ATE*T +{T(Z1-Z0)+Z0}
1. All confounders (X) have been accounted
2. No/minimal error terms
Heterogeneity
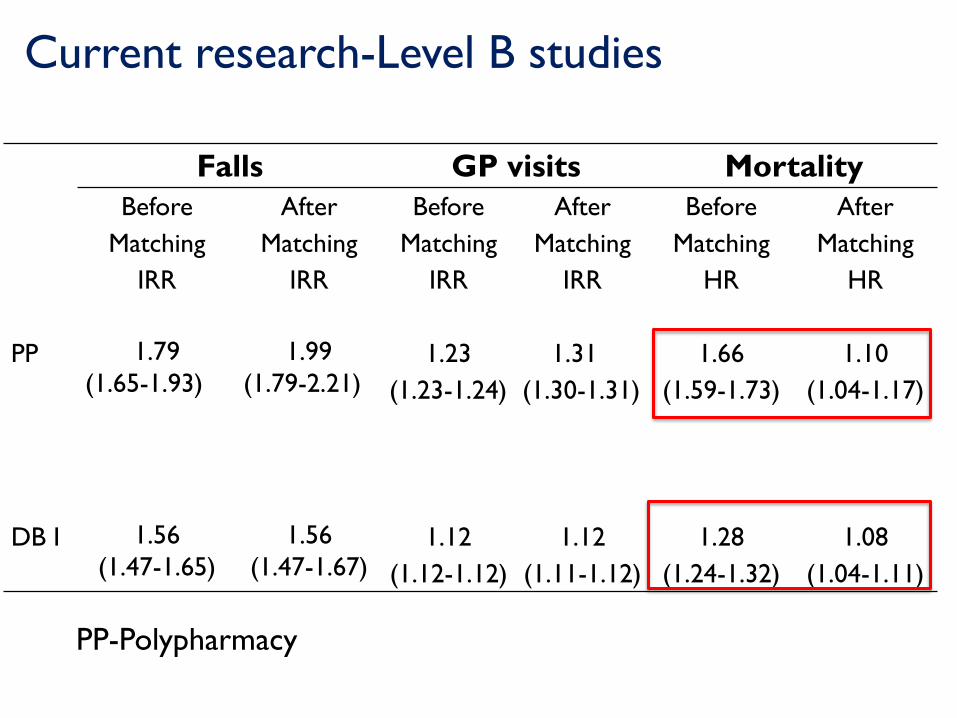
Current research-Level B studies
Falls GP visits Mortality
Before
Matching
IRR
After
Matching
IRR
Before
Matching
IRR
After
Matching
IRR
Before
Matching
HR
After
Matching
HR
PP 1.79
(1.65-1.93)
1.99
(1.79-2.21)1.23
(1.23-1.24)
1.31
(1.30-1.31)
1.66
(1.59-1.73)
1.10
(1.04-1.17)
DB I 1.56
(1.47-1.65)
1.56
(1.47-1.67)1.12
(1.12-1.12)
1.12
(1.11-1.12)
1.28
(1.24-1.32)
1.08
(1.04-1.11)
PP-Polypharmacy

Current research-Level B studies-
A Data linkage study:
Nishtala PS, Soo L. Proton pump inhibitors utilisation in older people in New
Zealand from 2005 to 2013. Intern Med J 2015.
National
Minimum
Dataset
≥65 years
1st January
2012 to 31st
December
2012
N= 121,568
Pharmaceutical
Collections ≥65
years
1st Jan 2012 to 31st
Dec 2012
N= 120,804
Binary Logistic
Regression
Two models
Adjusted Odd
Ratios P<0.05

Current research-Level B studies
Nishtala PS, Soo L. Proton pump inhibitors utilisation in older people in New
Zealand from 2005 to 2013. Intern Med J 2015.
• Short-term PPI (30-60 days) use associated with aspirin
and NSAID exposures
• Long-term (>180 days) PPI use associated with aspirin
exposure, NSAID exposure, gastritis/duodenitis, GORD
and increasing age

Level C studies- comparative safety

Current research-Level C studies
‘Real-world’ haemorrhagic rates for warfarin and dabigatran using population level
data
• New user design: Followed inception cohort using
warfarin or dabigatran for the first time
• Followed cohort for period of 18 months
• Estimated incidence rate ( person years),
incidence rate for 30 days and hazard ratios
• Propensity score matching

Initiatives for advanced research
• Marginal structural models: when you have a time
varying covariate
• Instrumental variables
Instrument variable Exposure
Unobserved confounders
Observed confounders
Outcome
Conclusions
• Real world data can provide evidence in special
populations ( e.g. older people) often excluded in
RCTs
• Real world data can account for comorbidity
• Support policy decisions
• Detect off-labelled & inappropriate medicine use

Acknowledgements
RiPE group CollaboratorsDr David Chyou Statistician
Chanaka Kaluarachchi Statistician
Sujita Narayan PhD Candidate
Henry Ndukwe PhD Candidate
Mohammed Salahudeen PhD Candidate
GrantsDEAN Fund
UORG
NZPERF
Lottery health
Research in Pharmacoepidemiology (RIPE) @ National School of Pharmacy, University of OtagoResearch in Pharmacoepidemiology (RiPE) @ National School of Pharmacy, University of Otago
•Professor Sarah Hilmer University of
Sydney
• Associate Professor Simon Bell Monash
University
•Associate Professor Timothy Chen
University of Sydney
•Dr Danijela Gnjidic University of Sydney
•Dr Carl Hanger University of Otago,
Christchurch
•Dr Hamish Jamieson, University of Otago,
Christchurch
•Dr Ibrahim Oreagba University of Lagos