practice does not make perfect: understanding...
TRANSCRIPT
Practice Does Not Make Perfect: Understanding Fertilizer
Mismanagement in Bangladesh through Leaf Color Charts∗
Mahnaz IslamHarvard University
August 8, 2014
PRELIMINARY DRAFT. PLEASE DO NOT CITE.
Abstract
This paper presents evidence to understand limitations in learning by farmers inusing fertilizers (urea), despite years of experience. The literature on learning in agri-culture has focused mostly on understanding how the process of learning takes placewhen a new technology is introduced. However, there is increased evidence that thereare barriers to learning even in cases where the technology has existed for a long time.Using data from a field experiment I ran in Bangladesh in 2012-2013, I study whetherthere is evidence for mismanagement of urea and identify some of the errors that farmersmake. In the experiment, I provide rice farmers in the treatment group with a simpletool (leaf color chart) to improve the management of urea fertilizers. Although thereare challenges in using urea efficiently due to its high potential for waste, even withoutthis tool farmers may have learned to reduce wastage by paying attention to the timingof urea applications. I find that farmers save urea by 9% on average when they gainaccess to a leaf color chart, and in addition they benefit from an increase in yield of10%. The results show a failure to learn how to effectively apply urea earlier. Resultsalso show that farmers apply urea too early in the season, during a period when it islikely to be wasted, and that there is significant scope to save urea even for farmerswho apply the lowest quantities of urea at baseline, potentially through improving thetiming of the application. Moreover, the largest gains come from farmers who wereperforming relatively better at baseline.
∗I would like to thank Rohini Pande, Rema Hanna, Richard Hornbeck and participants of theHarvard Development Economics Lunch for useful comments and suggestions. Please direct corre-spondence to mahnaz [email protected].
1 Introduction
In this paper, I explore whether there are limitations in learning by farmers in using chemical
fertilizers, despite years of experience, using data from a field experiment that I ran in
Bangladesh in 2012-2013. The literature on learning in agriculture has focused mostly on
understanding how the process of learning takes place when a new technology is introduced.
The production function of a new technology is usually unknown but individuals learn over
time as they and those around them gain experience in using the technology (Besley &
Case 1993; Foster & Rosenzweig 1995; Conley & Udry 2003). However, there is increased
evidence that there are barriers to learning even in cases where the technology has existed
for a long time, and that farmers may remain far from the production frontier as they fail
to optimize the use of inputs despite considerable experience (Hanna at al 2014).
In agriculture the process of learning may be particularly complex. Farmers make de-
cisions on a wide range of factors such as the variety of seeds, timing of planting, crop
spacing, inputs including irrigation, various fertilizers, pesticides and so on. For each of
these inputs, farmers may need to learn about the right quantity, the correct timing and
the proper method of application. The optimal application may also depend on the deci-
sions farmers make on other inputs, and vary by plot quality and weather. Therefore, it
is challenging to understand how well farmers learn over time and whether they could still
benefit from outside advice, particularly once they have considerable experience. This ques-
tion is important from a policy perspective as considerable resources are devoted towards
agriculture extension (Purcell & Anderson 1997; Uddin 2008). For instance, agriculture
extension workers will have more knowledge overall compared to farmers, however, farmers
may have more knowledge about their specific plots.
In this paper, I explore some of these questions using a field experiment with rice
farmers in Bangladesh, focusing on the management of urea (nitrogen fertilizer). Urea is
a commonly used fertilizer that farmers have had decades of experience in using, since its
popularization during the green revolution. Due to its inherent volatile properties, there
is scope to use urea wastefully, however, farmers can learn to reduce wastage by paying
attention to the timing of application of the fertilizer. I study whether there is evidence
1
for mismanagement of urea and identify some of errors farmers make. I also quantify the
magnitude of the potential errors and present some preliminary evidence on the type of
farmers who are more responsive to help provided through the experiment on improving
the management of urea.
In the study, I provide farmers in the treatment group with a tool called a leaf color
chart (LCC) that can help with the management of urea. Unlike other fertilizers, urea
does not stay in the soil too long and is lost to the air or through run off, depending on
environmental conditions. For this reason urea is typically applied several times throughout
the growing season. If urea is applied at a time when the crop does not need much nitrogen,
and if the nitrogen is not absorbed soon after application, it may not be available in the
soil by the time the crop needs the nutrient. Farmers can reduce wastage by improving the
timing of urea application so that urea is applied when the crop can immediately take-up
a lot of nitrogen, i.e. when there is shortage of nitrogen by the crop as can be identified
from light green and yellowish colored leaves. Crops that have sufficient nitrogen have dark
green leaves.
A LCC is a simple tool that allows farmers to understand whether urea is needed by
the crop. It is a plastic, ruler-shaped strip containing four panels that range in color from
yellowish green to dark green, which can be used to determine if the crop has sufficient
nitrogen. In this study, through a randomized control trial, I provided farmers in the
treatment group with a leaf color chart as well as basic training on how to use the chart.
Prior to the intervention, I conducted a baseline survey focused on inputs used and yields
obtained in the Boro (dry) season of 2012. The distribution of LCCs and training sessions
were held at the beginning of the Boro season of 2013 followed by a detailed endline survey
after harvest. During the 2013 season, several short midline surveys were also conducted on
a sub-sample to understand time use by farmers. During the training sessions, treatment
farmers were instructed to compare the color of the rice crop leaves with the LCC before
applying urea and encouraged to apply the fertilizer only when the crop was deficient in
nitrogen. Even without an LCC, leaf colors are observable to the farmers, therefore with
experience they may have been able to pay attention to color of the leaves to adjust urea
applications accordingly. Therefore, this is a unique context to understand if there are
2

shortcomings in learning and if these shortcomings can be overcome with tools to supplement
their knowledge.
I find that there is considerable scope for improvement and gaps in learning in several
dimensions. I first estimate the intent-to-treat effect of gaining access to an LCC on urea use
and yields by using a difference-in-difference estimator. This estimates the average effect
of receiving the treatment (whether or not farmers take it up) by comparing the average
change over time in urea use and yield for the treatment group in comparison to the average
change over the same period for the control group. The experimental design of the study is
essential in this setting to estimate the causal effect of getting access to an LCC, to ensure
that the results are not driven by other non-related changes over time in urea use or by
any systematic differences between the treatment and control groups. I find that farmers in
the treatment group reduce urea use by 0.091 kilograms per decimal1, which is a decrease
of about 9% compared to baseline levels and they improve yields by about 0.073 mons per
decimal2, which is approximately an increase of 10%. These regressions include controls
for individual and household specific characteristics, but the results are consistent when
the controls are excluded and also in an alternative specification using logs of urea use and
yield instead of levels. These results establish that substantial inefficiencies exist in the way
farmers typically apply urea fertilizer; despite using more urea on average they obtain lower
yield.
I also identify specific changes in the behavior by farmers in applying urea, using data
from the midline surveys in 2013. These surveys collected data on the dates of urea applica-
tions and quantities applied on each date. I find that farmers in the treatment group tend
to delay the first application of urea until 21 days after planting instead of applying earlier
in the season when returns to this fertilizer are low3. The savings in urea for the treatment
group, observed in the main data, can be explained by a reduction in urea application in
the unproductive period. Within the correct urea application period, I find no significant
difference in the quantity of urea applied by the two groups which suggests that treatment
11 acre = 100 decimals21 mon = 40 kilograms3Extension workers recommend that urea should be applied 3 times during the period between 21 days
after planting date until a month before harvest
3
farmers may improve the timing of urea application within the this period and increase
the quantities that the crops can effectively absorb, which in turn generates the increase in
yield. However, it is not possible to observe this directly with the available data.
The results show substantial gains on average by farmers, however, it is important to
understand what happens to farmers at different points of the distribution of both urea
use and yield. One reason to explore this further, is that there is significant variation in
quantities of urea used by farmers at baseline so the response for farmers using the smallest
quantities of urea may be different from those using the largest quantities per unit of land.
I run quantile regressions of both urea use and yields to study how these distributions
shift due to treatment. The analysis shows that farmers at all levels of the distribution
reduce urea without sacrificing yields, indicating that there is scope for reducing wastage
at all levels. Quantile regressions are helpful in understanding how the two distributions
of urea and yield change due to the treatment, however, farmers at the bottom of the
distribution of urea use may not necessarily be at the bottom of the distribution for yield.
To look at changes for the same farmers, I compute average urea use and average yield for
each household at baseline and then generate quartiles for both urea and yield. I estimate
treatment effects on urea use and yield for each of these quartiles. These results indicate
that at baseline some farmers do make use of local knowledge of their plots, and they
perform better than they would if they followed regional urea recommendations, suggesting
learning by farmers on plot quality. Interestingly, The largest gains from the LCCs also
seem to come from farmers who were already performing relatively better at baseline.
The paper is organized as follows. Section 2 provides background on the cultivation
of rice in Bangladesh and discusses the challenges of using urea efficiently and how leaf
color charts can help the process. Section 3 describes the the experimental design. Section
4 presents the treatment effects of gaining access to an LCC on urea use and yields and
explores possible changes in fertilizer application practices that explains the results. Section
5 explores the changes in the distribution of urea and yield caused by the treatment and
identifies the areas the distribution that drives the main results. Section 6 discusses possible
explanation for the failure to use urea more efficiently and Section 7 concludes.
4

2 Context and Experimental Setting
2.1 Rice Farming and Urea Use in Bangladesh
In Bangladesh, agriculture remains one of the most important sectors, characterized by a
large number of small farmers. The agricultural sector contributes 21% to the GDP and
employs about 50% of the labor force (BBS 2009). Rice is the staple food of the population
of about 160 million and provides over 70% of direct calorie intake in the country (Alam, et
al 2011). About 13 million agricultural households are involved in rice cultivation and they
grow different varieties of rice, including traditional, modern and hybrid varieties. Since the
green revolution, use of high yielding varieties of rice have become widespread particularly
in the Boro (dry) season. The use of urea fertilizers have also been common since this
period. Rice crop yield has grown from 0.76 tons per acre in 1970 to 1.9 tons per acre in
2012. The increase occurred mainly due to the use of high-yielding varieties that require
higher levels of fertilizers as well as a considerable increase in irrigation. Urea (nitrogen)
fertilizers have been used most widely and in the highest quantities but use of non-urea
fertilizers have also increased in the last few years after subsidies were introduced. Overall,
the use of fertilizers have increased by 400 percent in the last 30 years (Alam et al 2011;
Anam 2014; BBS 2012).
Although the increase in yields have been high, a rapidly growing population puts pres-
sure to continue to improve yields as self-sufficiency in rice production is a politically impor-
tant goal. At the same time, there are rising concerns about the sustainability of current
methods of cultivation and concerns for the environment, partly due to the high use of
fertilizers and pesticides. Despite the large gains in productivity and intensive use of in-
puts, a gap remains between potential yield4 and actual yield achieved by farmers, known
as the yield gap (Alam 2010; Begum et al 2010; Ganesh-Kumar et al 2012. A high yield
gap implies that there is still scope for improvement through better management of inputs.
A persisting yield gap also suggests that despite decades of learning and experience, there
are shortcomings in learning by farmers and possibly potential mistakes in management of
inputs that persist.
4Yield obtained in demonstration/test plots by agricultural specialists using existing technology
5
2.2 Is Urea used Inefficiently?
Although use of chemical fertilizers is high on average, it is not clear from the academic
literature on whether there is overuse of urea overall in Bangladesh, although extension
workers often use the term overuse to explain levels of use of the fertilizer. Due to a lack of
strong evidence in the literature, I look at the levels of use of urea in the baseline data of
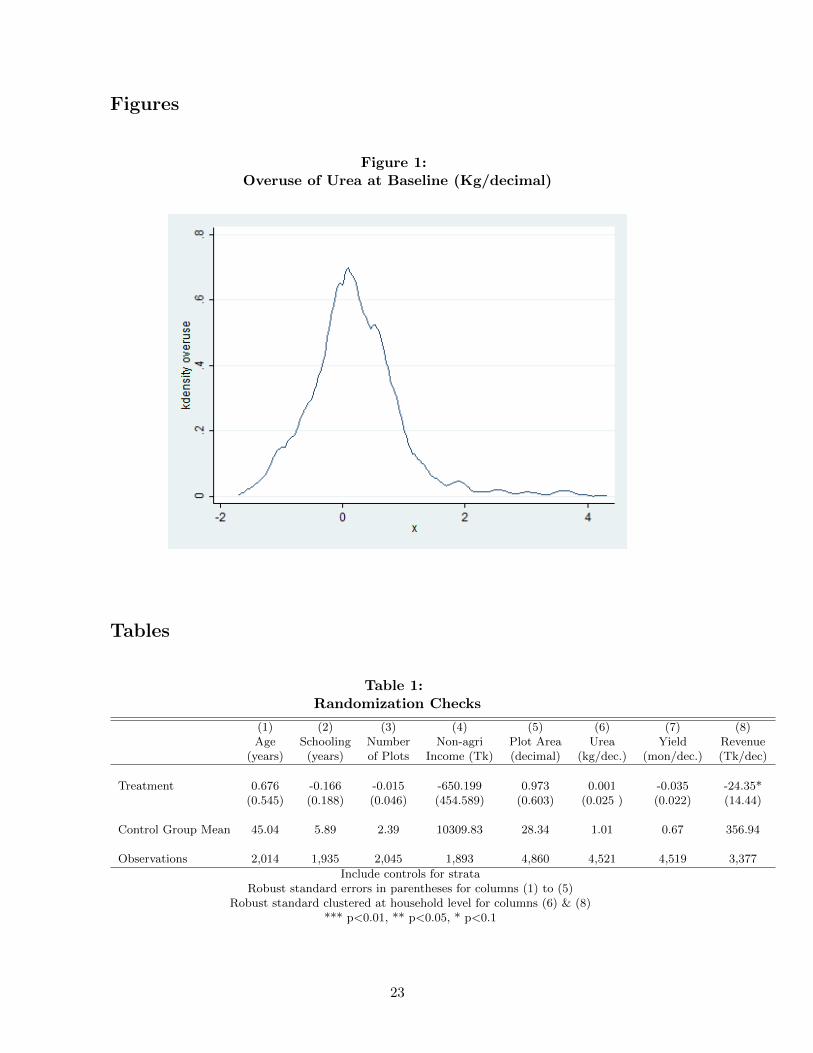
this study to understand whether there is evidence for overuse or underuse. Figure 1 shows
the kernel density of overuse of urea by farmers in the study locations for this paper based
on data from the baseline survey. To compute overuse, I obtained urea recommendations
at the union5 level, based on the union, the variety of rice and depth of the plot of the
farmer, from the website of Soil Resource Development Institute (SRDI) that generates
fertilizer recommendations based on soil nutrient profiles the region. If recommendations
for a union are not available on the SRDI website, national level recommendations were
used from the Fertilizer Recommendation Guide 2005 (BARC 2005). For each plot of land,
overuse is defined as the recommended quantity of urea for the plot subtracted from the
amount of urea used by farmers in the plot as reported in the baseline survey. I standardize
the quantities of urea applied to kilograms used per decimal of land6 and plot the kernel
density in Figure 1.
The figure shows that on average farmers overuse urea but that the majority are close to
the recommended level of use. However, there is considerable variation and there are farmers
who overuse and underuse suggesting that there may be room for improvement.7. Assuming
that regional recommendations are accurate and farmers follow the recommendations, they
may still be able to improve urea management as both quantity and timing of application
of urea is important.
Urea is particularly challenging to use, as the timing of the application plays an im-
portant role. Non-urea chemical fertilizers are applied once during field preparation and if
5A union is the smallest rural administrative and local government unit in Bangladesh is usually consistsof a group of nine villages
6100 decimals equal one acre. Since plot sizes in Bangladesh are small, I use decimals instead of acres inthis paper
7It is possible that this graph simply captures variation in plot quality as there may be differences insoil fertility (due differences in nutrients, pH, organic matter etc) even within a small geographic area. Iffarmers behave optimally regarding fertilizer management, then we should not observe any improvements inoutcomes by changing urea application, which is not the case
6
unused some of the fertilizers are retained by the soil which improves quantity of nutrients
available for crops in the next season. However, much of the urea applied can be wasted as
urea is very volatile and can leave the soil fairly quickly. Once urea is applied, the nitro-
gen introduced in the soil constantly cycles among its various forms, including ammonia,
nitrate and ammonium, and much of the nitrogen can be lost from conversion of ammonia
and nitrate to nitrogen gas, as well leaching downwards and run-off away from the roots.
The rate of loss depends on soil pH, temperature, moisture and other soil properties and
there will vary across plots and over seasons (Chowdhury & Kennedy 2004, 2005; Koenig
et al 2007). Due to the potential quick loss, traditionally urea is applied in two to three
separate applications a few weeks after planting and until the paddy comes out a month
before harvest. Depending on the rate of loss, if urea is applied at a time when the crop
does not require much nitrogen most of it can be wasted. If farmers are unable to account
for differences in urea needs across plots and seasons and time the application of urea well,
then they will use urea very inefficiently and obtain sub-optimal yield even though they are
using high levels of the fertilizer overall. Therefore, farmers need to have an understanding
of the urea needs of the plot and may need to adjust application depending on the temper-
atures and irrigation and given the potentially high level of noise in yields it be be difficult
for farmers to learn how to improve efficiency of urea use.
2.3 Leaf Color Charts as a Tool to Improve Efficiency
The Leaf Color Chart (LCC) is a simple tool that allows farmers to understand whether
urea is needed by the crop at any point in time during the urea application period. It is a
plastic, ruler-shaped strip containing four panels that range in color from yellowish green to
dark green, which can be used to determine if the crop has sufficient nitrogen, as nitrogen
deficient leaves are yellowish-green in color and they become darker green when they attain
sufficiency. Rice farmers in Asia usually apply nitrogen fertilizer in several split applications
during a season. With an LCC, before any application, farmers can compare the color of
the paddy leaf to the chart. If the color matches the lighter shaded panels on the chart
then nitrogen fertilizer should be applied and if the color matches the darker shades no
additional nitrogen fertilizer is needed at that time. Therefore, farmers get a signal in real
7
time to determine if nitrogen fertilizers are needed at any point during the growing season.
This allows nitrogen to be applied more precisely and reduce wastage as they will apply at
a time when uptake by crops will be high (Alam et al 2005; Buresh, 2010; Witt et al, 2005).
The Department of Agricultural Extension in Bangladesh has been engaged in efforts
to popularize LCCs through a pilot project, although they are not available in the market
yet (DAE 2011). The literature on LCCs in agricultural journals usually finds an increase
in returns either through substantial reduction in use of nitrogen fertilizers without any
reduction in yields, or through substantial reduction in nitrogen fertilizers as well as im-
provements in yields (Alam et al., 2006; Alam et al., 2005; Balasubramanian et al., 2000;
Islam et al., 2007; Singh et al., 2002). However, many of the studies are from demonstration
plots which were closely supervised by agricultural workers. If farmers are given LCCs and
basic training, it is not clear if they would choose to adopt and use LCCs and also whether
they would be able to use it effectively. It is also important to note that LCCs will only be
change urea use or yields if farmers are unable to learn how to time urea application well
on their own, which they may have learned to do through experience.
3 Experimental Design, Intervention and Empirical Strategy
I conducted this study in partnership with the Center for Development Innovation and
Practices (CDIP), a non-government organization in Bangladesh. CDIP is primarily a
micro-finance institution that also has programs in education in their program areas. The
study was implemented across 20 CDIP branches spread across 21 sub-districts in 8 districts
of Brahmanbaria, Chandpur, Gazipur, Lakhipur, Munshiganj, Naranganj and Noakhali.
Approximately, one-third of the sample was drawn from CDIP micro-finance clients and
the remaining two-thirds of the sample were drawn from farmers residing in villages with a
CDIP school. The farmers from these villages, may or may not be directly connected with
CDIP.8
I conducted a baseline survey in September-October 2012, for 1440 farmers. The survey
collected data at the plot level on all crops grown in the past year by season. The survey
8Sample drawn this way for logistical purposes, and based on preferences stated by CDIP.
8
focused on the Boro season of 2012, and also included information for the season on all
prices and all inputs including fertilizers. A “short” survey was also conducted on an
additional 603 farmers in December 2012.9 I stratified by CDIP branch and type of sample
(CDIP microfinance clients and farmers from villages with CDIP schools), and randomized
at the individual level. Table 1 shows some randomization checks, and compares differences
between the treatment and control groups at baseline. There is no significant differences
between the two groups for average age, years of schooling, number of plots farmed, non-
agricultural income of the household, total plot area cultivated, urea use or yield, however,
revenue is lower for the treatment group by Tk 24 per decimal of land for the treatment
group that is significant at the 10% level. Randomization check conducted on 15 other
variables (not presented) showed no significant differences between the two groups.
Treatment farmers were invited to attend a training session in their village in January
2013. The training session was organized by local CDIP staff and led a an extension worker
or officer invited from the Department of Agricultural Extension (DAE). During the session,
each farmer received a leaf color chart and instructions on how to use the chart. CDIP staff
conducted home visits for farmers who did not attend the training, to provide the lcc and
instructions. The training sessions were generally held before planting. CDIP staff also
conducted a more informal refresher training (individually with farmers or in small groups)
a few weeks after the main training (before the time urea is generally applied).
CDIP staff later visited farmers to conduct midline surveys and take photographs of the
rice fields, but during the follow-up visits they were asked not to mention LCCs, except the
final visit after the fertilizer application period had ended. At the end of the survey, farmers
were asked if they had used the LCCs. Data for the midline surveys were collected during
the fertilizer application period. These short surveys focused on how farmers spend their
time, either in the form of a simplified time diary or questions on a seven day recall, where
farmers were asked how much time they spent on various agricultural activities in the last
seven days. Some midline surveys also included question on fertilizers applied during the
9Due to delays in receiving funding for the project the longer baseline could not be conducted for allfarmers. Since the intervention had to be completed by January 2013, there was not enough time to conducta longer baseline survey for the additional farmers included. New farmers were added to the study byincluding additional CDIP branches and following the same guidelines in selecting farmers.
9
season. At the end of each midline survey, the enumerator visited the field and took samples
of leaves from a randomly selected plot. After coming back, the enumerators photographed
three leaf samples against an LCC to keep a record of the leaf colors. Midline surveys were
conducted on about 67% of the sample due to funding constraints.
An endline survey was conducted for all farmers after harvest from June to August 2013.
I implemented the endline survey through an independent survey company, that had not
been involved in the interventions or previous data collection to ensure that there would
be no bias. The survey was similar to the “long” baseline survey, and collected detailed
plot-level information for all farmers in the study. The survey also included questions to
determine cognitive skills (math test, Raven’s test), risk preference, time preference, and
questions on household assets. During the endline survey, farmers were also asked whether
they received an LCC, whether they attended the main training, whether they used the LCC
during the season and were also asked to show their LCC (if they said they had received
one).
Table 2 shows the treatment group farmers were much more likely to receive the LCC,
attend training, use the LCC and could show the LCC to enumerators. About 73% of the
treatment group stated they received, which reflects limitations in the distribution mech-
anism. 7.8% of the control group also states they received an LCC, most likely through
government extension workers. The primary farmer in the household is the person inter-
viewed at the endline survey and only 56% attended the DAE training session. Qualitative
interviews with some of the farmers later on, usually revealed that in many of these cases,
the primary farmer was away from the village or working in an additional occupation during
the training and a family member attended training as his representative, as CDIP records
indicate almost full attendance during training, however, the representative often failed to
explain how the LCC works to the farmer. 49% of the treatment farmers stated they used
the LCC compared to 5.5% of the control group farmers.
For the analysis in the paper, I estimate the ITT effect of getting access to an LCC.
I estimate the effects on urea use and yield, by using a difference-in-difference estimator
(Equation 1).
10

ypht = β0 + β1Treatmenth + β2Postt + β3Treatment ∗ Postht + ρXht + εpht (1)
ypht is yield per decimal or urea used per decimal in plot p for household h at time
t. Treatmenth takes a value of 1 if the household was assigned to receive an LCC and
0 otherwise. Postt is 1 for the observations from the endline survey and 0 if its from
the baseline. Xht includes controls for household and individual specific characteristics
including age and years of education completed by the farmer interviewed (primary farmer
in household), total plot area cultivated by household, non-agricultural household income,
variety of rice as well as strata fixed effects. εpht is the error term. Standard errors are
clustered at the household level. Since assignment to receive an LCC was random, β3
estimates the causal effect of getting access to an LCC. This coefficient estimates the average
effect of receiving the treatment (whether or not farmers take it up) by comparing the
average change over time in urea use and yield for the treatment group in comparison to
the average change over the same period for the control group. The experimental design of
the study is vital in this setting for two key reasons. Environmental conditions, prices of
inputs, and a wide variety of other factors can vary from season to season and also affect
yields, so it is essential to have a control group we follow over the same period in order to
isolate the effect of the treatment from the effect of other changes. To estimate the causal
effect of the treatment, it is necessary to ensure that there are no systematic differences
between the treatment group and control groups other than getting access to the treatment,
and random assignment to treatment is effective in ensuring this.
4 Main Results
4.1 Treatment Effects on Urea, Yield & Returns
Table 3 shows the ITT of gaining an LCC through the intervention on urea used and yield
attained by farmers. Columns 1 & 4, shows the treatment effects without any additional
controls. Controls for age and years of education of the farmer, non-agricultural family
11

income, total area cultivated by the farmer, the variety of rice cultivated on the plot and
strata, are included in the rest of the regressions. Household fixed effects are also included
in columns 3 & 6. The unit of observation is a plot and all regressions are clustered at the
household level. Column 2, shows that having access to leaf color charts result in a decrease
in urea use of 0.091 kilograms per decimal (significant at the 1% level). The coefficient is
not significantly different without other control variables (Column 1) or when household
fixed effects are included (Column 3). This is equivalent to an 9% decrease in urea use
on average. Average area cultivated by farmers is about 82 decimals, so farmers in the
treatment group save about 7.5 kilograms of urea on average, which is a savings of Taka
150 (USD 1.92).
Column 5, shows that getting access to LCCs lead of an increase on yield of 0.073 mons
per decimal (statistically significant at the 5% level), which is an increase of 10% from the
mean baseline yield. The mean price of rice is Tk 600, so for average plot holding of 82
decimals, there is a gain of Tk 3592 in revenue (USD 46.0). However, when household
fixed effects are introduced, the coefficient is smaller and less precise. Estimates from an
alternative specification using logs of urea per decimals and logs of yield per decimal is
shown in Table A2. The results are consistent overall, however the estimates for effect of
urea have a larger magnitude while that for yield have a smaller magnitude. Based on these
estimates, urea use decreases by 13% (significant at 1% level) and yield increases by 5%
(significant at 10% level) for the second specification without household fixed effects.
I also estimate the effects on total revenue, costs and profits for the farmers. As discussed
in the section above above, price data of inputs and details on quantities used for non-
fertilizer inputs are only available at the baseline for the “long survey” sample of farmers
so I estimate two sets of regressions. Columns 1 to 3 of Table 4 shows the difference-in-
difference estimates for revenue, total cost and profits for farmers for whom all data are
available. The difference between the treatment and control groups at endline are estimated
for all farmers in the study and columns (4) to (6) shows the estimates for revenue, costs
and profits.
For the sample for whom price data are available, revenue increases by Tk 49.1 per
decimal (signicant at 10% level), total cost is higher by Tk 8.5 per decimal for the treatment
12
group but it is not significant. Profits are higher by Tk 39.6 per decimal, which is significant
at the 5% level. Using endline data for all farmers in the sample, revenue is higher by Tk
17.3 per decimal for the treatment group (signicant at 5% level), total cost is lower but not
precise for the treatment group and profits are higher by Tk 20.4 per decimal.
There are some concerns about the quality of the price data in the baseline and endline
surveys, and some of the variables are much more noisy compared to other measures that
were collected. To address this concern, I collected price data retrospectively at the village
level (from local fertilizer stores) in March 2014. Table A3 estimates the same regressions
using price data collected from the villages. The results are consistent and of similar mag-
nitude as the first set of estimates although profits for the long survey sample are no longer
significant.
Overall, the treatment effects are substantial, particularly in savings of urea. Back of
the envelop calculations discussed above show large quantities of savings of urea and higher
revenue. This implies inefficiencies exists in the way urea is applied by the average farmer.
With better information or signals, that farmers obtain due to this intervention, they are
now able to both save urea and benefit from higher yields. In the next section, using midline
data, I try to isolate where the savings in urea come from, based on potential changes in
behavior by the farmers.
4.2 Changes in Timing of Urea Application
During the last midline survey, data were collected on urea application dates during the
season and quantities applied at each date. From this data, I am able to observe differences
in urea application patterns between the treatment and control groups. Since I do not have
baseline data on urea application patterns, I cannot estimate the difference-in-difference,
however, I estimate the difference between the treatment and control groups during the
season after the intervention.
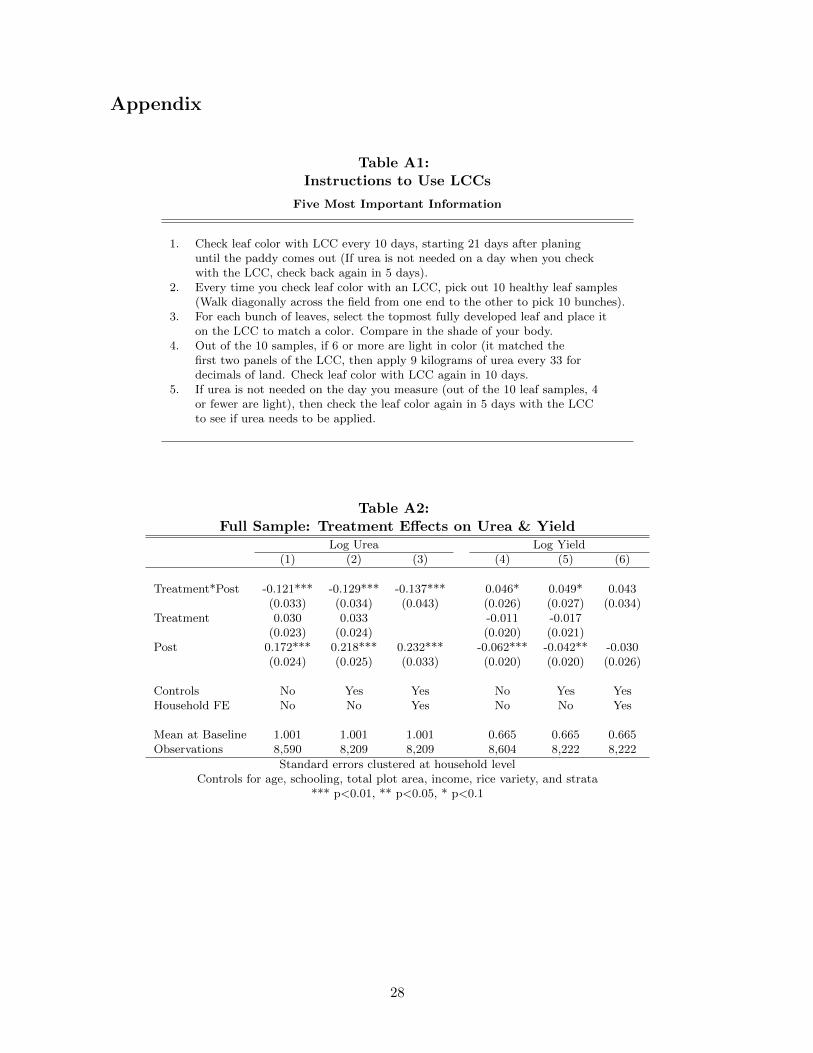
During the refresher training sessions, farmers were told to focus on a few simple in-
structions, a translated version of the handout is shown in Appendix Table A1. Farmers
were told to start checking leaf colors in their field with the LCC 21 days after planting to
determine if they need to apply urea, which is a later starting date compared to when many
13
farmers start in practice. After applying urea on any date, farmers were instructed to check
back in 10 days, to determine whether additional urea is needed. If the chart indicated that
urea was not needed, farmers were told to check again in 5 days. During each application,
they are advised to apply 9 kilograms of urea per 33 decimals of land, which is also slightly
less than the amount usually applied. Based on these instructions, there are several possible
changes in behavior compared to prevalent practices.
1. Farmers may delay urea application until 21 days after planting
2. Farmers may now apply smaller quantities of urea per application
3. Farmers may apply urea more frequently
4. Farmers may improve timing of application so that they apply when leaves are light
and delay application when leaves are dark
Note that the instructions directly do not tell farmers to apply less urea in total, but
rather allow the leaf colors to indicate if they should apply at any point in time. Based on
data collected during the midline surveys, I explore if there is any evidence for 1 to 3. It is
not possible to directly test 4, as we do not know when farmers check leaf colors. Table 5
shows these estimates. The midline data has more measurement error due to local CDIP
workers collecting data after a short training, and it is collected for a sub-sample, and so
is overall noisier. The dependent variable in column (6) is a dummy variable that takes on
a value of 1 if the first urea application in that plot, took place on or after 21 days after
planting. Farmers in the treatment group are much more likely to have waited until 21
days to start urea application compared to the control group. The coefficient for number
of times urea is applied is positive and the one for urea per application is negative for the
treatment group, but both coefficients are small and not significant, so it seems unlikely
that the treatment caused farmers to apply smaller quantities of urea more frequently.
Although the crop may respond to any urea applied early on, the returns are lower in
that period, which is why agriculture specialists recommend starting urea application three
weeks after planting. Column (3) estimates the difference in total urea applied between the
treatment and control groups. The estimate is negative and of a similar magnitude as the
14

main specification, but it is not precise. Columns (4) and (5) further splits this up into total
urea applied between 21 days after planting until the paddy comes out (“right time”) and
urea applied at any other time (“wrong time”). There appears to be no difference in urea
applied at the right time between the two groups, however, the treatment group reduces
urea use at the time in which returns are low. The coefficient is only significant at the
10% level, however, these estimates suggest that the differences between the treatment and
control groups are most likely driven by the treatment group delaying urea use to a more
productive time and the reduction in quantity of urea applied observed in the full data
comes from a reduction in quantity applied during periods of low return. These results
suggest that farmers were getting the start time wrong before and wasting resources by
applying some urea too early when returns are low.
Reduction of urea use during the period of low returns, explains where much the urea
reduction comes from, however, it is not sufficient to explain an increase in yield, as applying
urea before the third week will not harm the crop. However, an increase in yield can be
explained if farmers improve timing of urea application within the period of high returns.
Farmers can improve timing by closely monitoring that the leaves have sufficient nitrogen
and applying urea whenever nitrogen is needed. This will increase take-up of nitrogen by
the crop that will in turn promote yield. There is some evidence that the treatment group
spends more time in tasks related to fertilizer application (Table 6) based on questions asked
in two of the midline surveys (round 2 & 4) on a how much time the farmer had spent in
the last seven days on various agricultural activities. Treatment farmers stated spending
0.170 hours more in the past week before these surveys on activities related to fertilizer
application. In addition, I also separately estimate the number of times urea is applied in
the right and wrong times as well as urea per application, and treatment group farmers
are marginally more more likely to apply urea more times in the period of high returns,
although the coefficient is small (Table A5). These results suggest that treatment farmers
may learn to improve the timing of urea use and spend more time on fertilizer application
to ensure less urea is wasted.
15

5 Non-linearities in Treatment Effects
As an LCC will encourage farmers who underuse to use more urea and farmers who overuse
to use less urea, we can expect responses to be non-linear. For example, as seen earlier
in Figure 1, on average farmers overuse compared to regional recommendations, however,
there are farmers at the ends of the distribution, who overuse or underuse significantly.
To explore how the distributions of urea use and yield change with access to LCCs, I run
quantile regressions for both.
Table 7 shows the results of the quantile regressions. Perhaps surprisingly, we do not
observe convergence but the results show that the full distribution of urea use shifts down-
wards for the treatment group. The coefficient for the highest percentile is less precise
(significant at 10% level) and the remaining coefficients are all significant at the 1% level.
We cannot rule out that the different coefficients are statistically different from one another,
although the magnitude of the coefficient for the lowest percentile is the smallest (a decrease
of 0.072 kg per decimal). There is no significant change in the distribution of yield. The
coefficients are all positive but imprecise, although the coefficient for the highest percentile
is the largest (an increase of 0.038 mon per decimal).
Quantile regressions are helpful in understanding how the two distributions of urea and
yield change due to the treatment, however, farmers at the bottom of the distribution of urea
use may not necessarily be at the bottom of the distribution for yield. To look at changes
for the same farmers, I compute average urea use and average yield for each household at
baseline and then generate quartiles for both urea and yield. I estimate treatment effects on
urea use and yield for each of these quartiles. I estimate the following regression separately
for urea use and yield.
ypht = α+ γQuartilej + µQuartileiTreatmenth + δQuartileiPostt
+σQuartilei ∗ Treatmenth ∗ Postht + ρXht + εpht (2)
where i = 1, 2, 3 or 4, j = 2, 3 or 4 and all other variables are as above.
16
Table 8, reports the coefficients showing the treatment effects by baseline urea quartile.
The means for each dependent variable at baseline is reported in square brackets. Quartile
1 is the lowest quartile, while 4 is the highest. Columns (1) and (2) estimate treatment
effects by baseline quartiles of urea use. Farmers at the lower quartiles of urea use at
baseline reduce urea use once they have access to LCCs. Farmers at the highest quartile of
urea use, do not change use of urea significantly. Farmers at the top and bottom quartiles
of urea use at baseline, are also those who benefit from higher yield once they have access
to LCCs (gains of 0.089 mon per decimal and 0.176 mon per decimal respectively). While
these results are surprising, one possible explanation is that farmers at the top and bottom
quartiles are on average better farmers who able to determine the needs of the plot and
apply fertilizer accordingly, instead of applying the average recommended amount. Note
that average urea use at baseline by quartile 2 farmers is 1.6 times higher but the yields
attained at baseline are the same. This implies that the farmers in quartile 1 are arguably
“better” than those in quartile 2, as they were able to obtain the same yield with fewer
inputs through access to better plots or by managing inputs well. If this translates to
an ability to also use the LCC well, they may benefit from a higher yields. The results
for the fourth quartile are harder to explain, however, note that using an LCC does not
mean that the farmer will end up using less urea, farmers may use the same quantity but
potentially improve yields by improving the timing of the applications. Since adoption rates
of LCC are not different across the quartiles, farmers in the topmost urea quartile may have
been using the right quantity for those plots but are now able to improve yield further by
improving timing of application, but with the available data it’s not possible to observe this.
Soil nutrient profiles for the plots would have also been helpful in understanding whether
quality differences in plots explains some of the behavior as I hypothesize above, but these
data are also not available.
Columns (3) and (4) show similar estimates using baseline yield quartiles instead. The
coefficients in column (4) show treatment effects on yield and all the coefficients are positive
but not significant (consistent with the quantile regressions). The largest treatment effects
on urea use are for the middle quartiles. Farmers in the middle respond the most to the
17
treatment and are use significantly less urea (0.115 kg per decimal less for quartile 2 and
0.184 kg per decimal less for quartile 3) than baseline without sacrificing yields. Farmers at
the highest quartile of yield at baseline, are best performers. A lack of observable response
in urea use may mean that these farmers were already optimizing in terms of quantity.
The coefficient for treatment effect on yield for this group is not precise but is much larger
compared to the other groups (and this group probably drives the results for yield we see
when the data are pooled together). If this is due to lack of statistical power, it may mean
that the best farmers are able to incorporate signals obtained from an LCC to further
improve timing and they gain the most. Overall, based on all the estimates from Table 8 it
seems that the largest response comes from farmers at the ends of the distribution of urea
use at baseline and from farmers at the middle of the distribution of urea at baseline. Also,
the most gain seems to come from farmers who were already doing better at baseline.
6 Further Discussion
6.1 Farmers Learn over Time, but gaps remain
Without any information on the fertilizer needs of a plot, the optimal solution may be to
follow regional recommendations, however, based on our results it seems that some farmer
may perform better than they would by following regional recommendations. To understand
levels of optimal use, Figure 1 is misleading as it shows that there are many farmers on
both tails who are far from the optimal levels. However, Table 8 shows that farmers at the
lowest urea quartile at baseline are performing better than farmers at the second quartile,
who use much more urea on average but attain the same yield. Similarly, farmers at the top
quartile use far greater quantities of urea but their average yield are also much higher, so it’s
not clear that they should reduce urea use. These facts suggest that at least some farmers
perform better than they would if they followed regional recommendations, which implies
that over time time they are able to learn about the needs of the plots. However, gaps in
knowledge clearly remain, as on average farmer perform better with LCCs. If farmers had
full knowledge of the production function then using the LCC would not have provided any
additional information that would be useful.
18
Due to the large level of noise in yields each year, it may be difficult to receive signals
from experimentation. For example, differences in average fertilizer application by plots
may depend on overall plot quality is which is easier to observe. On average some plots
may produce poorer harvests consistently, and farmers may then adjust inputs accordingly.
However, it may be more difficult to understand the effect of timing of urea application on
yield and returns, and if they do not experiment with timing they may not have information
that would lead them to understand that timing matters. Alternatively, it may simply be
a failure to notice information in front of them such as the importance of the color of
the leaves. Hanna, Mullainathan & Schwartzstein (2014) develops a model of “learning
through noticing” where they show that an individual with significant experiment may still
fail to reach the production frontier because they did not notice important features of the
data that they have access to. This may also be the case with the rice farmers in the
study. Farmers perhaps learn about quality of the plots and adjust total urea application
accordingly, but, although they have information on the color of the leaves as well as the
timing of application of urea they may fail to notice the importance of both and also fail to
understand the relationship between the two.
6.2 Urea overuse may be a market failure
From the results discussed so far, there are two dimensions in which farmers make errors
in applying urea that some are able to correct with access to an LCC. Treatment farmers
are more likely to stop applying urea too early, and some of them may also improve the
timing of application within the period of high returns, although there is no direct evidence
for the latter and it is not observable. While both are failures in learning, the first one
does not harm yield but rather only wastes urea. Since urea is cheap, in the presence of
uncertainty about the correct start date, it may be optimal to apply urea early. Urea is
heavily subsidized by the government in Bangladesh so farmers do not bear the full cost,
moreover, the amount spent by farmers is not significant compared to all other expenses. If
urea is applied early, the crop is not harmed so the only loss is the amount the farmers spend
on the excess quantity applied. Overuse can then be viewed as a market failure where it is
optimal for the farmer to use early but the cost is borne by others in the form of negative
19
externalities, partly by the government who finances the subsidies and partly by society in
the form of water pollution as excess urea ends up in water bodies.
7 Conclusion
This paper explores whether there are limitations in learning by farmers in using urea after
a long period of experience in using the fertilizer. While it is challenging to learn how to
reduce wastage of urea, farmers can learn to do so by paying attention to the timing of
urea fertilizers and getting cues from the color of the rice leaves to determine whether the
crop is getting sufficient nitrogen. In this study, through a field experiment, I provide rice
farmers in the treatment group with an LCC, which is a simple tool that helps with the
management of urea fertilizers. I find that farmers save urea by 9% on average when they
gain access to a leaf color chart, and in addition they benefit from an increase in yield of
5%, which suggest a failure to learn how to effectively apply urea without help from the
chart. In particular I find that farmers make the error of applying urea too early in the
season, when the returns are lower and they are likely to correct this error once they have
access to an LCC. I also find that there is scope to save urea by farmers at all levels of
the distribution and that the largest gains in yield come from farmers who were performing
relatively better at baseline. These results suggest that farmers who are most engaged and
able to learn on their own about the needs of their plots, may also benefit the most from
additional outside help.
20
References
Agricultural Information System (AIS) 2013. Ministry of Agriculture, Government of People’s Republic of Bangladesh,
Dhaka, Bangladesh
Alam, M. J., Van Huylenbroeck, G., Buysse, J., Begum, I. A., & Rahman, S. (2011). Technical efficiency changes at
the farm-level: A panel data analysis of rice farms in Bangladesh. African Journal of Business Management,
5(14), 5559-5566.
Alam, M.M., Ladha, J.K., Khan, S.R., Foyjunnessa, Harun-ur-Rashid, Khan,A.H., & Buresh, R.J. (2005). Leaf
color chart for managing nitrogen fertilizer in lowland rice in Bangladesh. Agron. J, 97, 949959.
Alam, M.M., Ladha, J.K., Foyjunnessa, Rahman, Z., Khan, S.R., Harun-urRashid, Khan, A.H., & Buresh, R.J.
(2006). Nutrient management for increased productivity of ricewheat cropping system in Bangladesh. Field
Crop. Res, 96, 374386.
Alam, Shahe, M. “Minimisation of rice yield gap.” The Daily Star 29 Aug. 2010. Web. 9 July 2014.
http://archive.thedailystar.net/newDesign/print news.php?nid=152635
Anam, Tahmina. “Bangladesh’s Rotten-Mango Crisis.” The New York Times 2 July 2014: sec. The Opinion Pages.
Web. 9 July 2014.
http://www.nytimes.com/2014/07/03/opinion/tahmima-anam-bangladeshs-rotten-mango-crisis.html
Balasubramanian, V., Morales, A.C., Cruz, R.T., Thingarajan, T.M., Nagarajan, R., Babu, M., Abulrachaman, S.,
Hai, I.H. (2000). Adoption of chlorophyll meter (SPAD) technology for real-time nitrogen management in rice:
a review. Int. Rice Res. Notes, 25 (1), 48.
Bangladesh Agricultural Research Council (BARC) (1997). Fertilizer Recommendation Guide 2005. Bangladesh
Agricultural Research Council, Farmgate, Dhaka.
Bangladesh Bureau of Statistics (BBS) (2009). Preliminary Report on the Agricultural Census of Bangladesh 2008.
Bangladesh Bureau of Statistics (BBS), Dhaka, Bangladesh
http://www.bbs.gov.bd/dataindex/Pre-report-Agri-census-2008-Final.pdf
Bangladesh Bureau of Statistics (BBS) (2012). Yearbook of Agricultural Statistics of Bangladesh. Bangladesh Bureau
of Statistics, Statistics Division, Ministry of Planning, Government of People’s Republic of Bangladesh, Dhaka
Begum, M. E. A., & D’Haese, L. (2010). Supply and demand situations for major crops and food items in Bangladesh.
Journal of the Bangladesh Agricultural university, 8(1), 91-102.
Besley, T., & Case, A. (1993). Modeling Technology Adoption in Developing Countries. The American Economic
Review, 83(2), 396-402.
Buresh, R.J. (2010). Nutrient best management practices for rice, maize, and wheat in Asia. World Congress of
Soil Science, 16, Brisbane, Australia
Choudhury, A. T. M. A., & Kennedy, I. R. (2004). Prospects and potentials for systems of biological nitrogen
fixation in sustainable rice production. Biology and Fertility of Soils, 39(4), 219-227.
21

Choudhury, A. T. M A., & Kennedy, I. R. (2005). Nitrogen fertilizer losses from rice soils and control of environmental
pollution problems. Communications in Soil Science and Plant Analysis, 36(11-12), 1625-1639.
Conley, T., & Udry, C. (2010). Learning about a New Technology: Pineapple in Ghana. The American Economic
Review, 100(1), 35-69.
Department of Agricultural Extension (DAE). (2011) Programme Completion Report (PCR) of Popularizing Leaf
Color Chart for Saving Urea 2007-2011. Department of Agricultural Extension. Khamarbari, Farmgate,
Dhaka.
Foster, A., & Rosenzweig, R. (1995). Learning by Doing and Learning from Others: Human Capital and Technical
Change in Agriculture. Journal of Political Economy, 103(6), 1176-1209.
Ganesh-Kumar, A., Prasad, S. K., & Pullabhotla, H. (2012). Supply and Demand for Cereals in Bangladesh,
20102030. IFPRI Discussion Paper 01186.
Koenig, R. T., Ellsworth, J. W., Brown, B. D., & Jackson, G. D. (2007). Management of urea fertilizer to minimize
volatilization. Montana State University Extension.
Hanna, R., Mullainathan, S., & Schwartzstein, J. (2012). Learning through noticing: theory and experimental
evidence in farming (No. w18401). National Bureau of Economic Research.
Hossain, M. (2010). The 2007-08 Surge in Rice Prices: The Case of Bangladesh. In Managing Food Price Inflation
in South Asia, Ahmed S, Jansen HGP (eds). University Press Limited: Dhaka.
Islam, Z., B. Bagchi, & M. Hossain, (2007). Adoption of leaf color chart for nitrogen use efficiency in rice: Impact
assessment of a farmer-participatory experiment in West Bengal, India. Field Crops Research, 103, 70-75.
Mondal, M.H. (2011). Causes of Yield Gaps and Strategies for Minimizing the Gaps in Different Crops of Bangladesh.
Bangladesh J. Agril. Res., 36(3), 469-476.
Purcell, D., & Anderson, J. R. (1997). Agricultural extension and research: Achievements and problems in national
systems. World Bank Publications.
Roy, R., Chan, N. W., & Rainis, R. (2013). Development of indicators for sustainable rice farming in Bangladesh: a
case study with participative multi-stakeholder involvement. World Applied Science Journal, 22(5), 672-682.
Roy, R., Chan, N. W., & Rainis, R. (2013). Development of an Empirical Model of Sustainable Rice Farming: A
Case Study from Three Rice-Growing Ecosystems in Bangladesh. American-Eurasian Journal of Agricultural
& Environmental Sciences, 13(4), 449-460.
Singh, B., Singh, Y., Ladha, J.K., Bronson, K.F., Balasubramanian, V., Singh, J., Khind, C.S., (2002). Chlorophyll
meter- and leaf color chart-based nitrogen management for rice and wheat in northwestern India. Agron. J.,
94, 820821.
Uddin, M.N. (2008). Agricultural Extension Services in Bangladesh: A Review Study, Department of Agricultural
Extension Education, Bangladesh Agricultural University, Bangladesh.
Witt, C., Pasuquin, J.M.C.A., Mutters, R., Buresh, R.J., (2005). New leaf color chart for eective nitrogen manage-
ment in rice. Better Crops 89, 3639
22
Figures
Figure 1:Overuse of Urea at Baseline (Kg/decimal)
Tables
Table 1:Randomization Checks
(1) (2) (3) (4) (5) (6) (7) (8)Age Schooling Number Non-agri Plot Area Urea Yield Revenue
(years) (years) of Plots Income (Tk) (decimal) (kg/dec.) (mon/dec.) (Tk/dec)
Treatment 0.676 -0.166 -0.015 -650.199 0.973 0.001 -0.035 -24.35*(0.545) (0.188) (0.046) (454.589) (0.603) (0.025 ) (0.022) (14.44)
Control Group Mean 45.04 5.89 2.39 10309.83 28.34 1.01 0.67 356.94
Observations 2,014 1,935 2,045 1,893 4,860 4,521 4,519 3,377
Include controls for strataRobust standard errors in parentheses for columns (1) to (5)
Robust standard clustered at household level for columns (6) & (8)*** p<0.01, ** p<0.05, * p<0.1
23
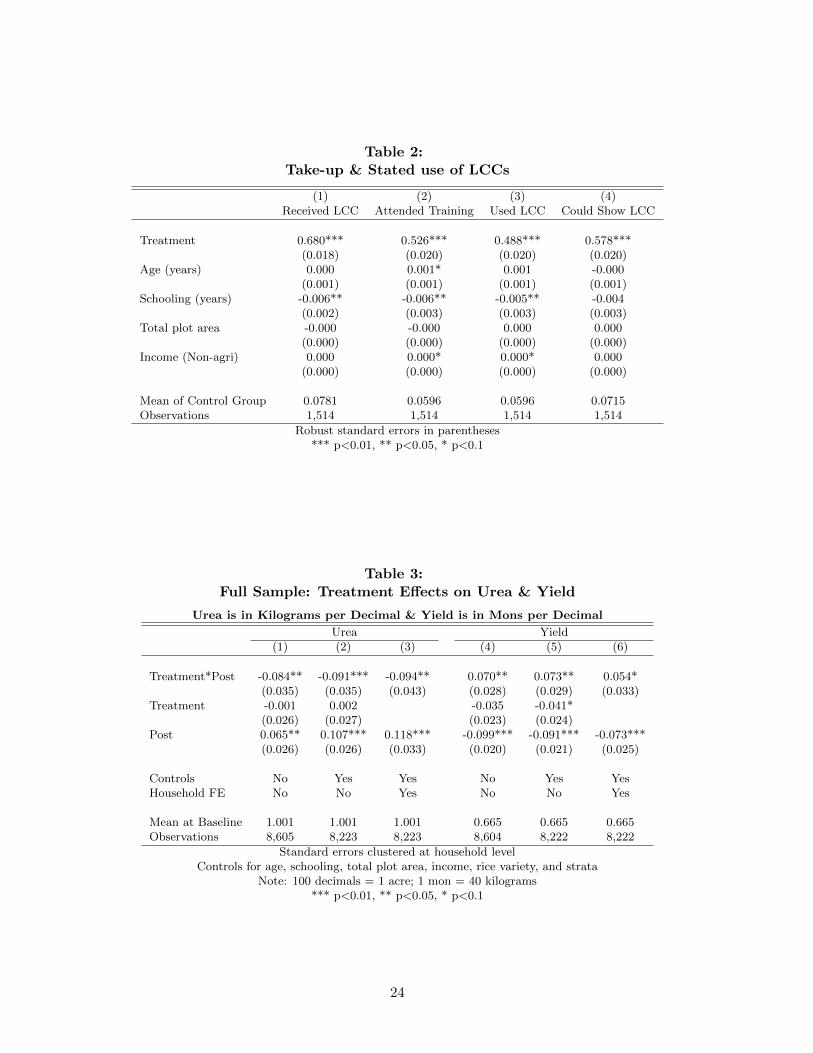
Table 2:Take-up & Stated use of LCCs
(1) (2) (3) (4)Received LCC Attended Training Used LCC Could Show LCC
Treatment 0.680*** 0.526*** 0.488*** 0.578***(0.018) (0.020) (0.020) (0.020)
Age (years) 0.000 0.001* 0.001 -0.000(0.001) (0.001) (0.001) (0.001)
Schooling (years) -0.006** -0.006** -0.005** -0.004(0.002) (0.003) (0.003) (0.003)
Total plot area -0.000 -0.000 0.000 0.000(0.000) (0.000) (0.000) (0.000)
Income (Non-agri) 0.000 0.000* 0.000* 0.000(0.000) (0.000) (0.000) (0.000)
Mean of Control Group 0.0781 0.0596 0.0596 0.0715Observations 1,514 1,514 1,514 1,514
Robust standard errors in parentheses*** p<0.01, ** p<0.05, * p<0.1
Table 3:Full Sample: Treatment Effects on Urea & Yield
Urea is in Kilograms per Decimal & Yield is in Mons per Decimal
Urea Yield(1) (2) (3) (4) (5) (6)
Treatment*Post -0.084** -0.091*** -0.094** 0.070** 0.073** 0.054*(0.035) (0.035) (0.043) (0.028) (0.029) (0.033)
Treatment -0.001 0.002 -0.035 -0.041*(0.026) (0.027) (0.023) (0.024)
Post 0.065** 0.107*** 0.118*** -0.099*** -0.091*** -0.073***(0.026) (0.026) (0.033) (0.020) (0.021) (0.025)
Controls No Yes Yes No Yes YesHousehold FE No No Yes No No Yes
Mean at Baseline 1.001 1.001 1.001 0.665 0.665 0.665Observations 8,605 8,223 8,223 8,604 8,222 8,222
Standard errors clustered at household levelControls for age, schooling, total plot area, income, rice variety, and strata
Note: 100 decimals = 1 acre; 1 mon = 40 kilograms*** p<0.01, ** p<0.05, * p<0.1
24
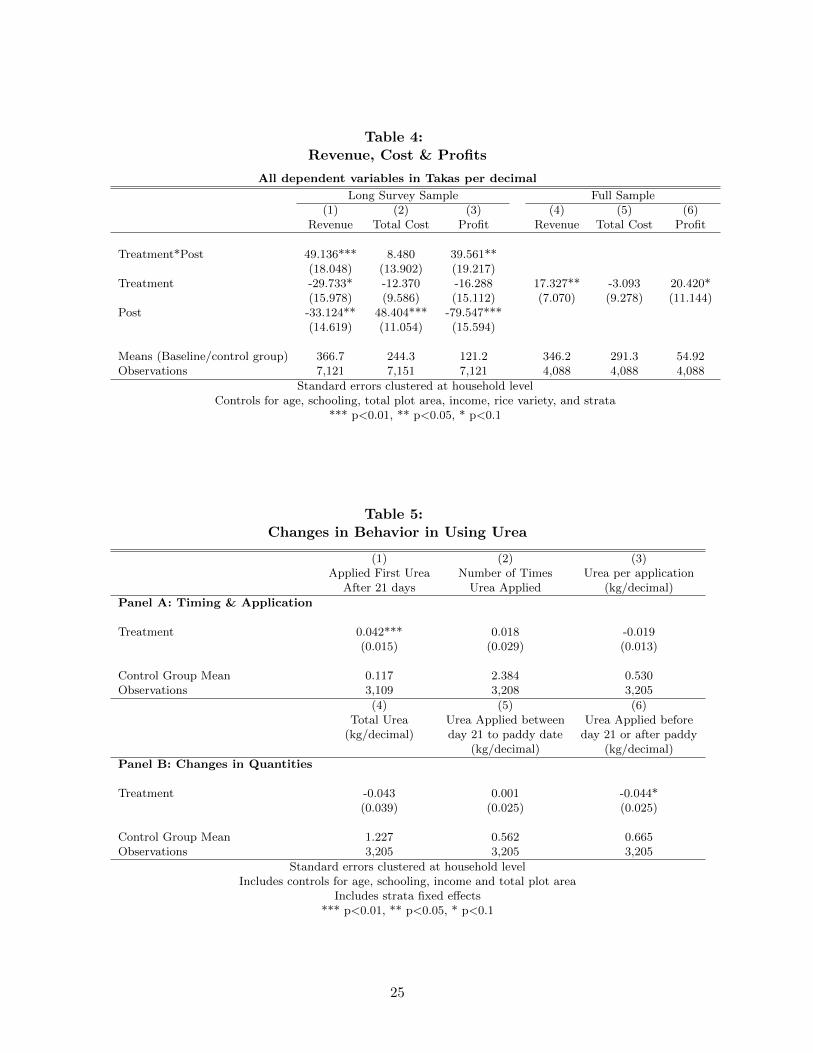
Table 4:Revenue, Cost & Profits
All dependent variables in Takas per decimal
Long Survey Sample Full Sample(1) (2) (3) (4) (5) (6)
Revenue Total Cost Profit Revenue Total Cost Profit
Treatment*Post 49.136*** 8.480 39.561**(18.048) (13.902) (19.217)
Treatment -29.733* -12.370 -16.288 17.327** -3.093 20.420*(15.978) (9.586) (15.112) (7.070) (9.278) (11.144)
Post -33.124** 48.404*** -79.547***(14.619) (11.054) (15.594)
Means (Baseline/control group) 366.7 244.3 121.2 346.2 291.3 54.92Observations 7,121 7,151 7,121 4,088 4,088 4,088
Standard errors clustered at household levelControls for age, schooling, total plot area, income, rice variety, and strata
*** p<0.01, ** p<0.05, * p<0.1
Table 5:Changes in Behavior in Using Urea
(1) (2) (3)Applied First Urea Number of Times Urea per application
After 21 days Urea Applied (kg/decimal)
Panel A: Timing & Application
Treatment 0.042*** 0.018 -0.019(0.015) (0.029) (0.013)
Control Group Mean 0.117 2.384 0.530Observations 3,109 3,208 3,205
(4) (5) (6)Total Urea Urea Applied between Urea Applied before
(kg/decimal) day 21 to paddy date day 21 or after paddy(kg/decimal) (kg/decimal)
Panel B: Changes in Quantities
Treatment -0.043 0.001 -0.044*(0.039) (0.025) (0.025)
Control Group Mean 1.227 0.562 0.665Observations 3,205 3,205 3,205
Standard errors clustered at household levelIncludes controls for age, schooling, income and total plot area
Includes strata fixed effects*** p<0.01, ** p<0.05, * p<0.1
25
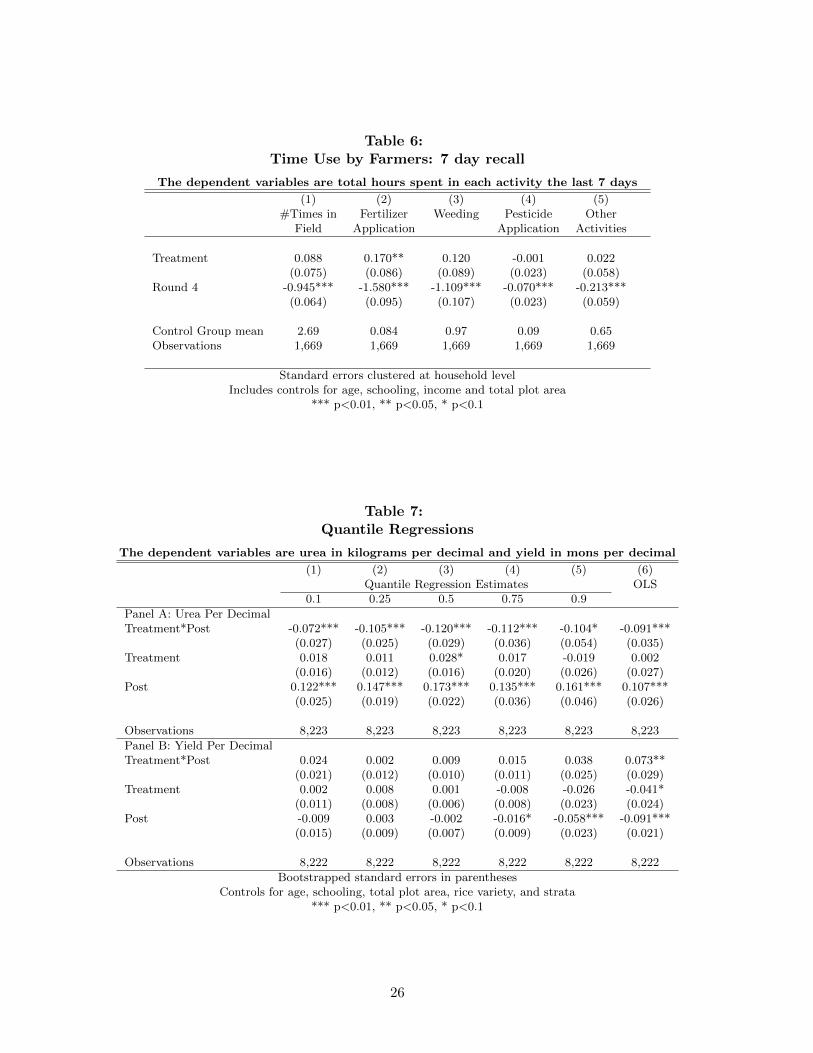
Table 6:Time Use by Farmers: 7 day recall
The dependent variables are total hours spent in each activity the last 7 days
(1) (2) (3) (4) (5)#Times in Fertilizer Weeding Pesticide Other
Field Application Application Activities
Treatment 0.088 0.170** 0.120 -0.001 0.022(0.075) (0.086) (0.089) (0.023) (0.058)
Round 4 -0.945*** -1.580*** -1.109*** -0.070*** -0.213***(0.064) (0.095) (0.107) (0.023) (0.059)
Control Group mean 2.69 0.084 0.97 0.09 0.65Observations 1,669 1,669 1,669 1,669 1,669
Standard errors clustered at household levelIncludes controls for age, schooling, income and total plot area
*** p<0.01, ** p<0.05, * p<0.1
Table 7:Quantile Regressions
The dependent variables are urea in kilograms per decimal and yield in mons per decimal
(1) (2) (3) (4) (5) (6)Quantile Regression Estimates OLS
0.1 0.25 0.5 0.75 0.9
Panel A: Urea Per DecimalTreatment*Post -0.072*** -0.105*** -0.120*** -0.112*** -0.104* -0.091***
(0.027) (0.025) (0.029) (0.036) (0.054) (0.035)Treatment 0.018 0.011 0.028* 0.017 -0.019 0.002
(0.016) (0.012) (0.016) (0.020) (0.026) (0.027)Post 0.122*** 0.147*** 0.173*** 0.135*** 0.161*** 0.107***
(0.025) (0.019) (0.022) (0.036) (0.046) (0.026)
Observations 8,223 8,223 8,223 8,223 8,223 8,223
Panel B: Yield Per DecimalTreatment*Post 0.024 0.002 0.009 0.015 0.038 0.073**
(0.021) (0.012) (0.010) (0.011) (0.025) (0.029)Treatment 0.002 0.008 0.001 -0.008 -0.026 -0.041*
(0.011) (0.008) (0.006) (0.008) (0.023) (0.024)Post -0.009 0.003 -0.002 -0.016* -0.058*** -0.091***
(0.015) (0.009) (0.007) (0.009) (0.023) (0.021)
Observations 8,222 8,222 8,222 8,222 8,222 8,222
Bootstrapped standard errors in parenthesesControls for age, schooling, total plot area, rice variety, and strata
*** p<0.01, ** p<0.05, * p<0.1
26

Table 8:Treatment Effects by Baseline Urea & Yield Quartiles
By Urea Quartiles By Yield Quartiles(1) (2) (3) (4)
urea yield urea yield(kg/dec) (mon/dec) (kg/dec) (mon/dec)
Quartile1*Treatment*Post -0.117** 0.089** -0.058 0.050(0.049) (0.041) (0.062) (0.031)[0.47] [0.58] [0.85] [0.37]
Quartile2*Treatment*Post -0.103*** -0.020 -0.115** 0.044(0.039) (0.044) (0.053) (0.039)[0.75] [0.59] [0.92] [0.54]
Quartile3*Treatment*Post -0.076* 0.078 -0.164*** 0.042(0.043) (0.056) (0.053) (0.034)[1.01] [0.65] [0.97] [0.64]
Quartile4*Treatment*Post 0.041 0.176** -0.051 0.126(0.081) (0.082) (0.095) (0.082)[1.84] [0.83] [1.32] [1.08]
Observations 8,216 8,215 8,216 8,215
Standard errors clustered at household levelBaseline means in square brackets
Includes all controls and remaining interacted variables. The Quartile variable refers to urea quartilesfor columns (1) % (2) and to yield quartiles for columns (3) & (4)
27
Appendix
Table A1:Instructions to Use LCCs
Five Most Important Information
1. Check leaf color with LCC every 10 days, starting 21 days after planinguntil the paddy comes out (If urea is not needed on a day when you checkwith the LCC, check back again in 5 days).
2. Every time you check leaf color with an LCC, pick out 10 healthy leaf samples(Walk diagonally across the field from one end to the other to pick 10 bunches).
3. For each bunch of leaves, select the topmost fully developed leaf and place iton the LCC to match a color. Compare in the shade of your body.
4. Out of the 10 samples, if 6 or more are light in color (it matched thefirst two panels of the LCC, then apply 9 kilograms of urea every 33 fordecimals of land. Check leaf color with LCC again in 10 days.
5. If urea is not needed on the day you measure (out of the 10 leaf samples, 4or fewer are light), then check the leaf color again in 5 days with the LCCto see if urea needs to be applied.
Table A2:Full Sample: Treatment Effects on Urea & Yield
Log Urea Log Yield(1) (2) (3) (4) (5) (6)
Treatment*Post -0.121*** -0.129*** -0.137*** 0.046* 0.049* 0.043(0.033) (0.034) (0.043) (0.026) (0.027) (0.034)
Treatment 0.030 0.033 -0.011 -0.017(0.023) (0.024) (0.020) (0.021)
Post 0.172*** 0.218*** 0.232*** -0.062*** -0.042** -0.030(0.024) (0.025) (0.033) (0.020) (0.020) (0.026)
Controls No Yes Yes No Yes YesHousehold FE No No Yes No No Yes
Mean at Baseline 1.001 1.001 1.001 0.665 0.665 0.665Observations 8,590 8,209 8,209 8,604 8,222 8,222
Standard errors clustered at household levelControls for age, schooling, total plot area, income, rice variety, and strata
*** p<0.01, ** p<0.05, * p<0.1
28

Table A3:Revenue, Cost & Profits: Price Data from Village Stores
All dependent variables in Takas per decimal
Long Survey Sample Full Sample(1) (2) (3) (4) (5) (6)
Revenue Total Cost Profit Revenue Total Cost Profit
Treatment*Post 49.136*** 6.959 30.387(18.048) (14.759) (21.553)
Treatment -29.733* -17.170 -1.519 17.327** -8.529 25.856**(15.978) (11.610) (18.549) (7.070) (9.285) (11.174)
Post -33.124** 89.075*** -74.001***(14.619) (11.871) (17.913)
Means (Baseline/control group) 366.7 245.0 80.37 346.2 330.2 15.96Observations 7,121 8,311 7,121 4,088 4,088 4,088
Standard errors clustered at household levelControls for age, schooling, total plot area, income, rice variety, and strata
*** p<0.01, ** p<0.05, * p<0.1
Table A4:Costs Breakdown
All costs are in Takas per decimal
(1) (2) (3) (4) (5) (6)Fertilizers Manure Pesticides Weedkillers Other Expenses Labor
Treatment*Post 3.763 0.568 1.035 8.518** -1.129(6.783) (0.945) (0.979) (3.919) (5.281)
Treatment -6.810 0.339 -0.909 -3.856 -5.876* -0.393(6.543) (0.486) (0.667) (25.293) (3.436) (3.941)
Post 11.572** -0.284 -2.597*** 3.357 13.569***(5.517) (0.592) (0.885) (3.148) (3.800)
Mean at Baseline 34.62 1.855 7.403 52.70 87.33 114.1Observations 7,130 5,867 6,545 1,314 7,151 7,136
Standard errors clustered at household levelControls for age, schooling, total plot area, rice variety, and strata
*** p<0.01, ** p<0.05, * p<0.1
29
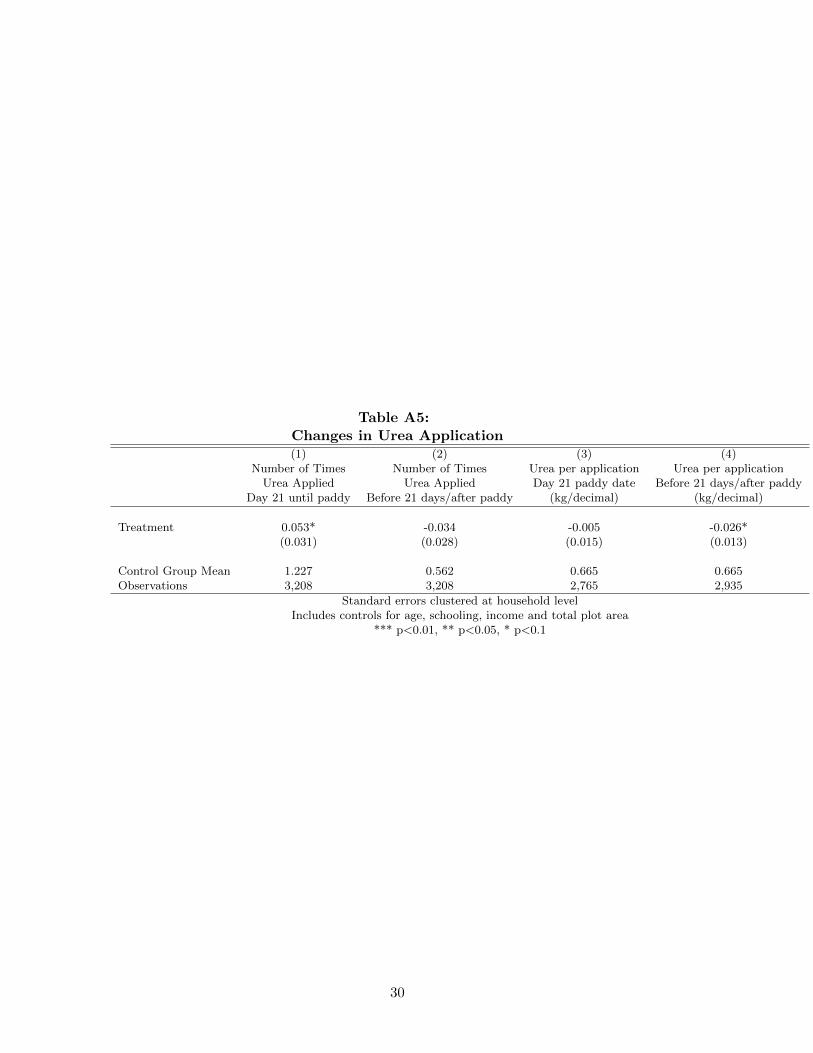
Table A5:Changes in Urea Application(1) (2) (3) (4)
Number of Times Number of Times Urea per application Urea per applicationUrea Applied Urea Applied Day 21 paddy date Before 21 days/after paddy
Day 21 until paddy Before 21 days/after paddy (kg/decimal) (kg/decimal)
Treatment 0.053* -0.034 -0.005 -0.026*(0.031) (0.028) (0.015) (0.013)
Control Group Mean 1.227 0.562 0.665 0.665Observations 3,208 3,208 2,765 2,935
Standard errors clustered at household levelIncludes controls for age, schooling, income and total plot area
*** p<0.01, ** p<0.05, * p<0.1
30