practical it research that drives measurable results craft a compensation strategy march 2012
TRANSCRIPT

Practical IT Research that Drives Measurable Results
Craft a Compensation StrategyMarch 2012

Introduction
In appreciation for your participation in this survey, we have created this exclusive summary of results.
The data you provided is being leveraged in our research.
Thank you for your participation.
This document has these three main sections:
Key Insights
Respondent Demographics
Survey Question Graphs
If you have any questions or concerns please contact:
Scott KoopmanPanel CoordinatorE-mail: [email protected]
McLean & Company 2

McLean & Company 3
Survey Question Graphs
Key Insights
Respondent Demographic
s

Developing a compensation philosophy is a high-return HR activity – it benefits recruitment and retention, and allows for compensation cost control.
Organizations with an up-to-date compensation philosophy are 1.9 times more likely to achieve compensation success
No ph
iloso
phy, b
ut p
lan
to cre
ate on
e
No ph
iloso
phy an
d no
plan
to cre
ate on
e
In th
e pr
oces
s of d
evelop
ing
a ph
iloso
phy
Hav
e an
out
-of-d
ate ph
iloso
phy
Hav
e an
up-
to-d
ate ph
iloso
phy
0%
10%
20%
30%
40%
50%
60%
70%
80%
26%35%
51%
71%76%
Com
pen
sati
on
S
trate
gy
Su
ccess
Compensation philosophy: stage of development
‘Compensation Strategy Success’ was computed using average agreement with the following survey statements:We are able to attract job applicants that match our target
applicant profile. Job applicant compensation expectations are in line with what
we offer.Few job offers are rejected on the basis of the compensation
we offer.Employees rarely complain about their compensation.
Compensation is not a common reason for employees leaving.
We are able to accurately predict our compensation costs a year into the future.
We are able to control compensation costs to keep them within the set budget.
Source: McLean & Company , 2012, N= 62
Why are organizations with no compensation philosophy, but who intend to create one experiencing less compensation success than organizations with no philosophy and no intent to create one? Most likely their low success prompted them to decide to invest effort in compensation planning.
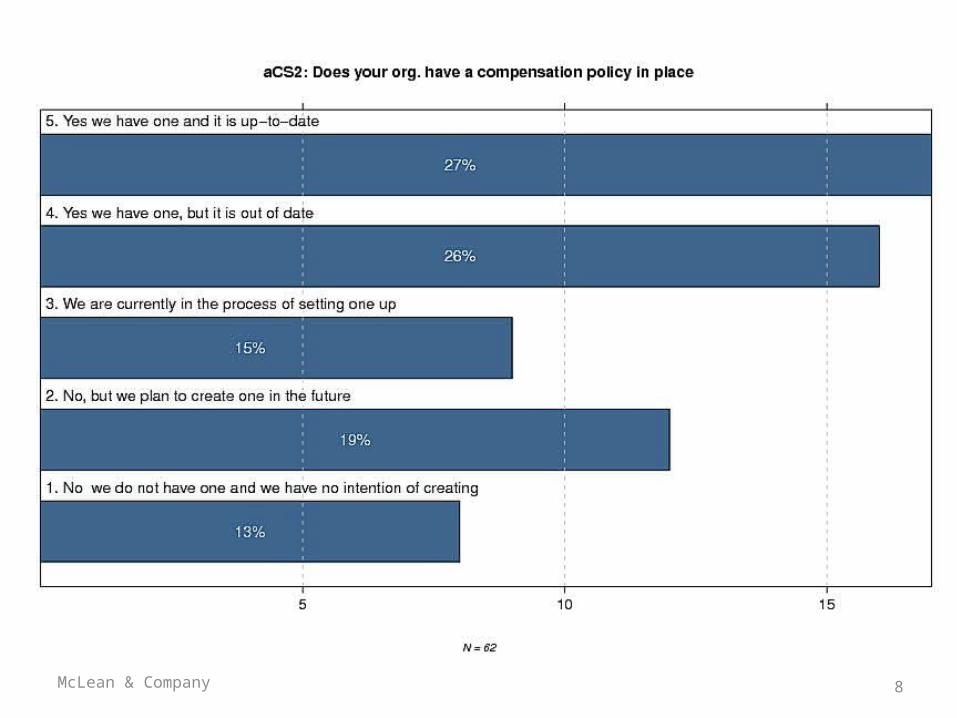
Surprisingly, only 26% of organizations have an up-
to-date compensation philosophy.
McLean & Company 4

Executives are by far the most commonly singled-out group in organizations when it comes to compensation differentiation
Facilities Workers
Unskilled Manual Laborers
Line Managers
Non-technical professional
Administrators
Salespeople
Technical Professionals
Executives
0% 20% 40% 60% 80% 100%
7%
9%
24%
25%
29%
35%
38%
80%
Source: McLean & Company, 2012, N=55
Employee Groups Addressed through Segment-specific Compensation Planning Executives are the most common employee group
to have a dedicated compensation plan. Not surprising given that they are generally the most difficult employee group to source and attract, as well as the highest-paid.
Executives
Only roughly 1/3 of organizations have a compensation plan in place for their salespeople. This is concerning because the pay of salespeople is typically heavily incentive-based and without clear articulation around incentives, risk of disengagement and turnover among this group are high.
Salespeople
Surprisingly few organizations reported having a separate compensation plan for their unskilled manual laborers. This may because many factories are unionized and collective bargaining agreements act as a substitute for compensation planning for covered employees. This statistic could also be skewed by respondents from organizations who do not employ unskilled manual laborers (e.g. professional services firms).
Unskilled Manual Laborers
McLean & Company 5

McLean & Company 6
Survey Question Graphs
Key Insights
Respondent Demographic
s

McLean & Company 7
McLean & Company 8

McLean & Company 9

McLean & Company 10

McLean & Company 11

McLean & Company 12
Survey Question Graphs
Key Insights
Respondent Demographic
s

McLean & Company 13

McLean & Company 14

McLean & Company 15

McLean & Company 16
McLean & Company 17

McLean & Company 18

McLean & Company 19
Like this? Want more?Watch your inbox
• Within the coming weeks, McLean & Company will be launching several more short surveys that will offer similar results to these.
• If you participate, you will receive the results for every project you participated in.
• To ensure you are included or for more information please email Scott Koopman
McLean & Company 20