practical guide solar panel thermography. folder/15.testo_thermography_guide.pdf · practical guide...
TRANSCRIPT
Practical guideSolar Panel Thermography.
Practical advice and tips.
2
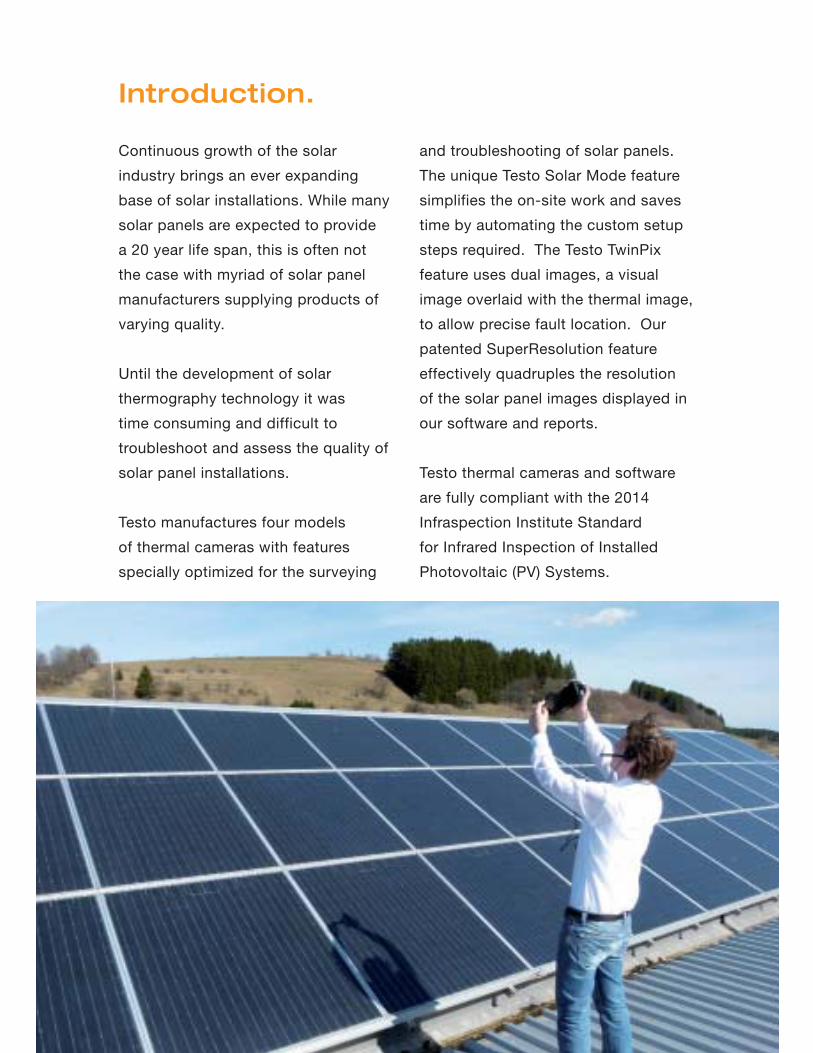
Introduction.
Continuous growth of the solar
industry brings an ever expanding
base of solar installations. While many
solar panels are expected to provide
a 20 year life span, this is often not
the case with myriad of solar panel
manufacturers supplying products of
varying quality.
Until the development of solar
thermography technology it was
time consuming and difficult to
troubleshoot and assess the quality of
solar panel installations.
Testo manufactures four models
of thermal cameras with features
specially optimized for the surveying
and troubleshooting of solar panels.
The unique Testo Solar Mode feature
simplifies the on-site work and saves
time by automating the custom setup
steps required. The Testo TwinPix
feature uses dual images, a visual
image overlaid with the thermal image,
to allow precise fault location. Our
patented SuperResolution feature
effectively quadruples the resolution
of the solar panel images displayed in
our software and reports.
Testo thermal cameras and software
are fully compliant with the 2014
Infraspection Institute Standard
for Infrared Inspection of Installed
Photovoltaic (PV) Systems.
3
Contents:
Advantages of thermographic solar panel testing. 4
Origins of solar cell failures. 7
How to avoid common inspection errors. 11
Thermal camera choices. 14
Testo solar mode thermal cameras. 17
Thermography training providers. 18
4
Thermography
Advantages of thermographic solar panel testing.
Quality assurance of solar panel
installations.
Solar panels come from many sources
around the world, and their quality
varies between manufacturers and
product batches.
The installation quality depends also
on the installer’s competence. In short,
the best way to prove that the solar
panel installation is delivered free of
defects is the the thermal imaging
analysis of the site installation. The
thermal imaging report is meant to
protect both the customer and the
contractor.
Prevention of the power yield loss.
The solar system ROI calculation
often assumes 20 years of power
production. As the panels age the
gradual loss of power is calculated
as well. These calculations can’t
predict system deterioration caused
by lightning storms, panel cell
overheating and other component
failures.
To assure optimal continuous solar
power production, thermography
scans should be performed at
regular intervals to assess preventive
maintenance needs.
For example, when modules overheat
due to shade, defective cells, or
substrings consuming instead
of producing power, the module
efficiency can drop by 0.5% per
Kelvin. A panel temperature rise of
18 °F (10 °C) as compared with an
average temperature of other panels
can lower the power yield by as much
as 5%.
5
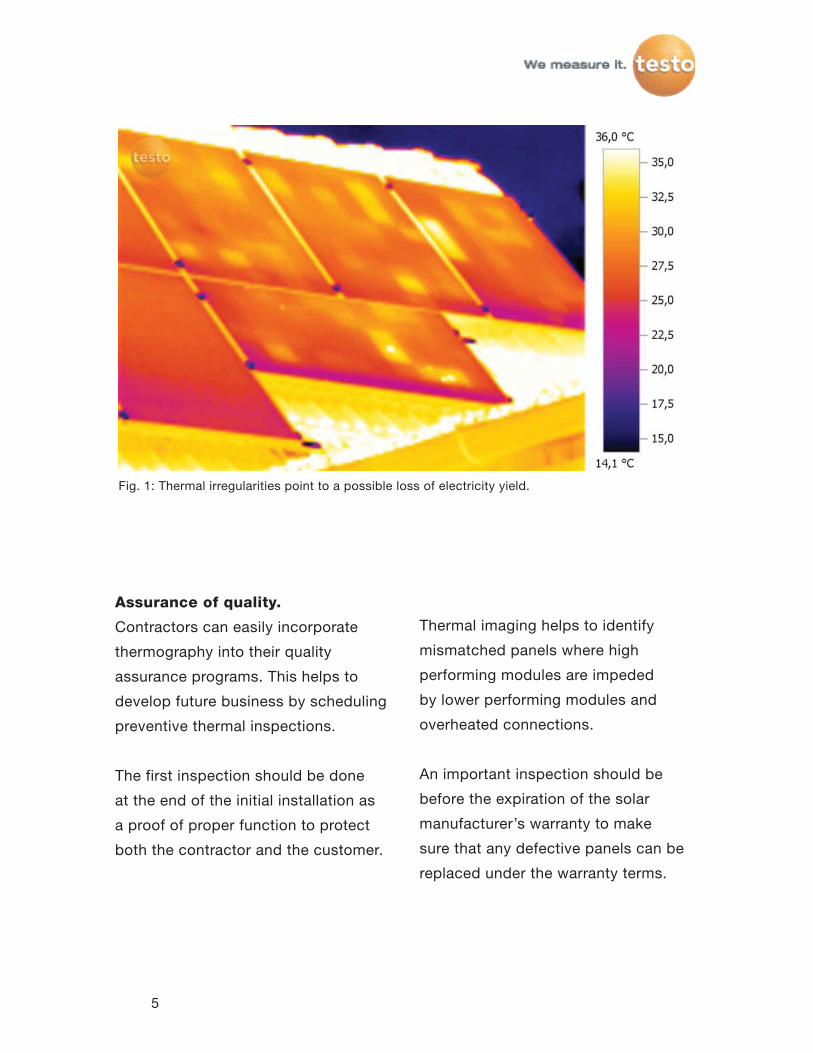
Fig. 1: Thermal irregularities point to a possible loss of electricity yield.
Thermal imaging helps to identify
mismatched panels where high
performing modules are impeded
by lower performing modules and
overheated connections.
An important inspection should be
before the expiration of the solar
manufacturer’s warranty to make
sure that any defective panels can be
replaced under the warranty terms.
Assurance of quality.
Contractors can easily incorporate
thermography into their quality
assurance programs. This helps to
develop future business by scheduling
preventive thermal inspections.
The first inspection should be done
at the end of the initial installation as
a proof of proper function to protect
both the contractor and the customer.
6
Thermography
Overheating protection.
Solar systems are outdoor electrical
installations exposed to stresses of
wind, rain, snow, melt and freeze
cycles, and UV radiation. Such
exposure can result in weathering and
accelerated corrosion. A Testo thermal
camera is the key tool to identifying
thermal irregularities.
Solar inverters and other high wattage
components should have sufficient
cooling to prevent overheating failures
that might lead to fires. Again, the
thermal camera will help here to
identify overheating components and
lines in the electrical panels.
Fast diagnostic tool.
Thermography is a safe, non-contact
measurement method to check groups
of circuits and solar panels. The
thermal irregularities are apparent on
the camera’s screen and dual images
can be saved to the report. The Testo
TwinPix feature uses dual images, a
visual image overlaid with the thermal
image to allow precise fault location.
Failed bypass diodes can be easily
located with this feature and the
thermal image provides electricians
with a perfect guide for the diode
replacement.
Work safety.
Some systems use high voltage wiring,
but thermal inspections are done
from a distance and never come in
contact with live wiring, yet are still
able to pinpoint overloads and short
circuits by their thermal signature
characteristics.
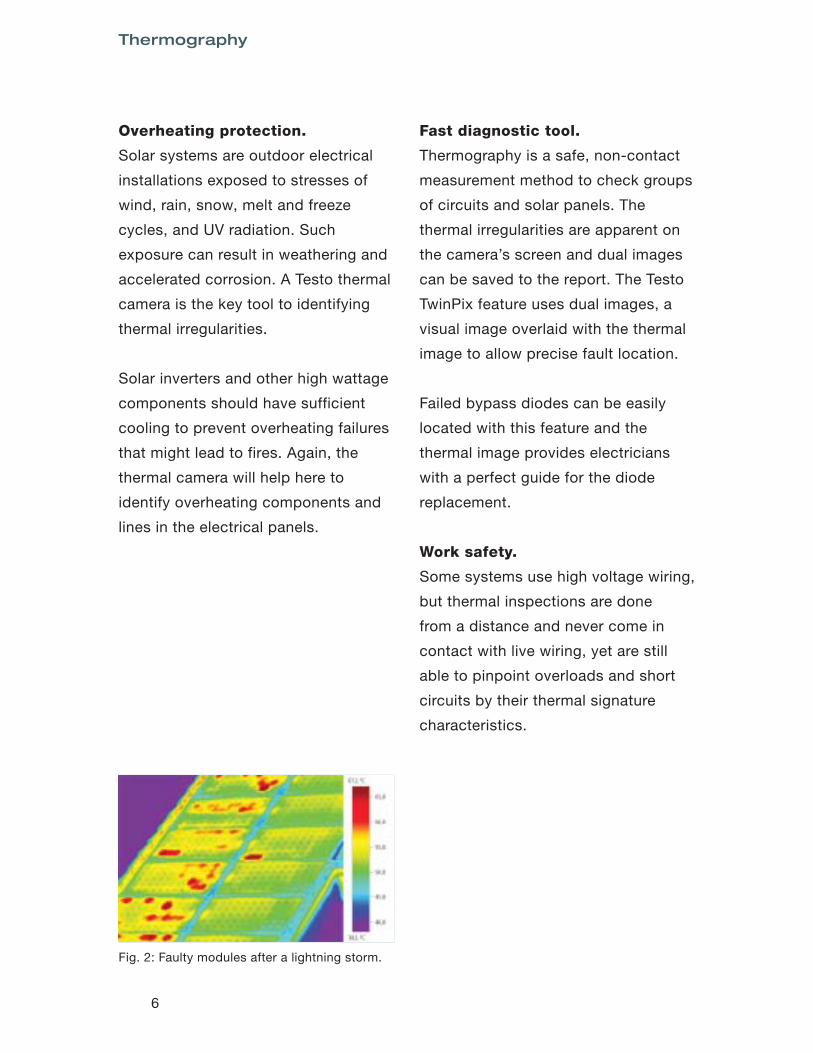
Fig. 2: Faulty modules after a lightning storm.
7
Origins of solar cell failures.
Thermal image cameras look for
panel hotspots. Overheated cells can
damage the casing material and cause
delamination. Where do the hotspots
come from? Shade on the module or a
defective cell can change the module
from power production to power
consumption resulting in heating the
cell which will show as a hotspot in
the thermal image. A defective or
mismatched bypass diode may cause
the same effect.
The solar panel hotspots create two
issues:
• Fall in overall power production
since cells consume power
instead of producing.
• Power consumption continues
to heat up cells and affect the
production of neighboring cells.
For solar panel diagnostics, the US
Infraspection Institute Standard calls
for the presence of at least 650
W/m² solar radiation to differentiate
the solar panel thermal properties.
Common solar panel faults
• Defective bypass diodes
• Short circuits and falling connec-
tions
• Penetration of moisture and/or
dirt
• Cracked cells or glass cracks
• Failed or disconnected modules
• Mismatched panels with different
capacities
• Loose contacts and wiring faults
• Wear and tear
8
Thermography
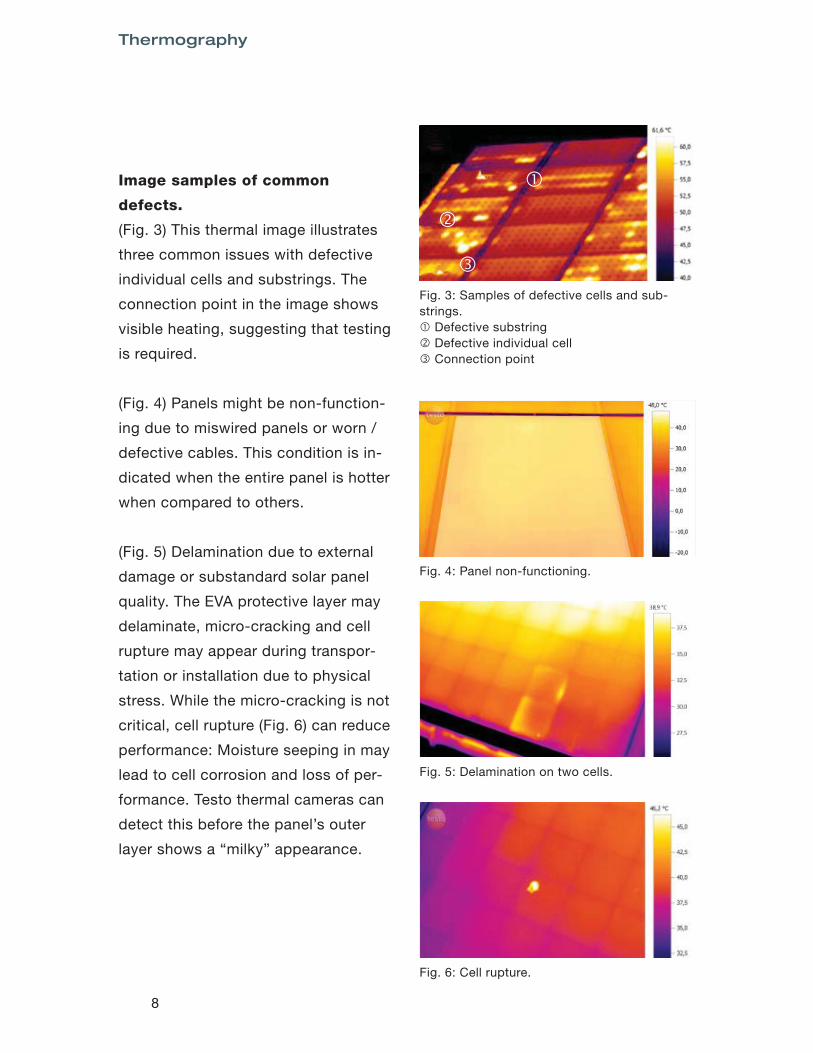
Image samples of common
defects.
(Fig. 3) This thermal image illustrates
three common issues with defective
individual cells and substrings. The
connection point in the image shows
visible heating, suggesting that testing
is required.
(Fig. 4) Panels might be non-function-
ing due to miswired panels or worn /
defective cables. This condition is in-
dicated when the entire panel is hotter
when compared to others.
(Fig. 5) Delamination due to external
damage or substandard solar panel
quality. The EVA protective layer may
delaminate, micro-cracking and cell
rupture may appear during transpor-
tation or installation due to physical
stress. While the micro-cracking is not
critical, cell rupture (Fig. 6) can reduce
performance: Moisture seeping in may
lead to cell corrosion and loss of per-
formance. Testo thermal cameras can
detect this before the panel’s outer
layer shows a “milky” appearance.
Fig. 3: Samples of defective cells and sub-strings. Defective substring Defective individual cell Connection point
Fig. 4: Panel non-functioning.
Fig. 5: Delamination on two cells.
Fig. 6: Cell rupture.

9
Overview of solar panel defects.
The Table below (Fig. 7) explains images of common defects.
Fig. 7: Schematic diagram of infrared images and possible defects.
Solar panel representation Description
Panel overheating as compared with the other cells.
Overheating pattern for a string of cells.
“Patchwork pattern” where individual cells are randomly distributed and significantly hotter.
Significant overheating of a part of a cell.
Uneven heat pattern or overheated at specific points.
Overheating of a single cell.
Possible defects
Panel is not working.
Short circuit in a cell string.
Panel is not working.
Cell rupture.
Cell crack or other impediment.
Undetermined.

10
Thermography
Checking electrical and
mechanical components.
Testo thermal cameras are very useful
for reviewing and checking the other
electrical parts of the solar system
aside from the solar panels. Loose
connections and corrosion can create
resistance, creating a specific heat
signature detectable by the thermal
camera.
A thermal camera will point you to:
• Corroded contacts or connectors
• Inverter issues
• Loose contacts
• Overheated connection points
Fig. 8: Left inverter is significantly hotter.
Fig. 9: Overheated DC cable.
Fig. 10: Overheating of electrical connections.
11
How to avoid common inspection errors.
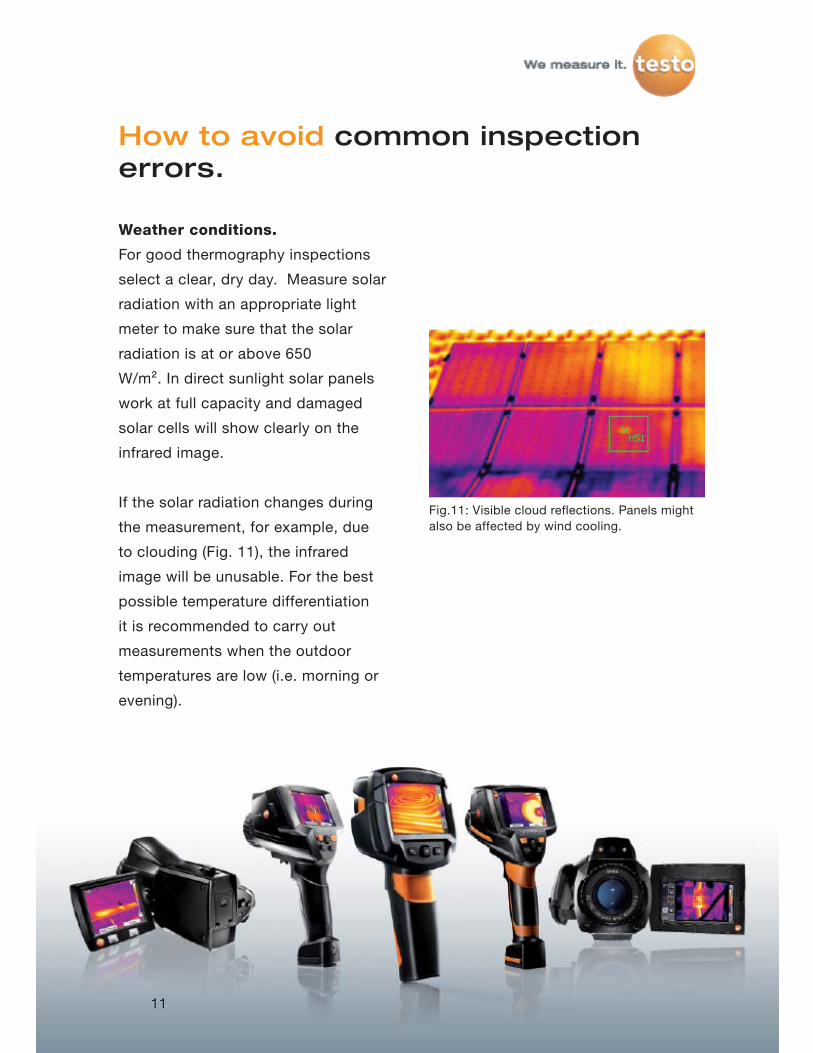
Weather conditions.
For good thermography inspections
select a clear, dry day. Measure solar
radiation with an appropriate light
meter to make sure that the solar
radiation is at or above 650
W/m². In direct sunlight solar panels
work at full capacity and damaged
solar cells will show clearly on the
infrared image.
If the solar radiation changes during
the measurement, for example, due
to clouding (Fig. 11), the infrared
image will be unusable. For the best
possible temperature differentiation
it is recommended to carry out
measurements when the outdoor
temperatures are low (i.e. morning or
evening).
Fig.11: Visible cloud reflections. Panels might also be affected by wind cooling.
11
12
Thermography
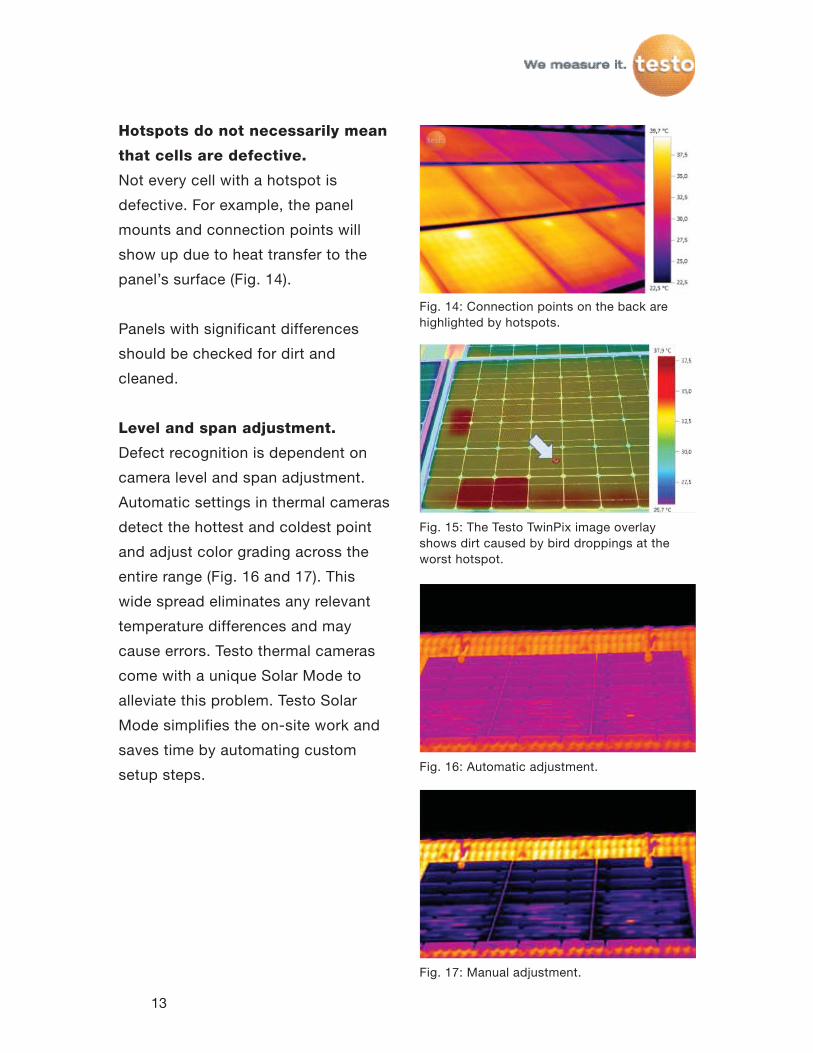
Solar panels mounted on free standing
solar racks can have thermal images
taken from the back of the panel (Fig.
13)
This method avoids measurement
errors and eliminates heat source
reflections. The heat transfer is
sufficient to allow the determination
of temperature distribution of the solar
cells on the back of the solar panel.
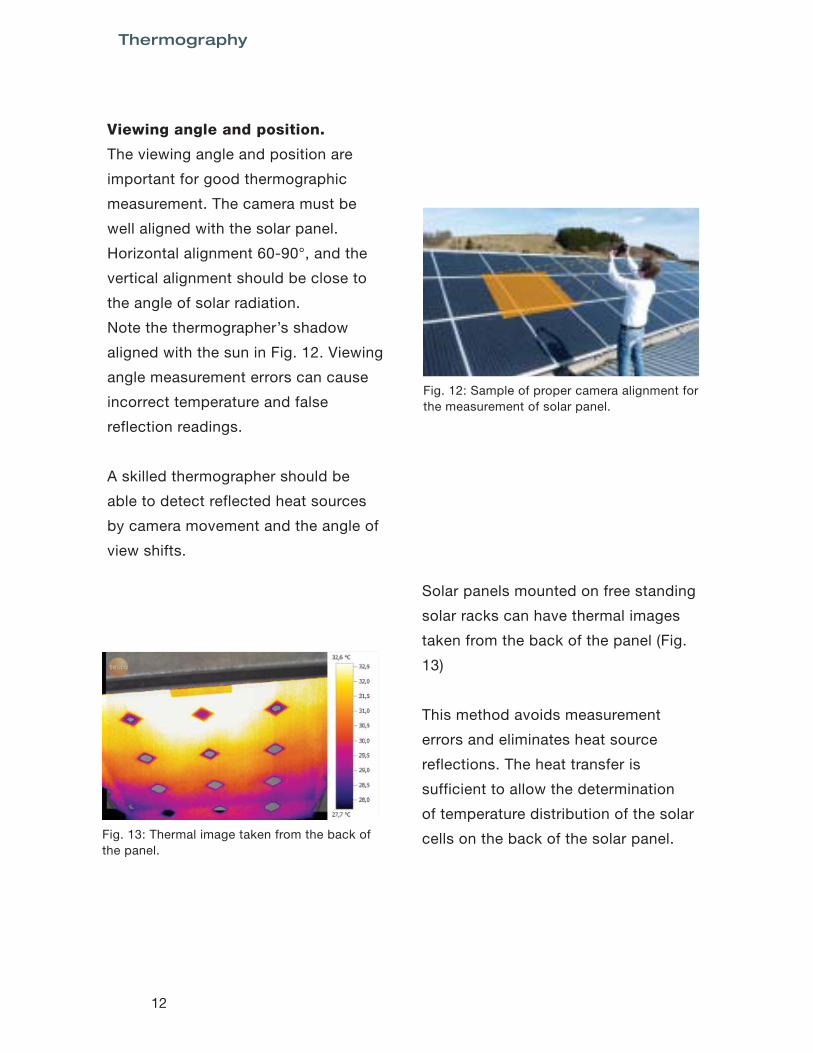
Fig. 12: Sample of proper camera alignment for the measurement of solar panel.
Fig. 13: Thermal image taken from the back of the panel.
Viewing angle and position.
The viewing angle and position are
important for good thermographic
measurement. The camera must be
well aligned with the solar panel.
Horizontal alignment 60-90°, and the
vertical alignment should be close to
the angle of solar radiation.
Note the thermographer’s shadow
aligned with the sun in Fig. 12. Viewing
angle measurement errors can cause
incorrect temperature and false
reflection readings.
A skilled thermographer should be
able to detect reflected heat sources
by camera movement and the angle of
view shifts.
13
Hotspots do not necessarily mean
that cells are defective.
Not every cell with a hotspot is
defective. For example, the panel
mounts and connection points will
show up due to heat transfer to the
panel’s surface (Fig. 14).
Panels with significant differences
should be checked for dirt and
cleaned.
Level and span adjustment.
Defect recognition is dependent on
camera level and span adjustment.
Automatic settings in thermal cameras
detect the hottest and coldest point
and adjust color grading across the
entire range (Fig. 16 and 17). This
wide spread eliminates any relevant
temperature differences and may
cause errors. Testo thermal cameras
come with a unique Solar Mode to
alleviate this problem. Testo Solar
Mode simplifies the on-site work and
saves time by automating custom
setup steps.
Fig. 15: The Testo TwinPix image overlay shows dirt caused by bird droppings at the worst hotspot.
Fig. 14: Connection points on the back are highlighted by hotspots.
Fig. 17: Manual adjustment.
Fig. 16: Automatic adjustment.
14
Thermography
To be successful with solar panel
thermal imaging, the right thermal
camera must be selected. Below is a
short list of features to pay attention
to:
• IR resolution of the thermal detector
• Thermal resolution (NETD)
• Imager functions
• Exchangeable lenses
• Rotating viewing screen to ease
selection of proper shooting angle
• Software
IR resolution or geometric
resolution.
Geometric resolution measured
in mrad (a thousandth of a radian)
helps to detect object size at a given
distance. The geometric resolution is
also dependent on the IR resolution of
the thermal detector.
For large solar panel arrays Testo
recommends 320 x 240 pixel thermal
cameras, and for increased image
detail results, cameras with 640 x
480 IR sensors. The lower 160 x 120
resolution thermal cameras might
be sufficient for small solar panel
systems.
Thermal resolution (NETD).
The thermal sensitivity for a thermal
camera is measured in milliKelvins
(mK). The thermal resolution (NETD)
(noise equivalent temperature
difference) value indicates the thermal
camera’s ability to show the smallest
temperature difference and it is shown
in milliKelvins. The thermal resolution
of 0.05 °C (or 50 mK), for example,
means that the thermal imager can
detect and show half a degree of
Celsius as a color grading in the
thermal image.
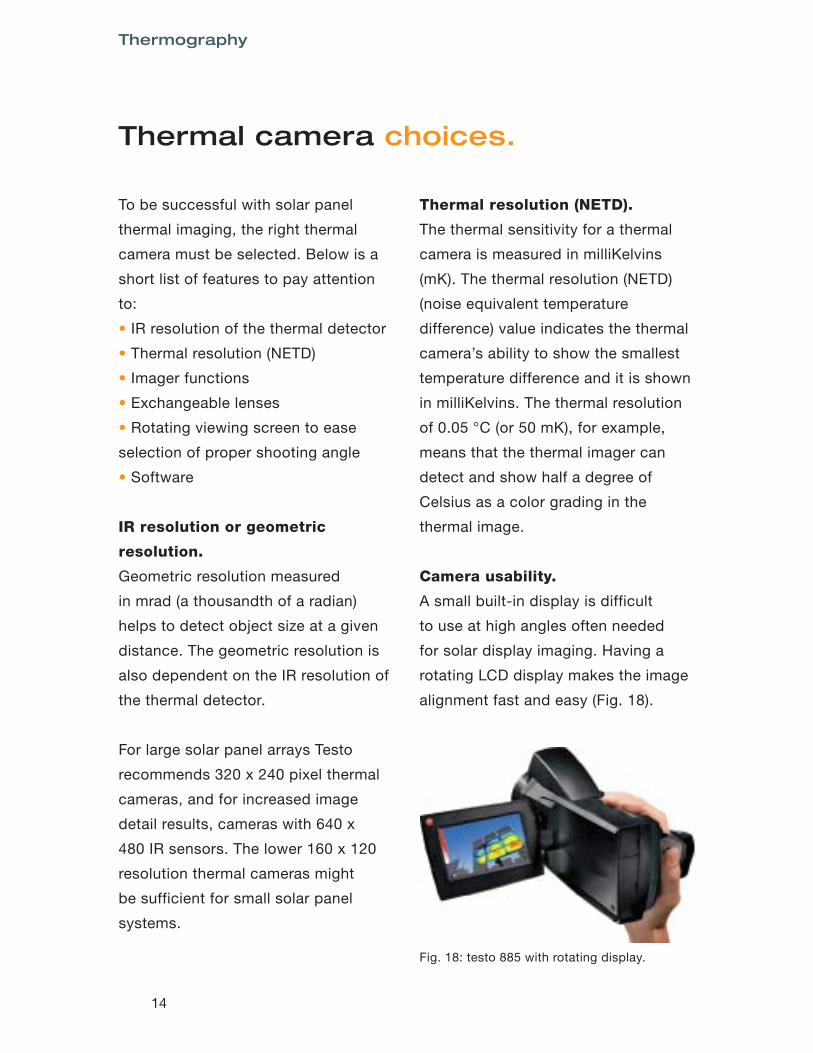
Camera usability.
A small built-in display is difficult
to use at high angles often needed
for solar display imaging. Having a
rotating LCD display makes the image
alignment fast and easy (Fig. 18).
Thermal camera choices.
Fig. 18: testo 885 with rotating display.

15
Having a rotating display makes
a great difference when shooting
thermal images of the back of solar
panel arrays - no need to lie on the
ground or roof.
In the Testo camera Solar Mode,
the solar radiation value (W/m²) is
saved with each image. The testo
885 and 890 thermal cameras also
feature fully radiometric video function
and image logging (time-lapse
imaging). The video function is used
for video capture of long solar array
installations from a moving vehicle.
Fully radiometric video can be later
analyzed frame by frame in Testo
IRSoft software.
Exchangeable lenses.
The viewing angle of the lens affects
geometric resolution and the size
of the smallest detail that can be
registered, and this is independent
of the the thermal detector’s pixel
resolution. When inspecting large solar
systems having a telephoto lens option
is a time saver, eliminating the need
for ladders and lifts.
Fig. 21: Image of a roof installation taken with a telephoto lens from a distance.
Fig. 19: Solar radiation W/m² value is stored with each image.
Fig. 20: Roof with solar system.
16
Thermography
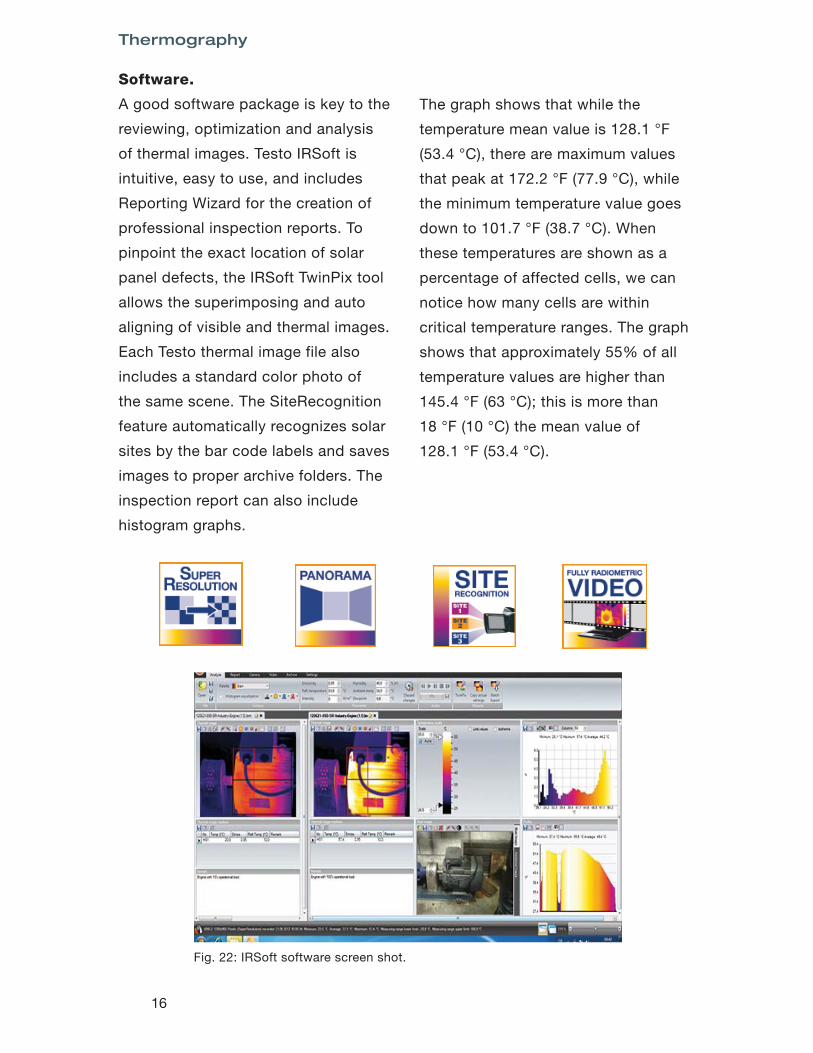
Software.
A good software package is key to the
reviewing, optimization and analysis
of thermal images. Testo IRSoft is
intuitive, easy to use, and includes
Reporting Wizard for the creation of
professional inspection reports. To
pinpoint the exact location of solar
panel defects, the IRSoft TwinPix tool
allows the superimposing and auto
aligning of visible and thermal images.
Each Testo thermal image file also
includes a standard color photo of
the same scene. The SiteRecognition
feature automatically recognizes solar
sites by the bar code labels and saves
images to proper archive folders. The
inspection report can also include
histogram graphs.
Fig. 22: IRSoft software screen shot.
The graph shows that while the
temperature mean value is 128.1 °F
(53.4 °C), there are maximum values
that peak at 172.2 °F (77.9 °C), while
the minimum temperature value goes
down to 101.7 °F (38.7 °C). When
these temperatures are shown as a
percentage of affected cells, we can
notice how many cells are within
critical temperature ranges. The graph
shows that approximately 55% of all
temperature values are higher than
145.4 °F (63 °C); this is more than
18 °F (10 °C) the mean value of
128.1 °F (53.4 °C).
17
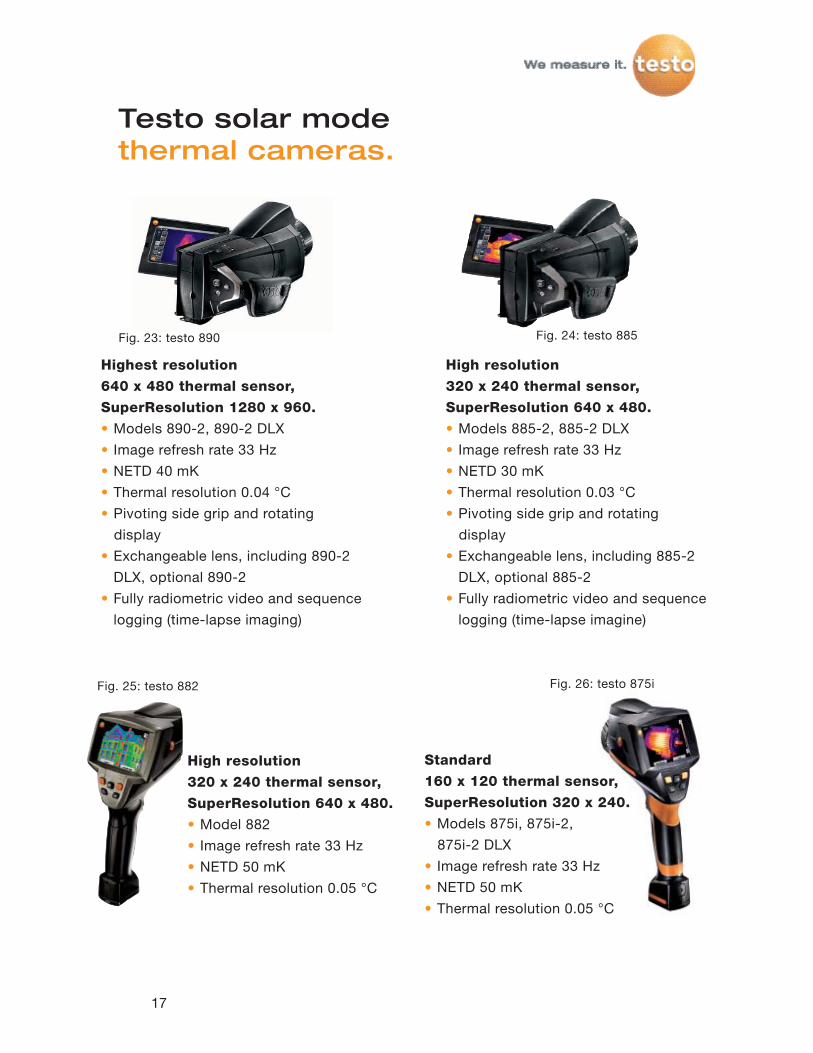
Highest resolution
640 x 480 thermal sensor,
SuperResolution 1280 x 960.
• Models 890-2, 890-2 DLX• Image refresh rate 33 Hz• NETD 40 mK• Thermal resolution 0.04 °C• Pivoting side grip and rotating display• Exchangeable lens, including 890-2
DLX, optional 890-2• Fully radiometric video and sequence
logging (time-lapse imaging)
Testo solar modethermal cameras.
Fig. 23: testo 890
High resolution
320 x 240 thermal sensor,
SuperResolution 640 x 480.
• Models 885-2, 885-2 DLX • Image refresh rate 33 Hz • NETD 30 mK• Thermal resolution 0.03 °C• Pivoting side grip and rotating display• Exchangeable lens, including 885-2
DLX, optional 885-2• Fully radiometric video and sequence
logging (time-lapse imagine)
Fig. 24: testo 885
Fig. 25: testo 882 Fig. 26: testo 875i
Standard
160 x 120 thermal sensor,
SuperResolution 320 x 240.
• Models 875i, 875i-2, 875i-2 DLX• Image refresh rate 33 Hz• NETD 50 mK• Thermal resolution 0.05 °C
High resolution
320 x 240 thermal sensor,
SuperResolution 640 x 480.
• Model 882• Image refresh rate 33 Hz• NETD 50 mK• Thermal resolution 0.05 °C

18
Thermography
In the United States thermography
application courses are provided
on 3 levels starting with the Level 1
certification.
Inquire with your local thermography
training providers for application
topics and training locations.
Here is a partial list of training
providers used by Testo customers:
Infraspection Institute
www.infraspection.com
United Infrared, Inc.
www.unitedinfrared.com
Academy of Infrared Training
www.infraredtraining.net
The Snell Group
www.thesnellgroup.com
Thermography training providers.
Fig. 27: Photovoltaics seminar at the Testo Academy.
Overview of key topics:
• Introduction to photovoltaics
• Thermal irregularities
• Introduction to thermography
• Physical principles and radiation
• Correct use of thermal imagers
• Capturing thermal irregularities
on PV systems
• Evaluation and consequences of
the thermal analysis
• Practical measurements and
exercises

Testo, Inc.40 White Lake RoadSparta, NJ 07871
www.testo.com
g.n
Not
resp
onsi
ble
for t
ypog
raph
ical
err
ors.
Sub
ject
to c
hang
e w
ithou
t not
ice.