practical applications of credibility theory
DESCRIPTION
Practical Applications of Credibility Theory. Tom Rhodes, FSA, MAAA, FCA AVP & Actuarial Director MIB Solutions February 16, 2007. Practical Applications of Credibility Theory. Importance to Practicing Actuaries Credibility Methods Formula and Variance Real Life Mortality Example - PowerPoint PPT PresentationTRANSCRIPT
© 2007 MIB Solutions, Inc. All Rights Reserved
Practical Applications of Credibility Theory
Tom Rhodes, FSA, MAAA, FCA
AVP & Actuarial Director MIB Solutions
February 16, 2007

© 2007 MIB Solutions, Inc. All Rights Reserved
Practical Applications of Credibility Theory Importance to Practicing Actuaries
Credibility Methods
Formula and Variance
Real Life Mortality Example
Selection of Method
Elements of Credibility Theory
Prior A/E Ratios
Company A/E Ratios
Estimate A/E Ratios
Lapse Application
Mortality Applications (VM-20, pricing, risk
mgmt)
© 2007 MIB Solutions, Inc. All Rights Reserved
Importance of Credibility Theory
Company results vary substantially from the intercompany averages
Credibility Theory provides a statistically sound method of measuring variability of company results from intercompany results.
Credibility Theory provides company specific estimates of mortality and lapse based on company results, intercompany results and the measured variability.
© 2007 MIB Solutions, Inc. All Rights Reserved
Importance of Credibility Theory
Prospect of Principles-Based Reserving raises its importance among life and annuity actuaries
NAIC’s Life and Health Actuarial Task Force New Valuation Law and Valuation Manual (VM) VM-20 includes credibility practices in valuation of life insurance
products Companies set reserves based on own experience
Academy’s Credibility Practice Note highlights Determine the level of reliance that can be placed on company
experience Determine assumptions for modeling company cash flows
© 2007 MIB Solutions, Inc. All Rights Reserved
Credibility Theory Practices Report
The SOA’s Committee on Life Insurance Research, Financial Reporting and Product Development Sections sponsored a report on application and adoption of credibility theory for life insurance and annuities.
MIB Solutions team of Stuart Klugman, Tom Rhodes, Marianne Purushotham and Stacy Gill produced Credibility Theory Practices report: http://www.soa.org/research/life/research-credibility-theory-pract.aspx
© 2007 MIB Solutions, Inc. All Rights Reserved
Credibility Theory Practices ReportTheory, Practical Methodology and More!Theory: Formulas developed for two established statistical credibility methods, Limited Fluctuation and
Bühlmann Empirical Bayesian
Practical Methodology: For Limited Fluctuation and Bühlmann Empirical Bayesian, formulas for ‘Z’ applied to sample of small, medium and large companies:
Mortality and lapse results
Excel files implementing formulas included
Appendices document this Excel file implementation
Companies can perform Limited Fluctuation method in-house
Survey and Bibliography
Survey
Bibliography
© 2007 MIB Solutions, Inc. All Rights Reserved
Credibility MethodsFormula
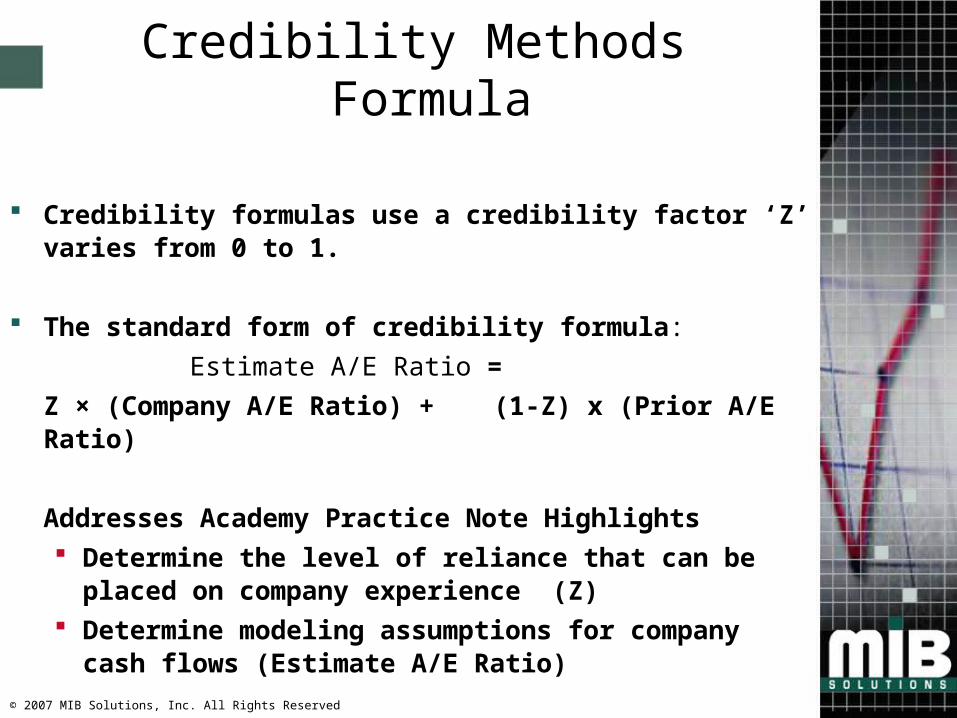
Credibility formulas use a credibility factor ‘Z’ varies from 0 to 1.
The standard form of credibility formula:Estimate A/E Ratio =
Z × (Company A/E Ratio) + (1-Z) x (Prior A/E Ratio)
Addresses Academy Practice Note Highlights Determine the level of reliance that can be placed on company
experience (Z) Determine modeling assumptions for company cash flows
(Estimate A/E Ratio)
© 2007 MIB Solutions, Inc. All Rights Reserved
Credibility Methods Variance
Total Variance = Process Variance + Variance of Hypothetical Means
Limited Fluctuation uses Process Variance
Bühlmann Empirical Bayesian uses both Process Variance + Variance of Hypothetical Means
© 2007 MIB Solutions, Inc. All Rights Reserved
Mean of Company
A
Mean ofCompany
B
Mean of Company
C
Mean of Company
F
Mean of Company
E
Mean of Company
D
Mean ofAll
Companies
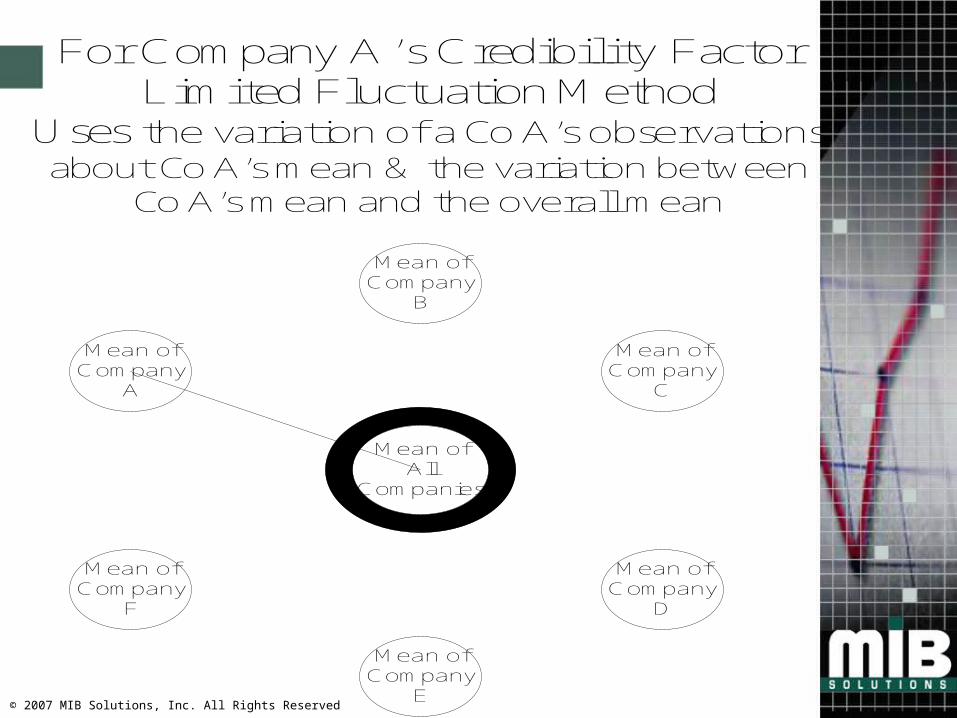
For Company A’s Credibility FactorLimited Fluctuation Method
Uses the variation of a Co A’s observations about Co A’s mean & the variation between
Co A’s mean and the overall mean
© 2007 MIB Solutions, Inc. All Rights Reserved
Mean of Company
A
Mean ofCompany
B
Mean of Company
C
Mean of Company
F
Mean of Company
E
Mean of Company
D
Mean ofAll
Companies
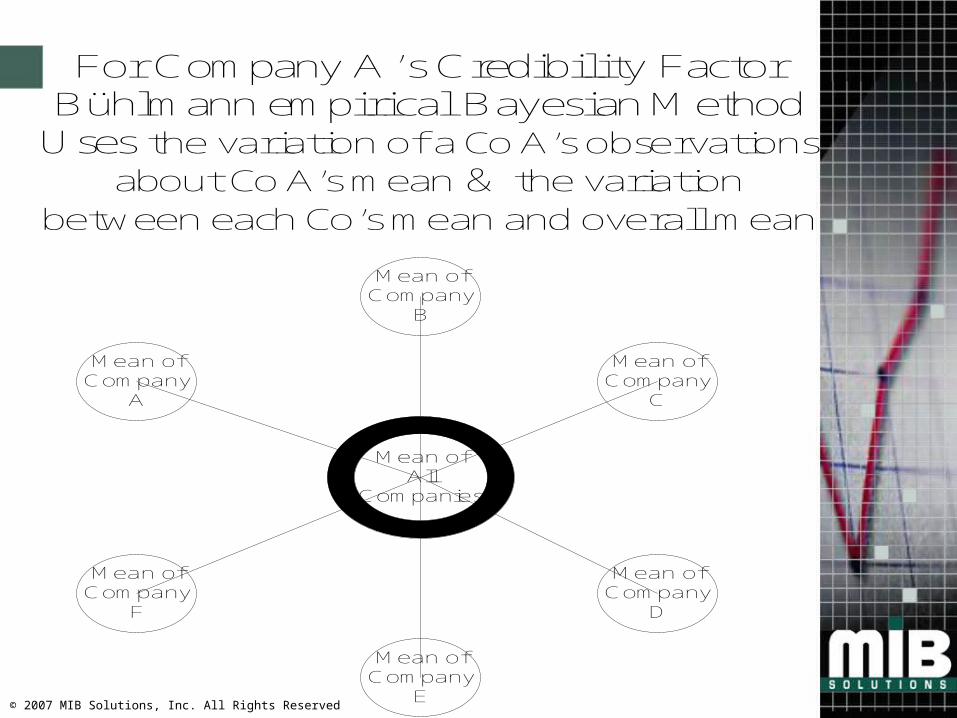
For Company A’s Credibility FactorBühlmann empirical Bayesian Method
Uses the variation of a Co A’s observations about Co A’s mean & the variation
between each Co’s mean and overall mean
© 2007 MIB Solutions, Inc. All Rights Reserved
Real Life Mortality Example
Experience is from ten companies that participated in the SOA 2004-05 experience study
Companies were selected in order to give a mixture of large, medium and small size companies.
To maintain strict confidentiality of individual company information, only a portion of each company’s mortality and lapse data was used.
© 2007 MIB Solutions, Inc. All Rights Reserved
Real Life Mortality Example
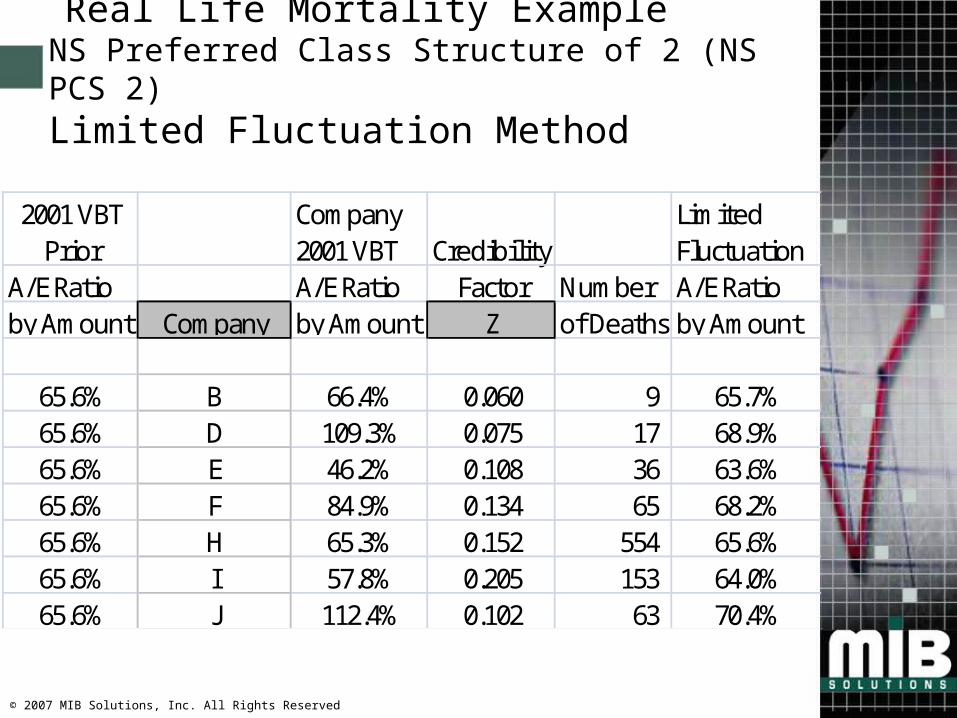
The variability of the Company A/E Ratios around the Prior A/E Ratio of the inter-company study is evident
In general, Credibility Factor ‘Z’ increases with increasing number of deaths.
Difference between estimate A/E ratios and company A/E ratios varies substantially among different companies
© 2007 MIB Solutions, Inc. All Rights Reserved
Real Life Mortality ExampleNS Preferred Class Structure of 2 (NS PCS 2)Limited Fluctuation Method
2001 VBT Prior
Company 2001 VBT Credibility
Limited Fluctuation
A/E Ratio A/E Ratio Factor Number A/E Ratioby Amount Company by Amount Z of Deaths by Amount
65.6% B 66.4% 0.060 9 65.7%65.6% D 109.3% 0.075 17 68.9%65.6% E 46.2% 0.108 36 63.6%65.6% F 84.9% 0.134 65 68.2%65.6% H 65.3% 0.152 554 65.6%65.6% I 57.8% 0.205 153 64.0%65.6% J 112.4% 0.102 63 70.4%
© 2007 MIB Solutions, Inc. All Rights Reserved
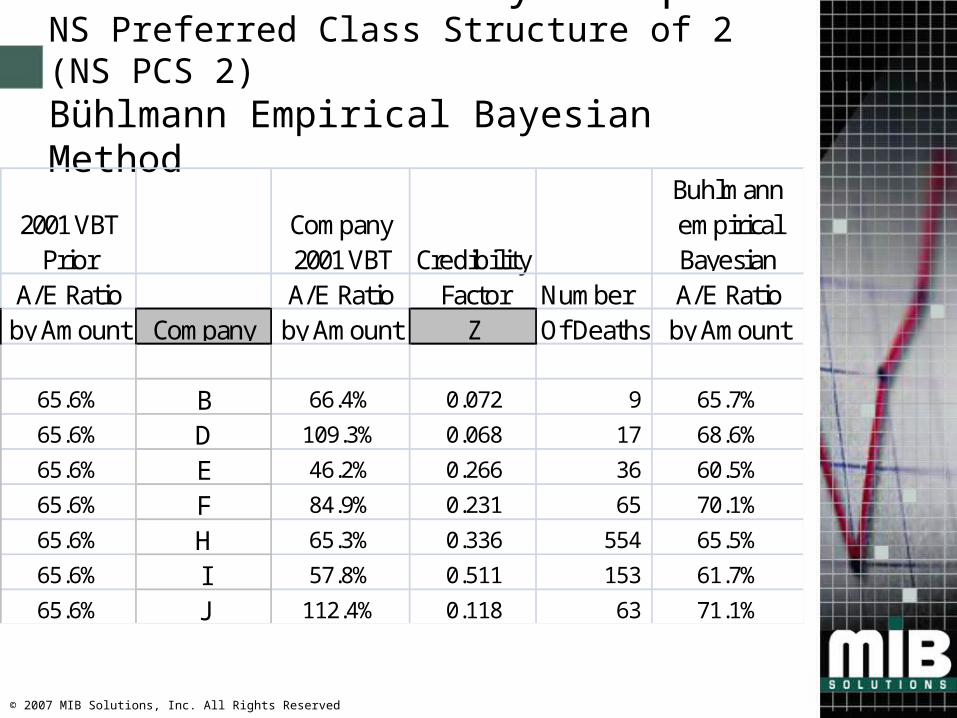
Real Life Mortality ExampleNS Preferred Class Structure of 2 (NS PCS 2) Bühlmann Empirical Bayesian Method
2001 VBT Prior
Company 2001 VBT Credibility
Buhlmann empirical Bayesian
A/E Ratio A/E Ratio Factor Number A/E Ratioby Amount Company by Amount Z Of Deaths by Amount
65.6% B 66.4% 0.072 9 65.7%
65.6% D 109.3% 0.068 17 68.6%
65.6% E 46.2% 0.266 36 60.5%
65.6% F 84.9% 0.231 65 70.1%
65.6% H 65.3% 0.336 554 65.5%
65.6% I 57.8% 0.511 153 61.7%
65.6% J 112.4% 0.118 63 71.1%
© 2007 MIB Solutions, Inc. All Rights Reserved
Elements of Credibility Theory
Prior A/E Ratios
Company A/E Ratios
Estimate A/E Ratios
© 2007 MIB Solutions, Inc. All Rights Reserved
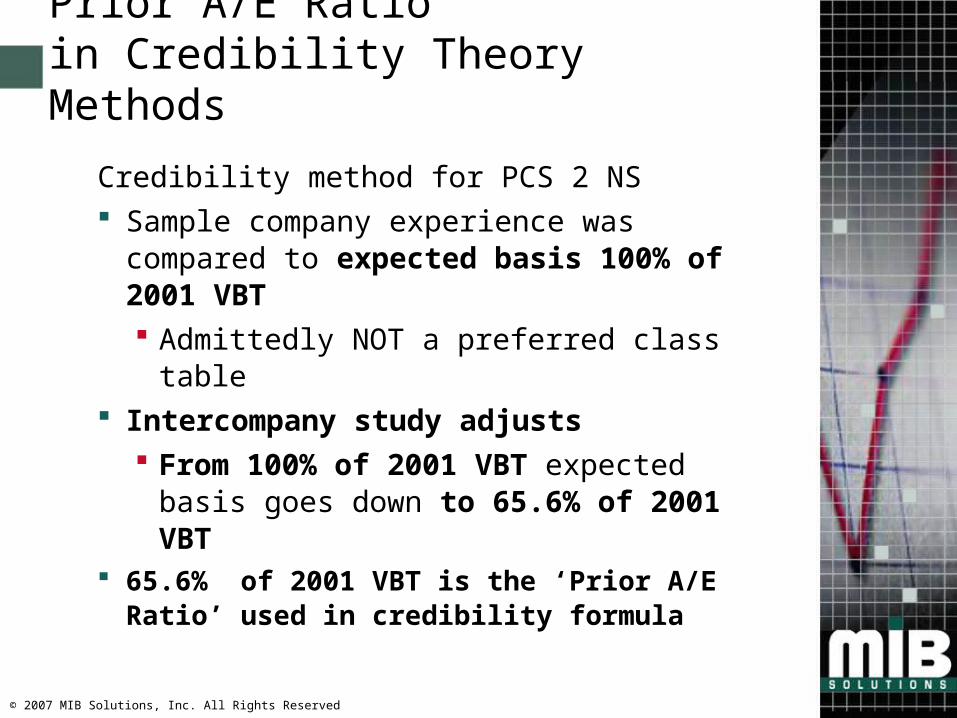
Prior A/E Ratio in Credibility Theory Methods
Credibility method for PCS 2 NS Sample company experience was compared
to expected basis 100% of 2001 VBT Admittedly NOT a preferred class table
Intercompany study adjusts From 100% of 2001 VBT expected basis
goes down to 65.6% of 2001 VBT 65.6% of 2001 VBT is the ‘Prior A/E Ratio’
used in credibility formula
© 2007 MIB Solutions, Inc. All Rights Reserved
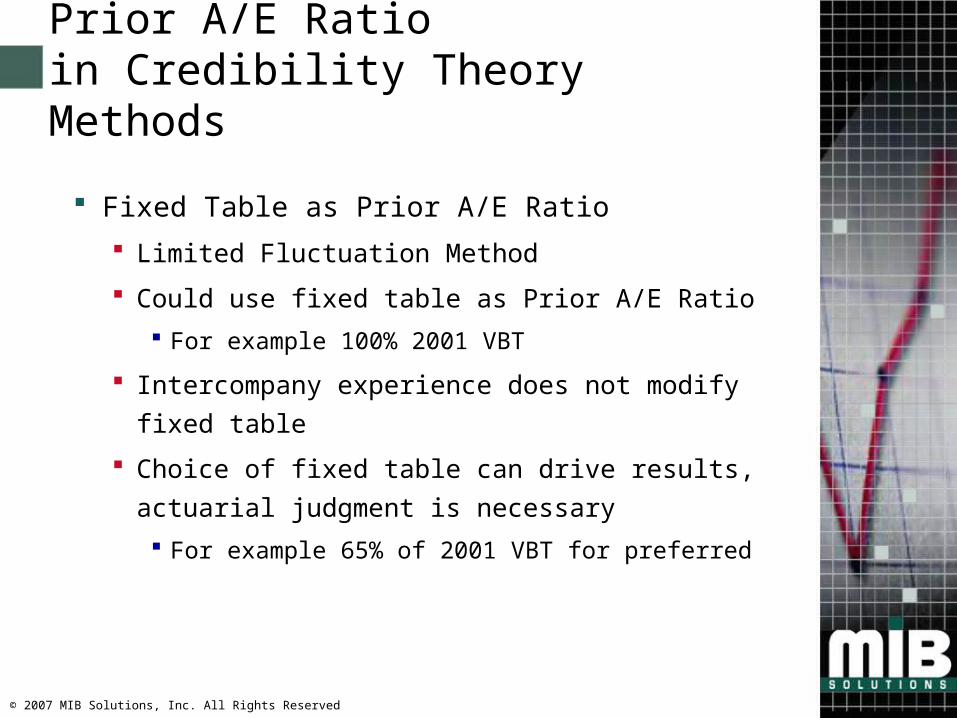
Prior A/E Ratio in Credibility Theory Methods
Fixed Table as Prior A/E Ratio Limited Fluctuation Method
Could use fixed table as Prior A/E Ratio For example 100% 2001 VBT
Intercompany experience does not modify fixed table
Choice of fixed table can drive results, actuarial judgment is necessary For example 65% of 2001 VBT for preferred
© 2007 MIB Solutions, Inc. All Rights Reserved
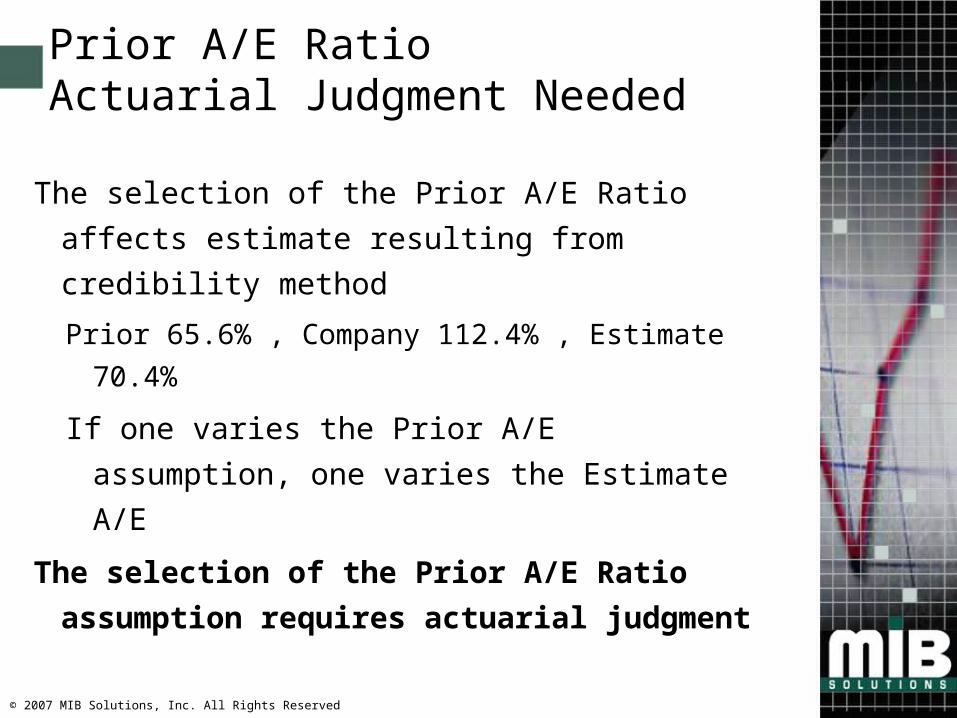
Prior A/E RatioActuarial Judgment Needed
The selection of the Prior A/E Ratio affects estimate resulting from credibility method
Prior 65.6% , Company 112.4% , Estimate 70.4%
If one varies the Prior A/E assumption, one varies the Estimate A/E
The selection of the Prior A/E Ratio
assumption requires actuarial judgment
© 2007 MIB Solutions, Inc. All Rights Reserved
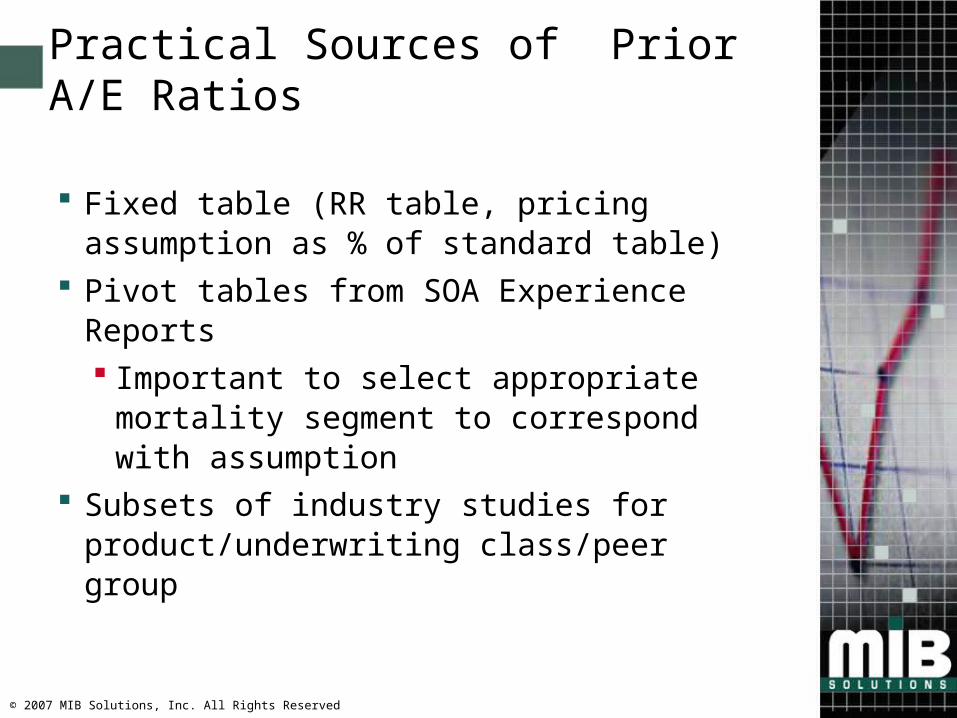
Practical Sources of Prior A/E Ratios
Fixed table (RR table, pricing assumption as % of standard table)
Pivot tables from SOA Experience Reports Important to select appropriate mortality
segment to correspond with assumption Subsets of industry studies for
product/underwriting class/peer group
© 2007 MIB Solutions, Inc. All Rights Reserved
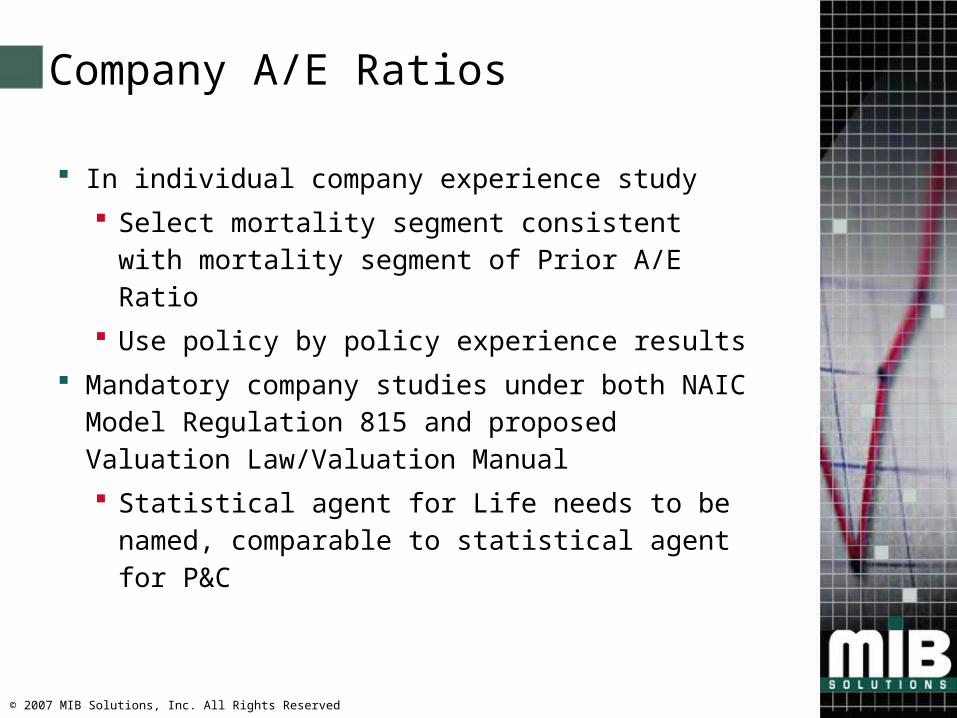
Company A/E Ratios
In individual company experience study Select mortality segment consistent with mortality
segment of Prior A/E Ratio Use policy by policy experience results
Mandatory company studies under both NAIC Model Regulation 815 and proposed Valuation Law/Valuation Manual Statistical agent for Life needs to be named,
comparable to statistical agent for P&C
© 2007 MIB Solutions, Inc. All Rights Reserved
Credibility Theory
Lapse Application
Many lapses, ‘Z’ is high
Company Experience Rules
© 2007 MIB Solutions, Inc. All Rights Reserved
Application of Credibility Methods to Lapse
Used term policies in the NS PCS 2 for the 7 companies studied for mortality sample
Recent LIMRA study is basis for expected lapse
Actual experience of 7 companies produces mean used for Prior A/E Ratio
© 2007 MIB Solutions, Inc. All Rights Reserved
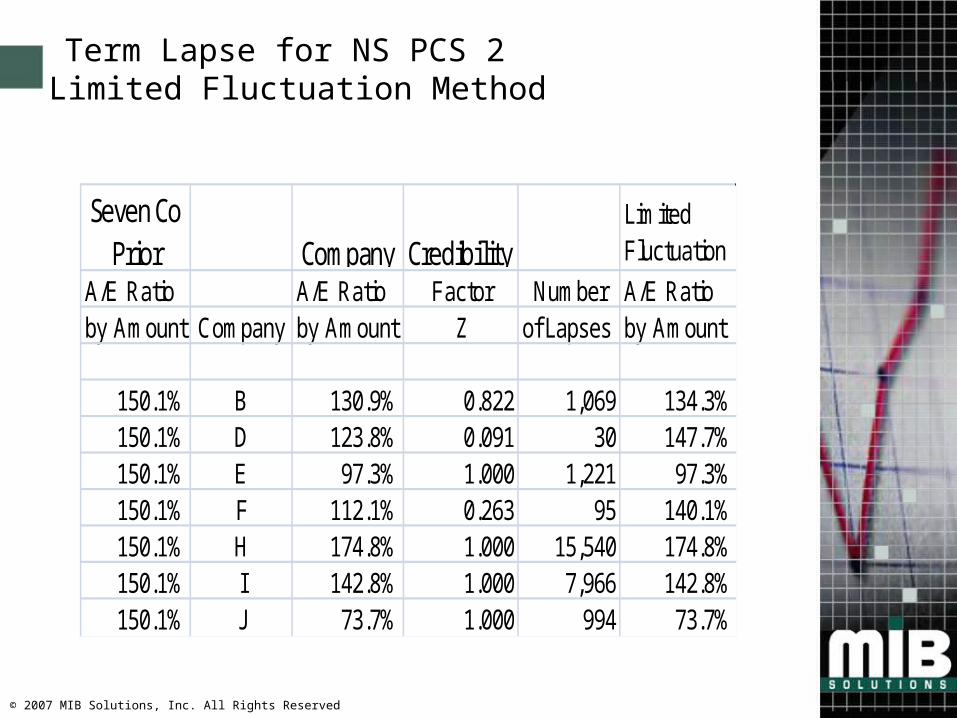
Term Lapse for NS PCS 2Limited Fluctuation Method
Seven Co Prior Company Credibility
Limited Fluctuation
A/E Ratio A/E Ratio Factor Number A/E Ratioby Amount Company by Amount Z of Lapses by Amount
150.1% B 130.9% 0.822 1,069 134.3%150.1% D 123.8% 0.091 30 147.7%150.1% E 97.3% 1.000 1,221 97.3%150.1% F 112.1% 0.263 95 140.1%150.1% H 174.8% 1.000 15,540 174.8%150.1% I 142.8% 1.000 7,966 142.8%150.1% J 73.7% 1.000 994 73.7%
© 2007 MIB Solutions, Inc. All Rights Reserved
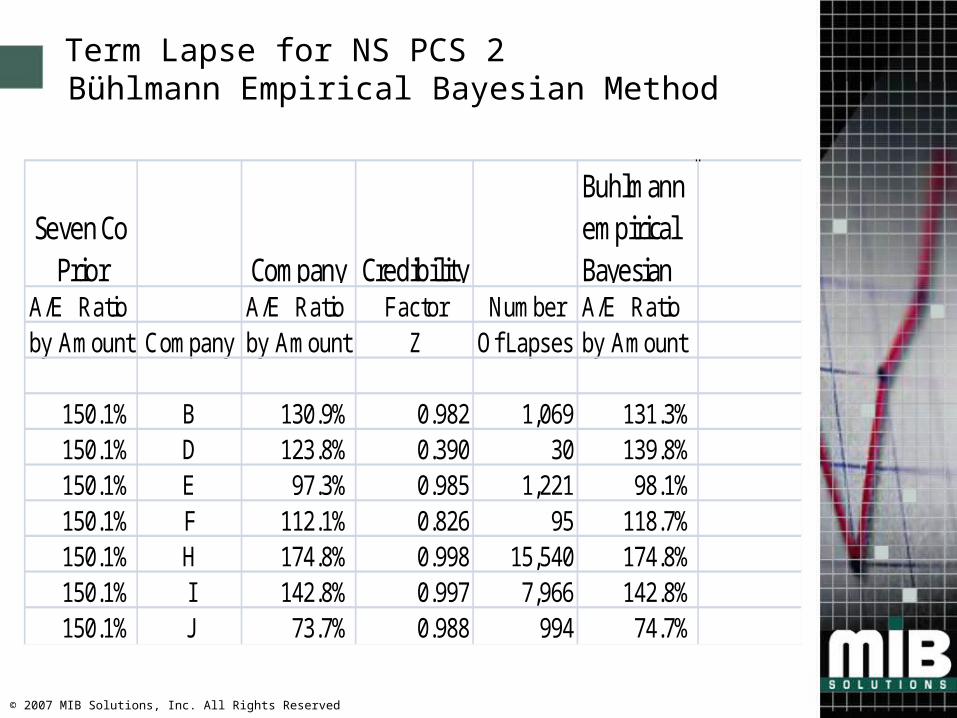
Term Lapse for NS PCS 2 Bühlmann Empirical Bayesian Method
Seven Co Prior Company Credibility
Buhlmann empirical Bayesian
A/E Ratio A/E Ratio Factor Number A/E Ratioby Amount Company by Amount Z Of Lapses by Amount
150.1% B 130.9% 0.982 1,069 131.3%150.1% D 123.8% 0.390 30 139.8%150.1% E 97.3% 0.985 1,221 98.1%150.1% F 112.1% 0.826 95 118.7%150.1% H 174.8% 0.998 15,540 174.8%150.1% I 142.8% 0.997 7,966 142.8%150.1% J 73.7% 0.988 994 74.7%
© 2007 MIB Solutions, Inc. All Rights Reserved
Credibility Theory and VM-20
NAIC’s Life and Health Actuarial Task Force
New Valuation Law and Valuation Manual (VM)
VM-20 covers valuation of life insurance products
Credibility theory not used for less than 30 deaths
Credibility theory used for 30 or greater deaths in credibility set of mortality segments
© 2007 MIB Solutions, Inc. All Rights Reserved
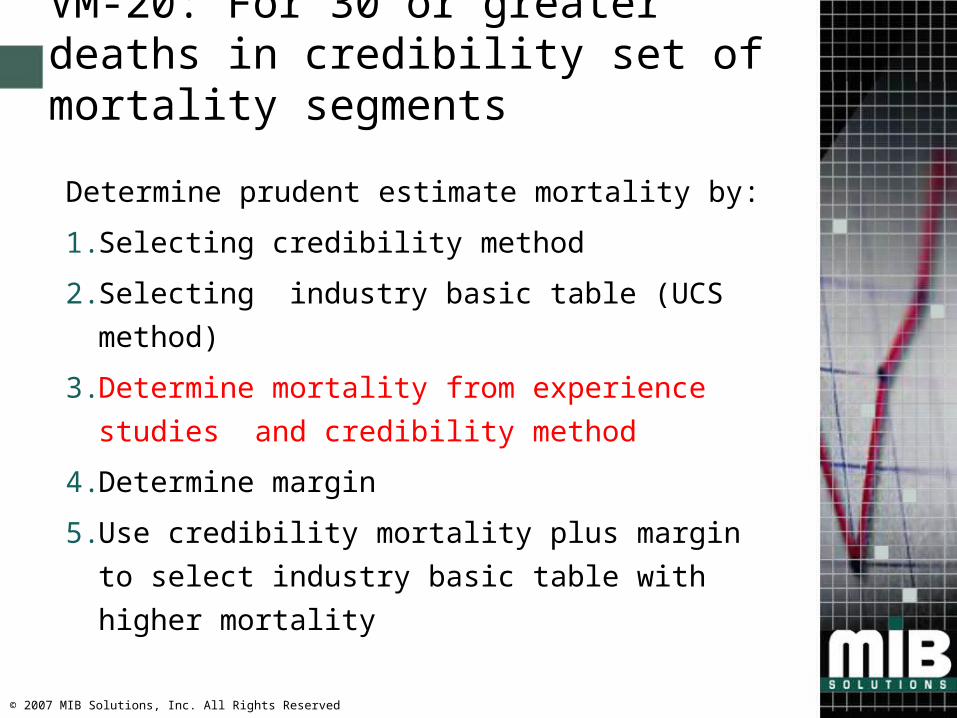
VM-20: For 30 or greater deaths in credibility set of mortality segments
Determine prudent estimate mortality by:
1. Selecting credibility method
2. Selecting industry basic table (UCS method)
3. Determine mortality from experience studies and credibility method
4. Determine margin
5. Use credibility mortality plus margin to select industry basic table with higher mortality
© 2007 MIB Solutions, Inc. All Rights Reserved
Selecting credibility method Either the Limited Fluctuation method or the Bühlmann
Empirical Bayesian method are options.
Limited Fluctuation method
Requires only your company’s data
Can use Excel tables from MIB Solutions report
Can be done in-house
Bühlmann Empirical Bayesian method
May give higher ‘Z’ than Limited Fluctuation method
Requires data from multiple companies
Can only be done by statistical agent
For this example, use Limited Fluctuation Method
© 2007 MIB Solutions, Inc. All Rights Reserved
VM-20: For 30 or greater deaths in credibility set of mortality segments
Determine prudent estimate mortality by:
1. Selecting credibility method
2. Selecting industry basic table (UCS method)
3. Determine mortality from experience studies and credibility method
4. Determine margin
5. Use credibility mortality plus margin to select industry basic table with higher mortality
© 2007 MIB Solutions, Inc. All Rights Reserved
Selecting industry basic table (UCS method)
For each mortality segment
Apply the UCS method for mortality segment
Select the appropriate RR table
© 2007 MIB Solutions, Inc. All Rights Reserved
VM-20: For 30 or greater deaths in credibility set of mortality segments
Determine prudent estimate mortality by:
1. Selecting credibility method
2. Selecting industry basic table (UCS method)
3. Determine mortality from experience studies and credibility method
4. Determine margin
5. Use credibility mortality plus margin to select industry basic table with higher mortality
© 2007 MIB Solutions, Inc. All Rights Reserved
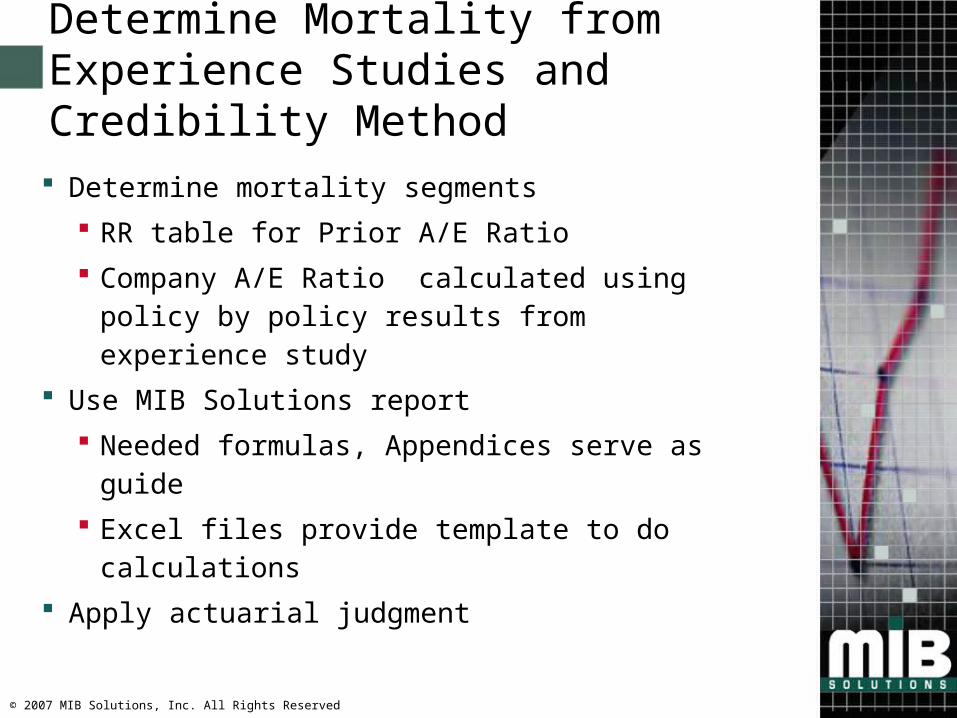
Determine Mortality from Experience Studies and Credibility Method
Determine mortality segments RR table for Prior A/E Ratio Company A/E Ratio calculated using policy by
policy results from experience study Use MIB Solutions report
Needed formulas, Appendices serve as guide Excel files provide template to do calculations
Apply actuarial judgment
© 2007 MIB Solutions, Inc. All Rights Reserved
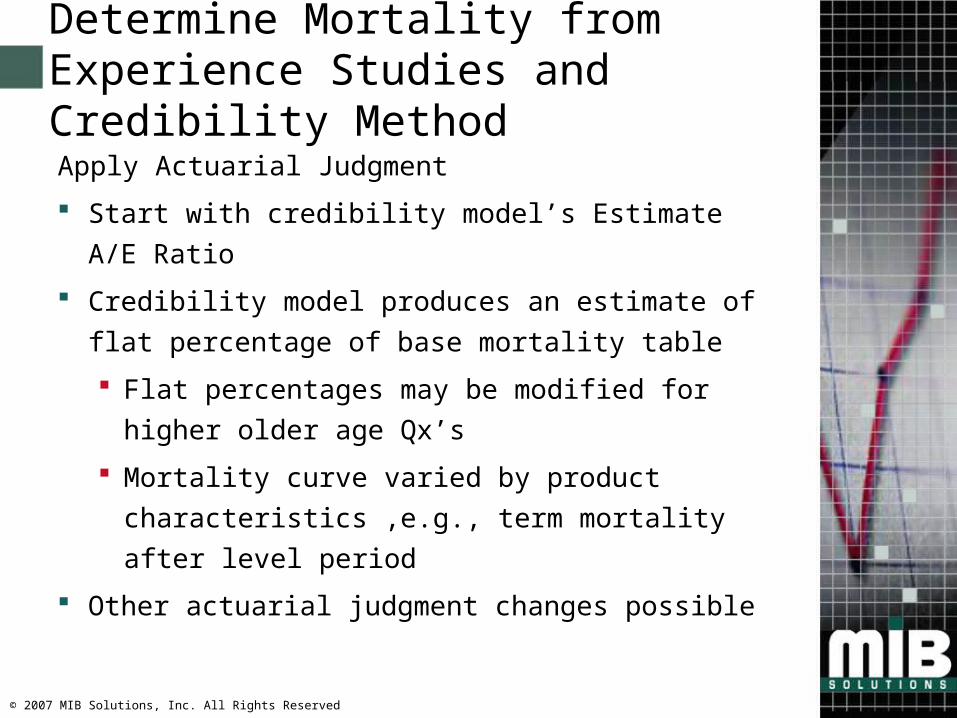
Determine Mortality from Experience Studies and Credibility MethodApply Actuarial Judgment
Start with credibility model’s Estimate A/E Ratio
Credibility model produces an estimate of flat percentage of base mortality table
Flat percentages may be modified for higher older age Qx’s
Mortality curve varied by product characteristics ,e.g., term mortality after level period
Other actuarial judgment changes possible
© 2007 MIB Solutions, Inc. All Rights Reserved
VM-20: For 30 or greater deaths in credibility set of mortality segments
Determine prudent estimate mortality by:
1. Selecting credibility method
2. Selecting industry basic table (UCS method)
3. Determine mortality from experience studies and credibility method
4. Determine margin
5. Use credibility mortality plus margin to select industry basic table with higher mortality
© 2007 MIB Solutions, Inc. All Rights Reserved
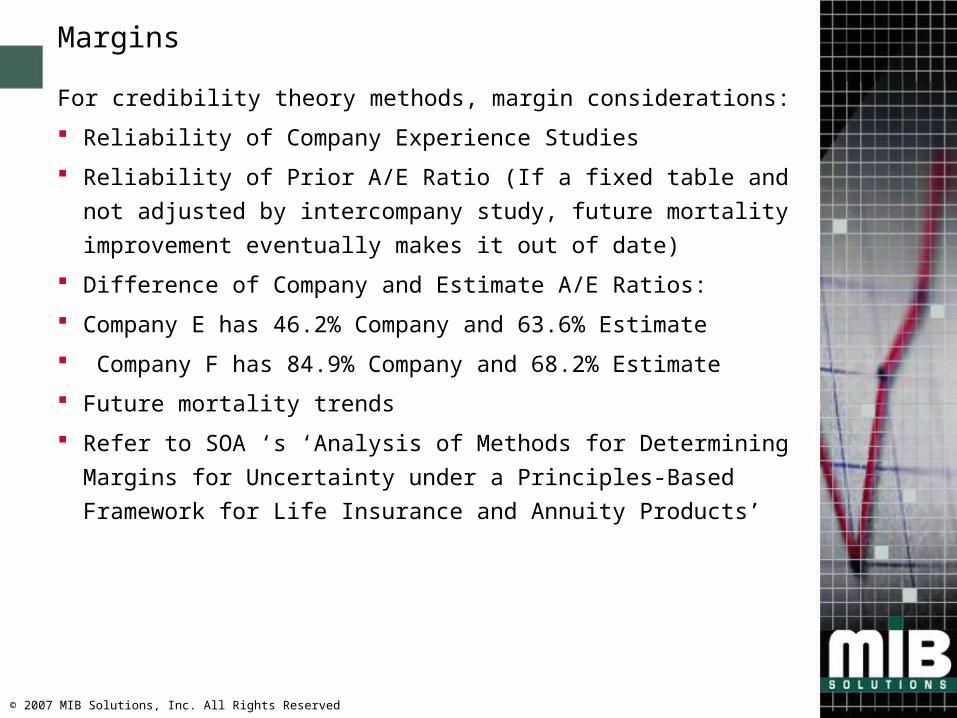
Margins
For credibility theory methods, margin considerations:
Reliability of Company Experience Studies
Reliability of Prior A/E Ratio (If a fixed table and not adjusted by intercompany study, future mortality improvement eventually makes it out of date)
Difference of Company and Estimate A/E Ratios:
Company E has 46.2% Company and 63.6% Estimate
Company F has 84.9% Company and 68.2% Estimate
Future mortality trends
Refer to SOA ‘s ‘Analysis of Methods for Determining Margins for Uncertainty under a Principles-Based Framework for Life Insurance and Annuity Products’
© 2007 MIB Solutions, Inc. All Rights Reserved
VM-20: For 30 or greater deaths in credibility set of mortality segments
Determine prudent estimate mortality by:
1. Selecting credibility method
2. Selecting industry basic table (UCS method)
3. Determine mortality from experience studies and credibility method
4. Determine margin
5. Use credibility mortality plus margin to select industry basic table with higher mortality
© 2007 MIB Solutions, Inc. All Rights Reserved
Credibility TheoryOther Mortality Applications
For evaluating pricing assumptions
Use your company’s pricing assumptions as percentage of expected table as Prior A/E Ratio
Use company experience study for Co A/E Ratio
Limited Fluctuation method and Excel files from MIB Solution’s report to produce Estimate A/E Ratio
Modify results using actuarial judgment
© 2007 MIB Solutions, Inc. All Rights Reserved
Credibility TheoryOther Mortality Applications
For risk management application
Use your best guess as Prior A/E Ratio
Use company experience study for Co A/E Ratio
Limited Fluctuation method and Excel files from MIB Solution’s report to produce Estimate A/E Ratio
Modify results using actuarial judgment
© 2007 MIB Solutions, Inc. All Rights Reserved
Practical Applications of Credibility Theory
Important – Co A/E varies from Intercompany A/E Credibility Methods applied with actuarial judgment
Prior A/E Ratios Company A/E Ratios Estimate A/E Ratios
Selection of Credibility Method Limited Fluctuation can be done in-house by company using
MIB Solutions’ Report Lapse Application – Company results rule, insist on high quality
company lapse experience studies Mortality Application - VM-20, evaluating pricing assumptions, risk
management studies
© 2007 MIB Solutions, Inc. All Rights Reserved
Invitations
I. MIB Solutions is seeking current SOA contributor to ILEC study to develop practical implementation techniques for Credibility Theory:
Use that company’s already submitted data Co-author practical credibility techniques paper Involvement will
Improve knowledge of credibility techniques Provide roadmap for applying in your company
II. If you have questions on implementing credibility theory, call me for free advice!