powerpoint presentationwarrington.ufl.edu/centers/cres/events/2018_trends/docs/slides... ·...
TRANSCRIPT


SPENCER LEVY, COME ON DOWN!

4 MORE YEARS?
G L O B A L
CRE AND FEDERAL POLICY
THE TAXMAN COMMETH

G L O B A L
SALT IN YOUR WOUNDS?

TRADE

DEMOGRAPHICS/HEALTHCARE


ABRAHAM MASLOW’S NEED HIERARCHY

L I G H T N I N G R O U N D

G L O B A L I Z A T I O N

I N T E R E S T R A T E S

R E T A I L

0%
2%
4%
6%
8%
10%
12%
14%
16%
18%
2010 2011 2012 2013 2014 2015 2016 2017 2018 2019 2020
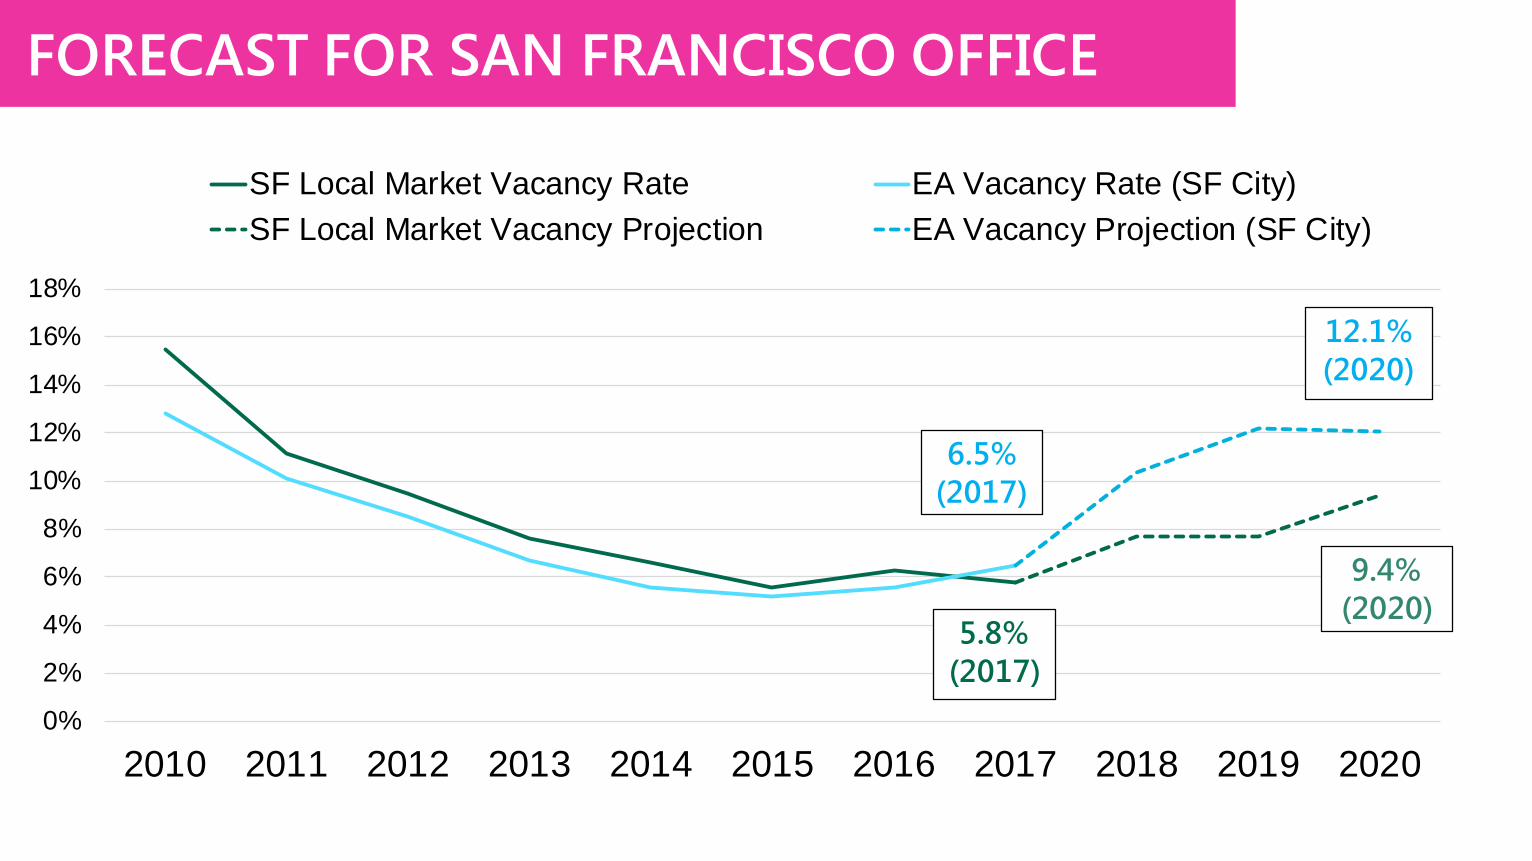
SF Local Market Vacancy Rate EA Vacancy Rate (SF City)SF Local Market Vacancy Projection EA Vacancy Projection (SF City)
FORECAST FOR SAN FRANCISCO OFFICE
6.5% (2017)
5.8% (2017)
12.1% (2020)
9.4% (2020)

-8%
-6%
-4%
-2%
0%
2%
4%
6%
8%
10%
Atlanta Dallas Philadelphia Denver Chicago Washington,DC
Real Rent Growth
Source: CBRE Econometric Advisors, Q2 2017.
OFFICE RENT GROWTH BACKTEST

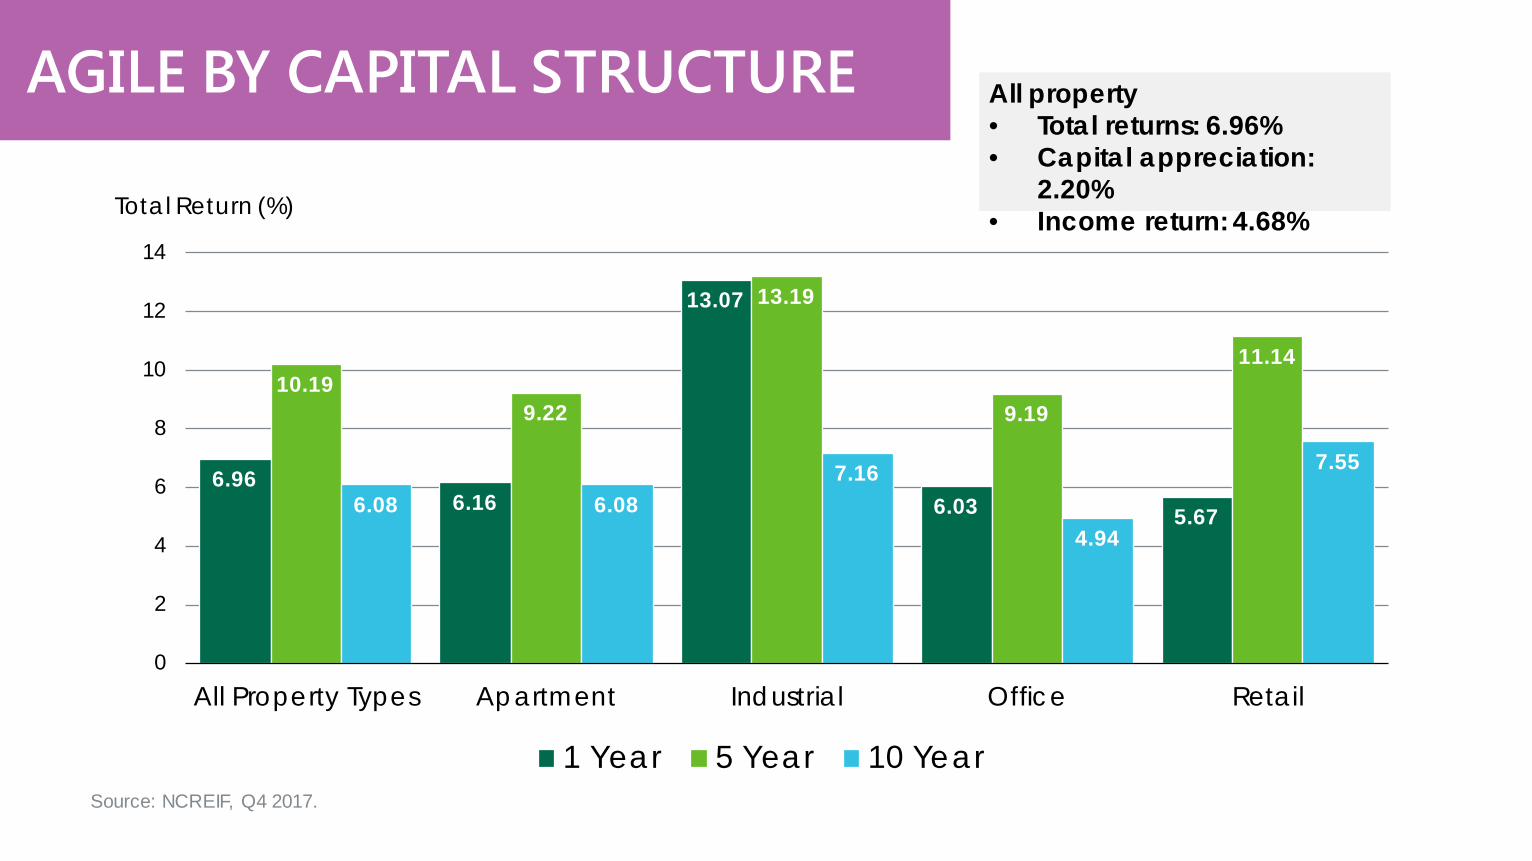
AGILE BY CAPITAL STRUCTURE All property • Total returns: 6.96% • Capital appreciation:
2.20% • Income return: 4.68%
6.96 6.16
13.07
6.03 5.67
10.19 9.22
13.19
9.19
11.14
6.08 6.08 7.16
4.94
7.55
0
2
4
6
8
10
12
14
All Property Types Apartment Industrial Office Retail
Total Return (%)
1 Year 5 Year 10 YearSource: NCREIF, Q4 2017.

2016 2017
Note: Transactions include deals in the Office, Retail, Industrial, Hotel, Residential and Other commercial sectors. Development sites are excluded. Source: RCA, CBRE Research, January 2018.
TOP FOREIGN INVESTMENT DESTINATIONS
31%
9%
3% 6% 3% 7%
41%
New York Los Angeles Chicago Washington D.C.
Boston San Francisco Non-Gateway
20%
6%
5%
10%
5% 8%
46%

Source: Real Capital Analytics, CBRE Research, February 2018. Note: Sales include Office, Industrial, Multifamily, Hotel, Retail, and Development Sites over $2.5 million.
ORLANDO CAPITAL MARKETS
1.45 1.68
2.04 1.79
1.96
11.8% 20.3%
47.6%
35.5% 30.0%
0.0
0.5
1.0
1.5
2.0
2.5
2013 2014 2015 2016 2017
Investment Sales ($ Billions) Total Investment

Source: CBRE Research, Global Investor Intentions Survey 2018, CBRE Econometric Advisors
#1 Los Angeles (34th)
#2 Dallas/Ft. Worth (3rd)
#3t New York (37th)
#3t Seattle (10th)
#4t San Francisco (38th)
#4t Houston (1st)
#5 Atlanta (18th)
#6 Washington, D.C. (30th)
#7 Denver (24th)
#8 Miami (12th)
#9t Nashville (11th)
#9t Portland (6th)
#9t Boston (29th)
#10t Austin (2nd)
#10t Tampa (5th)
#11 Phoenix (8th)
Forecasted office-using job growth rank for next 2 years in parentheses.
AGILE BY MARKET/SUBMARKET

SUN BELT MARKETS EXPECTED TO ADD JOBS AT FASTEST PACE Top 20 Markets for Forecasted Office- Using Employment, Average Annual Growth (%) – 2019 vs. 2017
Note: Ranking includes markets with at least 200,000 forecasted office-using jobs as of 2019. Source: CBRE Econometric Advisors, Q4 2017.
HOUSTON 2.3
AUSTIN 2.0
DALLAS/FT. WORTH
2.0
TAMPA 1.9
SAN ANTONIO 1.7
PHOENIX 1.6
PORTLAND 1.8
ORLANDO 1.9
RALEIGH 1.6
SEATTLE 1.3
NASHVILLE 1.3
CLEVELAND 1.2
CHARLOTTE 1.1
COLUMBUS 1.1
SALT LAKE CITY 1.2
MIAMI 1.3
MINNEAPOLIS 1.0
ATLANTA 0.9
CINCINNATI 0.9
BALTIMORE 0.9

LARGEST MARKETS TO ADD THE MOST JOBS Top 20 Markets for Forecasted Office-Using Employment, Cumulative Growth (Thou.) – 2019 vs. 2017
Note: Ranking includes markets with at least 200,000 forecasted office-using jobs as of 2019. Source: CBRE Econometric Advisors, Q4 2017.
DALLAS/FT. WORTH 35.6
HOUSTON 26.5
CHICAGO 19.8
PHOENIX 15.9
TAMPA 12.9
SEATTLE 12.4
ATLANTA 13.9
NEW YORK 17.5
WASHINGTON, DC 12.3
BOSTON 11.1
LOS ANGELES
10.3
AUSTIN 9.8
DETROIT 9.2
PORTLAND 9.1
ORLANDO 9.8
MINNEAPOLIS 10.0
SAN ANTONIO 7.2
DENVER 7.1
RALEIGH 6.9
CHARLOTTE 6.6

Mining and Construction
5% Manufacturing 8% Transportation/
Utilities 4% Wholesale Trade 4%
Retail Trade 11%
Information 2%
Financial Activities
6% Prof. and Bus. Services
14%
Educ. and Health
Services 16%
Leisure and Hosp. Services
11%
Other Services 4%
Government 15%
ORLANDO UNITED STATES
Source: Moody’s Analytics, BLS, CBRE Research, November 2017.
INDUSTRY COMPARISON
Mining and Construction
6% Manufacturing
3% Transportation/ Utilities
3% Wholesale Trade 4%
Retail Trade 12%
Information 2%
Financial Activities
6%
Prof. and Bus. Services
17%
Educ. and Health
Services 12%
Leisure and Hosp. Services
21%
Other Services 4%
Government 10%

EMERGING E-COMMERCE TRENDS
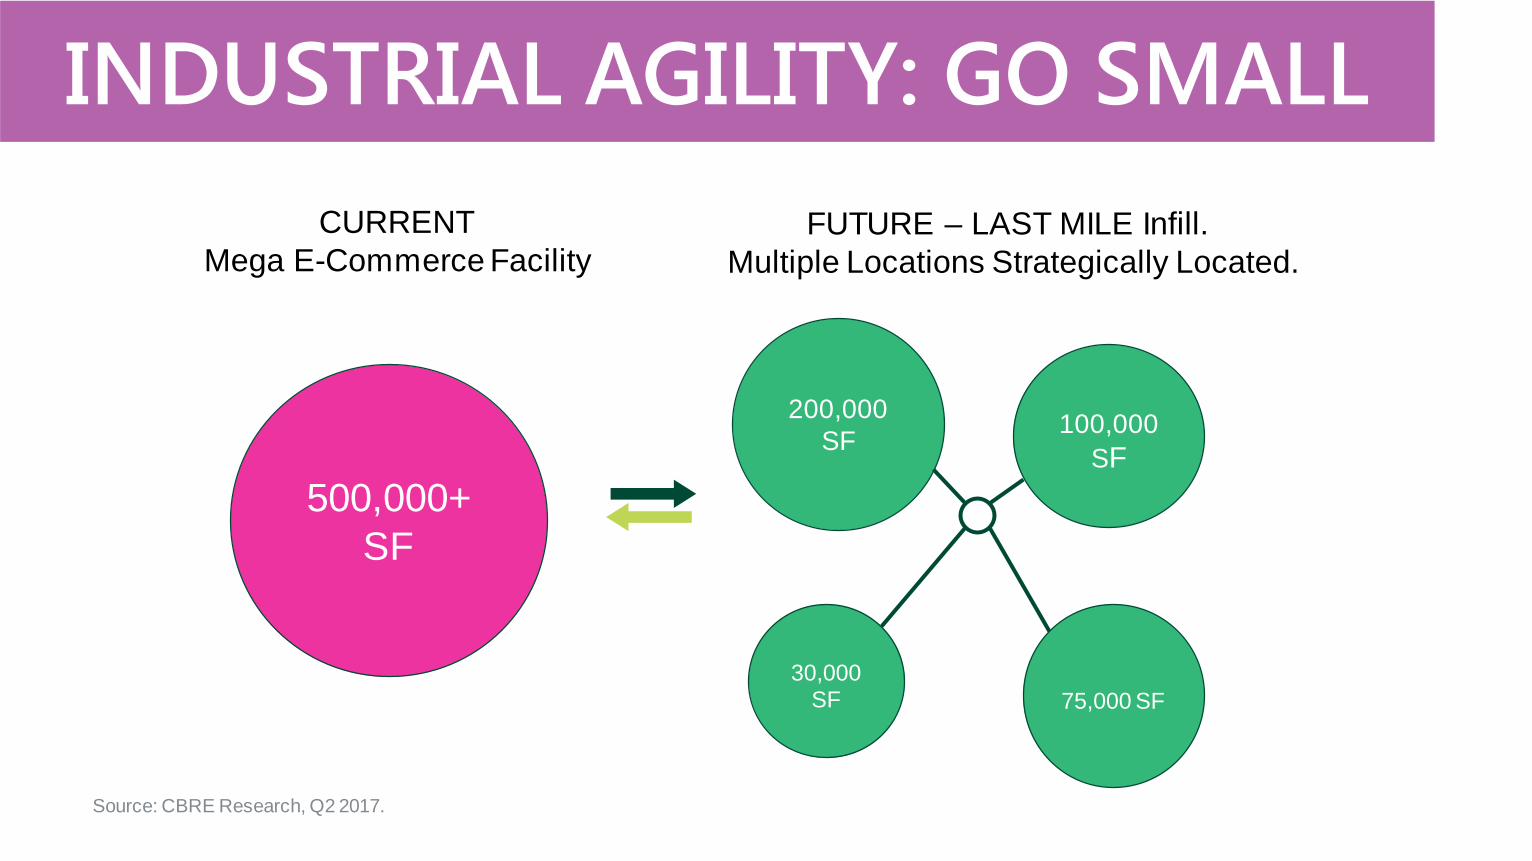
CURRENT Mega E-Commerce Facility
FUTURE – LAST MILE Infill. Multiple Locations Strategically Located.
500,000+ SF
200,000 SF 100,000
SF
30,000 SF 75,000 SF
Source: CBRE Research, Q2 2017.
INDUSTRIAL AGILITY: GO SMALL


-1.5-1.0-0.50.00.51.01.52.0
All
Age
s
<25
year
s
25 to
29
30 to
34
35 to
39
40 to
44
45 to
49
50 to
54
55 to
59
60 to
64
65 to
69
70 to
74
75+
year
s
U.S. Homeownership Rate, Q4 2017 - Chg from Prior Year (Pts)
MULTIFAMILY: KEEP BUILDING
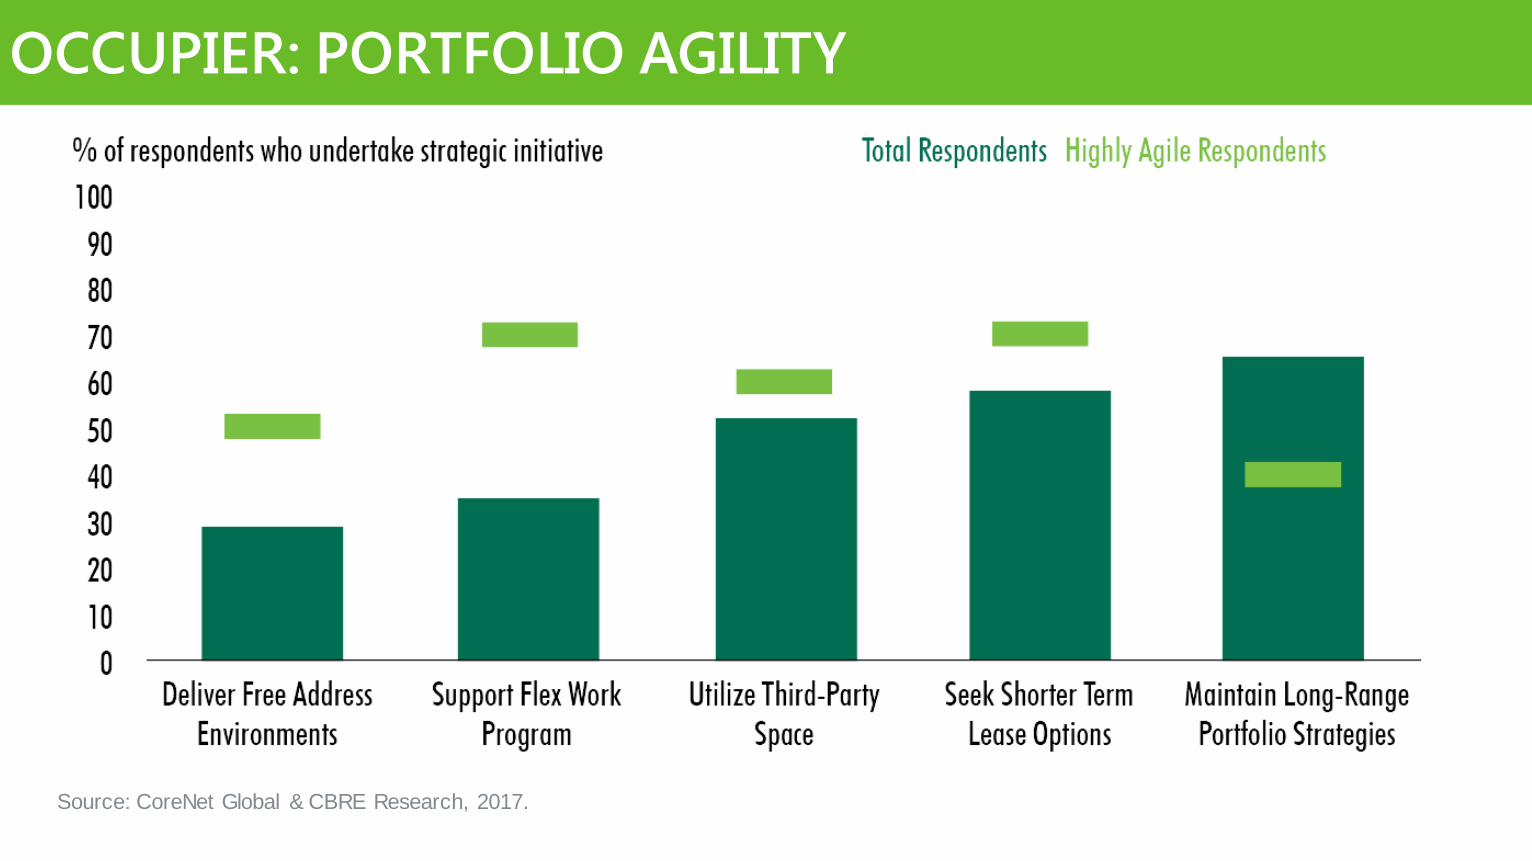
Source: CoreNet Global & CBRE Research, 2017.
OCCUPIER: PORTFOLIO AGILITY