powerpoint presentation€¦ · ppt file · web view · 2014-11-05turbidimetry ....
TRANSCRIPT
Almazov Federal Medical Research Centre
St.Petеrsburg, Russia
Laboratory tests in blood coagulation
disorders
Vavilova Tatiana
September 18, 2014Moscow

Conflict of interests is absent
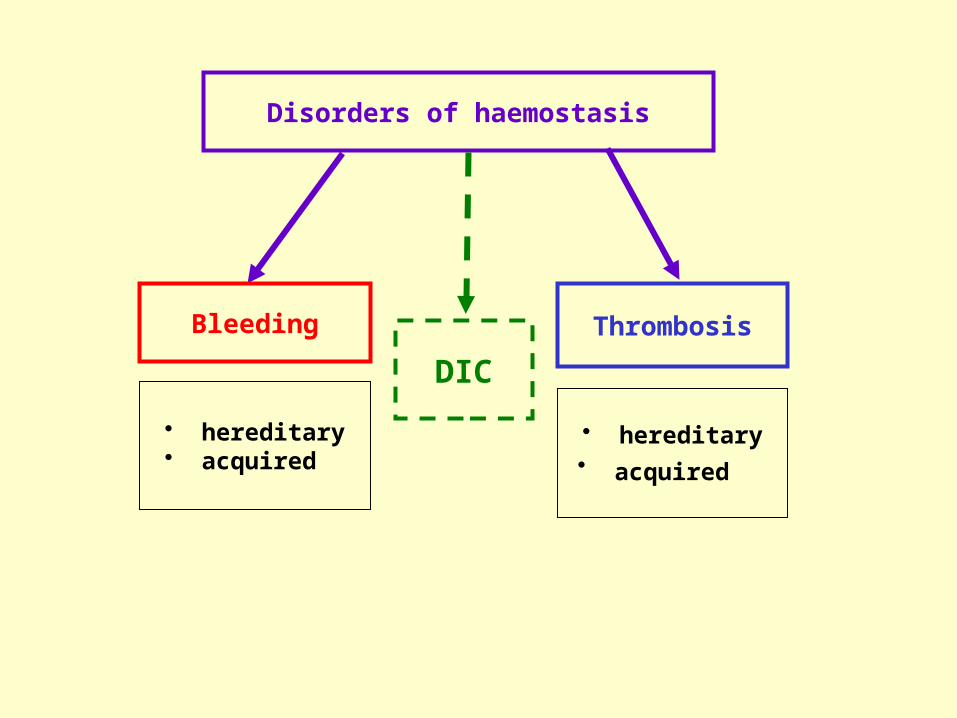
Thrombosis
Disorders of haemostasis
Bleeding
• hereditary• acquired
• hereditary• acquired
DIC
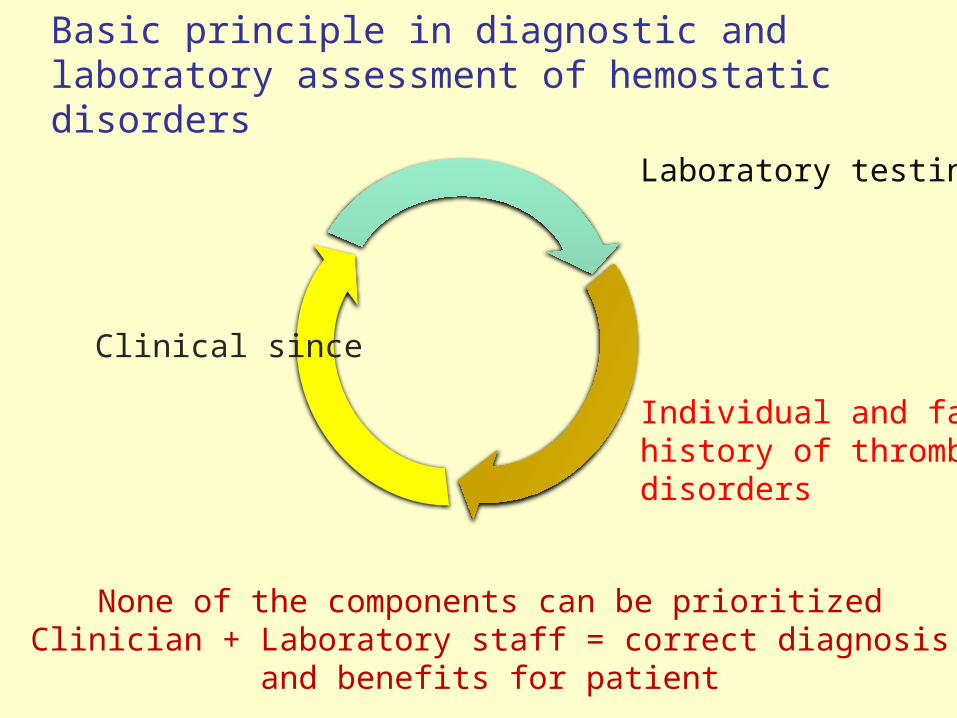
Basic principle in diagnostic and laboratory assessment of hemostatic disorders
None of the components can be prioritizedClinician + Laboratory staff = correct diagnosis
and benefits for patient
Clinical since
Laboratory testing
Individual and family history of thrombotic disorders

The investigation of haemostasis disorder requires a stepwise approach
Clinical decision
Clinical signs
Laboratory results
Anamnesis
Anamnesis
Anamnesis
START
Laboratory results
Laboratory results
Clinical signsClinical signs
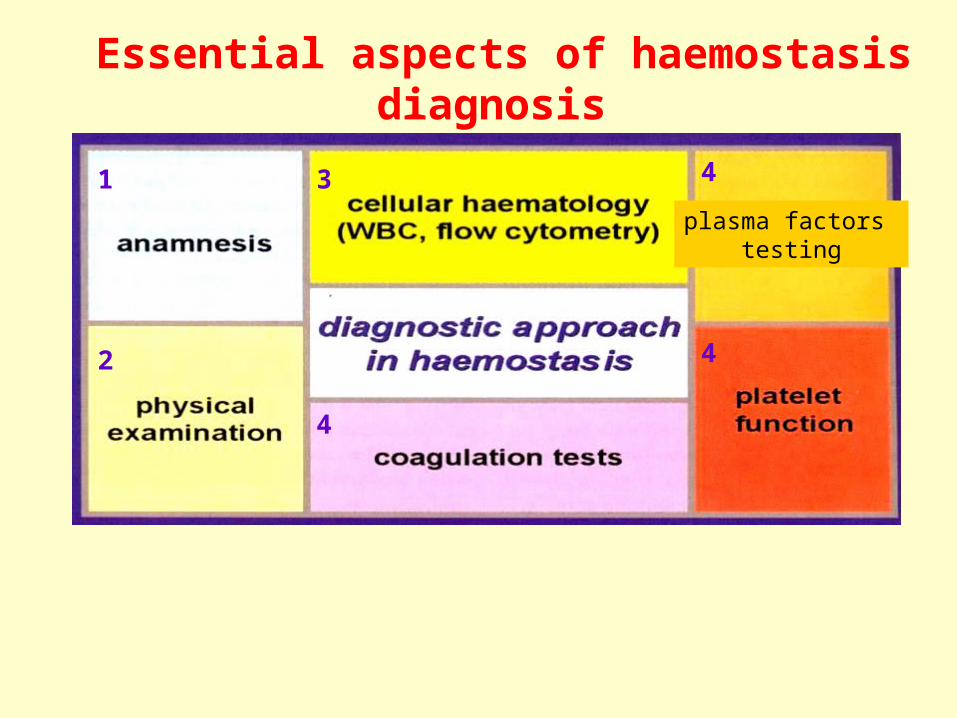
Essential aspects of haemostasis diagnosis
1
2
3
4
4
4
plasma factors testing

THROMBUS
Vessel wall Blood cells
Plasma factors
Coagulation Platelets and vessel wall –
microcirculation, small arteries Plasma factors – veins, cardiac
chambers Anticoagulation Fibrinolysis

ADP, serotonin
Adgisive proteins
Mitogenic Factors
Coagulation factors
Proteases inhibitors
β -ThromboglobulinPlatelets factor 4…CD62P (P-selectin),CD40L – exposureon membrane
Jurk K,Kehrel BE // Sem Thromb Hemost (2005) 31, 381-92

Platelet receptors

Preanalitical phase
➙ The blood sampling procedure for haemostasis test is a critical issue.
➙ Avoiding the prolonged application of a venous cuff can reduce artifacts.
➙ Blood should be taken carefully into the tube without foam formation and the tube should be gently inverted in order to completely mix the citrate and blood.
➙ Samples in whith incorrect ratio of blood to anticoagulant or samples with visible fibrin strands, must not be used for testing because the results will be inaccurate.
➙ The main screening tests need to be performed within 4 hours
Platelet Function Assays


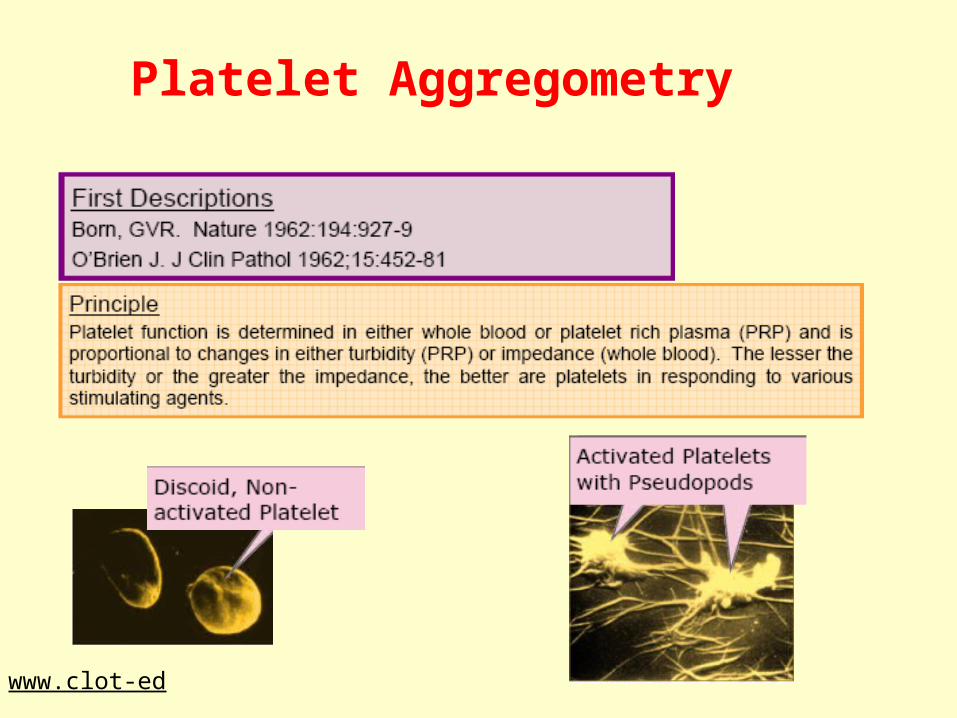
Functional assays for platelet activation1. Measuring of spontaneous and induced
aggregation of platelets in PRP and whole blood (light transmission, impedance measuring)
2. Laser light dispersion for aggregate size measuring in PRP
3. Flow cytometry (microparticles, platelet/leucocytes aggregates, platelet receptors …)
4. …
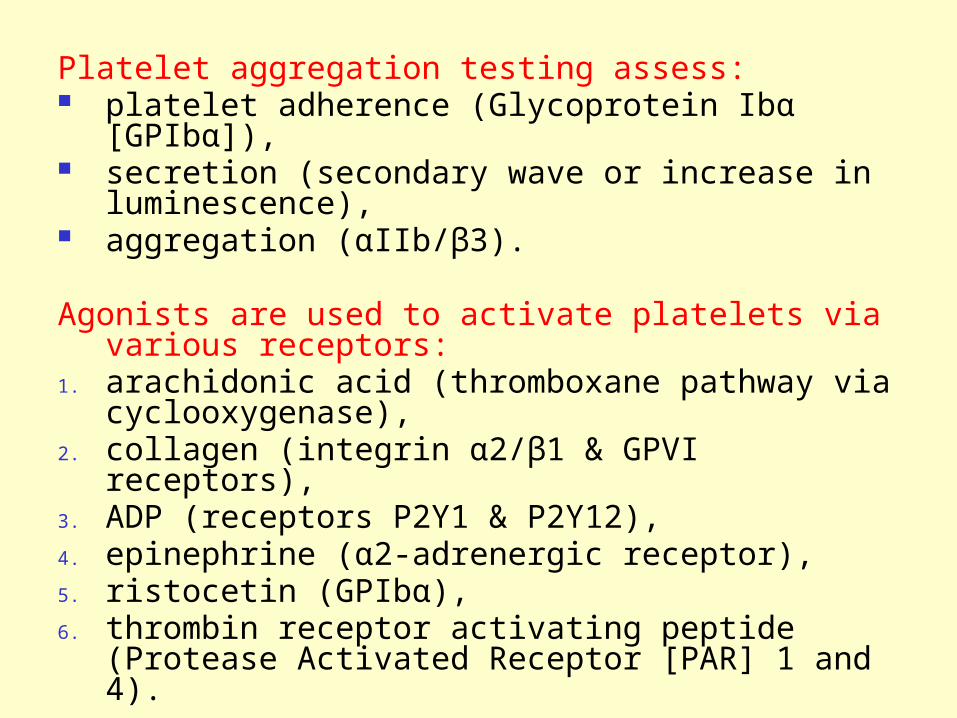
Platelet aggregation testing assess: platelet adherence (Glycoprotein Ibα [GPIbα]), secretion (secondary wave or increase in
luminescence), aggregation (αIIb/β3).
Agonists are used to activate platelets via various receptors:
1. arachidonic acid (thromboxane pathway via cyclooxygenase),
2. collagen (integrin α2/β1 & GPVI receptors),3. ADP (receptors P2Y1 & P2Y12), 4. epinephrine (α2-adrenergic receptor),5. ristocetin (GPIbα), 6. thrombin receptor activating peptide (Protease
Activated Receptor [PAR] 1 and 4).

Standard aggregometry (light transmittion)
Born GVR. Nature 1962; 194: 927-929Born GVR, Cross MJ. J Physiol 1963; 168:178-195
Manufacturers• Bio/Data, www.biodatacorp.com (PAP-4)• Chrono-Log, www.chronolog.com• Labitec, Germany www.labitec.de (APACT)• Solar (Belorussia)
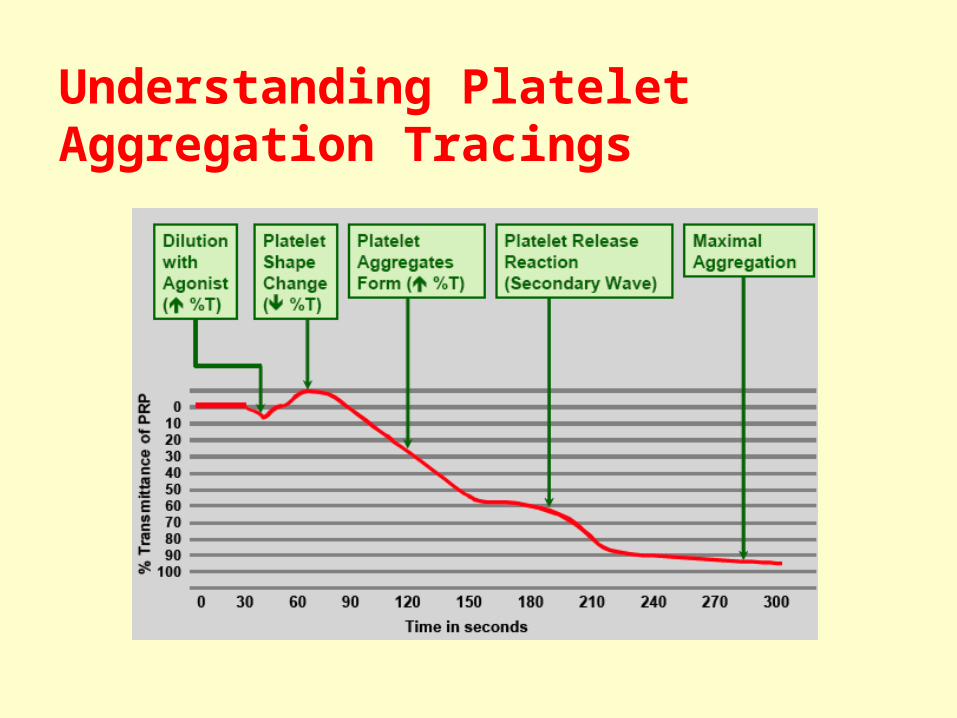
Understanding Platelet Aggregation Tracings
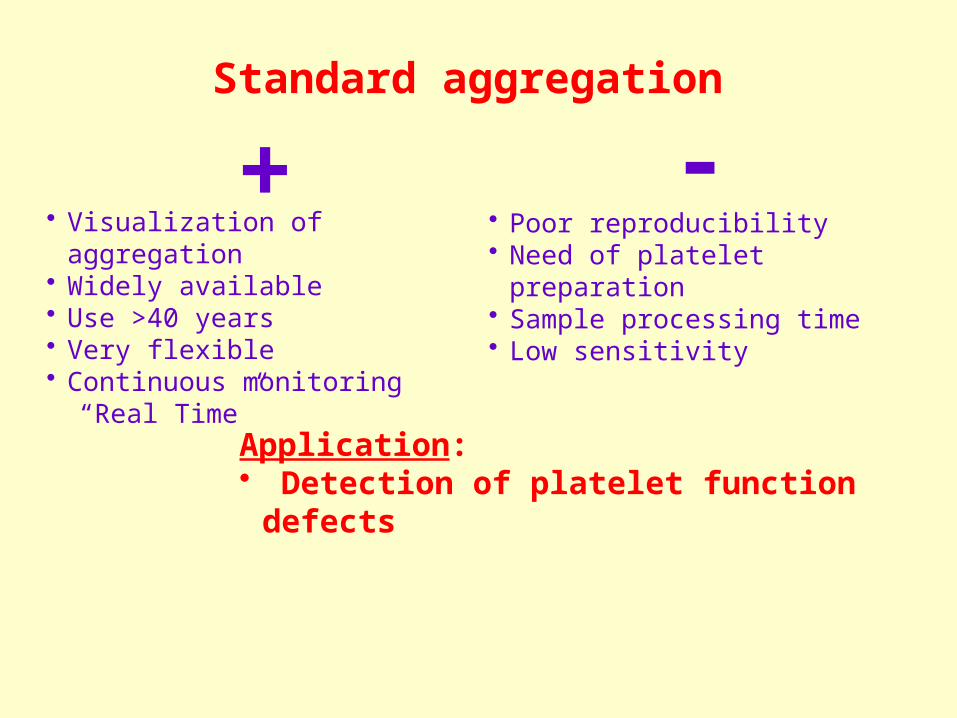
Standard aggregation
Application:• Detection of platelet function defects
• Visualization of aggregation• Widely available• Use >40 years• Very flexible• Continuous monitoring “Real Time”
• Poor reproducibility• Need of platelet preparation• Sample processing time • Low sensitivity
+ -
5.0
2.5
1.25
0.630.31
0.16
5.0
2.5
1.250.63
0.310.16
LT R
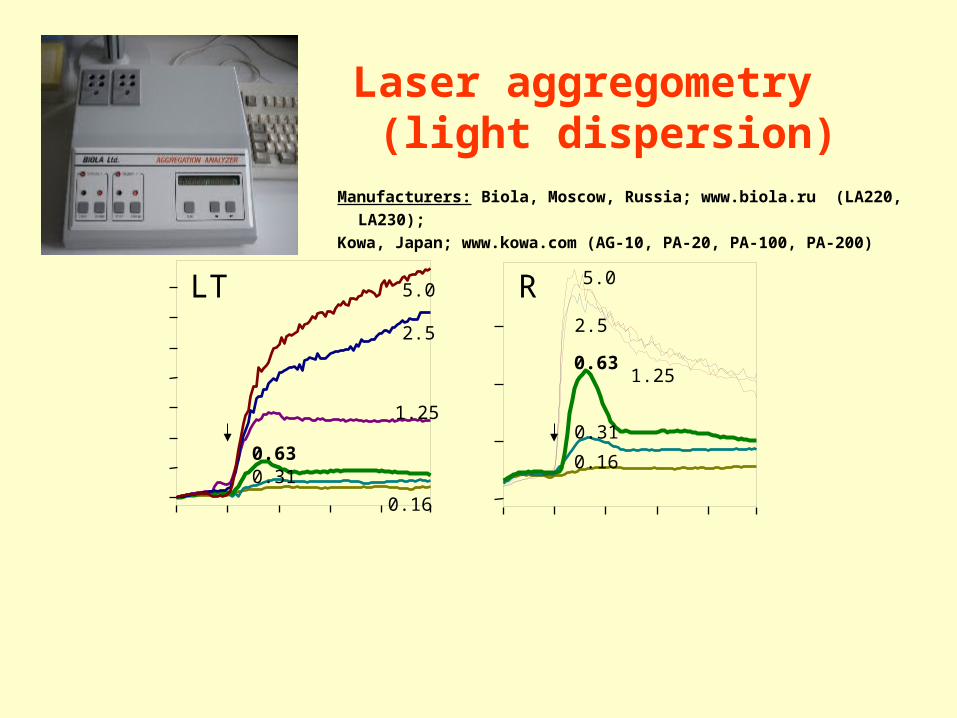
Laser aggregometry (light dispersion)
Manufacturers: Biola, Moscow, Russia; www.biola.ru (LA220, LA230); Kowa, Japan; www.kowa.com (AG-10, PA-20, PA-100, PA-200)

Miyamoto S et al. Thromb Haemost 2003; 89(4):681
Microaggregates and coronary risk factors
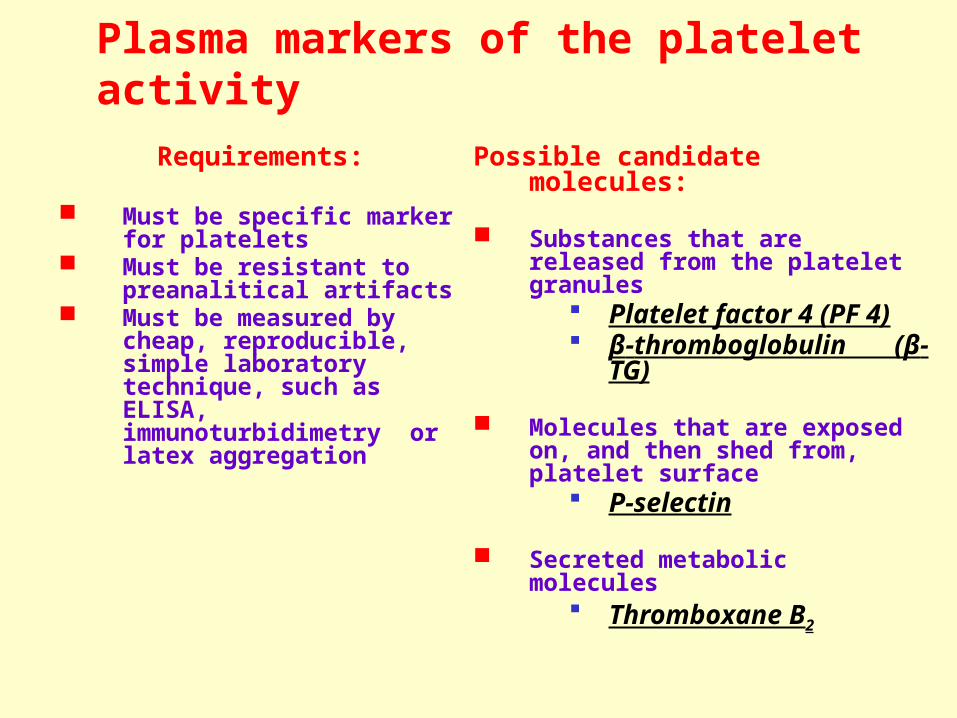
Plasma markers of the platelet activityRequirements:
Must be specific marker for platelets
Must be resistant to preanalitical artifacts
Must be measured by cheap, reproducible, simple laboratory technique, such as ELISA, immunoturbidimetry or latex aggregation
Possible candidate molecules:
Substances that are released from the platelet granules
Platelet factor 4 (PF 4) β-thromboglobulin
(β-TG)
Molecules that are exposed on, and then shed from, platelet surface
P-selectin
Secreted metabolic molecules Thromboxane B2
Laboratory tests for plasma coagulation, anticoagulation and
fibrinolisis

• Haemostasis starts with the interaction between TF and FVIIa on the surface of subendothelial cells.
• The small amount of thrombin generated during the amplification phase activates platelets locally on whose surface the subsequent reactions take place.
• The resulting thrombin burst results in the formation of a stable clot.

TF : VIIa IX
XIXa
Xa : Va
IIa (thrombin)
Activated platelet
vWF : VIII → VIIIa V → Va
X
Xа VIIIa : IXa Va : Xa
II
IIa (thrombin)
FIBRINOGEN FIBRIN
I phase
II phase
III phase
VII
XI
XIa initiation
amplificationpropagation
thrombin and fibrin generation

Laboratory coagulation tests and technological principals
1. Clotting tests2. Tests with chromogenic substrates3. Immunochemical methods4. Methods of molecular genetics

The most common coagulometers principles – clotting assays
mechanical (steel ball) turbidimetry nephelometry/light scatter
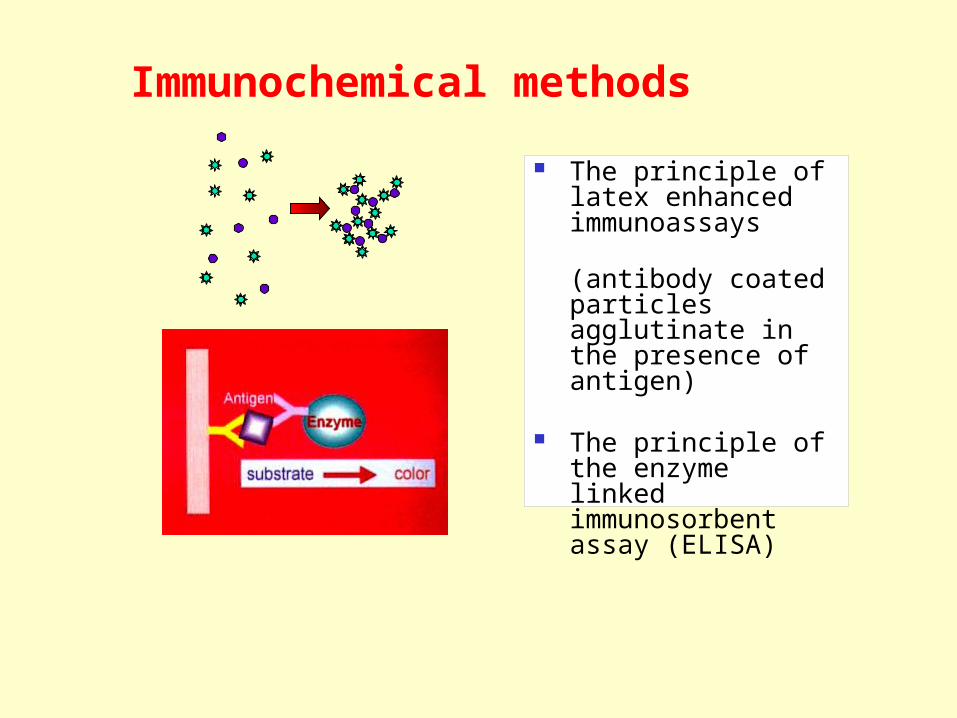
Immunochemical methods
The principle of latex enhanced immunoassays (antibody coated particles agglutinate in the presence of antigen)
The principle of the enzyme linked immunosorbent assay (ELISA)
Screening assays for either the extrinsic or intrinsic pathways are performed in order to get an overview of the enzymes, cofactors and inhibitors, involved in the respective pathway, and also of the influence of drugs or autoantibodies. The most important tests are prothrombin time and aPTT.

TF : VIIa IX
XIXa
Xa : Va
IIa (thrombin)
Activated PlateletvWF : VIII → VIIIa
V → Va
X
Xа VIIIa : IXa Va : Xa
II
IIa (thrombin)
FIBRINOGEN FIBRIN
VII
XI
XIa
aPTT
PT
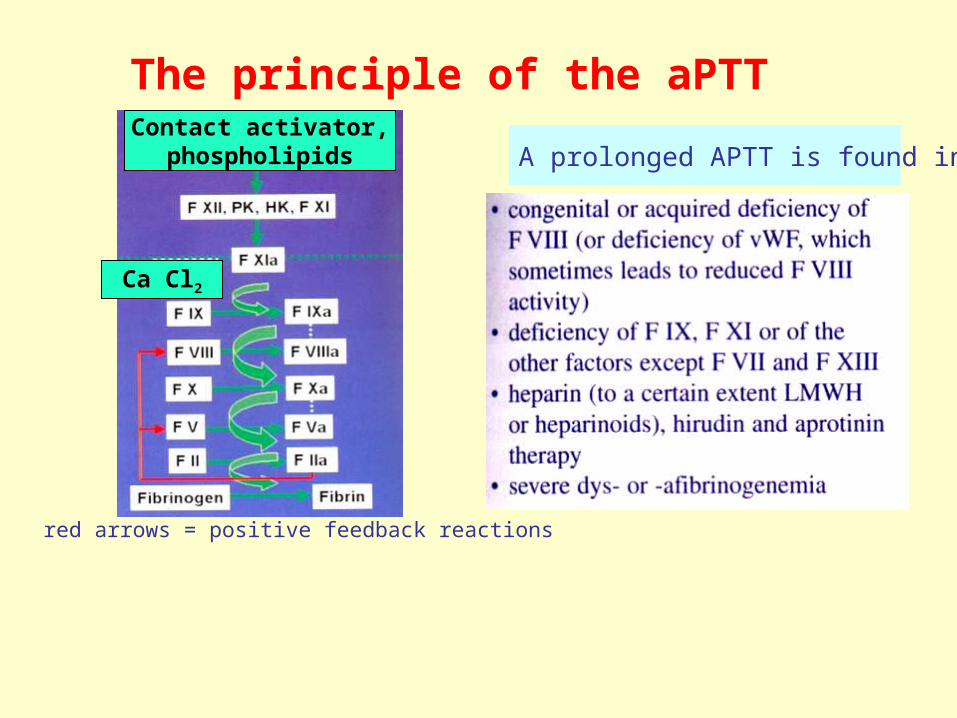
The principle of the aPTT
red arrows = positive feedback reactions
A prolonged APTT is found in:Contact activator,
phospholipids
Ca Cl2
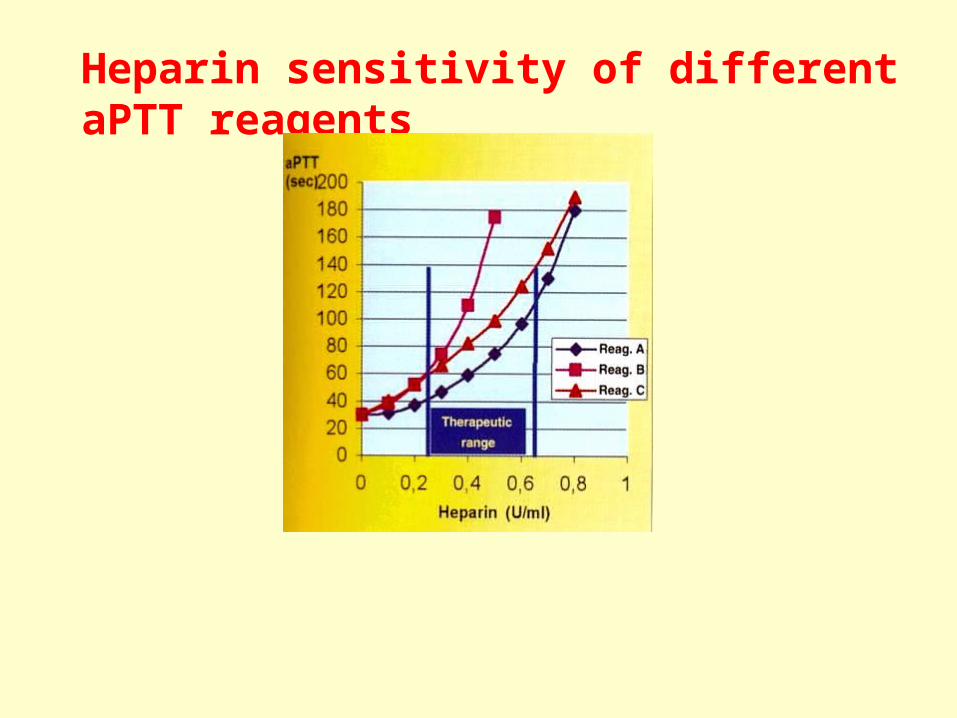
Heparin sensitivity of different aPTT reagents

Prolongation of aPTTNumber of platelets, PT and
BT are normal
1:1 mixt testaPTT
Correctionof aPTT
No correction of aPTT
Factors deficiency Presence of inhibitors
FVIII, FIXactivity
FXII, HMWK, PKactivity
Hemophilia FXII, HHMWK, PKInsuff. (clinical
negative)
Detection ofinhibitors to FVIII LА/аPL
Inhibitor-dependentHemophilia
APS (if clinical andlab. symtoms are
combined)

The prothrombin time assay
An abnormal PT is found in:
red arrows = feedback reactions
Tissue factor, Ca2+
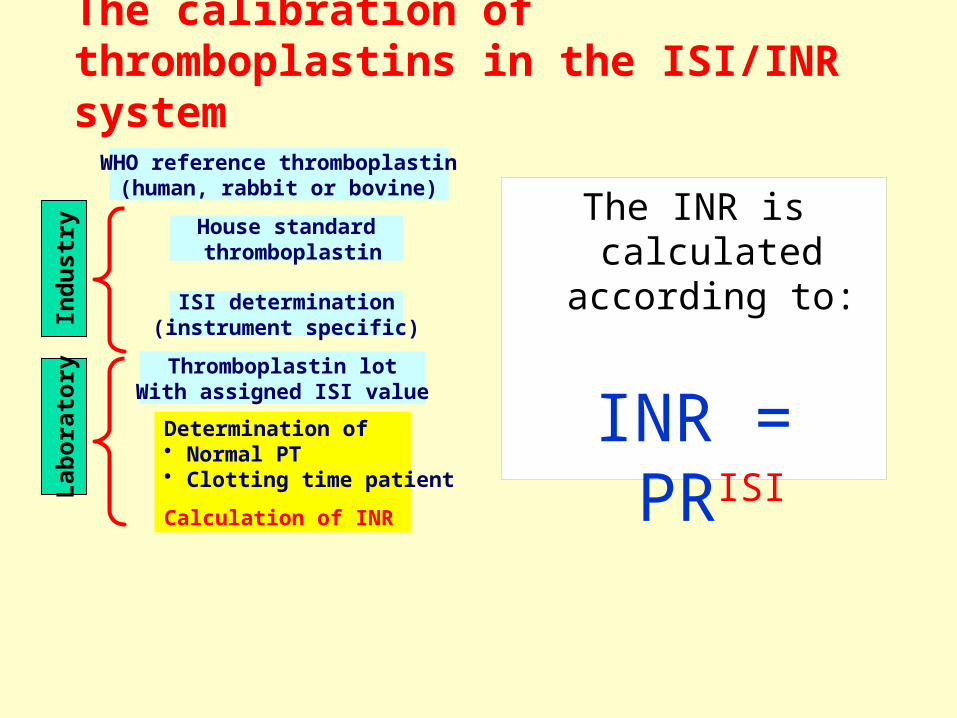
The calibration of thromboplastins in the ISI/INR system
The INR is calculated
according to:
INR = PRISI
WHO reference thromboplastin(human, rabbit or bovine)
House standard thromboplastin
ISI determination(instrument specific)
Thromboplastin lotWith assigned ISI valueDetermination of • Normal PT• Clotting time patient
Calculation of INR
Indu
stry
Labo
rato
ry

“International Normalised Ratios (INR) –the First 20 Years”(Poller L.// JTH 2004; 2: 849-60)
Benefits Decreasing of oral
anticoagulants dosage Decreasing the number of
bleeding complications Improvement anticoagulant
therapy - became more safety Possibility to computerize the
management of anticoagulation
Problems Heterogeneous of referent
materials Complexity of calibration
process ISI determination must be
instrument specific Differences in INR level
because of reagent and equipment distinction
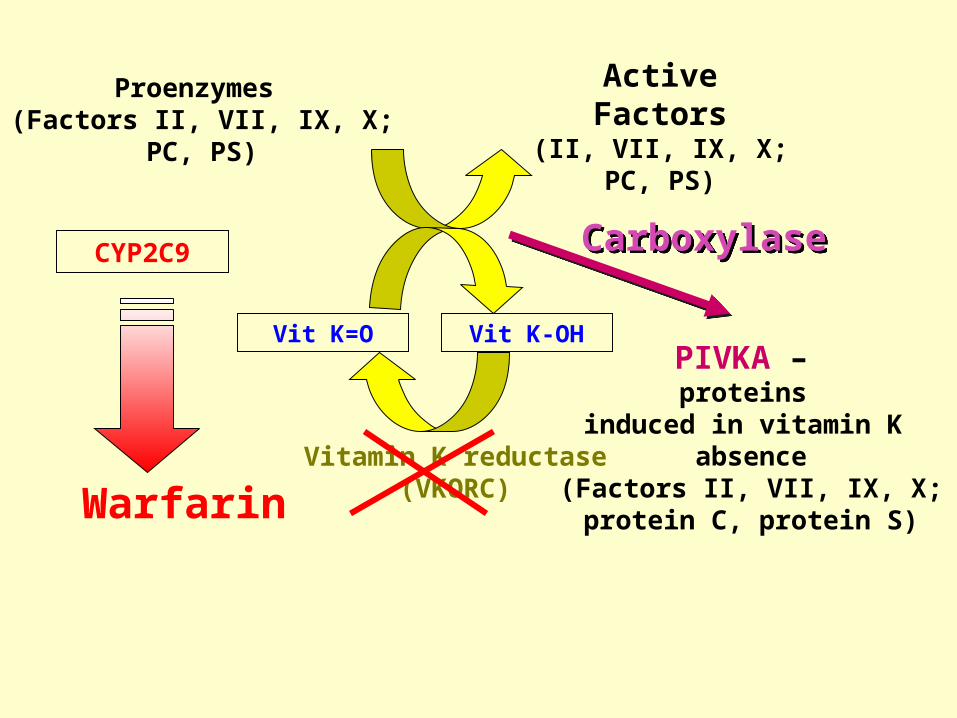
Vitamin K reductase(VKORC)
Vit K-OHVit K=O
Carboxylase
Warfarin
PIVKA – proteins
induced in vitamin K absence
(Factors II, VII, IX, X;protein С, protein S)
Proenzymes (Factors II, VII, IX, X;
PС, PS)
ActiveFactors
(II, VII, IX, X;PС, PS)
CYP2C9
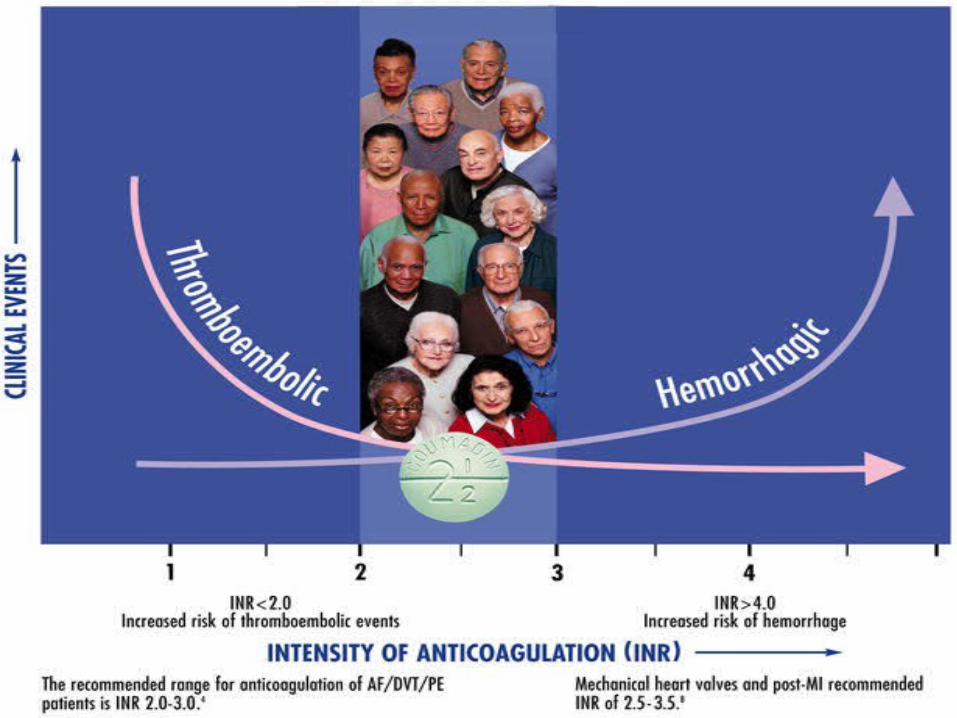

Example of a patient with high anticoagulation variability

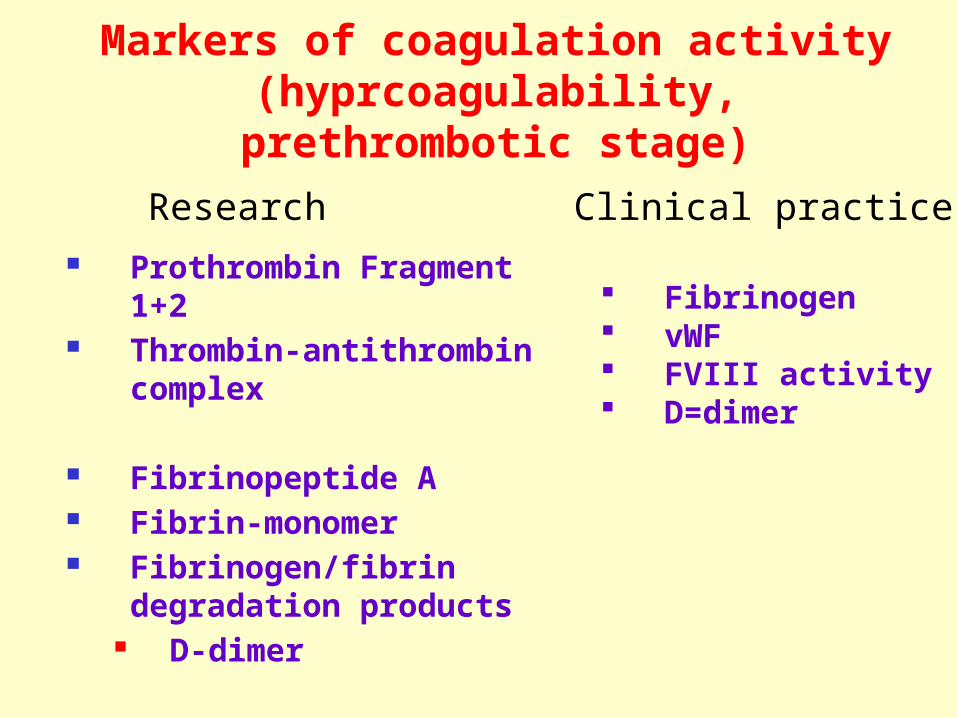
Markers of coagulation activity(hyprcoagulability, prethrombotic stage)
Prothrombin Fragment 1+2 Thrombin-antithrombin
complex
Fibrinopeptide A Fibrin-monomer Fibrinogen/fibrin
degradation products D-dimer
Research Clinical practice
Fibrinogen vWF FVIII activity D=dimer
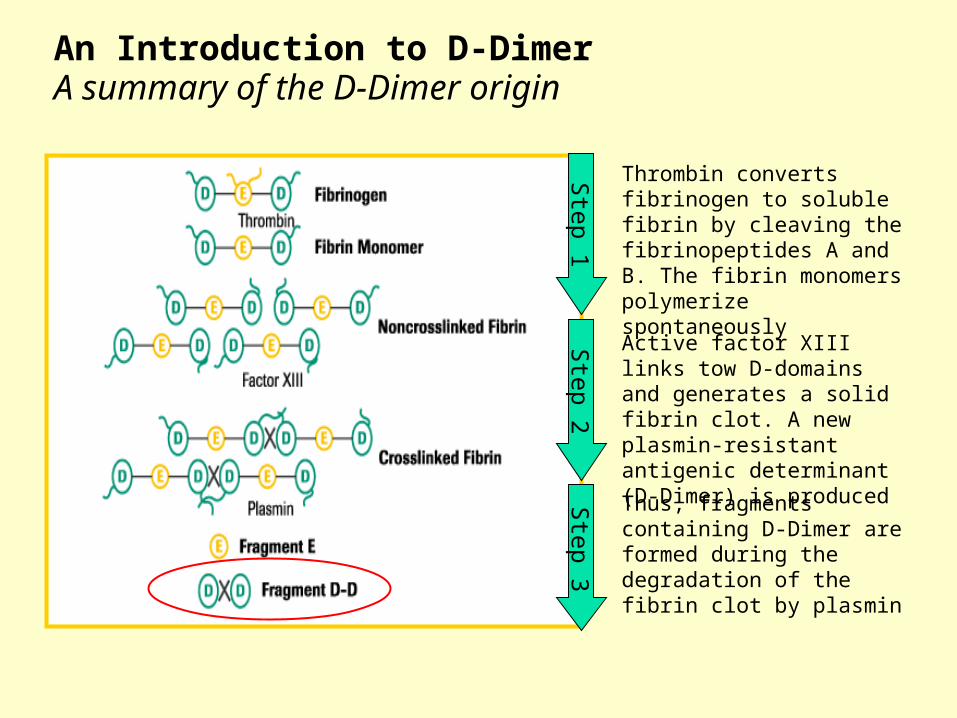
Step 1
Thrombin converts fibrinogen to soluble fibrin by cleaving the fibrinopeptides A and B. The fibrin monomers polymerize spontaneously
Step 2
Active factor XIII links tow D-domains and generates a solid fibrin clot. A new plasmin-resistant antigenic determinant (D-Dimer) is produced
Step 3
Thus, fragments containing D-Dimer are formed during the degradation of the fibrin clot by plasmin
An Introduction to D-Dimer A summary of the D-Dimer origin

47
Sen
sitiv
ity, %
(freq
uenc
y of
true
pos
itive
resu
lts)
1 – specificity, %(frequency of false positive results)
Specificity, %
1 - s
ensi
tivity
, %
Optimal division point cut-off
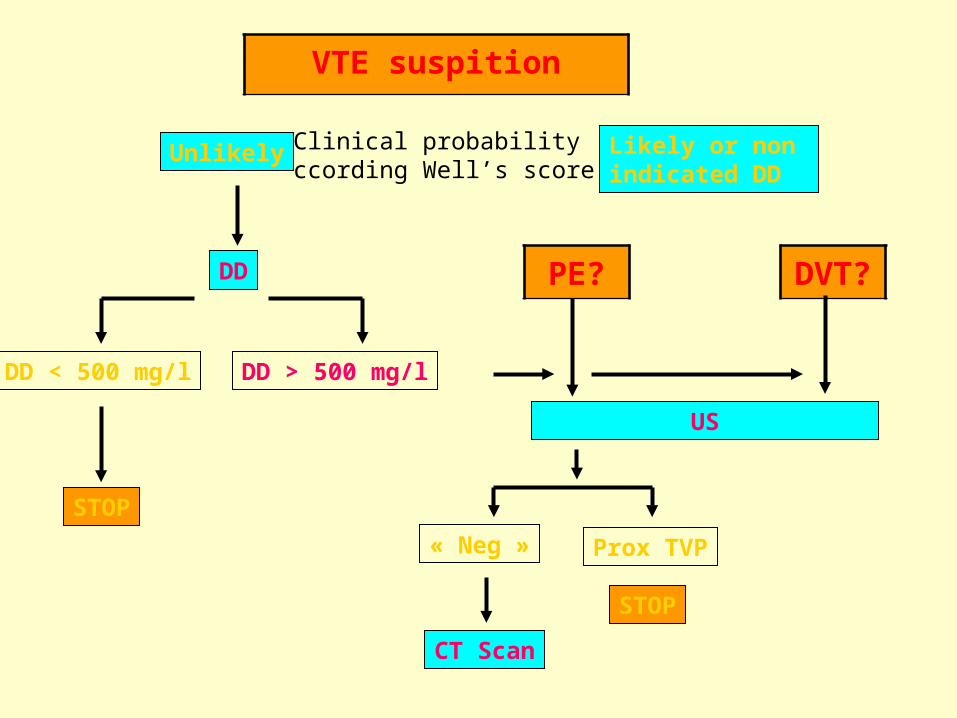
VTE suspition
Unlikely Likely or non indicated DD
DD
DD < 500 mg/l DD > 500 mg/l
STOP
CT Scan
PE? DVT?
US
STOP
« Neg » Prox TVP
Clinical probabilityccording Well’s score

1st Trim: 139 – 602 mg/l2nd Trim: 291 – 12313th Trim: 489 - 2217
Delivery, D1-3: > 500Utility first 4W PP?
DD: pregnancy?
Chabloz, 2001 – Epinay 2005

0
20
40
60
80
100
120
0 5 10 15
Time (min)
Thro
mbi
n
Lag-time
Time to peak
Area Under the Curve'ETP'
Peak Hight
Source: Lawrie A, Béguin S, Hemker H C, Henckel T, Samama M, Woodhams B, Gray E. (2005). The Thrombin Generation Test (TGT); On behalf of the International Society on Thrombosis and Haemostasis (ISTH) Scientific and Standardization Committee (SSC) Working Group on Thrombin Generation Tests. www.blood.com 2005.
Thrombin Generation Test

Calibrated Automated Thrombogram - CAT
Invented by the “father” of TGT - Prof C Hemker (Maastricht)
The “Gold Standard Method” A Fluorogenic Assay Uses PPP or PRP

Thank you for your attention!