powerpoint presentation · compete financially with other potential demands such as upgrader...
TRANSCRIPT

www.fgenergy.com
IMO 2020
EGCSA
Renaissance hotel, Heathrow
October 9th, 2018
This proposal material contains confidential and privileged information intended solely for the recipient. The dissemination, distribution, or copying by any means whatsoever
without FGE’s prior written consent is strictly prohibited.

www.fgenergy.com2
IMO 2020
Will impact everybody – nobody will be left out!

www.fgenergy.com3
Marine Bunker Fuel Demand: Timetable of IMO’s development of Guidelines/MARPOL Amendments on consistent implementation of 0.5% Sulphur limit
19974.5% Sulphur limit adopted
(MARPOL Annex VI)
2005Comes into effect
2008Sulphur limit lowered
to 3.5%, and cut to
0.5% in 2020 or 2025
(Annex VI revised)
2010Comes into effect
2016Oct – MEPC 70
IMO decides on Jan 1, 2020
as the implementation date
of 0.5% sulphur cap
2018Feb – PPR 5 (Outline developed)
April – MEPC 72
July – Intersessional PPR
Working Group Meeting
Oct – MEPC 73 – adoption of non-
compliant fuel carriage ban likely
2019Jan – Full start China 0.5% ECA
Feb – PPR 6 (Finalization of new 2020
Guidelines – MARPOL amendments)
May – MEPC 74 (approval, ISO to
provide 0.5% specification details)
2020Jan – 0.5% Sulphur cap applicable
Mar – Carriage ban likely to come
into force

www.fgenergy.com
3.5%
High-Sulphur Fuel Oil (HSFO)
0.5% Bunker Fuel Oil
Marine Gasoil (MGO)
LNGOther fuels
such as LPG
HSFO with Flue Gas Scrubbers
4
IMO 2020…Several Solutions, All Costly
Near-term quick
solutions
0.0
0.5
1.0
1.5
2.0
2.5
3.0
3.5
4.0
4.5
5.0
% S
ulf
ur
% Sulphur Cap by Region
Global Emission Control Area (ECA)

www.fgenergy.com5
Global Marine Fuel Market Overview
0.0
0.5
1.0
1.5
2.0
2.5
3.0
3.5
4.0
4.5
5.0
mm
b/d
Global Marine Fuel Consumption
Pre-2020 HSFO Gasoil
0.9
0.6
0.5
0.30.20.2
0.2
0.3
0.2
0.1
0.1
0.10.1
1.2
Top Bunker Fuel Sales Centres (mmb/d)
Singapore China USA
UAE Netherlands Russia
Hong Kong Spain & Gibraltar Belgium
South Korea Japan Panama
Brazil Rest of the World
Marine fuel demand total of 5 mmb/d total, of which 3.5 mmb/d is HSFO
Just 20% of fleet consume 80% of marine fuel
Asia is the leading demand centre (2.2 mmb/d), followed by Europe (1.1 mmb/d)
19%
78%
0%
20%
40%
60%
80%
100%
Vessels Consumption
Global Marine Fuel Consumption by Vessel Size
L/VL Medium Small

www.fgenergy.com6
Compliance Largely Self-Regulated - But Likely High
70%
75%
80%
85%
90%
95%
100%
105%
Global Sulphur Cap Compliance by Vessel Size
Small Medium Large Very large

www.fgenergy.com7
Scrubber Uptake Focused on Larger Vessels
0
500
1,000
1,500
2,000
2,500
3,000
3,500
0
5
10
15
20
25
30
35
tho
usan
d s
cru
bb
ers
Installed Scrubbers by Vessel Category
Small Medium Large Very large Annual installation - RHA
2100

www.fgenergy.com8
IMO2020: Forecast Bunker Fuel Demand Switching
0
1
2
3
4
5
6
mm
b/d
Post-2020 Scrubbed HSFO Post-2020 Non-Compliant HSFO Pre-2020 HSFO 0.5% S Fuel Gasoil LNG Bunker

www.fgenergy.com9
IMO2020: Forecast Bunker Fuel Demand Switching
0.88
2.503.00
0.44
0.16
0.12
3.471.07
1.07
1.07
1.56
2.96
1.80
1.65
0
1
2
3
4
5
6
7
2018 2020 2025 2030
mm
b/d
Post-2020 Scrubbed HSFO Post-2020 Non-Compliant HSFO Pre-2020 HSFO 0.5% S Fuel Gasoil LNG

www.fgenergy.com10
Refinery upgrading capacity available to process ‘surplus’ fuel oil
• Between mid 2018 and end 2021:
o 3.4 mmb/d of CDU capacity will come on stream
o 2.9 mmb/d of upgrading* capacity will start up
‒ This is more than enough to cope with fuel oil from incremental CDU capacity
• Some of the biggest additions are:
o Hengli, Rongsheng, Sinopec’s Guangdong, and CNOOC’s Shandong refineries in China
o KPC’s CFP project and Saudi’s Jizan refinery in the Middle East
o Turkey’s new STAR refinery
o India’s Vizag refinery
o Malaysia’s RAPID project
• At the right price:
o Any currently under-utilised capacity and …
o Any “surplus” upgrading capacity will be available to process (cheap) fuel oil
0
50
100
150
200
250
300
350
400
450
500
kb
/d
New CDU Capacity, qoq Upgrading Capacity Available, qoq
Atres from Incremental Crude Run, qoq
Primary and Secondary* Refining Capacity**
• Coking, FCC, and HDC
** Probability adjusted

www.fgenergy.com11
IMO 2020 – Related (?) WOS Refinery Projects - Reducing Fuel Oil
• There are numerous projects in the FSU focussing on upgrading fuel oil. Although none are directly the result of the IMO regulations,
fuel oil volumes will reduce and potentially HSGO, VGO, etc., could be made available for 0.5% S BFO.
Year Region Country Location Project Comment2017 Europe Finland Naantali/Porvoo SDA, Neste Commissioned in April, 2017
2017 Europe Belgium Antwerp SDA & mild hydrocracker, Total Commissioned in November, 2017
2018 Europe Belgium Antwerp Coker, XOM To be comissioned in early 2018
2018 Europe Netherlands Pernis SDA, Shell On schedule
2018 Europe Norway Slagen VDU, XOM Less fuel oil/more VGO, on schedule
2018 Europe Netherlands Rotterdam Hydrocracker, XOM On schedule
2018 Europe Poland Gdansk VDU and coker, Grupa Lotos Less fuel oil
2018 Europe Sweden Lysekil Expanding VDU capacity, Corral Less fuel oil
2H 2018 Europe Spain Castellon Expanding VDU capacity, BP Increase VGO production/lower fuel oil production
2020 Europe Serbia Panceva Coker, INA/MOL On schedule
2H 2020 Europe Croatia Rijeka Coker, Gazpromneft On schedule
2020+ Europe Spain AlgecirasCEPSA looking at building a 36 kb/d residue
hydrocracker at a cost in excess of $1billion.
Major commitment by CEPSA who will rely on financial backing
from Mubadala. FID expected 1H18.
2020+ Europe Germany Wesseling
1. Solvent de-asphalter which will produce VGO.
2. Shell are also looking at increasing the amount of
residue going to the existing hydrocracker
1. Whether the VGO is 0.5%S compliant will depend on the
feedstock quality; may well require desulphurisation. This
project is unlikely to be ready before 2020.
2. Project in the early stages of planning.
2020+ Europe Belgium Antwerp 20 kb/d Coker, Gunvor Possible project
2021 FSU Russia Norsi 38 kb/d coker, LukoilLukoil have announced they will have 7-9 kb/d of 0.5%S BFO
available, probably VGO-type material
2020 North America US/PADD3 Garyville 30 kb/d increase in coking capacity, Marathon $200 million project. IMO response; less fuel oil, more distillate
2021 North America US/PADD3 Port Arthur 40 kb/d new coker, Valero $1 billion project, yet to be confirmed
2022 North America US/PADD3 Galveston Bay 20 kb/d resid hydrocracker expansion, MarathonPart of the STAR program to upgrade and join together the
adjacent Galveston and Texas City refineries
Gunvor (coker) and
Shell (SDA) have
cancelled their plans
XOM (Antwerp, coker)
and Shell (Pernis SDA)
commissioned
C
C
C
RR
R
www.fgenergy.com12
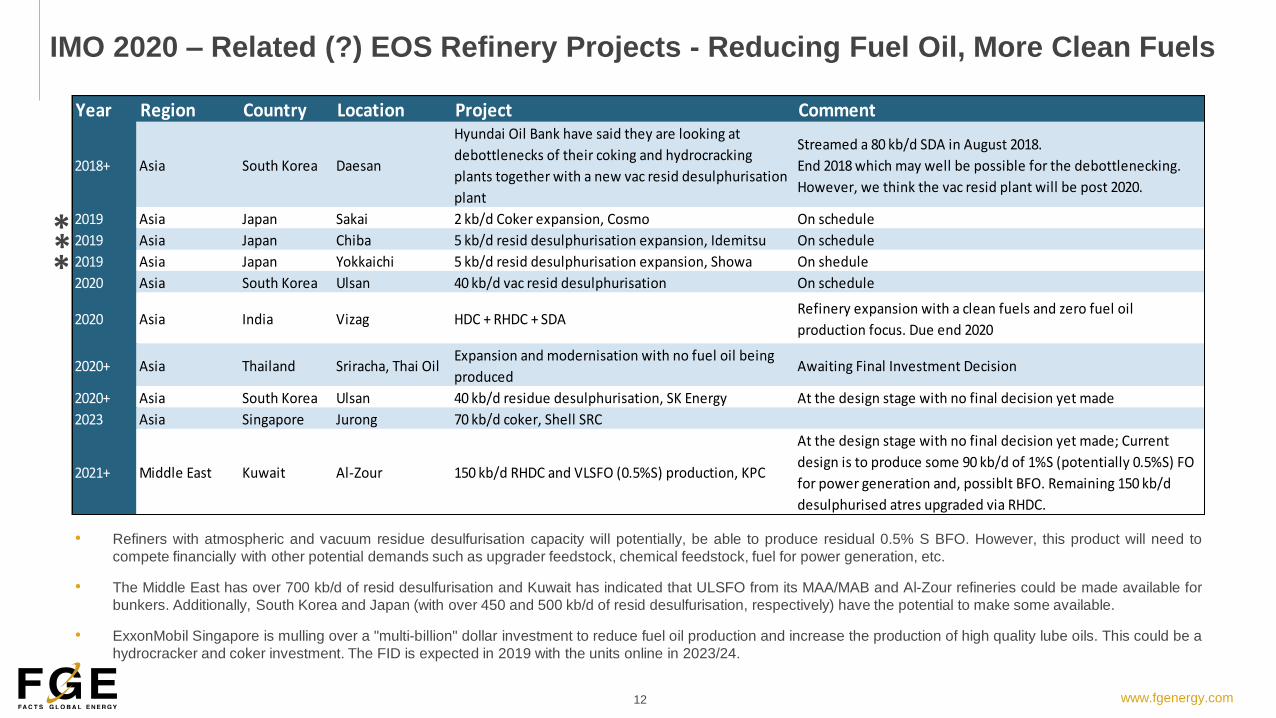
IMO 2020 – Related (?) EOS Refinery Projects - Reducing Fuel Oil, More Clean Fuels
• Refiners with atmospheric and vacuum residue desulfurisation capacity will potentially, be able to produce residual 0.5% S BFO. However, this product will need to
compete financially with other potential demands such as upgrader feedstock, chemical feedstock, fuel for power generation, etc.
• The Middle East has over 700 kb/d of resid desulfurisation and Kuwait has indicated that ULSFO from its MAA/MAB and Al-Zour refineries could be made available for
bunkers. Additionally, South Korea and Japan (with over 450 and 500 kb/d of resid desulfurisation, respectively) have the potential to make some available.
• ExxonMobil Singapore is mulling over a "multi-billion" dollar investment to reduce fuel oil production and increase the production of high quality lube oils. This could be a
hydrocracker and coker investment. The FID is expected in 2019 with the units online in 2023/24.
Year Region Country Location Project Comment
2018+ Asia South Korea Daesan
Hyundai Oil Bank have said they are looking at
debottlenecks of their coking and hydrocracking
plants together with a new vac resid desulphurisation
plant
Streamed a 80 kb/d SDA in August 2018.
End 2018 which may well be possible for the debottlenecking.
However, we think the vac resid plant will be post 2020.
2019 Asia Japan Sakai 2 kb/d Coker expansion, Cosmo On schedule
2019 Asia Japan Chiba 5 kb/d resid desulphurisation expansion, Idemitsu On schedule
2019 Asia Japan Yokkaichi 5 kb/d resid desulphurisation expansion, Showa On shedule
2020 Asia South Korea Ulsan 40 kb/d vac resid desulphurisation On schedule
2020 Asia India Vizag HDC + RHDC + SDARefinery expansion with a clean fuels and zero fuel oil
production focus. Due end 2020
2020+ Asia Thailand Sriracha, Thai OilExpansion and modernisation with no fuel oil being
producedAwaiting Final Investment Decision
2020+ Asia South Korea Ulsan 40 kb/d residue desulphurisation, SK Energy At the design stage with no final decision yet made
2023 Asia Singapore Jurong 70 kb/d coker, Shell SRC
2021+ Middle East Kuwait Al-Zour 150 kb/d RHDC and VLSFO (0.5%S) production, KPC
At the design stage with no final decision yet made; Current
design is to produce some 90 kb/d of 1%S (potentially 0.5%S) FO
for power generation and, possiblt BFO. Remaining 150 kb/d
desulphurised atres upgraded via RHDC.
***

www.fgenergy.com13
Managing the IMO fuel oil surplus… it looks like a 2 year problem!
HSFO price needs to drop enough to incentivise refiners to maximise upgrading, shippers to install scrubbers and generate new demand from the power generation sector
• HSFO stocks remain low near term and cracks strong due to the tight/supply demand balance as the crude slate lightens (US LTO, less Venezuelan, less Iranian crude) and upgrading plant commissions
• However, in 2H19 HSFO prices fall quickly as Jan 2020 approaches
• Shippers start the transition to 0.5%BFO during 2H19, especially during 4Q
o Stocks of 0.5%S build while HSFO stocks fall as the market transitions
o HSFO bunker demand falls, HSFO prices fall fast to incentivise refiners to process (much) more fuel oil (than normal)
• But it is not enough and the price has to fall further to incentivise new demand to open up ie fuel for power generation
• Prices remain low in order to push product into power gen and refining
• But in the early quarters HSFO has to be put into stock as there is insufficient demand. Both currently under-utilised upgrading capacity and any new capacity is fully utilised.
• As new upgrading capacity comes on line the need to push HSFO into power gen diminishes and disappears altogether by 3Q21.
• As we move through 2021 and 2022, upgrading capacity continues to grow, as do the number of scrubbers in use. Consequently, HSFO demand increases and the surplus that has to be dealt with falls. The push into upgrading remains but falls to less than 1 mmb/d by end-2022.
• HSFO cracks rise slowly as the pressure on refiners ease. However, FO stocks remain high and these will need to be worked-off at a later stage.
Managing HSFO around IMO 2020HSFO Inventory Draw / Build & HSFO Crack
-500
0
500
1,000
1,500
2,000
2,500
3,000
3,500
4,000
4,500
kb
/d
HSFO Bunker Demand (compliant & non-compliant) HSFO push to Upgraders
HSFO push to Powergen HSFO (from)/to inventory
-40
-30
-20
-10
0
10
20
30
40
50
-40
-30
-20
-10
0
10
20
30
40
50
60
$/b
bl
mm
b
Quarterly Accumulative SG HSFO crack (RHS)

www.fgenergy.com14
Product Cracks Forecast
IMO2020 causes a huge shock in the products markets; markets settle down after 2-3 years
0
10
20
30
40
50
60
-30
-20
-10
0
10
20
30$/bbl$/bbl Singapore Product Cracks
Fuel oil crack Distillate crack Gasoline crack Distillate/HSFO diff (rhs)
• 2H18/1H19 HFO supply/demand is tight as refineries commission upgrading
projects and as the crude slate gets lighter:
o Less Iranian and Venezuelan crude, more US LTO.
o But with a backdrop of IMO2020.
• 2H19 sees fuel oil price weakening, as refining and shipping get ready for
January 2020.
• Surge in distillate demand for compliant fuel, fuel oil demand collapses:
o Distillate cracks strengthen, fuel oil cracks plummet.
o Gasoline gets drawn into the mix.
• HFO released from the bunker pool needs to find a home in refineries and the
powergen sector
o Significant amount of upgrading capacity due on line 2018/22.
o Russia, China, Middle East most likely to burn incremental fuel oil.
• Bunker fuel oil demand returns as scrubbers are installed; both on new builds
and retrofits.
• Upgrading demand for fuel oil increases and is sustained as crude slate gets
lighter, petchems and transport fuel demand remains robust.
~$200/t
~$450/t
0
100
200
300
400
500
600
700
800
900
1000
$/t Singapore Product Prices
Distillate HSFO 0.5%BFO 0.5%BFO (85/15 GO/HSFO)

www.fgenergy.com15
Crude Diffs Forecast
• Heavy and sour crudes suffer from low price of fuel oil.
• Without sophisticated upgrading, can’t make 0.5%S BFO from such crudes.
• Conversely, lighter and sweeter crudes can more easily make the new fuel and also have higher yields of gasoline and distillate:
• Wide variation in sweet crudes!
• Ideally crude sulphur should be less than 0.3%.
• So, we have a “double whammy”!
• We see the diff widening to $6/bbl but it could easily be higher.
• The diff narrows as fuel oil demand returns and any surplus is soaked up.
0
1
2
3
4
5
6
7
$/bbl Brent/Dubai diff

www.fgenergy.com16
VLCC – IRR and Payback Period for the Various Options?
0
2
4
6
8
10
12
14
16
18
Scrubber LNG LPG
US$
/mill
ion
CAPEX for the Alternative Fuels, VLCC
0%
20%
40%
60%
80%
100%
120%
140%
0
1
2
3
4
5
6
Scrubber LNG LPG
Year
s
Return on Investment, VLCC
Payback period (compared to MGO)
Payback period (compared to BFO)
10-year IRR (compared to MGO) (RHS)
10-year IRR (compared to BFO) (RHS)

www.fgenergy.com17
Aframax – IRR and Payback Period for the Various Options?
0
2
4
6
8
10
12
Scrubber LNG LPG
US$
/mill
ion
CAPEX for the Alternative Fuels, Aframax
0%
20%
40%
60%
80%
100%
120%
0
1
2
3
4
5
6
7
8
9
Scrubber LNG LPG
Year
s
Return on Investment, Aframax
Payback period (compared to MGO)Payback period (compared to BFO)10-year IRR (compared to MGO) (RHS)10-year IRR (compared to BFO) (RHS)

www.fgenergy.com18
Container Vessel (19,000 TEU) - IRR and Payback Period for the Various Options?
0
5
10
15
20
25
30
Scrubber LNG LPG
US$
/mill
ion
CAPEX for the Alternative Fuels, Container Vessel
-20%
0%
20%
40%
60%
80%
100%
0
2
4
6
8
10
12
14
Scrubber LNG LPG
Year
s
Return on Investment, Container Vessel
Payback period (compared to MGO)Payback period (compared to BFO)10-year IRR (compared to MGO) (RHS)10-year IRR (compared to BFO) (RHS)

www.fgenergy.com19
Bulk Carrier (Cape Size) – IRR and Payback Period for the Various Options?
0
2
4
6
8
10
12
Scrubber LNG LPG
US$
/mill
ion
CAPEX for the Alternative Fuels, Bulk Carrier
0%
10%
20%
30%
40%
50%
60%
70%
80%
90%
0
1
2
3
4
5
6
7
8
9
10
Scrubber LNG LPG
Year
s
Return on Investment, Bulk Carrier (Cape Size)
Payback period (compared to MGO)Payback period (compared to BFO)10-year IRR (compared to MGO) (RHS)10-year IRR (compared to BFO) (RHS)
www.fgenergy.com20
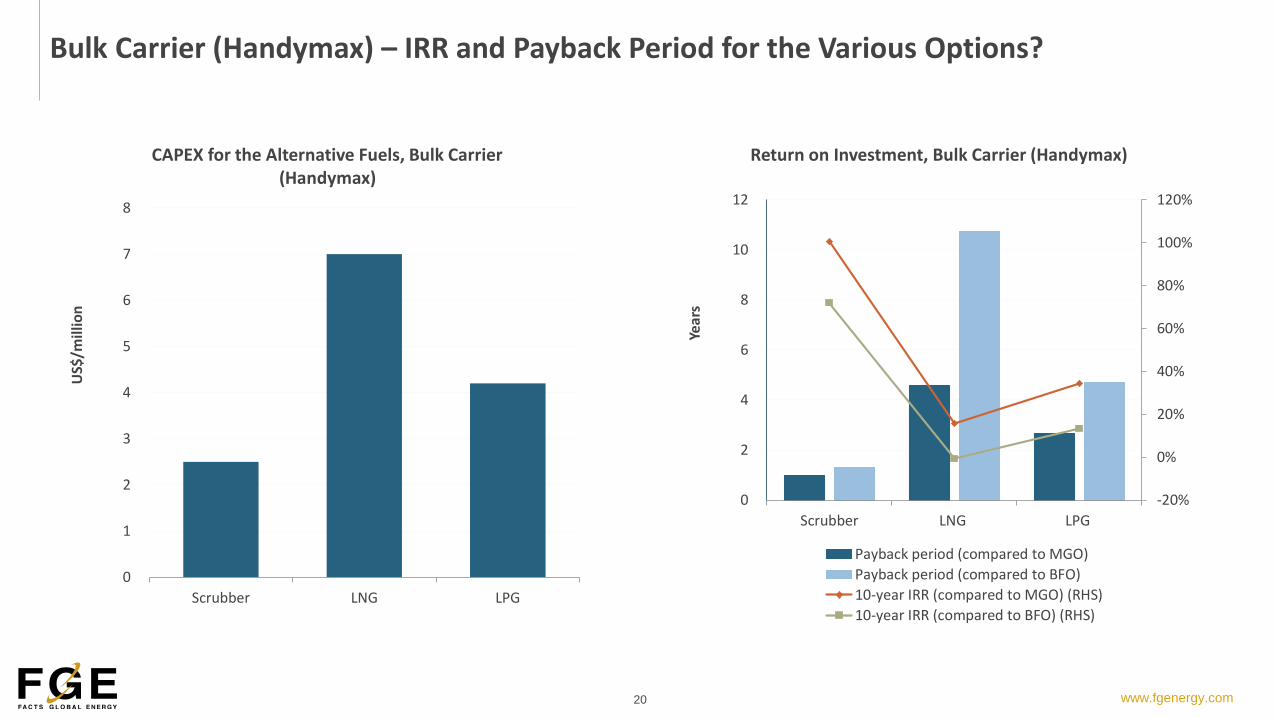
Bulk Carrier (Handymax) – IRR and Payback Period for the Various Options?
0
1
2
3
4
5
6
7
8
Scrubber LNG LPG
US$
/mill
ion
CAPEX for the Alternative Fuels, Bulk Carrier (Handymax)
-20%
0%
20%
40%
60%
80%
100%
120%
0
2
4
6
8
10
12
Scrubber LNG LPG
Year
s
Return on Investment, Bulk Carrier (Handymax)
Payback period (compared to MGO)
Payback period (compared to BFO)
10-year IRR (compared to MGO) (RHS)
10-year IRR (compared to BFO) (RHS)

Research & Analysis| Consultancy Services | Data Analytics | Commercial Advisory Services | Multi-Client Studies
www.fgenergy.com | [email protected]
Thank You
Global Headquarters
FGE London:FGE House
133 Aldersgate Street
London, EC1A 4JA
United Kingdom
Tel: +44 (0) 20 7726 9570
Asian Headquarters
FGE Singapore:8 Eu Tong Sen Street
#20-89/90 The Central
Singapore 059818
Tel: +65 6222 0045
Fax: +65 6222 0309
Global Offices
Tokyo: +81 (3) 6256 0299
Dubai: +971 (4) 457 4270
Honolulu: +1 (808) 944 3637
Los Angeles: +1 (714) 593 0603
Beijing: +86 (10) 5106 8410
Houston: +1 (281) 819 1983