power systems development facility - … library/research/coal/energy systems... · 1 transport...
TRANSCRIPT

THE NATIONAL CARBON CAPTURE CENTER AT THE POWER SYSTEMS DEVELOPMENT FACILITY
TOPICAL REPORT
BUDGET PERIOD ONE OCTOBER 1, 2008 – NOVEMBER 30, 2009
DOE Cooperative Agreement
DE‐NT0000749
Prepared by: Southern Company Services, Inc.
Power Systems Development Facility P.O. Box 1069
Wilsonville, AL 35186 Phone: 205‐670‐5840 Fax: 205‐670‐5843
http://www.NationalCarbonCaptureCenter.com

DISCLAIMER
This report was prepared as an account of work sponsored by an agency of the United States Government. Neither the United States Government nor any agency thereof, nor any of their employees, nor Southern Company Services, Inc., nor any of its employees, nor any of its subcontractors, nor any of its sponsors or cofunders, makes any warranty, expressed or implied, or assumes any legal liability or responsibility for the accuracy, completeness, or usefulness of any information, apparatus, product, or process disclosed, or represents that its use would not infringe privately owned rights. Reference herein to any specific commercial product, process, or service by trade name, trademark, manufacturer or otherwise, does not necessarily constitute or imply its endorsement, recommendation, or favoring by the United States Government or any agency thereof. The views and opinions of authors expressed herein do not necessarily state or reflect those of the United States Government or any agency thereof. This report is available to the public from the National Technical Information Service, U.S. Department of Commerce, 5285 Port Royal Road, Springfield, VA 22161. Phone orders are accepted at (703) 487-4650.

ABSTRACT The Power Systems Development Facility (PSDF) is a state-of-the-art test center sponsored by the U.S. Department of Energy and dedicated to the advancement of clean coal technology. In addition to the development of advanced coal gasification processes, the PSDF features the National Carbon Capture Center (NCCC) to study CO2 capture from coal-derived syngas and flue gas.
The newly established NCCC will include multiple, adaptable test skids that will allow technology development of CO2 capture concepts using coal-derived syngas and flue gas in industrial settings. Because of the ability to operate under a wide range of flow rates and process conditions, research at the NCCC can effectively evaluate technologies at various levels of maturity.
During the Budget Period One reporting period, efforts at the PSDF/NCCC focused on developing a screening process for testing consideration of new technologies; designing and constructing pre- and post-combustion CO2 capture facilities; developing sampling and analytical methods; expanding fuel flexibility of the Transport Gasification process; and operating the gasification process for technology research and for syngas generation to test syngas conditioning technologies.

ACKNOWLEDGEMENT
The authors wish to acknowledge the contributions and support provided by various project managers, including Morgan “Mike” Mosser of the Department of Energy and John Wheeldon of the Electric Power Research Institute. The project is sponsored by the U.S. Department of Energy National Energy Technology Laboratory under cooperative agreement DE-NT0000749.
NATIONAL CARBON CAPTURE CENTER TOPICAL REPORT POWER SYSTEMS DEVELOPMENT FACILITY BUDGET PERIOD ONE
i
TABLE OF CONTENTS
Section........................................................................................................................................ Page
Inside Cover Disclaimer Abstract Acknowledgement
List of Figures ................................................................................................................................ iii List of Tables ................................................................................................................................. iv Glossary of Abbreviations and Engineering Units ..........................................................................v
1.0 Executive Summary .............................................................................................................1
2.0 Technology Assessment .......................................................................................................3 2.1 Technology Screening .............................................................................................3 2.2 Economic and Engineering Studies .........................................................................4
3.0 Pre-Combustion CO2 Capture ..............................................................................................7 3.1 Syngas Conditioning Unit ........................................................................................8 3.1.1 SCU Modifications .....................................................................................9
3.1.2 CO2 Capture Testing ...................................................................................9 3.1.3 Water-Gas Shift Testing ...........................................................................12 3.2 Pre-Combustion Slipstream Unit .............................................................................13 3.2.1 DBR Design and Construction..................................................................14 3.2.2 DBR Commissioning ................................................................................16
4.0 Post-Combustion CO2 Capture ..........................................................................................17 4.1 PC4 Design and Construction ..................................................................................19 4.2 Pilot Solvent Test Unit .............................................................................................19 4.2.1 PSTU Design Basis ...................................................................................19 4.2.2 PSTU Process Description ........................................................................21 4.2.3 PSTU Control Scheme ..............................................................................23 4.3 Solvent Evaluation Procedure ..................................................................................24
5.0 Fuel Flexibility ...................................................................................................................25 5.1 PDAC Feeder ...........................................................................................................25 5.2 Biomass Evaluation .................................................................................................26

NATIONAL CARBON CAPTURE CENTER TOPICAL REPORT POWER SYSTEMS DEVELOPMENT FACILITY BUDGET PERIOD ONE
ii
Section........................................................................................................................................ Page
6.0 Cost Reduction Activities ..................................................................................................29 6.1 Sensor Development ................................................................................................29 6.2 Gasifier Performance Optimization .........................................................................30 6.3 Hot Gas Filter Element Evaluation ..........................................................................32
7.0 Support of Outside Research .............................................................................................35 7.1 NETL Fuel Cell........................................................................................................35 7.2 Media and Process Technology Hydrogen Membrane ............................................38 7.3 Johnson Matthey Mercury Sorbent ..........................................................................38
8.0 Conclusions and Lessons Learned .....................................................................................40

NATIONAL CARBON CAPTURE CENTER TOPICAL REPORT POWER SYSTEMS DEVELOPMENT FACILITY BUDGET PERIOD ONE
iii
LIST OF FIGURES Figure ......................................................................................................................................... Page
1 Transport Oxy-Combustion Process Flow Diagram ............................................................6
2 Flow Diagram of the Syngas Conditioning Unit .................................................................8
3 Batch Reactor from Parr Instrument Company ...................................................................9
4 Trend of CO2 in Syngas Exiting the Batch Reactor ...........................................................10
5 Trend of CO2 Capture Efficiency with NH3/CO2 Molar Ratio ..........................................11
6 Regeneration of Solvent Starting at Ambient Pressure ......................................................11
7 Co-Capture of H2S and COS with CO2 .............................................................................12
8 Syngas Shift Conversion versus H2O-to-CO Molar Ratio .................................................13
9 Schematic of Pre-Combustion Slipstream Unit .................................................................14
10 DBR Installed in Gasification Process Structure ...............................................................15
11 Construction of DBR Support Equipment .........................................................................15
12 Pressure Drops versus Riser Gas Superficial Velocity during DBR Commissioning .......16
13 Selected Location of the PC4 at the E.C. Gaston Plant .....................................................17
14 Flow Diagram of PC4 ........................................................................................................18
15 Fabrication of PSTU Columns ...........................................................................................19
16 Process Flow Diagram of the PSTU ..................................................................................20
17 Gasifier Temperature Deviation before and after PDAC Modifications ...........................26
18 Feed Rate as a Function of Feeder Speed with Coal and with Biomass ............................27
19 SEM Photographs of Baked PRB and Biomass Ash Particles ..........................................28
20 EDX Spectra of PRB Ash and Biomass Ash .....................................................................29
21 SEM Photograph of Ash from Mississippi Lignite and Biomass Mixture after Baking ...29
22 Level Probe Used in the PDAC Feeder .............................................................................30
23 Carbon Conversion versus Gasifier Temperature during Lignite Operation .....................31
24 Gasifier Circulation Rate as a Function of Standpipe Level during Lignite Operation .....31
25 PCD Filter Elements Tested during BP1 ...........................................................................32
26 Pressure Drop versus Gasification Exposure Hours for Pall PSS FEAL and Dynalloy Elements ........................................................................................................34
27 Pressure Drop versus Face Velocity for Porvair IC Elements ...........................................35
28 Sectional View of Fuel Cell Button Mounted in Support Tube.........................................36
29 NETL’s Multi-Cell Array ..................................................................................................36

NATIONAL CARBON CAPTURE CENTER TOPICAL REPORT POWER SYSTEMS DEVELOPMENT FACILITY BUDGET PERIOD ONE
iv
LIST OF TABLES Table .......................................................................................................................................... Page
1 Major Milestones for Budget Period One ............................................................................2
2 Quantitative Technology Screening Criteria .......................................................................4
3 TROCTM Study Design Basis...............................................................................................6
4 Results of Comparison of TRIGTM and TROCTM Processes ...............................................7
5 DBR Operating Parameters ................................................................................................14
6 PSTU Column Process Requirements ...............................................................................21
7 Solvent Selection Criteria ..................................................................................................24
8 Collection Efficiencies of PCD Filter Elements at Ambient Conditions ...........................33
9 Maximum Accumulated Exposure Hours of the Filter Elements Tested in BP1 ..............33
10 Mercury Sorbent Test Conditions ......................................................................................39
11 Trace Metals Concentrations during Mercury Sorbent Testing .........................................39

NATIONAL CARBON CAPTURE CENTER TOPICAL REPORT POWER SYSTEMS DEVELOPMENT FACILITY BUDGET PERIOD ONE
v
GLOSSARY OF ABBREVIATIONS AND ENGINEERING UNITS
Abbreviations ASU—Air Separation Unit MEA—Monoethanolamine BOP—Balance of Plant MMD—Mass Median Diameter BP1—Budget Period One MPT—Media & Process Technology CFB—Circulating Fluidized Bed NCCC—National Carbon Capture Center CMS—Carbon Molecular Sieve NETL—National Energy Technology Laboratory CO—Carbon Monoxide OCV—Open Circuit Voltage CO2—Carbon Dioxide PC—Pulverized Coal COS—Carbonyl Sulfide PC4—Post-Combustion Carbon Capture Center DBR—Dispersed Bubble Reactor PCD—Particulate Control Device DCS—Distributed Control System PCSU—Pre-Combustion Slipstream Unit DOE—Department of Energy PDAC—Pressure Decoupled Advanced Coal EDX—Energy Dispersive X-Ray PLC—Programmable Logic Controller EPRI—Electric Power Research Institute PRB—Powder River Basin FEAL—Iron Aluminide PSDF—Power Systems Development Facility FGD—Flue Gas Desulfurization PSTU—Pilot Solvent Test Unit FTIR—Fourier Transform Infrared R01 through R04—Test Runs 1 through 4 GC—Gas Chromatography SCS—Southern Company Services H2S—Hydrogen Sulfide SCU—Syngas Conditioning Unit IC—Inert Coating SEM—Scanning Electron Microscope ICP-MS—Inductively Coupled Plasma-Mass SOFC—Solid Oxide Fuel Cell Spectrometer TC—Test Campaign IGCC—Integrated Gasification Combined Cycle TRIG—Transport Integrated Gasification MCA—Multi Cell Array TROC—Transport Oxy-Combustion MCC—Motor Control Center TSP—Technology Screening Process MDEA—Methyldiethanolamine WGS—Water-Gas Shift Engineering Units Btu—British thermal units mm—millimeters cm2—square centimeters mol%—mole percent oF—degrees Fahrenheit MW—megawatts ft/s—feet per second ppb—parts per billion g/Nm3—grams per normal cubic meter ppbv—parts per billion by volume hr— hours ppbw—parts per billion by weight inH2O—inches of water ppmv—parts per million by volume kW—kilowatts psi—pounds per square inch L—liter psia—pounds per square inch absolute L/min—liters per minute psig—pounds per square inch gauge lb—pounds rpm—revolution per minute lb/ft3—pounds per cubic feet s or sec—seconds lb/hr—pounds per hour scm—standard cubic meter mA/cm2—milliamps per cubic centimeters V—volt MW—megawatt vol%—volume percent MWhr—megawatt-hour wt%—weight percent mW/cm2—milliwatts per cubic centimeters

NATIONAL CARBON CAPTURE CENTER TOPICAL REPORT POWER SYSTEMS DEVELOPMENT FACILITY BUDGET PERIOD ONE
1
1.0 EXECUTIVE SUMMARY
The Power Systems Development Facility (PSDF) is a key national asset for ensuring continued, cost-effective, environmentally acceptable energy production from coal. Sponsored by the U.S. Department of Energy (DOE), the PSDF is an engineering scale test center located in Wilsonville, Alabama, that has been in operation since 1995. The PSDF staff has effectively developed advanced power systems to meet the national need for cleaner, more efficient power production from coal. Building on its previous success, PSDF now houses the National Carbon Capture Center (NCCC) to address the nation’s need for cost-effective, commercially viable CO2 capture options for flue gas from pulverized coal power plants and syngas from coal gasification power plants.
PSDF Achievements. Not only did the PSDF staff achieve the goal of developing several types of first-of-a-kind technologies (i.e., the Transport Gasifier, continuous ash depressurization systems, a pressure decoupled advanced coal feeder, a piloted syngas burner, etc.), it successfully integrated these components into a reliable gasification process for generating data for scale-up to commercial applications. This successful development and integration required highly focused process engineering and effective identification of ways to improve operation and performance.
After only eight years from the time of construction and commissioning, the Transport Gasification process was selected for commercial deployment through the DOE Clean Coal Power Initiative. Commercialization efforts continue to progress with the construction of a Transport Integrated Gasification (TRIGTM) power plant in Kemper County, Mississippi, which will be operated by Mississippi Power Company. The Kemper County facility will use local Mississippi lignite as the fuel and will capture and sequester (through enhanced oil recovery) 65 percent of the carbon dioxide produced.
In addition to developing in-house technologies, the PSDF has made available its unique test site and has collaborated with many technology vendors and researchers to aid in advancing various processes and types of equipment. For example, the first testing of a solid oxide fuel cell on coal-derived syngas and the initial testing of Research Triangle Institute’s direct sulfur recovery process took place at the PSDF. The various and sundry products developed by outside researchers and tested at the PSDF include coal feeders, hot gas filter elements and failsafes, gasifier instrumentation, coal feeder instrumentation, and syngas conditioning catalysts and sorbents.
New Challenges. The presence of coal in the national energy source mix allows for reliable, affordable electricity and is vital to national security. Currently, about half of U.S. electricity generation is based on coal. While other low-carbon generation options (i.e., nuclear, renewables, and natural gas) are being planned to meet future needs, coal use is still expected to increase both in the U.S. and globally due to a plentiful and diverse supply at relatively low cost. However, pressure to restrict CO2 emissions from the utilization of coal for power generation continues to increase.
NATIONAL CARBON CAPTURE CENTER TOPICAL REPORT POWER SYSTEMS DEVELOPMENT FACILITY BUDGET PERIOD ONE
2
Using currently available technologies, adding CO2 capture will dramatically increase the costs of coal-based electricity generation. To utilize the abundant coal reserves for clean and efficient power generation under CO2 emission constraints, advanced gasification and combustion technologies for power generation must be equipped with next-generation, cost-effective CO2 capture technology. Capturing and sequestering CO2 from coal-fueled power plants will be a central part of any strategy to reduce CO2 emissions.
Current Focus. The NCCC is leading the way to lower cost CO2 capture technologies and to enable coal-based power generation to remain a key contributor to providing affordable, reliable, and clean power generation. The facilities accommodate a range of equipment sizes and provide commercially representative test conditions that allow results to be scaled confidently to commercial application, a crucial element in shortening development times.
The NCCC is involved in a broad array of technology development activities. Pre-combustion carbon capture processes are integrated into the existing gasification process. The Post-Combustion Carbon Capture Center (PC4), located at a major power plant adjacent to the gasification facility, will be a site for testing technologies at a wide-range of sizes and process conditions on coal-derived flue gas. Further, researchers are investigating the Transport Reactor technology for use in an oxy-combustion process that is ideally suited for CO2 capture. Finally, the NCCC is investigating ways to lower electricity costs by optimizing all equipment in the power system in addition to the CO2 capture block. This includes development of syngas conditioning processes, specialized instrumentation and materials, and gasifier fuel flexibility.
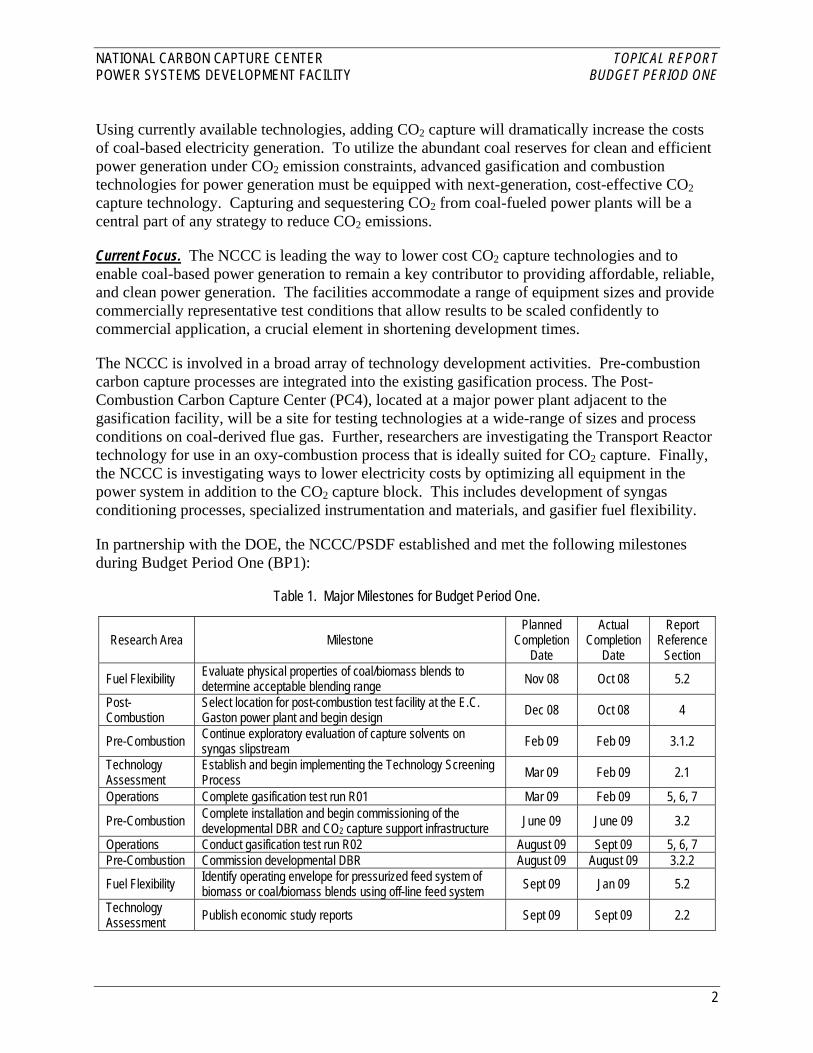
In partnership with the DOE, the NCCC/PSDF established and met the following milestones during Budget Period One (BP1):
Table 1. Major Milestones for Budget Period One.
Research Area Milestone Planned
Completion Date
Actual Completion
Date
Report Reference
Section
Fuel Flexibility Evaluate physical properties of coal/biomass blends to determine acceptable blending range Nov 08 Oct 08 5.2
Post-Combustion
Select location for post-combustion test facility at the E.C. Gaston power plant and begin design Dec 08 Oct 08 4
Pre-Combustion Continue exploratory evaluation of capture solvents on syngas slipstream Feb 09 Feb 09 3.1.2
Technology Assessment
Establish and begin implementing the Technology Screening Process Mar 09 Feb 09 2.1
Operations Complete gasification test run R01 Mar 09 Feb 09 5, 6, 7
Pre-Combustion Complete installation and begin commissioning of the developmental DBR and CO2 capture support infrastructure June 09 June 09 3.2
Operations Conduct gasification test run R02 August 09 Sept 09 5, 6, 7 Pre-Combustion Commission developmental DBR August 09 August 09 3.2.2
Fuel Flexibility Identify operating envelope for pressurized feed system of biomass or coal/biomass blends using off-line feed system Sept 09 Jan 09 5.2
Technology Assessment Publish economic study reports Sept 09 Sept 09 2.2

NATIONAL CARBON CAPTURE CENTER TOPICAL REPORT POWER SYSTEMS DEVELOPMENT FACILITY BUDGET PERIOD ONE
3
Project Partners. The DOE provides 80 percent of the funding of the NCCC, with the remainder of funding provided by industrial participants. The project is managed by Southern Company Services, and other project participants currently include the Electric Power Research Institute and world-class leaders in the power and coal industries, including Luminant, Peabody Energy, NRG Energy, American Electric Power, Arch Coal, and Rio Tinto.
2.0 TECHNOLOGY ASSESSMENT
Effective technology assessment begins with a screening process to ensure that the technologies to be tested and developed have strong potential for commercial deployment. This is accompanied by economic analysis of integrated plant configurations to assess the overall process economic feasibility. After the technology is tested, data analysis and public reporting provide industry with key information for improving technology development strategies.
2.1 Technology Screening
As CO2 capture technologies emerge from initial proof-of-principle and lab-scale trials, further evaluation and testing at a larger scale under the real-world environment is necessary before commercial deployment. The NCCC can provide slipstreams of syngas from oxygen- or air-blown gasification as well as slipstreams of flue gas from a pulverized coal power plant for testing post-combustion processes. These slipstreams can be specially designed to meet the needs of testing different technologies under various conditions and process requirements.
Many technologies are being investigated for future commercial deployment in a carbon-constrained world. They are at different stages of technical maturity with various levels of potential benefits. Some are in the early stages of conceptual design while others are ready for scale-up for testing in an industrial setting. Clearly, the number of technologies from this diverse group must be reduced to a workable size in order to develop a test plan for the NCCC.
In order to avoid overlooking the potential of emerging technologies that are still early in development, the screening process was separated into two pathways: small (lab/bench scale) and large scale (pilot/engineering scale). This ensures that the final technology selections will form a balanced portfolio that promotes the advancement for both near-term and long-term candidate technologies. To effectively utilize the NCCC facility and bring the most promising technologies to the market as quickly as possible, a screening process is necessary to identify superior candidate technologies based on appropriate criteria.
Each candidate technology will be evaluated using both quantitative screening criteria shown in Table 2 and qualitative screening criteria related to shared DOE and NCCC objectives and budget considerations. The factors influencing DOE/NCCC objectives include cost reduction, fuel flexibility, short-term commercial implementation, and long-term potential. Budget considerations affecting qualitative screening criteria include project funding level, cost of testing, cost of developing, and ease of accommodation.

NATIONAL CARBON CAPTURE CENTER TOPICAL REPORT POWER SYSTEMS DEVELOPMENT FACILITY BUDGET PERIOD ONE
4
Table 2. Quantitative Technology Screening Criteria.
Ranking Category and Scoring Criteria Weighting Factor I. Projected benefits
60%
• Impact on total cost of electricity • Impact on energy consumption • Impact on capital cost • Impact on power plant efficiency • CO2 emission reduction
II. Technology strength
30%
• Scientific soundness of concept • Current status of the technology • Simplicity and robustness • Commercialization • Environmental soundness
III. Organization strength
10% • Intellectual property/license of the technology • Capability of further development • Technical and management team
An evaluation report will be sent to DOE that will guide the DOE/NCCC decision for inclusion of a particular technology in the test plan. There will be ongoing periodic updates to the list of technologies actively evaluated by the screening process based on emerging data and progress made by each technology developer throughout the year. Information sources for these updates include DOE review meetings, conferences, and direct communications with vendors and technology developers.
This screening process will help the DOE and the NCCC focus on technologies that have the greatest impact in the near term without losing sight of other more advanced technology options that may present greater benefits in the long term. Final documentation of the methodology of the screening process was completed to serve as the screening guideline. In addition, NCCC staff developed a candidate technologies inventory list as a fluid document to include all major developers/vendors of relevant technology.
2.2 Economic and Engineering Studies
Oxy-Combustion. Researchers at the NCCC conducted a screening level engineering and economic study to estimate the performance and cost for a proposed advanced power generation system using the Transport Reactor in a pressurized oxy-combustion system to produce electric power and sequestration-ready CO2. Current oxy-combustion concepts for both pulverized coal (PC) boilers and circulating fluidized bed (CFB) combustors use oxygen mixed with recycled CO2 to replace air as the oxidant for combustion of fossil fuels to generate power. In both concepts, operations are at near atmospheric pressure, and CO2 from downstream of the combustion system is used to moderate the temperature of the highly exothermic oxy-combustion process.

NATIONAL CARBON CAPTURE CENTER TOPICAL REPORT POWER SYSTEMS DEVELOPMENT FACILITY BUDGET PERIOD ONE
5
The Transport Oxy-Combustion (TROC™) process, by contrast, uses recycle solids to moderate the combustion temperature and a fluidized-bed solids cooler to maintain the recycle solids temperature. Also, it operates at pressure, which confers several benefits, and has inherently low NOx and SOx emissions without downstream controls.
Expected advantages of the TROC process compared with conventional PC boiler- or CFB-based oxy-combustion are the following:
• Reduced equipment costs since the process requires no flue gas desulfurization (FGD), less CO2 purification, a smaller combustor, and smaller equipment volume sizes due to pressurized operation
• Lower excess oxygen because of better combustion control, more thorough solids mixing, and staged O2 feed
• Reduced heat transfer area resulting from a high heat transfer coefficient in the solids cooler • Better temperature control due to a high solids circulation rate • Greatly reduced recycle CO2 since it is not used for combustion temperature control • No air infiltration that would dilute and contaminate the CO2 by-product The plant design and operation are significantly simpler than an Integrated Gasification Combined Cycle (IGCC) plant with CO2 capture because the flue gas is cooled, dried, and compressed to produce the CO2 by-product, rather than having to extract the CO2 from the gas through a wet chemical process. Also, the oxy-combustion system avoids the complexity and maintenance expenses of a combustion turbine, relying solely on steam-based power generation. As such, it may also be an excellent option for low-carbon emissions re-powering of existing steam-based power generators.
Compared with typical oxygen-blown or air-blown IGCC systems with CO2 capture, TROC is expected to have the following advantages: • Near-complete CO2 capture, rather than 65 to 95 percent CO2 capture • No chemical plant for CO2 capture • No steam consumption for water-gas shift or gasifier • No gas turbine • Simpler sulfur capture without solvent, stripper, and tail gas treatment • Higher carbon conversion on a wider range of fuels Figure 2 is a flow diagram of the TROC process. The process consists of an air separation unit (ASU), coal and limestone preparation and feed systems, the Transport Oxy-Combustor, high and low temperature flue gas cooling units, ash removal and disposal systems, a particulate removal system, CO2 drying and compression systems, and a steam cycle. It may also include either an oxygen scavenging system or a CO2 purification system if needed.

NATIONAL CARBON CAPTURE CENTER TOPICAL REPORT POWER SYSTEMS DEVELOPMENT FACILITY BUDGET PERIOD ONE
6
Figure 1. Transport Oxy-Combustion Process Flow Diagram.
Since comparable engineering and economic study results for oxy-combustion PC boilers and CFBs are not available on the same design basis, the TROC screening study results are compared with Case 9APC of the ongoing TRIG Baseline Study. The same design basis—the same ambient conditions and the same Powder River Basin (PRB) coal feed rate—are used in both the TROC and TRIG studies. Table 1 lists the design criteria.
Table 3. TROCTM Study Design Basis.
As-Received Coal Composition Carbon, wt% 50.1 Chlorine, wt% 0.01 Ash, wt% 8.2 Hydrogen, wt% 3.4 Sulfur, wt% 0.7 Water, wt% 25.8 Nitrogen, wt% 0.7 Oxygen, wt% 11.1 Coal Feed Rate, lb/hr 671,000 Coal As-Received Higher Heating Value, Btu/lb 8,560 Combustor Operating Temperature, °F 1,650 Solids Temperature at the Solids Cooler Exit, °F 1,200 Main Steam Pressure, psia 3,500 Main and Reheat Steam Temperatures, °F 1,050 Recycle CO2 Flow Rate for Fluidization and Purge, lb/hr 196,000 Recycle CO2 Flow Rate for Coal Conveying, lb/hr 242,000 O2 Content in the Flue Gas Exiting the Combustor, vol%, dry 1.0 Maximum CO Content in Flue Gas, ppmv, dry 100 Flue Gas Particulate Loading Exiting Combustor, g/Nm3 20 Calcium-to-Sulfur Molar Ratio 1.3
COAL PREPARATION
COAL
LIMESTONE
OXYGEN
AIR
FLUE GAS
AIR SEPARATION
UNIT
SORBENT PREPARATION
TRANSPORT COMBUSTOR
PARTICULATE FILTRATION
HEAT RECOVERY STEAM
GENERATOR
STEAM TURBINE FLUE GAS
COOLING AND
TREATMENT
CO2
COMPRESSION
CONDENSATE RECYCLE
ASH DISPOSAL

NATIONAL CARBON CAPTURE CENTER TOPICAL REPORT POWER SYSTEMS DEVELOPMENT FACILITY BUDGET PERIOD ONE
7
Table 4 provides a summary of the comparison results. This screening-level analysis of the TROC system shows that the technology holds considerable promise and warrants further development and study.
Table 4. Results of Comparison of TRIGTM and TROCTM Processes.
TRIG™ TROC™ Difference Carbon Capture Level of Capture 74% 100% +35%
Performance Net Power, MW 558.8 507.6 -9% Net Higher Heating Value Efficiency 33.2% 30.2% -9%
Capital Costs Total Plant Cost, million $ 2,278 1,836 -19% Total Plant Cost, $/kW 4,076 3,616 -11%
Levelized Cost of Electricity
Capital, $/MWh 95.8 83.0 -13% Operations & Maintenance, $/MWh 9.8 9.7 -1% Fuel, $/MWh 17.5 19.2 +10% Total Cost of Electricity, $/MWh 123.0 112.1 -9%
An opportunity exists to significantly improve the TROC performance by collaborating with suppliers to incorporate improved ASU cold box designs with potential reductions in the ASU load of 20 to 25 percent. This would add 35 to 40 MW to the net output, proportionally lowering the cost per kilowatt and improving the efficiency.
Because of these positive preliminary results from the screening study conducted in Budget Period 1 of the NCCC/DOE Cooperative Agreement, a more detailed engineering economic evaluation will be performed in Budget Period 2. It will refine process issues and potential resolutions, improve the accuracy of the estimates, further clarify the results, and benchmark the results against comparable options. Sensitivity studies to be considered include optimization of system pressure, gas purification approach, ASU oxygen purity, steam cycle conditions, ASU ownership arrangement (buy vs. lease), etc.
Gasification Studies. In the last budget period of the previous 5-year plan, PSDF researchers at the completed a draft report of a baseline study of power plant configurations using the TRIG technology. In Budget Period 1, work focused on updating the TRIG configurations based on lessons learned during the front-end engineering design for the Mississippi Power Kemper County IGCC Project and otherwise optimizing the plant designs to increase the net power output and to decrease the cost of electricity using sensitivity studies. The sensitivity cases include using different means of conveying coal to the gasifier and alternate methods of supplying moisture for the water-gas shift reaction prior to CO2 capture. A new case was initiated using an ammonia-based process for pre-combustion CO2 capture.
3.0 PRE-COMBUSTION CO2 CAPTURE
To advance pre-combustion CO2 capture technologies, the NCCC will investigate key processes including:
• Gas/liquid contacting systems • Solvents for CO2 capture/separation

NATIONAL CARBON CAPTURE CENTER TOPICAL REPORT POWER SYSTEMS DEVELOPMENT FACILITY BUDGET PERIOD ONE
8
• Water-gas shift processes • CO2 compression • Emerging syngas processes (sorbents and membranes) The infrastructure for pre-combustion CO2 capture testing provides for a wide range of test conditions, and includes the Syngas Conditioning Unit (the SCU, formerly referred to as the Syngas Cleanup Unit) and the Pre-Combustion Slipstream Unit (PCSU). These units, which are described in the following sections, utilize syngas produced from the Transport Gasifier for various tests and can also operate off-line with bottle gases. During BP1, the SCU was modified, and various CO2 capture and water-gas shift tests commenced. A Dispersed Bubble Reactor (DBR-Patent Pending) was designed, installed, and commissioned as part of the PCSU.
3.1 Syngas Conditioning Unit
The SCU is a flexible slipstream facility that can accommodate multiple, small-scale tests, such as water-gas shift, hydrolysis, desulfurization, and CO2 capture. The SCU, shown in Figure 2, consists of small reactor vessels, arranged to allow operation in series or in parallel, which accommodate a range of flow rates, temperatures, and pressures. The unit is also used to support outside technology developers by providing a syngas test location, and it has supported development of technologies such as gas separation membranes, fuel cells, and heavy metal removal processes.
Figure 2. Flow Diagram of the Syngas Conditioning Unit.
GasifierPV
FVPV
Syngas Cooler
Particulate Filtration
TO ATMOSPHERIC SYNGAS COMBUSTOR
1,500 LB/HR SYNGAS HEADER
SYNGAS FOR OTHER TESTING (FUEL CELLS, MEMBRANES, ETC.)
Reactor A Reactor B
FV FV
STEAM
Reactor C
TO OTHER TESTING OR TO ATMOSPHERIC SYNGAS COMBUSTOR
Syngas Cooler
FV
CO2
Batch Reactor
FV
Bottle Gases
TO PRE‐COMBUSTION SLIPSTREAM UNIT
SYNGAS CONDITIONING
UNITFV = Flow ValvePV = Pressure Valve
NATIONAL CARBON CAPTURE CENTER TOPICAL REPORT POWER SYSTEMS DEVELOPMENT FACILITY BUDGET PERIOD ONE
9
3.1.1 SCU Modifications
During BP1, the SCU was modified to allow independent operation of all the reactor vessels. The capacity of the SCU was increased from about 50 lb/hr to 1,500 lb/hr, and a superheated steam header was added to support water-gas shift testing.
3.1.2 CO2 Capture Testing
Investigation of ammonia-CO2 reactions progressed using the SCU batch reactor supplied by Parr Instrument Company. The information is to be used in determining the operating conditions for the PCSU. Test results were produced using syngas during gasification runs and CO2 and nitrogen bottle gases during gasifier down times. Additional solvents will be tested in the future.
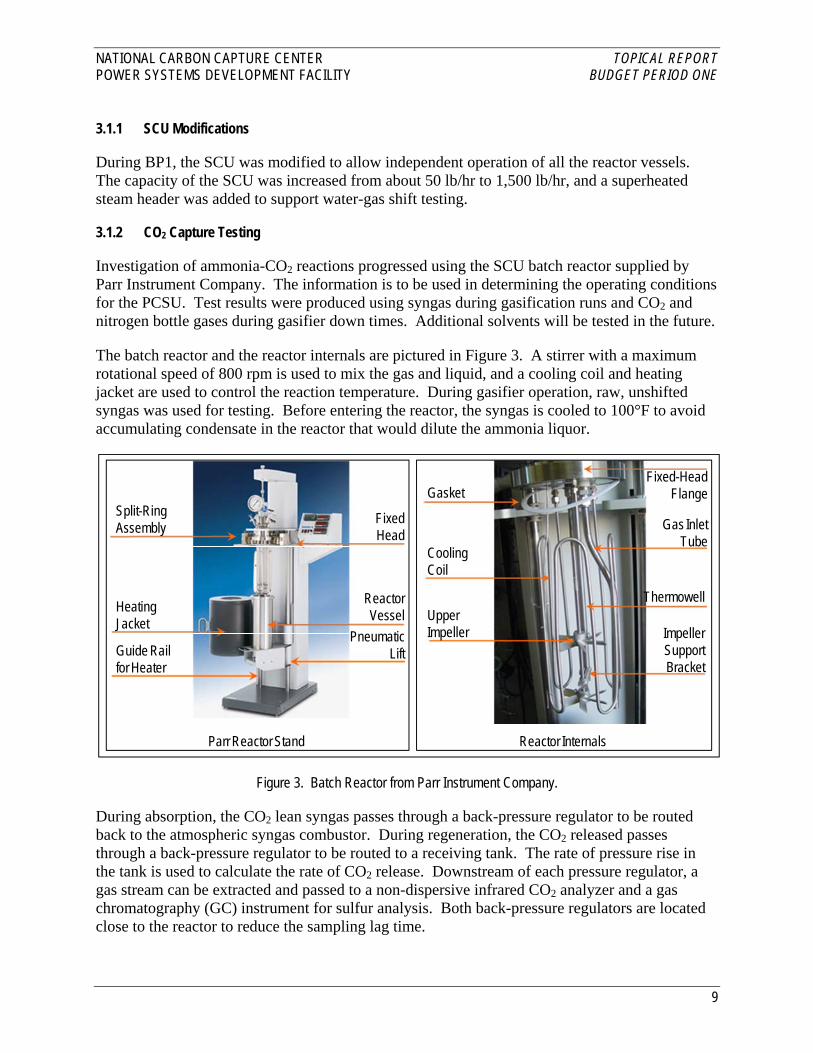
The batch reactor and the reactor internals are pictured in Figure 3. A stirrer with a maximum rotational speed of 800 rpm is used to mix the gas and liquid, and a cooling coil and heating jacket are used to control the reaction temperature. During gasifier operation, raw, unshifted syngas was used for testing. Before entering the reactor, the syngas is cooled to 100°F to avoid accumulating condensate in the reactor that would dilute the ammonia liquor.
Figure 3. Batch Reactor from Parr Instrument Company.
During absorption, the CO2 lean syngas passes through a back-pressure regulator to be routed back to the atmospheric syngas combustor. During regeneration, the CO2 released passes through a back-pressure regulator to be routed to a receiving tank. The rate of pressure rise in the tank is used to calculate the rate of CO2 release. Downstream of each pressure regulator, a gas stream can be extracted and passed to a non-dispersive infrared CO2 analyzer and a gas chromatography (GC) instrument for sulfur analysis. Both back-pressure regulators are located close to the reactor to reduce the sampling lag time.
Split-Ring Assembly
Heating Jacket
Guide Rail for Heater
Fixed Head
Reactor Vessel
Gasket
Cooling Coil
Upper Impeller
Fixed-Head Flange
Gas Inlet Tube
Thermowell
Impeller Support Bracket
Parr Reactor Stand Reactor Internals
Pneumatic Lift

NATIONAL CARBON CAPTURE CENTER TOPICAL REPORT POWER SYSTEMS DEVELOPMENT FACILITY BUDGET PERIOD ONE
10
At the start of an absorption-regeneration cycle, the reactor was charged with 14 mol% ammonia solution to a depth of 10 inches. The reactor was then assembled and pressure checked using nitrogen. To establish the required flow, normally 5 lb/hr, syngas was introduced into the apparatus bypassing the reactor with the stirrer off. The reactor pressure was set approximately 30 psi below the Transport Gasifier operating pressure, and was normally in the range of 160 to 180 psig. Once steady conditions were achieved, the stirrer was activated and the syngas flow redirected through the reactor. The CO2 content of the exit stream was analyzed continuously, and periodic samples were taken by the GC instrument to analyze the sulfur species present.
Figure 4 presents the CO2 content of the syngas stream leaving the reactor during a typical absorption test carried out at 105ºF and 180 psig. The syngas CO2 content in bypass mode was about 8.7 percent. Once the stirrer was activated and the flow redirected through the reactor, the CO2 content fell to zero, indicating that it was reacting with and being removed by the ammonia. Because the reactions are exothermic, the temperature rose slightly before being held constant by the control system. Eventually the CO2 broke through (after about 80 minutes) as the ammonia was depleted. Following completion of the test, the reactor can be opened to allow a liquid sample to be taken to determine the CO2 and sulfur loading. Following this, the reactor can be reconnected in readiness for regeneration.
Figure 4. Trend of CO2 in Syngas Exiting the Batch Reactor.
Figure 5 presents CO2 capture efficiency performance using bottle gases. The data are plotted against the molar ratio of ammonia-to-CO2. As more CO2 is captured, this ratio decreases, and at a ratio of two, the free ammonia was essentially consumed, and the ammonia was present primarily as ammonium carbamate. Further CO2 was captured by the carbamate to produce bicarbonate, but as this is a slower reaction, capture efficiency falls. Results show that the extent of the decrease can be limited by reducing reactor temperature and increasing the inlet CO2 partial pressure. Modeling activities commenced to describe the data.
0
2
4
6
8
10
20 40 60 80 100 120 140 160 180Elapsed time, minutes
CO
2 con
tent
, vol
%
Stirrer switched on

NATIONAL CARBON CAPTURE CENTER TOPICAL REPORT POWER SYSTEMS DEVELOPMENT FACILITY BUDGET PERIOD ONE
11
Figure 5. Trend of CO2 Capture Efficiency with NH3/CO2 Molar Ratio.
As part of the test program, once a CO2 capture test is completed, the final solution is regenerated to release the captured CO2. Figure 6 presents the trends of the major process parameters during a typical regeneration test. The stirrer and heater were activated and the reactor pressure increased as CO2 was released by the ammonia. Once the regeneration pressure of 535 psig was reached, the back-pressure regulator opened, and CO2 passed to the receiving tank, the pressure of which then started to increase. The pressure in the tank stabilized, indicating that no more CO2 was being released by the ammonia, and the test was terminated. The advantage of regeneration to release the CO2 at an elevated pressure is that the compression ratio of the CO2 compressor used for transportation and storage is lowered, which will result in reduced capital and operating costs for this equipment item.
Figure 6. Regeneration of Solvent Starting at Ambient Pressure.
70
80
90
100
110
1.0 1.5 2.0 2.5
R molar ratio (NH3/CO2), -
Perc
ent C
O2 C
aptu
re
Increasing CO2 inlet partial pressureDecreasing reactor temperature
0
100
200
300
400
500
600
0 10 20 30 40 50 60 70
Time , minutes
Reac
tor
Pres
sure
, ps
ia
0
40
80
120
160
200
240
Reac
tor
tem
pera
ture
, o C
or C
O2
rece
iver
pre
ssur
e, p
sia
Reactor PressureReactor TemperatureCO2 Receiver Pressure

NATIONAL CARBON CAPTURE CENTER TOPICAL REPORT POWER SYSTEMS DEVELOPMENT FACILITY BUDGET PERIOD ONE
12
Once the heater was shut down, the reactor temperature decreased and the pressure dropped. This drop occurred primarily as the CO2 in the head of the reactor was re-absorbed by the ammonia. The effect of temperature on the pressure was minimal. Following completion of the test, the reactor can be opened to allow a liquid sample to be taken to determine the CO2 and sulfur loading. Following this, the reactor can be reconnected in readiness for additional absorption testing.
In addition to capturing CO2, ammonia also captures hydrogen sulfide (H2S) and carbonyl sulfide (COS). Figure 7 shows the syngas composition leaving the batch reactor during an absorption test. At the start of the test, the CO2, H2S and COS concentrations were all zero, indicating that there was free ammonia in the solution to react with and capture these three species. After approximately 50 minutes, the COS, H2S and CO2 broke through, indicating depletion of the ammonia. Hence, co-capture of the species is possible provided that free ammonia is present.
Figure 7. Co-Capture of H2S and COS with CO2.
Liquid samples were taken to determine if all the absorbed sulfur compounds were released during regeneration at around 500 psig. The results showed that both sulfides and sulfate were present in the regenerated solution. Further testing is planned to establish the regeneration conditions needed to release all of the sulfur.
3.1.3 Water-Gas Shift Testing
During gasification testing, the syngas cleanup unit operated with a water-gas shift catalyst in catalytic filter elements and in a fixed bed reactor. For the catalytic filter element testing, the catalyst (received in pellet form) was pulverized. The fixed bed reactor testing employed the as-received pellet form. Prior to the testing, the catalyst was pre-sulfided on site.
0%
2%
4%
6%
8%
10%
12%
40 50 60 70 80 90
Time, minutes
CO
2 Exi
t con
cent
ratio
n
0
50
100
150
200
250
300
H2S
or C
OS
(x10
) (pp
m)
CO2H2SCOS

NATIONAL CARBON CAPTURE CENTER TOPICAL REPORT POWER SYSTEMS DEVELOPMENT FACILITY BUDGET PERIOD ONE
13
Part of the water-gas shift testing included varying the H2O-to-CO molar ratio. Fixed bed test results plotted in Figure 8 were taken at a reactor inlet temperature of 650oF when no steam was added (corresponding to an H2O-to-CO molar ration of ~1.3) and for steam addition at rates from 0.2 to 1.4 lb/hr. The data indicated that acceptable CO conversions could be achieved at relatively low steam feed rates, which could provide significant capital and operating cost savings compared to high steam feed rate operation.
Figure 8. Syngas Shift Conversion versus H2O-to-CO Molar Ratio.
3.2 Pre-Combustion Slipstream Unit
The Pre-Combustion Slipstream Unit was designed to test pre-combustion CO2 capture with various solvents. The test unit, shown in Figure 9, consists of an absorber, a regenerator, and associated equipment. The Dispersed Bubble Reactor (DBR) consists of the absorber and the recycle loop (including the standpipe and riser) in the PCSU. The DBR is a continuous gas-liquid contacting device where solvent contacts the incoming gas and absorbs CO2. During BP1, the DBR design was completed, and it was procured, installed, and commissioned. Efforts to design and procure other components needed to operate the DBR continuously as a CO2 capture process will continue in Budget Period 2 as funding and resources allow. As portions of the entire DBR process are installed, system pressure checks or functional checks on components will be completed as time allows.
50
55
60
65
70
75
80
1.2 1.3 1.4 1.5 1.6 1.7 1.8 1.9 2.0 2.1
Conv
ersio
n, %
H2O/CO Molar Ratio

NATIONAL CARBON CAPTURE CENTER TOPICAL REPORT POWER SYSTEMS DEVELOPMENT FACILITY BUDGET PERIOD ONE
14
Figure 9. Schematic of Pre-Combustion Slipstream Unit.
3.2.1 DBR Design and Construction
The design of the DBR incorporated these features:
• Flexibility to operate with aqueous ammonia, amines, and other solvents • Built-in capacity to modify the system, including increasing the riser diameter • High mass transfer rates with a simple absorber design The DBR operating conditions are listed in Table 5.
Table 5. DBR Operating Parameters.
Temperature, oF 100 to 135 Pressure (on-line operation), psig 250 Pressure (off-line operation), psig 500 Inlet Gas Flow Rate (on-line operation), lb/hr 250 Inlet Gas Flow Rate (off-line operation), lb/hr 500
During gasification operation, shifted syngas will be used for capture tests at the available gas pressure, up to 250 psig. During outages, the DBR will operate with bottle gases (i.e., nitrogen and CO2) at up to 500 psig absorption pressure to simulate commercially applicable conditions.
The DBR was designed mainly for operation with aqueous ammonia solution. Tests will also be conducted with methyldiethanolamine (MDEA) and dimethyl ether of polyethylene glycol
CoolerStandpipe
Riser
Polisher
Buffer Tank
Absorber
Regenerator

NATIONAL CARBON CAPTURE CENTER TOPICAL REPORT POWER SYSTEMS DEVELOPMENT FACILITY BUDGET PERIOD ONE
15
(DEPG) solvents to compare solvent performances, as a large set of commercial operational experience and data are available with these solvents. Depending upon the type of solution or solvent used, the regenerator may operate at low pressure (less than 30 psig with MDEA and DEPG) or at high pressure (500 to 600 psig with aqueous ammonia solution).
By the third quarter of BP1, the DBR fabrication was complete, and the equipment was installed in the gasification process structure (see Figure 10). Commissioning of the equipment then proceeded, as discussed in Section 3.2.2.
Figure 10. DBR Installed in Gasification Process Structure.
The DBR support equipment includes a solvent storage area, which houses fresh solvent storage tanks as well as spent solvent storage tanks. Construction of the solvent storage area, shown in Figure 11, neared completion at the close of BP1.
Figure 11. Construction of DBR Support Equipment.
RiserStandpipe Cyclone
Solvent storage area with construction of support structure and tank installation in progress
Elevated work deck and crossover walkway joining the gasification process structure to the solvent storage structure
DBR gas analyzer building
NATIONAL CARBON CAPTURE CENTER TOPICAL REPORT POWER SYSTEMS DEVELOPMENT FACILITY BUDGET PERIOD ONE
16
3.2.2 DBR Commissioning
The DBR commissioning with water and nitrogen was completed in mid-2009. The DBR operated at pressures between 150 and 450 psig, flow rates ranging from 100 to 800 lb/hr, gas velocities from 3 to 35 ft/s, and water circulation rates up to 6,500 lb/hr. Operation of the DBR during initial commissioning demonstrated that the pressure drop across the standpipe cyclone was higher than desired, which resulted in a lower than desired circulation rate. After the initial commissioning tests, the cyclone inlet insert was removed, and the inlet dimensions were enlarged. Testing of these modifications showed that they were successful in lowering the pressure drop without negatively affecting collection efficiency.
Data from the DBR commissioning tests were analyzed in relation to the pressure drop, gas hold-up, liquid circulation rates, and flow regimes. All these parameters are closely related to the mass transfer and therefore the rate of CO2 absorption. The brief commissioning tests of the DBR proved the fundamental design concept of the inherent capacity of the gas stream (in a circulating continuous phase environment) to produce a dispersed bubble flow regime leading to a large interface area for gas-liquid contact.
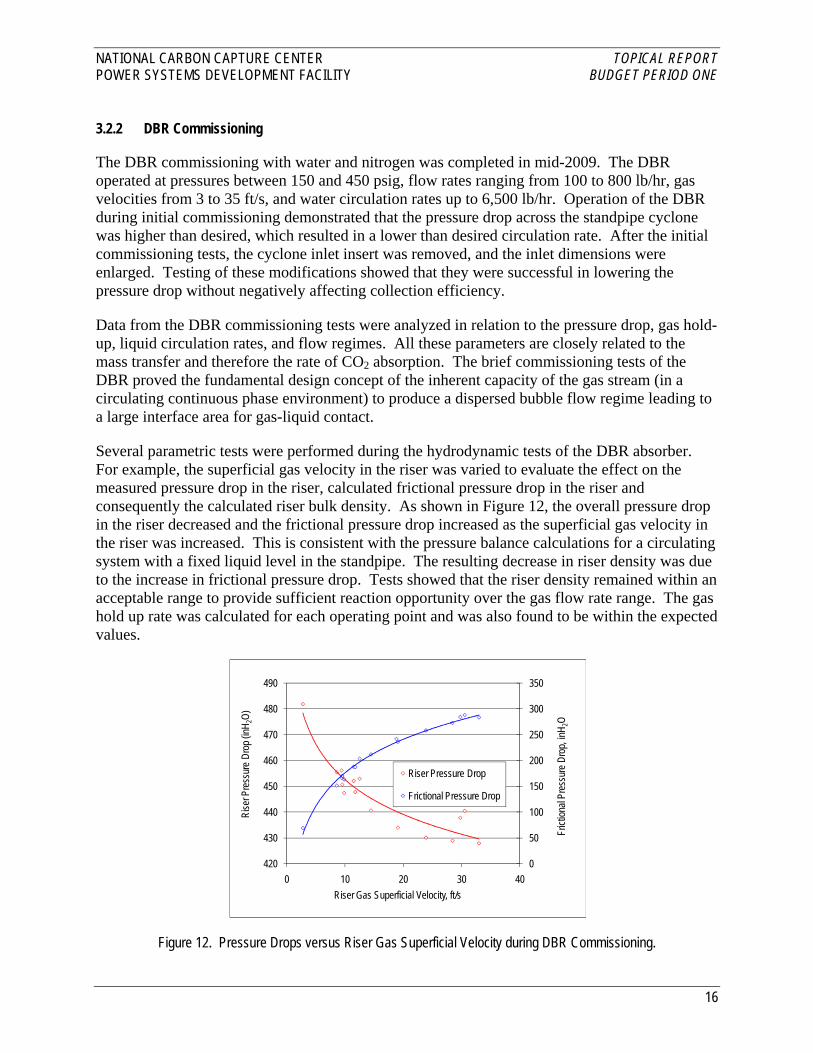
Several parametric tests were performed during the hydrodynamic tests of the DBR absorber. For example, the superficial gas velocity in the riser was varied to evaluate the effect on the measured pressure drop in the riser, calculated frictional pressure drop in the riser and consequently the calculated riser bulk density. As shown in Figure 12, the overall pressure drop in the riser decreased and the frictional pressure drop increased as the superficial gas velocity in the riser was increased. This is consistent with the pressure balance calculations for a circulating system with a fixed liquid level in the standpipe. The resulting decrease in riser density was due to the increase in frictional pressure drop. Tests showed that the riser density remained within an acceptable range to provide sufficient reaction opportunity over the gas flow rate range. The gas hold up rate was calculated for each operating point and was also found to be within the expected values.
Figure 12. Pressure Drops versus Riser Gas Superficial Velocity during DBR Commissioning.
0
50
100
150
200
250
300
350
420
430
440
450
460
470
480
490
0 10 20 30 40
Frict
ional
Pres
sure
Dro
p, inH
2O
Rise
r Pre
ssure
Dro
p (inH
2O)
Riser Gas Superficial Velocity, ft/s
Riser Pressure Drop
Frictional Pressure Drop
NATIONAL CARBON CAPTURE CENTER TOPICAL REPORT POWER SYSTEMS DEVELOPMENT FACILITY BUDGET PERIOD ONE
17
Liquid Circulation Rate. The liquid circulation rate was directly measured by a Coriolis-type mass flow meter located in the J-leg. During the initial test, the maximum liquid circulation was about half the predicted liquid circulation rate due to the higher frictional pressure drop in the riser and higher pressure drop in the standpipe cyclone. While the modifications were successful in lowering the pressure drop in the standpipe cyclone and resulted in a modest increase in circulation rate, the maximum liquid circulation rate remained below the original predicted value.
The circulation rate was lower than expected at the higher superficial gas velocities tested. At design conditions, a liquid-to-gas ratio of 20 was reached. At high gas rates, the liquid-to-gas ratio was 3.5, still sufficient for ammonia based system but lower than expected due to high frictional pressure drop in the riser. If needed, the circulation rate could be further increased by enlarging the riser diameter. Additional modifications to the cyclone also could potentially increase the circulation rate. Further testing is needed to confirm that the gas-liquid contact will achieve sufficient mass transfer. With the commissioning data, the gas-liquid transfer area was largely inferred from correlations.
4.0 POST-COMBUSTION CO2 CAPTURE
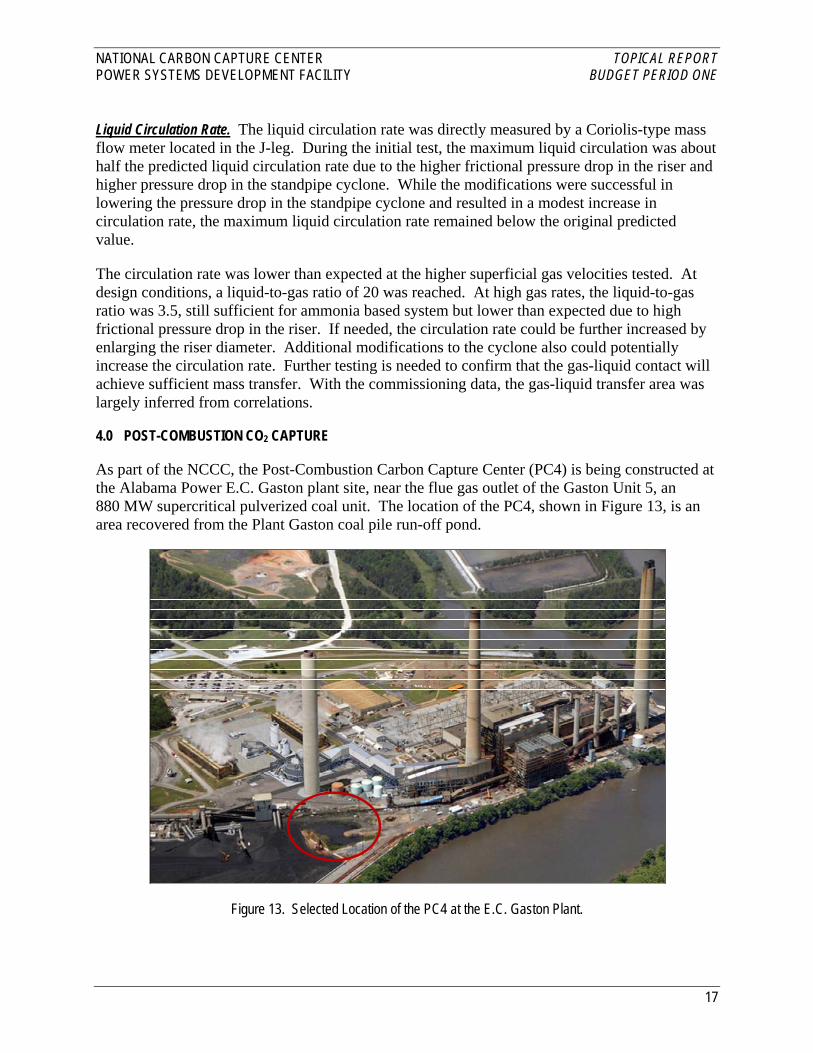
As part of the NCCC, the Post-Combustion Carbon Capture Center (PC4) is being constructed at the Alabama Power E.C. Gaston plant site, near the flue gas outlet of the Gaston Unit 5, an 880 MW supercritical pulverized coal unit. The location of the PC4, shown in Figure 13, is an area recovered from the Plant Gaston coal pile run-off pond.
Figure 13. Selected Location of the PC4 at the E.C. Gaston Plant.

NATIONAL CARBON CAPTURE CENTER TOPICAL REPORT POWER SYSTEMS DEVELOPMENT FACILITY BUDGET PERIOD ONE
18
The primary purpose of the PC4 is to support development of multiple post-combustion CO2 capture technologies. The PC4 will have the capacity to:
• Test new solvents and gas/liquid contacting systems • Regenerate solvents at high pressure • Evaluate emerging technologies such as sorbents and membranes • Reduce capital and operating costs associated with these technologies The PC4 was designed to provide several parallel paths to test candidate processes at appropriate scales. The facility will include a solvent test unit and a slipstream for multiple, small-scale tests, and it will support integration of test skids developed by outside technology developers. The most significant piece of process equipment is the Pilot Solvent Test Unit (PSTU).
The general layout of the PC4 is shown in Figure 14. The facility is located in proximity to the Gaston Unit 5 flue gas, which will be extracted from the main duct between the FGD unit and the stack. The processed flue gas and CO2 exiting the PC4 will be sent back upstream of the ID fans in the power plant.
Figure 14. Flow Diagram of PC4.
FGD
StackID Fan
Pilot Solvent Test Unit
Bench Scale Test Units
Plant Gaston
3 MWe60 tpd CO2
0.5 MWe10 tpd CO2
1 MWe20 tpd CO2
< 0.1 MWe< 2 tpd CO2
880 MWe12,000 tpd CO2
Pilot Test Unit #2
PC4
NATIONAL CARBON CAPTURE CENTER TOPICAL REPORT POWER SYSTEMS DEVELOPMENT FACILITY BUDGET PERIOD ONE
19
4.1 PC4 Design and Construction
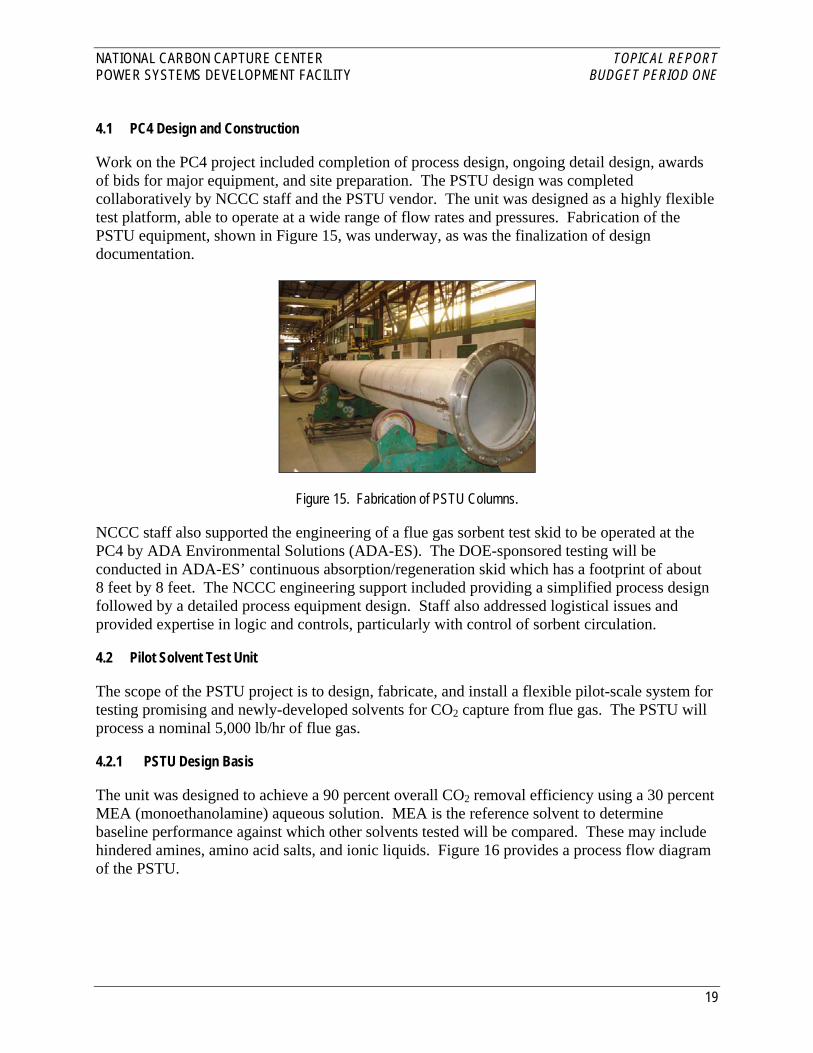
Work on the PC4 project included completion of process design, ongoing detail design, awards of bids for major equipment, and site preparation. The PSTU design was completed collaboratively by NCCC staff and the PSTU vendor. The unit was designed as a highly flexible test platform, able to operate at a wide range of flow rates and pressures. Fabrication of the PSTU equipment, shown in Figure 15, was underway, as was the finalization of design documentation.
Figure 15. Fabrication of PSTU Columns.
NCCC staff also supported the engineering of a flue gas sorbent test skid to be operated at the PC4 by ADA Environmental Solutions (ADA-ES). The DOE-sponsored testing will be conducted in ADA-ES’ continuous absorption/regeneration skid which has a footprint of about 8 feet by 8 feet. The NCCC engineering support included providing a simplified process design followed by a detailed process equipment design. Staff also addressed logistical issues and provided expertise in logic and controls, particularly with control of sorbent circulation.
4.2 Pilot Solvent Test Unit
The scope of the PSTU project is to design, fabricate, and install a flexible pilot-scale system for testing promising and newly-developed solvents for CO2 capture from flue gas. The PSTU will process a nominal 5,000 lb/hr of flue gas.
4.2.1 PSTU Design Basis
The unit was designed to achieve a 90 percent overall CO2 removal efficiency using a 30 percent MEA (monoethanolamine) aqueous solution. MEA is the reference solvent to determine baseline performance against which other solvents tested will be compared. These may include hindered amines, amino acid salts, and ionic liquids. Figure 16 provides a process flow diagram of the PSTU.

NATIONAL CARBON CAPTURE CENTER TOPICAL REPORT POWER SYSTEMS DEVELOPMENT FACILITY BUDGET PERIOD ONE
20
Figure 16. Process Flow Diagram of the PSTU.
The PSTU includes five major columns, which include:
• Pre-scrubber to remove trace amounts of SO2 in the desulfurized flue gas • Cooler/condenser to cool the flue gas to an appropriate temperature for absorption reactions
and to remove excess water • Absorber for capture of the CO2 in the flue gas using a solvent solution • Washing tower to remove trace amounts of solvent entrained in the treated flue gas • Regenerator for release of the captured CO2 from the rich solvent solution Around each column are associated ancillary equipment items such as heat exchangers and pumps, and pipe work to make alternative interconnections. Appropriate instruments and controllers will be implemented to control and maintain the system process. The PSTU will be operated in a continuous mode with a fully-automatic control scheme.
Key design considerations of the PSTU are listed below:
• The vessels were spaced to allow for modifications and additional equipment to be installed to investigate alternative flow schemes.

NATIONAL CARBON CAPTURE CENTER TOPICAL REPORT POWER SYSTEMS DEVELOPMENT FACILITY BUDGET PERIOD ONE
21
• The regenerator can operate at up to 200 psig, as some solvents can be regenerated at pressure, which offers the advantage of a reduced CO2 compression ratio.
• The absorber and regenerator design allow alternative packing and other gas-liquid contacting arrangements to be readily installed.
• The absorber and regenerator were designed with numerous process nozzles to allow for different flow schemes and with sufficient instrumentation nozzles for comprehensive data collection.
• The system was designed to cover a wide range of flue gas and solvent flow turndown to accommodate process variations arising from the use of solvents with different properties.
• As many solvents are to be used, the equipment was designed for easy draining and cleaning. The process requirements for the major columns are specified in Table 6.
Table 6. PSTU Column Process Requirements.
Equipment Pre-Scrubber
Cooler/ Condenser Absorber Washing
Tower Regenerator
Outside Diameter, in 30 24 26 24 24
Number of Beds 1 1 3 + 1 for future use 1 2 + 1 for
future use Bed Height, ft 20 10 20; 10 10 20; 7
Packing Type Random or Structured Structured Structured Structured Structured
Maximum Operating Temperature, °F 200 200 300 200 400 Maximum Operating Pressure, psig 15 15 15 15 200 Sump Volume No* No* Yes No* Yes Mist Eliminator Yes Yes Yes Yes Yes Viewing Ports Yes Yes Yes Yes Yes Additional Nozzles for Multi-Stage Feed and Take-Off No No Yes No Yes
*Buffer tank serves as sump volume. 4.2.2 PSTU Process Description
Pre-Scrubber. The flue gas enters the bottom of the pre-scrubber and flows upward. A caustic soda solution enters the top of the column and flows down counter-currently with the flue gas for SO2 scrubbing reaction. The treated flue gas exits at the top of the column. The solution is collected in a buffer tank and pumped back to the top of the column for continuous circulation. The buffer tank is initially filled with a 5 wt% caustic soda solution and operates in a batch mode until the solution reaches 1 wt% caustic soda. The tank is then drained down to 20 percent capacity and the liquid removed is sent to the BOP equipment for treatment. The tank is then refilled with a 6 wt% caustic soda solution to 100 percent capacity, thus forming an overall concentration of 5 wt% for another cycle of batch operation.
A filter is installed in the circulation loop for removing any particulate matter entrained in the flue gas and formed in the process. The treated flue gas pressure is subsequently boosted by a blower to an appropriate pressure for overcoming pressure drops through the gas path. A slight
NATIONAL CARBON CAPTURE CENTER TOPICAL REPORT POWER SYSTEMS DEVELOPMENT FACILITY BUDGET PERIOD ONE
22
vacuum may be created to draw the flue gas through the pre-scrubber depending on the flue gas header pressure. This arrangement minimizes any particulate fouling and damage to the blower and thus prolongs its life.
The pre-scrubber subsystem is designed to process up to 12,000 lb/hr of flue gas, while the other components of the PSTU are designed for 5,000 lb/hr of flue gas. The extra capacity of the pre-scrubber can provide treated flue gas to other test units in the PC4.
Cooler/Condenser. The boosted flue gas then enters the cooler/condenser where the flue gas is cooled by circulating water in the column. A buffer tank, a pump, a filter, and a cooler provide the circulating water loop for the column operation. The condensed water is sent to a storage tank, which provides process make-up water to various points in the process.
Absorber. The cooled flue gas enters the absorber at the bottom. The lean solvent enters at the top of the column. The flue gas and the solvent flow counter-currently in the packed bed where mass transfer occurs. The CO2 gas is absorbed in the solvent.
The absorber was designed with three main bed sections for absorption. A spare section without packing was reserved at the top of the column for future applications. Because the absorption reactions are exothermic, an inter-cooling loop between two adjacent beds was incorporated to moderate the temperature profile along the column height. Each loop has a cooler and a pump for circulating the solution. A split flow loop was also designed for future expansion. The purpose of this loop is to cool and send a slip stream of the rich solution back to the various levels of the column to improve the absorption efficiency.
The lean solvent is supplied by a feed tank, which provides a buffering volume and is equipped with a filter system in a circulating loop to remove any particulate and foam-prone hydrocarbon compounds. The filter system consists of a particulate filter, a carbon bed filter, and an after-bed particulate filter. A pump provides a circulating flow for the filtration process. A bypass line around the filter system facilitates agitation need for the feed tank if required.
In addition to the normal feed line at the top of the absorber, the lean solvent can also be fed to the middle of the column at different levels between the bed sections. This layout allows for testing different combinations of the absorption sections.
Washing Tower. The flue gas from the absorber is processed in the washing tower to remove any entrained solvent in the treated flue gas before it is discharged to the stack. A buffering tank, a pump, and a heat exchanger provide a water circulating loop for the washing process. The exit gas temperature is controlled by the cooling water in the heat exchanger to manage the overall water balance.
The water condensed in the washing tower and collected in the buffering tank is sent to the absorber either directly to the top of the column or to the feed tank. The excess water is sent to the water storage tank.

NATIONAL CARBON CAPTURE CENTER TOPICAL REPORT POWER SYSTEMS DEVELOPMENT FACILITY BUDGET PERIOD ONE
23
Regenerator. The CO2-rich solvent is drawn from the bottom of the absorber and pumped to the regeneration process. The rich solvent passes through a particulate filter and is then pre-heated using hot lean solvent from the regenerator in a cross flow heat exchanger. The hot rich solvent then flashes in a separator to separate the vapor from the liquid. The liquid is pumped to the top of the regenerator. The solvent solution flows down in the packed bed and contacts steam where heat and mass transfers occur and the CO2 is released. The steam is generated in a reboiler at the bottom of the regenerator by partially evaporating a slip stream of the solvent solution. De-superheated low pressure steam from the BOP provides the heat source for the reboiler. Higher pressure steam is also available for testing purposes.
The regenerated lean solvent is drawn from the bottom of the regenerator and pumped through the cross heat exchanger to pre-heat the rich solvent. The partially cooled lean solvent is further cooled and then filtered by a full-stream coarse particulate filter before it enters the feed tank to complete the absorption and regeneration cycle.
The CO2 gas exiting the regenerator together with the CO2 gas from the separator is cooled in a cooler and separated from the condensate in a separator. The CO2 gas is then discharged to the stack. The CO2 gas temperature is controlled by cooling to maintain a water balance. The condensed water is sent back to the regenerator or the feed tank.
A small stream (about 3 to 5 percent) of the lean solvent is drawn from the bottom of the regenerator and treated in a reclaimer. The extent of this process depends on the degree of solvent degradation. In this process, the solvent is heated to a higher temperature than the operating temperature. The solvent is vaporized and sent back to the bottom of the regenerator. The vaporization leaves the non-volatile compounds and heat stable salts in the reclaimer, which will be blown down for disposal as needed. Caustic soda is also added to the reclaimer to chemically react with degradation products to release the solvent.
The reclaimer is powered by partially de-superheated medium pressure steam. The steam condensate from both the reclaimer and the reboiler is collected in a condensate pot for use of de-superheating steam or returning to the power plant.
4.2.3 PSTU Control Scheme
The overall process is designed to operate automatically. Several major control strategies will be established for the overall process as detailed below. Local temperature and level controls are also implemented for individual equipment operation.
Temperature Control. The temperatures at two gas exit points from the washing tower and the separator downstream of the regenerator will be controlled as close as possible to the flue gas inlet temperature. This way, the net water gain or loss will be minimized for overall water balance management. It will also minimize the impact of the water gain or loss on the solution chemistry as such changes will alter the solvent concentration in the solution.

NATIONAL CARBON CAPTURE CENTER TOPICAL REPORT POWER SYSTEMS DEVELOPMENT FACILITY BUDGET PERIOD ONE
24
Flow Control. The solvent flow rate in the circulation loop will be controlled based on the inlet flue gas flow rate and the overall CO2 removal efficiency. The performance data can be evaluated based on the CO2 flow rate and treated flue gas flow rate as well as online sampling.
Pressure Control. Pressure controls are included for the gas outlets and solvent loop. The two gas exit points will have different pressure controls for the required absorption and regeneration processes, which may be different depending on the solvent tested. The test unit outlet is also equipped with a shut-off valve to isolate the unit from the main flue gas loop. This arrangement will protect the unit from the vacuum draft from the ID fan in the power plant in case of a failure of the pressure control system.
4.3 Solvent Evaluation Procedure
In preparation for the testing of CO2 capture solvents at the PC4, a set of criteria were identified to aid selection of solvents and to prioritize the sequence in which they are tested. These criteria are listed in Table 7.
Table 7. Solvent Selection Criteria.
MEA MDEA Candidate Solvent
Heat of reaction, Btu/lb CO2 825 550 Lower Rate constant, mol/L/s 7600 9.2 Higher CO2 loading, mol CO2/mol solvent ~ 0.3 ~ 0.7 Higher Dilution, wt% water 70 50 Lower Pressure, psia 25 30 Higher Volatility, millibar 0.27 0.013 Lower Corrosivity, micron/yr 30 5 Lower Foaming, degradation, toxicity TBD TBD Lower
To qualify for testing at least one parameter must be superior to that of either MEA used for flue gas or MDEA used for syngas. The more parameters superior to the base line, the higher its testing priority will be. However, not all parameters are equally significant. For example, the solvent reaction rate constant affects absorber height, which is a low cost component, whereas solvent loading affects absorber diameter, which is a higher cost component. (Further work in this area may involve the development of a cost model taking such factors into account in support of the solvent selection process.) In addition, a particular parameter may eliminate a solvent despite otherwise offering process advantages. For example, a solvent with high degradation rate will have high make-up rates, and this may negate any economic advantage arising from more favorable properties, such as high CO2 loading.
For confident characterization of a solvent when tested in the PSTU on flue gas, it is essential to achieve good heat and energy balances over the test equipment. Considerable effort has gone into selecting appropriate instruments and identifying reliable analytical procedures. To conform that measurements on the PSTU are accurate, quality assurance and quality control measures have been identified. Examples of these measures are listed below.

NATIONAL CARBON CAPTURE CENTER TOPICAL REPORT POWER SYSTEMS DEVELOPMENT FACILITY BUDGET PERIOD ONE
25
• Annubars are used to measure flue gas flowing into the absorber, and CO2 flowing out of the regenerator. Ports are provided to allow periodic pitot traverses downstream of the annubars to check their accuracy.
• Solvent CO2 content is to be determined by an automated titration procedure. A batch sample can be taken from the sample line for laboratory analysis.
• Laboratory analyses for solvent characterization (for example CO2 species, degradation products, metal ions and sulfur compounds present) will be assessed for accuracy by submitting standard samples and spiked samples for analysis.
A similar exercise is to be completed in support of pre-combustion CO2 capture testing.
5.0 FUEL FLEXIBILITY
The effort to broaden the fuel envelope of the gasification process included modifications to and testing of the modified developmental coal feed system as well as evaluation of biomass as a gasifier fuel stock.
5.1 PDAC Feeder
The pressure decoupled advanced coal (PDAC) feeder is a non-mechanical feed control device with no moving parts which combines some of the successful concepts developed with the PSDF continuous ash depressurization systems with traditional designs for flow rate control. The driving force for solids flow is a pressure differential, and the solids flow is metered by the nitrogen conveying gas.
The first on-line coal feed operation of the PDAC feeder occurred in 2009 (in test campaign TC25). Although the feeder has operated with high availability since its commissioning, improvements in feed rate steadiness were needed. During BP1, modifications to the system were incrementally made and tested both while feeding coal to the gasifier and while operating in the off-line test system. The modifications resulted in continually improved feed rate control and included:
• A redesign of the lower portion of the feed device to help reduce pressure drop • Implementation of a new lock vessel control strategy to improve operation with fine coal • Reduction of feed line restrictions • Replacement of capacitance level indicators with level instruments using vibrating rods
(described in Section 6.1) • Improvements to the aeration at the dispense vessel exit to improve operability at startup • Replacement of a portion of the line feeding the Transport Gasifier with a slightly larger size
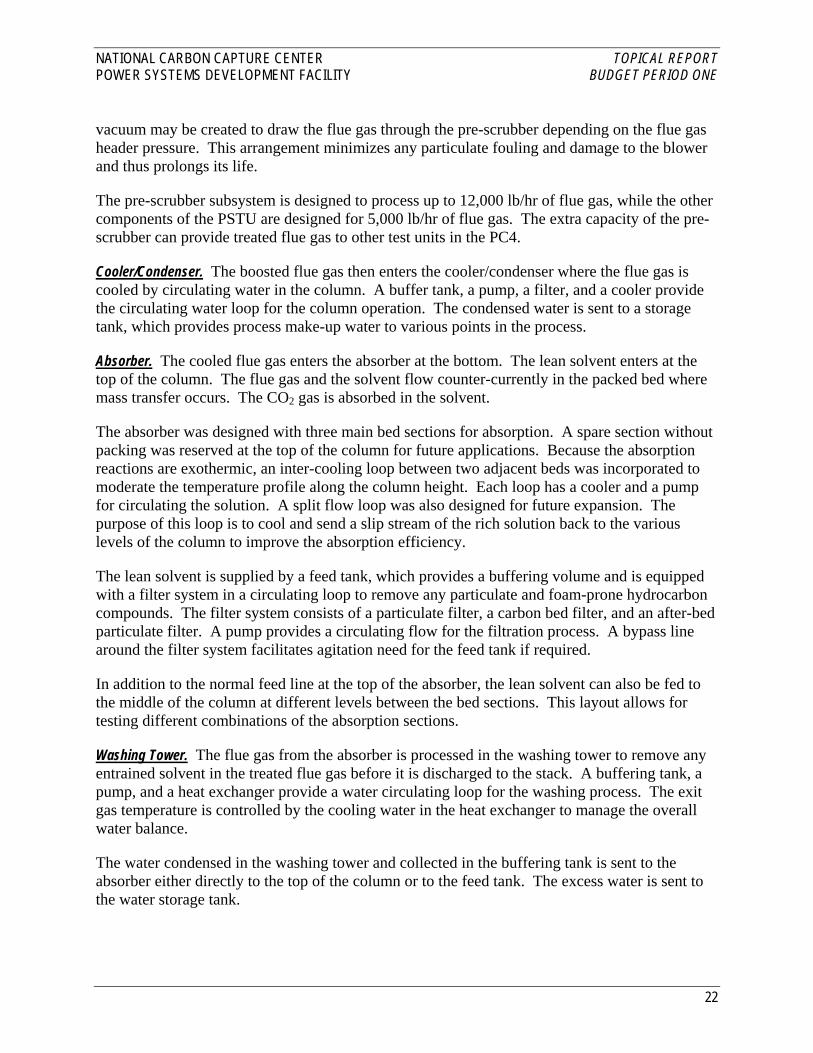
to match the remainder of the feed piping The modifications made over the course of BP1 resulted in significantly improved feed rate control. The improved feed rate stability is demonstrated by Figure 17. The figure shows the standard deviation of the gasifier outlet temperature during steady state periods for the first on-line testing of PDAC (TC25) and the last test run of BP1, R02. Because the coal feed rate was steadier in R02, the gasifier temperature variation was lower. Both the maximum and average
NATIONAL CARBON CAPTURE CENTER TOPICAL REPORT POWER SYSTEMS DEVELOPMENT FACILITY BUDGET PERIOD ONE
26
values of the temperature deviation were more than halved as a result of the modifications. Further optimization of the PDAC feed control was planned.
Figure 17. Gasifier Temperature Deviation before and after PDAC Modifications.
In addition to improved feed rate control, the feeder demonstrated these key features:
• Stable, long-term operation at high coal feed rates (~4,060 lb/hr) • Large turn-down ratio (6,500 to 500 lb/hr) • Excellent availability 5.2 Biomass Evaluation
The most significant potential operational challenges associated with using biomass as a fuel in the Transport Gasifier include feeding the material in a pressurized environment and agglomeration formation in the gasifier. Therefore, evaluation of biomass addressed these two issues.
Feeder Testing. In evaluating biomass as a fuel for gasification, wood pellets purchased from commercial facilities were subjected to several feeder tests to determine compatibility with the existing coal feeding equipment. Torrified (heat-treated) biomass was also considered as a gasification fuel, and, while it seemed suitable for feeding in existing feeder systems, it was not available in sufficiently large quantities.
Cold-flow feeder model tests confirmed that pulverized wood pellets could be fed at pressure with existing equipment. Following this initial evaluation, milled wood pellets were tested in the off-line feed system using the original coal feeder. During the testing, the feeder performed well and experienced no lock hopper bridging or conveying line plugging, feeding 11 tons of the milled pellets for 16 hours over 3 days. The test conditions were:
02468
10121416
TC25 R02
Stan
dard
Dev
iation
of G
asifie
r Te
mper
ature
, o F
MaximumAverage

NATIONAL CARBON CAPTURE CENTER TOPICAL REPORT POWER SYSTEMS DEVELOPMENT FACILITY BUDGET PERIOD ONE
27
• Feed rates ranging from 400 to 3,000 lb/hr • Feeder operating pressure varying between 150 and 230 psig • As-fed biomass mass median diameter (MMD) averaging 730 microns • As-fed biomass moisture remaining below 10 weight percent The conveying gas usage was comparable to coal and was sufficient for conveying the biomass, but the lock hopper nitrogen usage was roughly 40 percent higher than lignite on an energy basis. The low moisture content and large particle size may have offset any plugging tendency of the biomass fiber, and further testing will be conducted as needed to confirm these results. Some modifications to the coal mill conveying system will be incorporated for future testing.
Testing of the original coal feed system confirmed that the biomass feed rate was less than that for coal for a given feeder speed. The as-fed biomass density was about 12 lb/ft3 less than coal, which resulted in a lower feed rate since the feeder is a fixed volume device. The feeder speed was varied to evaluate the effect of feeder speed and the maximum biomass feed rate achievable. Figure 18 shows that the biomass feed rate increased as the feeder speed increased as expected and was less than the relative coal feed rate at a given speed. The maximum biomass feed rate achievable was about 3,000 lb/hr.
Figure 18. Feed Rate as a Function of Feeder Speed with Coal and with Biomass.
Agglomeration Studies with Biomass and Standpipe Ash. In addition to the feeder testing, laboratory agglomeration studies were conducted to identify potential problems with the co-gasification of biomass with either PRB coal or Mississippi lignite. The biomass used for the testing was in the form of pulverized wood pellets. To evaluate whether potassium vapor liberated from the biomass could cause ash agglomeration, samples of the wood pellets were pulverized and placed in crucibles. A layer of gasification ash (taken from the gasifier standpipe) from either
0500
1,0001,5002,0002,5003,0003,5004,0004,500
0 5 10 15 20 25 30
Feed
Rate
, lb/hr
Feeder Speed, rpm
CoalBiomass

NATIONAL CARBON CAPTURE CENTER TOPICAL REPORT POWER SYSTEMS DEVELOPMENT FACILITY BUDGET PERIOD ONE
28
Mississippi lignite or PRB coal was then placed over the biomass, and the crucible was baked at 1,800°F for a period of five hours.
After baking, the sample was examined for any signs of agglomeration, then thoroughly mixed and placed over another layer of freshly pulverized biomass for a second baking at the same temperature. In order to simulate the solids recycling and retention in the Transport Gasifier, the cyclic baking procedure was repeated 11 times for the PRB standpipe ash and 17 times for the Mississippi lignite standpipe ash.
After each cycle of baking, the samples were examined visually for any signs of agglomeration. The samples were also periodically examined by optical microscopy to detect signs of sintering or fusion, such as necks between particles. After the complete set of baking tests was completed, the samples were also examined by scanning electron microscopy (SEM) with energy-dispersive X-ray (EDX) analysis.
SEM photographs of the baked samples, presented in Figure 19, showed that the PRB ash particles were somewhat angular, while the biomass ash particles generally had a smoother, flat appearance.
Figure 19. SEM Photographs of Baked PRB and Biomass Ash Particles.
EDX analysis results for the PRB standpipe ash and the biomass ash are compared in Figure 20. The most striking difference is the potassium peak that is evident with the biomass ash but nonexistent with the PRB ash. SEM examination of the baked biomass/PRB ash samples did not reveal any evidence of significant consolidation. Formation of necks between particles was observed in less than one percent of the particles and was no more prevalent than in the PRB ash itself.
PRB Ash Biomass AshPRB Ash Biomass Ash
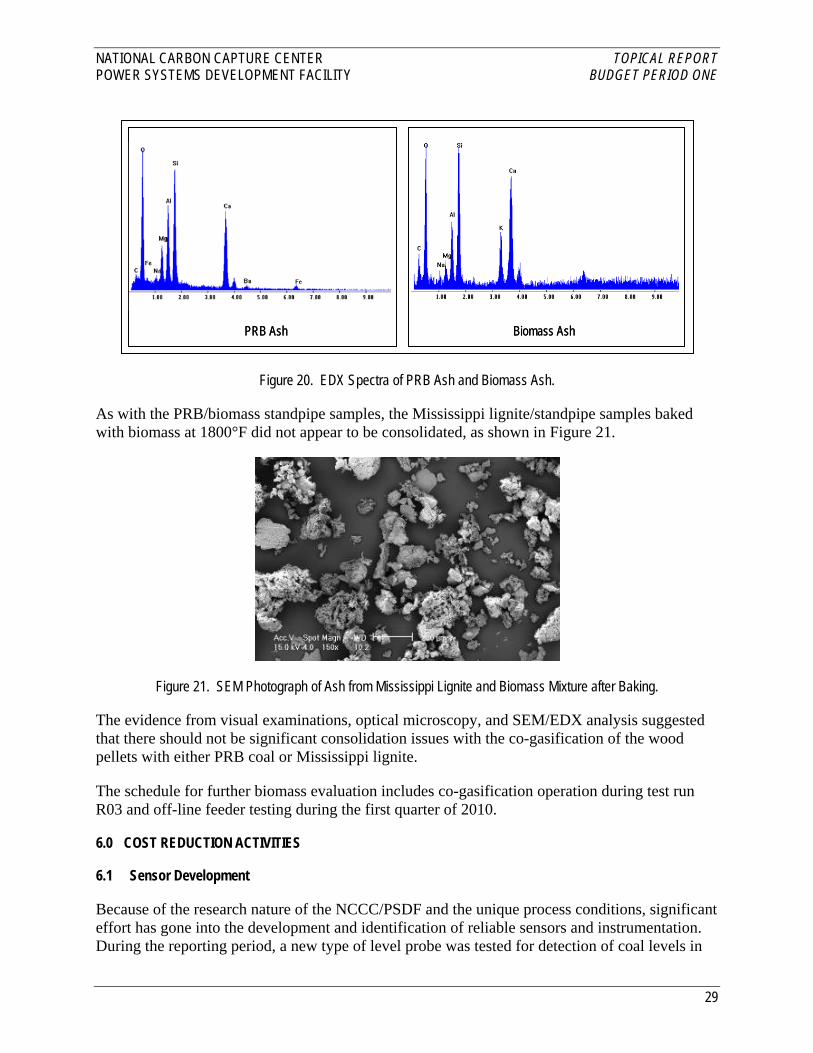
NATIONAL CARBON CAPTURE CENTER TOPICAL REPORT POWER SYSTEMS DEVELOPMENT FACILITY BUDGET PERIOD ONE
29
Figure 20. EDX Spectra of PRB Ash and Biomass Ash.
As with the PRB/biomass standpipe samples, the Mississippi lignite/standpipe samples baked with biomass at 1800°F did not appear to be consolidated, as shown in Figure 21.
Figure 21. SEM Photograph of Ash from Mississippi Lignite and Biomass Mixture after Baking.
The evidence from visual examinations, optical microscopy, and SEM/EDX analysis suggested that there should not be significant consolidation issues with the co-gasification of the wood pellets with either PRB coal or Mississippi lignite.
The schedule for further biomass evaluation includes co-gasification operation during test run R03 and off-line feeder testing during the first quarter of 2010.
6.0 COST REDUCTION ACTIVITIES
6.1 Sensor Development
Because of the research nature of the NCCC/PSDF and the unique process conditions, significant effort has gone into the development and identification of reliable sensors and instrumentation. During the reporting period, a new type of level probe was tested for detection of coal levels in
PRB Ash Biomass AshPRB Ash Biomass Ash

NATIONAL CARBON CAPTURE CENTER TOPICAL REPORT POWER SYSTEMS DEVELOPMENT FACILITY BUDGET PERIOD ONE
30
the PDAC feeder. The new type of level probe, shown in Figure 22, is the Dynatrol Detector level switch supplied by Automation Products, Inc. The Dynatrol Detector consists of a probe with a drive coil installed on the hopper wall and a pick-up coil located opposite of the probe. When the probe is uncovered, the drive coil causes oscillations at the natural resonance frequency of the probe, and these oscillations result in an AC signal voltage from the pick-up coil. When coal covers the probe, the oscillations are dampened, resulting in a “covered” indication.
Figure 22. Level Probe Used in the PDAC Feeder.
The level probes were installed in the PDAC feeder dispense vessel and the lock vessel prior to the R02 test run. They have provided a much more reliable level indication than the previously used capacitance probes. As a result of the increased reliability, the lock vessel filling cycle was optimized to use the level probe indication to end the fill cycle instead of waiting for the timer to time out. The benefit of this change is especially significant when operating the feeder a higher feed rates.
The vibrating action of the probes prevents them from giving false “covered” indications, unlike the stationary capacitance probes, which would give covered indications due to dust buildup. To date, no false indications have been observed from the new level probes. Other advantages of these level probes are that they do not require field adjustment, and they have a high pressure rating of 1,000 psig, which makes them relevant for applications in commercial IGCC facilities.
6.2 Gasifier Performance Optimization
Lignite Testing in R01. R01, the first test campaign under the new DOE cooperative agreement, occurred in January and February 2009. As the third test run using high moisture lignite from North American Coal Corporation’s Red Hills Mine located in Ackerman, Mississippi, it was an opportunity to optimize gasifier operation with this coal. During R01, which included 510 hours of gasification operation, coal feed operation was reliable, with no significant coal feed stoppages, and the highest lignite coal feed rate to date (~6,000 lb/hr) was demonstrated. All gasifier-related parametric tests were completed, as were tracer gas tests to evaluate gasifier flow characteristics.
Figure 23 plots the carbon conversion versus gasifier temperature for R01 and the preceding Mississippi lignite test (TC25). The data were taken from steady state operating periods with
www.dynatrolusa.com
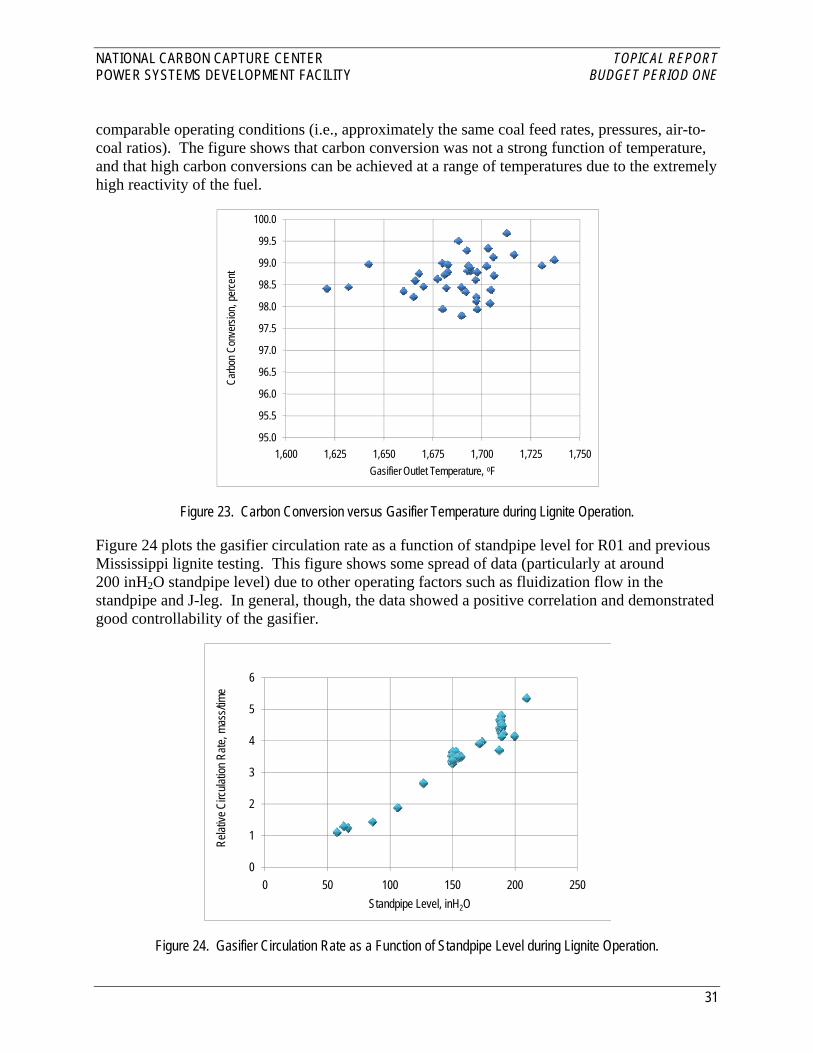
NATIONAL CARBON CAPTURE CENTER TOPICAL REPORT POWER SYSTEMS DEVELOPMENT FACILITY BUDGET PERIOD ONE
31
comparable operating conditions (i.e., approximately the same coal feed rates, pressures, air-to-coal ratios). The figure shows that carbon conversion was not a strong function of temperature, and that high carbon conversions can be achieved at a range of temperatures due to the extremely high reactivity of the fuel.
Figure 23. Carbon Conversion versus Gasifier Temperature during Lignite Operation.
Figure 24 plots the gasifier circulation rate as a function of standpipe level for R01 and previous Mississippi lignite testing. This figure shows some spread of data (particularly at around 200 inH2O standpipe level) due to other operating factors such as fluidization flow in the standpipe and J-leg. In general, though, the data showed a positive correlation and demonstrated good controllability of the gasifier.
Figure 24. Gasifier Circulation Rate as a Function of Standpipe Level during Lignite Operation.
95.0
95.5
96.0
96.5
97.0
97.5
98.0
98.5
99.0
99.5
100.0
1,600 1,625 1,650 1,675 1,700 1,725 1,750
Carb
on C
onve
rsion
, per
cent
Gasifier Outlet Temperature, oF
0
1
2
3
4
5
6
0 50 100 150 200 250
Relat
ive C
ircula
tion R
ate, m
ass/t
ime
Standpipe Level, inH2O

NATIONAL CARBON CAPTURE CENTER TOPICAL REPORT POWER SYSTEMS DEVELOPMENT FACILITY BUDGET PERIOD ONE
32
Oxygen-Blown PRB Testing in R02. R02 took place in August and September 2009 for 477 hours of on-coal operation, including 47 hours in oxygen-blown gasification mode. Gasifier-related parametric tests were completed during air-blown mode, and operations were held steady for long periods to facilitate testing at the SCU. All the test objectives were met with the exception of the full assessment of gasifier performance in oxygen-blown mode. Parametric testing to reduce steam-to-oxygen ratios during oxygen-blown operation was cut short due to a coal supply shortage, and the range of steam-to-oxygen ratios tested was limited to 1.1 to 1.3 lb/lb. Gasifier performance was consistent with historical oxygen-blown testing in this range of steam-to-oxygen ratios.
6.3 Hot Gas Filter Element Evaluation
Research related to the particulate control device (PCD) continued to focus on material testing. During R01, long-term evaluation continued on the most extensively tested filter elements—Pall Corporation’s PSS (originally signifying Powered Stainless Steel) elements made of iron aluminide (FEAL) sintered powder material and its Dynalloy elements made from HR-160 sintered fiber material. In addition, a new type of metal element was tested for the first time during R02, which was a sintered fiber element made by Porvair. These Porvair Inert Coating (IC) elements were designed with an outer screen to provide structural support and with a coating of inert material for corrosion resistance. Figure 25 is a photograph of the types of elements tested during BP1, with a new Dynalloy HR-160 element on the left, a new PSS element of FEAL material in the middle, and a used, cleaned Porvair IC element on the right.
Figure 25. PCD Filter Elements Tested during BP1.
As part of the filter element evaluation protocol, all elements are initially screened by measuring their collection efficiencies at ambient conditions in a cold-flow PCD model using gasification ash collected from the Transport Gasification process during test runs. Cold-flow model collection efficiencies for the three types of elements tested during BP1 are given in Table 8. As expected, the sintered powder FEAL elements gave the highest initial collection efficiency, and these elements continued to demonstrate excellent collection efficiency after pitting corrosion was observable on the media. While the collection efficiencies were lower for the fiber elements, they were still high enough initially to meet operational requirements, primarily
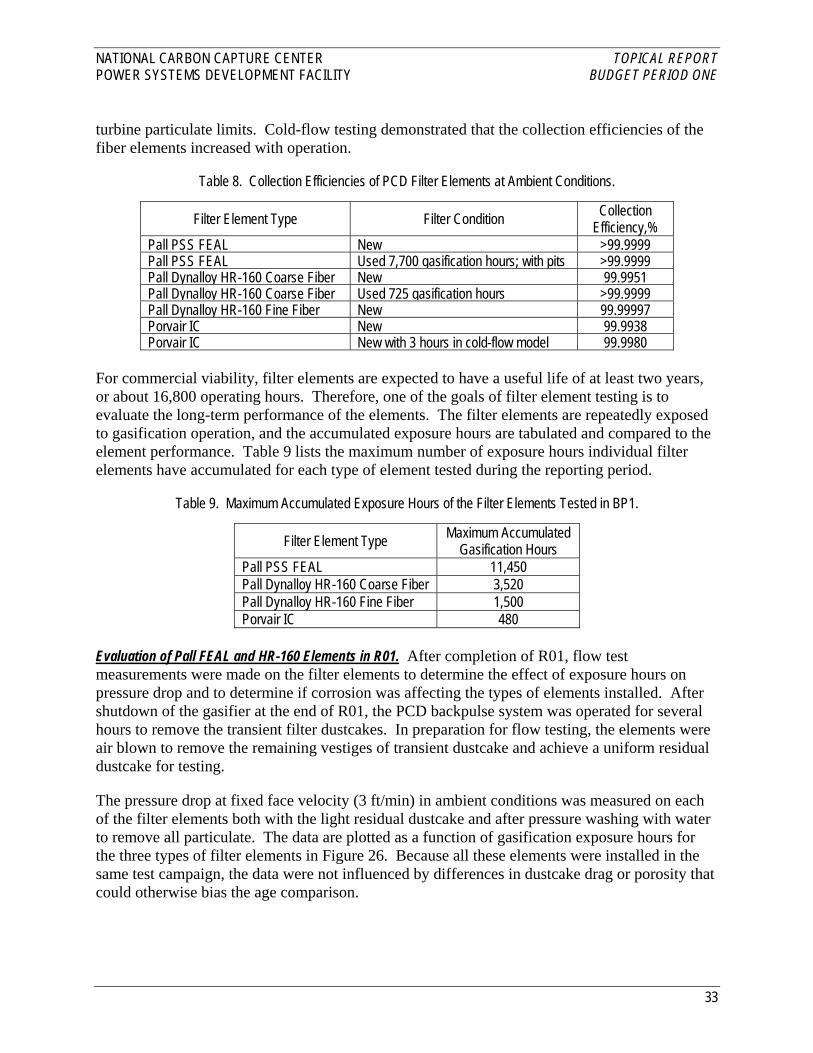
NATIONAL CARBON CAPTURE CENTER TOPICAL REPORT POWER SYSTEMS DEVELOPMENT FACILITY BUDGET PERIOD ONE
33
turbine particulate limits. Cold-flow testing demonstrated that the collection efficiencies of the fiber elements increased with operation.
Table 8. Collection Efficiencies of PCD Filter Elements at Ambient Conditions.
Filter Element Type Filter Condition Collection Efficiency,%
Pall PSS FEAL New >99.9999 Pall PSS FEAL Used 7,700 gasification hours; with pits >99.9999 Pall Dynalloy HR-160 Coarse Fiber New 99.9951 Pall Dynalloy HR-160 Coarse Fiber Used 725 gasification hours >99.9999 Pall Dynalloy HR-160 Fine Fiber New 99.99997 Porvair IC New 99.9938 Porvair IC New with 3 hours in cold-flow model 99.9980
For commercial viability, filter elements are expected to have a useful life of at least two years, or about 16,800 operating hours. Therefore, one of the goals of filter element testing is to evaluate the long-term performance of the elements. The filter elements are repeatedly exposed to gasification operation, and the accumulated exposure hours are tabulated and compared to the element performance. Table 9 lists the maximum number of exposure hours individual filter elements have accumulated for each type of element tested during the reporting period.
Table 9. Maximum Accumulated Exposure Hours of the Filter Elements Tested in BP1.
Filter Element Type Maximum Accumulated Gasification Hours
Pall PSS FEAL 11,450 Pall Dynalloy HR-160 Coarse Fiber 3,520 Pall Dynalloy HR-160 Fine Fiber 1,500 Porvair IC 480
Evaluation of Pall FEAL and HR-160 Elements in R01. After completion of R01, flow test measurements were made on the filter elements to determine the effect of exposure hours on pressure drop and to determine if corrosion was affecting the types of elements installed. After shutdown of the gasifier at the end of R01, the PCD backpulse system was operated for several hours to remove the transient filter dustcakes. In preparation for flow testing, the elements were air blown to remove the remaining vestiges of transient dustcake and achieve a uniform residual dustcake for testing.
The pressure drop at fixed face velocity (3 ft/min) in ambient conditions was measured on each of the filter elements both with the light residual dustcake and after pressure washing with water to remove all particulate. The data are plotted as a function of gasification exposure hours for the three types of filter elements in Figure 26. Because all these elements were installed in the same test campaign, the data were not influenced by differences in dustcake drag or porosity that could otherwise bias the age comparison.

NATIONAL CARBON CAPTURE CENTER TOPICAL REPORT POWER SYSTEMS DEVELOPMENT FACILITY BUDGET PERIOD ONE
34
Figure 26. Pressure Drop versus Gasification Exposure Hours for Pall PSS FEAL and Dynalloy Elements.
The FEAL filter elements continued to show the previously established trend of increasing pressure drop with time for both clean and dirty elements. The Dynalloy elements did not have enough operating hours to show significant increases in pressure drop. Microscopic examination did not show the buildup of corrosion product on the HR-160 metal that is thought to be responsible for the pressure drop buildup with the FEAL elements. Further testing of these three types of elements was planned for future test runs.
Evaluation of Porvair IC Elements in R02. For R02, the filter elements installed in the PCD consisted entirely of the Porvair elements. The installation of only one type of element allowed confident evaluation of the collection performance of these elements in gasification operation. Operation of the PCD with the sintered fiber elements yielded excellent collection efficiency (>99.999 percent).
After the completion of R02, several of the Porvair IC elements were flow tested before and after pressure washing with water. Figure 27 plots the pressure drop versus face velocity for these elements. As demonstrated by the figure, washing the elements restored them to essentially new condition, with pressure drops generally under 1 inH2O. This was consistent with results from other sintered fiber elements.
0
10
20
30
40
50
60
70
0 2,000 4,000 6,000 8,000 10,000 12,000 14,000
Pres
sure
Dro
p at 3
ft/m
in, in
H 2O
Gasification Exposure Hours
FEAL, UnwashedDynalloy HR-160 Fine Fiber, UnwashedDynalloy HR-160 Coarse Fiber, UnwashedFEAL, WashedDynalloy HR-160 Fine Fiber, WashedDynalloy HR-160 Coarse Fiber, Washed

NATIONAL CARBON CAPTURE CENTER TOPICAL REPORT POWER SYSTEMS DEVELOPMENT FACILITY BUDGET PERIOD ONE
35
Figure 27. Pressure Drop versus Face Velocity for Porvair IC Elements.
The washed Porvair IC elements were inspected for possible corrosion or damage of the filter media using an optical microscope. The cleaned surface areas were shiny and intact, and the inspection did not show any obvious corrosion after the limited exposure time in R02. For test run R03, ten of the previously exposed Porvair IC elements were re-installed in the PCD for further testing.
7.0 SUPPORT OF OUTSIDE RESEARCH
The NCCC/PSDF provided a host site for syngas testing of several types of advanced technologies, including a fuel cell developed by NETL, a hydrogen membrane by Media & Process Technology (MPT), and Johnson Matthey’s high-temperature mercury sorbent.
7.1 NETL Fuel Cell
Most solid oxide fuel cell (SOFC) testing to date has been performed with natural gas, which is virtually free of contaminants. In 2005, the PSDF exposed the first SOFC (a 1-kW planar cell in support of DOE’s Solid State Energy Conversion Alliance) to coal-derived syngas that contained the various trace elements released during gasification. The final test ran continuously for 70 hours with a constant power output. In a continuation of the development work, DOE has strived to determine the effect of trace species present in coal-derived syngas on SOFC performance. The trace elements of greatest interest are antimony, arsenic, cadmium, lead, mercury, phosphorus, selenium, sulfur, tin, and zinc. Based on results of previous testing at the PSDF, higher hydrocarbons such as benzene are also expected to affect SOFC performance.
Coal contains many trace species and the amount released into the syngas varies for different feed stocks and with gasifier operating conditions. This variation in conjunction with a variety of possible interactions with the separate SOFC components requires a large effort to quantify the effect of all the contaminants. To speed up data collection at a reasonable cost, NETL has
0
5
10
15
20
25
30
2 3 4 5 6 7 8 9
Pres
sure
Dro
p, inH
2O
Filter Face Velocity, ft/min
Porvair IC, UnwashedPorvair IC, Washed

NATIONAL CARBON CAPTURE CENTER TOPICAL REPORT POWER SYSTEMS DEVELOPMENT FACILITY BUDGET PERIOD ONE
36
built a unique multi-cell array (MCA) test skid that can hold as many as twelve small “button” planar SOFCs, each with an active area of 2 cm2. These are identical in composition and operation to a full-sized cell but at far lower cost.
Figure 28 provides a sectional view of a button and includes materials of construction and key dimension. Each button in the array can be different allowing a wide range of variables to be investigated within the same operating period. For example, different electrode materials can be tested at the same current density, or the same electrode materials can be tested under different current densities.
Figure 28. Sectional View of Fuel Cell Button Mounted in Support Tube.
The base plate for the MCA and the assembled array are shown in Figure 29. The twelve buttons are arranged in parallel in four groups of three. The fuel gas is fed from below up the center of a concentric tube and removed down the outer annulus. Air is passed over the upper surface of the buttons and exits through two exhaust channels set in the surface of the array.
Figure 29. NETL’s Multi-Cell Array.
A B
C D E
FG
H
Syngas flow
I
Key:
A Nickel support ringsB Nickel sponge current collectorC Nickel with yttrium stabilized zirconia anode (∼ 700 microns)D Yttrium stabilized zirconia electrolyte (∼ 10 to 50 microns)E Lanthanum strontium manganite cathode (∼ 25 to 100 microns)F Gold mesh current collectorG Glass gasketH Outer alumina tube, 1.125-inches ID and 1.375-inches ODI Inner alumina tube, 0.25-inches ID and 0.375-inches OD
Recess for fuel gas delivery tube Exhaust channel
Fuel gas controls
Base plate
Button Cells with Electrical Leads Fuel Gas
Delivery Tubes
Upper Surface of Multi-Cell Array Base Plate Installed Multi-Cell Array Assembly

NATIONAL CARBON CAPTURE CENTER TOPICAL REPORT POWER SYSTEMS DEVELOPMENT FACILITY BUDGET PERIOD ONE
37
NETL first began testing of the SOFC MCA on coal-derived syngas at the PSDF in 2008. Several design improvements were identified as a result of this testing, and were implemented and tested at NETL prior to further testing at the NCCC in September 2009 during R02.
Prior to commencing testing the fuel cell unit is heated up with nitrogen and checked for cell integrity. The normal operating temperature of the MCA unit is 1,110°F. To achieve uniform performance, each cell was initially fueled with hydrogen and operated at a current density of 250 mA/cm2 for approximately 24 hours prior to syngas exposure. Under pure hydrogen fuel at this current density, cells uniformly demonstrated power densities in the range of 200 to 225 mW/cm2, which is typical of this cell construction and gas condition.
The filtered syngas used was desulfurized at 650°F using the Johnson Matthey sulfur sorbent Puraspec 2010. The average H2S content of the exit syngas during the run was 3 ppmv. In the 2008 testing, a catalyst was also used to crack the hydrocarbons, but for R02 syngas without hydrocarbon cracking treatment was fed to the MCA. Syngas was fed to each cell at around 180 scm, and was enriched with approximately 9 scm of hydrogen. The syngas temperature was maintained above 400°F to preserve gas-phase trace material content, and no additional water was fed to the system.
Continuous operation on syngas occurred for over 450 hours with ten cells surviving through approximately 350 hours, and eight cells surviving the entire test duration. Losses were typically caused by inadvertent overloading of the cells. For the first 375 hours the gasifier was operated in air-blown mode and for the final 75 hours in oxygen-blown mode.
Upon feeding the hydrogen-enriched syngas, open circuit voltage (OCV) dropped from above 1.15 V on pure hydrogen to 0.975 V, indicating diminished fuel molecule content (H2, CO, and higher hydrocarbons). Cells were initially loaded to various current densities, with two cells remaining at OCV to monitor gas composition, three cells set to 125 mA/cm2, three cells set to 250 mA/cm2, and four cells set to 375 mA/cm2. Initial power densities ranged from 95 to 255 mW/cm2 and deteriorated slightly over the course of the run, which is encouraging as only minimal gas treatment was employed. The power densities achieved were also encouraging given the modest heating value of the syngas.
The SOFC specimen were collected and preserved after gasifier shutdown, and analysis for secondary phase formation, surface contamination, and micro-structural damage was underway. The lack of evidence of carbon deposition indicated that the deterioration may not have arisen from the hydrocarbon presence.
In support of testing, a gas chromatography-inductively coupled plasma-mass spectrometer (GC-ICP/MS) analytical system was used to produce real-time analysis of the trace metals present in the syngas. This system was used for the first time during the 2008 fuel cell testing. The technique is highly sensitive and able to determine concentrations below one part per billion. Conventional analytical techniques require collection of gas samples over several hours followed by time-consuming analysis. The long sampling interval determines the average composition over the period and does not identify any variations occurring during the interval because of changes in gasifier operation. By incorporating a GC instrument, the new technique allows up to

NATIONAL CARBON CAPTURE CENTER TOPICAL REPORT POWER SYSTEMS DEVELOPMENT FACILITY BUDGET PERIOD ONE
38
20 trace elements to be identified simultaneously in a two-minute interval. Shortening the sampling interval allows variation in trace element concentration to be monitored. Also monitoring the inlet and outlet syngas streams identifies those species that do not interact with the SOFC.
The GC-ICP/MS analyzer is still in the developmental stage, and therefore data were also collected using EPA Method 29. To perform Method 29, the gas sample is bubbled through hydrogen peroxide solution acidified with nitric acid that recovers all species of interest including ionic mercury. A second bubbler including potassium permanganate acidified with sulfuric acid is used to remove elemental mercury. (For gasification, all the mercury is expected to be present in elemental form.) The species removed by the solutions are analyzed using conventional ICP/MS techniques.
7.2 Media and Process Technology Hydrogen Membrane
The Media and Process Technology (MPT) Carbon Molecular Sieve (CMS) hydrogen membrane was developed to demonstrate efficiency gain in the water-gas shift reaction while producing hydrogen from coal-derived syngas in a “one-box” configuration. The membrane was designed to enhance CO conversion in fuel gas via the removal of hydrogen in-situ, and/or yield high purity hydrogen as a product or co-product. The key feature of the one-box process is to limit pre-treatment requirements to particulate removal only.
During R01, MPT personnel tested the CMS in a single stage, single tube test unit for over 100 hours using syngas with added hydrogen. The membrane operated at the following conditions:
• Temperature of 440oF • Pressure of 200 psig • Raw syngas flow rate of 3 L/min • Enriched syngas hydrogen content of 40 to 60 vol% The membrane remained stable, and the permeate contained over 90 percent hydrogen with a yield of 30 percent. The syngas sulfur and other contaminants did not appear to affect the membrane performance. Further testing is of the membrane is planned for test run R03.
7.3 Johnson Matthey Mercury Sorbent
One means of capturing mercury released during gasification is to cool the syngas and adsorb the mercury on sulfided activated carbon. Although this method is effective, the cooling results in a significant efficiency loss. To retain the high thermal efficiency of the coal gasification process, a means of removing the mercury at an elevated temperature is required. The Johnson Matthey high-temperature, palladium-based, mercury sorbent was tested during R01. The sorbent was also expected to capture heavy metals other than mercury.

NATIONAL CARBON CAPTURE CENTER TOPICAL REPORT POWER SYSTEMS DEVELOPMENT FACILITY BUDGET PERIOD ONE
39
The sorbent consists of 1 mm (0.04 inch) spheres containing 5 wt% percent of palladium set in an alumina matrix. Testing took place with sour syngas in a fixed-bed reactor in the SCU. Table 10 lists the test conditions.
Table 10. Mercury Sorbent Test Conditions.
Sorbent Mass, lb 10 Bed Height, in 14 Space Velocity, hr-1 2,800 Syngas Flow Rate, lb/hr 40 Bed Temperature, oF 500 Pressure, psig 165 Test Duration, hr 170
During the test, GC and FTIR analyzers measured the H2S and hydrocarbon content, respectively, of the syngas entering and leaving the vessel. The mercury content and that of certain other heavy metals of these two syngas streams was determined using EPA Method 29 impinger trains. Although accurate, this is a relatively slow process, and only seven samples were taken during the run. The average data for these tests, presented in Table 11, demonstrate high collection efficiencies of the sorbent for mercury, arsenic, and selenium.
Table 11. Trace Metals Concentrations during Mercury Sorbent Testing.
Inlet Concentration, ppb
Outlet Concentration, ppb
Collection Efficiency
Mercury 2.90 0.05 98.3 Arsenic 1.47 0.03 98.1 Selenium 50.8 0.81 98.4

NATIONAL CARBON CAPTURE CENTER TOPICAL REPORT POWER SYSTEMS DEVELOPMENT FACILITY BUDGET PERIOD ONE
40
8.0 CONCLUSIONS AND LESSONS LEARNED
• A preliminary engineering and economic study of the Transport Oxy-Combustion process suggested that it may be a viable option for new, advanced power generation or for retrofit into existing pulverized coal plants. Further study was warranted by the positive results of the preliminary study.
• During syngas CO2 absorption with ammonia, the free ammonia is essentially consumed and the ammonia is present primarily as ammonium carbamate. Further CO2 is captured by the carbamate to produce bicarbonate, but as this is a slower reaction, capture efficiency falls. Results show that the extent of the decrease can be limited by reducing reactor temperature and increasing the inlet CO2 partial pressure.
• Co-capture of syngas COS, H2S, and CO2 is possible provided that free ammonia is present in the reactor.
• Completed as part of the syngas CO2 capture testing in the Syngas Conditioning Unit, chemical analysis of ammonia solution that had undergone regeneration at around 500 psig showed the presence of both sulfides and sulfate.
• Water-gas shift tests conducted in the Syngas Conditioning Unit showed that acceptable CO conversions can be achieved at relatively low steam feed rates, which could provide significant capital and operating cost savings compared to high steam feed rate operation.
• The initial commissioning tests of the Dispersed Bubble Reactor proved the fundamental design concept of the inherent capacity of the gas stream (in a circulating continuous phase environment) to produce a dispersed bubble flow regime leading to a large interface area for gas-liquid contact. Further testing is needed to confirm that the gas-liquid contact will achieve sufficient mass transfer.
• Several quality control measures were identified to maximize the accuracy of CO2 capture testing. These include measuring gas flow rates with annubars and with pitot tubes to verify accuracy; using titration to determine solvent CO2 content; and assessing the accuracy of laboratory analyses for solvent characterization by submitting standard samples and spiked samples for analysis.
• Modifications to the developmental Pressure Decoupled Advanced Coal feeder were incrementally made and tested both while feeding coal to the gasifier and while operating in the off-line test system. The modifications resulted in continually improved feed rate control, as demonstrated by more uniform gasifier temperatures.
• Feeder testing of biomass showed no indication of material packing tendency. Off-line testing completed using the original coal feed system confirmed that the biomass feed rate was less than that for coal for a given feeder speed due to the lower density of biomass. The biomass feed rate increased as the feeder speed increased as expected and was less than the relative coal feed rate at a given speed. The maximum biomass feed rate achievable was about 3,000 lb/hr. The conveying gas usage was comparable to coal and was sufficient for conveying the biomass, but the lock hopper nitrogen usage was roughly 40 percent higher than lignite on an energy basis.
• Laboratory agglomeration studies of biomass suggested that there should not be significant consolidation issues with the co-gasification of the wood pellet biomass with either PRB coal or Mississippi lignite.

NATIONAL CARBON CAPTURE CENTER TOPICAL REPORT POWER SYSTEMS DEVELOPMENT FACILITY BUDGET PERIOD ONE
41
• New level probes used in the PDAC feeder, which employ a type of vibrating rod, proved to be a highly reliable coal level indicator. The improved reliability compared to the previously used capacitance probes made possible the significant improvements to the lock vessel filling cycle.
• The R01 test run was the third run using high moisture Mississippi lignite, and as such, allowed optimization of gasifier operation with this coal. Testing showed that high carbon conversions can be achieved at a range of temperatures due to the extremely high reactivity of the fuel and that the gasifier parameters are easily controlled with this coal.
• Operation of the particulate control device with the Porvair sintered fiber elements yielded excellent collection efficiency (>99.999 percent), and further testing will be conducted to assess the corrosion resistance of these elements.
• During the NETL fuel cell testing in R02, initial power densities ranged from 95 to 255 mW/cm2 and deteriorated slightly over the course of the run, which was encouraging as only minimal gas treatment was employed. The power densities achieved were also encouraging given the modest heating value of the syngas.
• Testing of Media and Process Technology’s Carbon Molecular Sieve in R01 demonstrated that the membrane remained stable, and the permeate contained over 90 percent hydrogen. The syngas sulfur and other contaminants did not appear to affect the membrane performance.
• The Johnson Matthey high-temperature, palladium-based, mercury sorbent showed high collection efficiencies for mercury, arsenic, and selenium during R01 testing.