poverty among children - congressional budget office · the rate of poverty among children has...
TRANSCRIPT

POVERTY AMONG CHILDREN
Congressional Budget Office
December 3, 1984
This analysis was requested by the Senate Subcommittee on Education, Arts, and Humanities. Daniel Koretz and Marc Ventresca of the Human Resources and Community Development Division prepared the analysis under the supervision of Nancy M. Gordon and Martin Levine. Questions
. may be directed to Mr. Koretz at 226-2672.

SUMMARY
Poverty is markedly more common among children than among either
elderly or non-elderly adults. Poverty is particularly common among both
pre-school and school-age children. In 1983:
o 25 percent of pre-school children;
o 21 percent of school-age children;
o Ilf percent of the elderly; and
o 12 percent of non-elderly adults
lived in families with incomes below the poverty line ($10,178 for a family
of four; Summary Tables 1 and 2). Moreover, among non-elderly adults,
those with dependent children under age 18 currently have a substantially
higher poverty rate than do others. Children also constitute the largest
group of the poor. In 1983, nearly Ilf million children lived in
poverty--about lfO percent of the poor population.
Child poverty is much more widespread among ethnic minorities, in
female-headed households, and in central cities. In the school-age popula-
tion (ages 6 through 17), the poverty rate in 1983 was:
o lfO percent among ethnic minorities, but Ilf percent among nonminority children;
o 50 percent in female-headed households, but 12 percent in malepresent households; and
2

The rate of poverty among children has shown large fluctuations in
recent decades, and the characteristics of the population of poor children
has changed markedly. This report assesses trends in poverty among
children over the past 25 years, focusing particularly on school-age children
(ages 6 through 17). The relationships of childhood poverty with ethnicity,
family structure, and economic cycles are analyzed. Three aspects of
childhood poverty are explored: the number of children in poverty, the
poverty rate (that is, the proportion of a given group that is living in
poverty), and the composition of the population of poor children.Y
Following a brief summary, the first section of this report describes
the current characteristics of poverty among children. A second section
assesses long-term trends in child poverty, from 1959 to the present,
considering children of all ages. The final section provides a more detailed
view of trends since 1969, with a particular focus on the school-age
population.
J. All three are needed to obtain a reasonably complete view of the problem. The number of children in poverty is a direct measure of the problem's severity, but it fails to take into account the changing size of the school-age population. The poverty rate is an indication of the severity of poverty that takes the changing number of children into account. It does not clarify, however, the extent to which the population of poor children consists of members of different groups. (For example, the poverty rate among school-age black children indicates that fully 45 percent of that group lived in poverty in 1983. Blacks constituted a smaller proportion of all schoolage children in poverty, however--about 32 percent--because black children overall are fewer in number than whites.)

SUMMARY TABLE I. POVERTY AMONG CHILDREN AND ADULTS, 1983.
Ch ildren Pre-School a/ School-Age b/
Non-Elderly Adults c/ Ch i Idren in Household No Children in Household
Elderly Adults d/
Total
a/ Ages 0 through 5 b/ Ages 6 through 17 c/ Ages 19 through 64 d/ Ages 65 and above
Persons in
Poverty (Thousands)
13,807 5,302 8,505
17,749 10,347 7,402
3,711
35,266
Poverty Rate
(Percent)
22.2 25.0 20.8
12.4 15. 1 9.9
14. 1
15.2
Percent of all
Poor
39.2 15.0 24. 1
50.3 29.3 21.0
10.5
100.0
NOTE: Components may not sum to totals because of rounding.
SOURCE: CBO Tabulations of the March CPS, and Bureau of the Census, Technical Paper 52, 1983.

SUMMAR Y TABLE 2. POVERTY THRESHOLDS IN 1983, BY FAMIL Y SIZE
Number of Persons
One
Two
Three
Four
Five
Six
Seven
Eight
Threshold (in dollars)
5,061
6,483
7,938
10, 178
12,049
13,630
15,500
17,170
Nine or More 20,310
NOTE: These thresholds are averages for each family size. Among families of a given size, the threshold varies somewhat depending on the age of family members.
These threshold amounts--the Orshansky index--reflect pre-tax cash income. Thus, cash benefits such as Aid to Families with Dependent Children are included in family income, while inkind benefits such as Medicaid and Food Stamps are excluded.
SOURCE: Bureau of the Census, Money Income and Poverty Status of Families and Persons in the United States: 1983, Appendix A, Current Population Reports, Series P-60, No. 145.

o 30 percent in central cities, but 13 percent in non-central portions of metropolitan areas.
During the decade before 1969, child poverty fell consistently and
sharply. The poverty rate among children of all ages dropped from
approximately 26 to Ilj. percent, and the number of children in poverty
declined by about 6.5 million--despite a 9 percent growth in the child
population. The decline in poverty was striking among both female-headed
and male-present households.
From 1969 to 1979, poverty among children increased, albeit errat-
ically and only slightly. The poverty rate fluctuated with economic cycles,
but over the course of the decade, it rose about two percentage points. This
increase was not present, however, in either female-headed or male-present
households taken alone--indicating that the increase can be attributed to
the steady growth in the proportion of children living in female-headed
households.
In contrast, child poverty rose sharply from 1979 to 1982 and remained
at roughly the same level in 1983. From 1979 to 1983, the number of
children in poverty grew by 3.7 million, and the poverty rate rose from 16 to
22 percent--its highest level in 21 years. This rapid increase accounts for
fully three-fourths of the total increase in the child poverty rate since 1969.
Moreover, virtually all of the increase in the number of poor children since
3

1969 occurred after 1979; during the decade before 1979, the slight rise in
the child poverty rate was offset by the declining size of the child
population.
The rise in poverty since 1979 was sizable throughout the child
population. It occurred among children in both male-present and female
headed households; among both school-age children and pre-schoolers;
among non-minority children as well as blacks, Hispanics, and other minor
ities; and in non-metropolitan areas and non-central parts of metropolltan
areas as well as central cities.
The increase in child poverty after 1979 cannot be attributed to the
relatively small shifts in household composition that occurred during that
brief period. Rather, it is llkely a result of the severe back-to-back
recessions of 1980 and 1981-82, the rapid inflation of 1979-80, and reduc
tions in income-maintenance programs.
Although the child poverty rate did not decline in 1983, it is likely to
drop as the current economic recovery progresses. The extent to which the
rate will decline remains unclear, but a return to the pre-recession levels of
1979 seems unlikely. If the recovery continues long enough and is
sufficiently strong, however, it could push poverty rates down to their 1979
levels or below.
4

CHILD POVERTY: THE CURRENT SITUA nON
Poverty is substantially more common among children than in the
population at large. Moreover, contrary to a common view, the problem of
atypically high poverty rates among children is not limited to pre-school
ages, but is found among school-age children as well. In 1983, over one-fifth
(about 21 percent) of the school-age population lived in poverty--compared
to 12 percent of adults. The poverty rate among pre-school children was
higher yet--roughly 25 percent.
Children also are the largest group of poor persons, and poor children
and their parents make up the great majority of the poor population
(Table 1).11 In 1983, nearly 14 million of the total 3'5 million persons in
poverty (nearly 40 percent) were children under 18. More than 10 million
additional poor persons (nearly 30 percent of the total) were adults with
dependent children in their households.
2. This and subsequent tables are appended at the end of the text.

Poverty and E thnicity
Poverty in the school-age population is far more common in minority
groups than among non-minority children.}/ Fully forty-five percent of
black school-age children and 36 percent of Hispanics lived in poverty in
1983. Taken together, minority school-age children had a poverty rate of 40
percent--nearly threefold the 14 percent poverty rate among non-minority
school-age children.
Numerically, minority children predominate among the school-age
poor, but less so than their greatly higher poverty rates would suggest.
Their higher rate of poverty is partly offset by the fact that non~minority
children overall are far more numerous. In 1983, about 4.4 million school
age minority children lived in poverty, constituting about 52 percent of the'
total school-age poor population. (Of these, 2.7 million were black, and 1.3
million were Hispanic.) The Ii.l million poor non-minority school-age
children composed the remaining 48 percent of the poor.
3. Ethnic groups are defined as follows in this paper:
o "Black" refers to all non-Hispanic blacks;
o "Hispanic" includes all Hispanics, including the small proportion who are black;
o "Minority" includes blacks, Hispanics, and other minority groups, including Asians and American Indians.
o "Non-minority" includes all other children.
6

Poverty and Household Composition.!!./
Poverty is far more common among children in female-headed
households than among those in male-present (mostly two-parent)
households.21 This difference is found among both pre-school and school-
age children but tends to be slightly greater among preschoolers. In 1983,
the poverty rate among school-age children in female-headed households
was 50 percent--fully fourfold the poverty rate in male-present households
(12 percent). Among pre-school children, the poverty rate was about 68
percent in female-headed households--roughly four-and-a-haJf times the
rate in male-present households (15 percent).
4. Poverty rates are slightly underestimated in all sections of this report. that discuss household composition, for two reasons. Since 1979, children living in unrelated subfamilies have been excluded from Census tabulations of children in different household types. In addition, those tabulations for all years exclude older unrelated children (ages 15 or older since 1979, 14 or older before that). Since both of these groups are small in number but have substantially higher poverty rates than do other children, the result is a slight underestimate of the child poverty rate. In 1983, the underestimate was about 0.6 percentage points in the school-age population. Before 1979, the underestimate was probably only one-fourth as great.
Sections of this report that discuss long-term trends--that is, trends before 1967 --also have these limitations.
All sections of the report exclude unrelated children under age 15 because of a lack of reliable income data for them.
5. In this report, male-headed single-parent households and two-parent households are grouped together and labelled "male-present." The term "female-headed" refers only to households that are also singleparent. Male-headed single-parent households are not analyzed separately because they are few in number, and obtaining reliable estimates of their characteristics is accordingly difficult.
7

As a result of their higher rate of poverty, children from female
headed households compose a disproportionately large share of all poor
children. Children from female-headed households constitute only a fifth of
the sChool-age population but about half of the poor in that age group.
Poverty and Community Type
Poverty in the school-age population differs among three types of
communities: central cities within Standard Metropolitan Statistical Areas
(SMSAs); non-central areas within SMSAs (including suburbs); and non
metropolitan areas. In the school-age population, poverty rates are highest
in central cities, somewhat lower in non-metropolitan areas, and far lower
in non-central areas of SMSAs. "In 1983, the school-age poverty rate in
central cities was approximately 30 percent, compared to 23 percent in non
metropolitan areas and 12 percent in non-central portions of SMSAs.
The composition of the population of poor children with respect to
community types, however, is somewhat different than these poverty rates
might suggest, because of the different numbers of children in the three
types of communities. In the school-age population, the proportion of the
poor living in central cities and in non-metropolitan areas is roughly the
same--roughly 38 percent each. The remaining fourth of SChool-age poor
children live in non-central parts of metropolitan areas.
8

GENERAL TRENDS: 1959 TO THE PRESENT
Over the past 25 years, trends in the rate of poverty among all
children through age 17 fall into two distinct periods: 1959 to 1969, and 1969
to the present.§!
Declining Poverty: The Period from 1959 to 1969
From 1959 to 1969, the poverty rate among children fell consistently
and sharply (see Figure 1). More than a fourth of all children lived in
poverty in 1959, dropping to roughly 14 percent a decade later. The number
of poor children dropped substantially as well, despite growth of the child
population during those years. In 1959, roughly 16.4 million children lived in
poverty; by 1969, the number had fallen to under 19 million, despite a 9
percent increase in the total number of children.ZI
6. The data used here do not assess these long-term trends separately for school-age and preschool children.
As noted earlier, the poverty rate is slightly underestimated for the years 1979-1983 in this discussion of long-term trends. The Census data used in this section excludes children in unrelated subfamilies for those years, and such children have a higher rate of poverty than do children in other families.
7. Because of a discontinuity in published Census data, all poverty rates and counts before 1966 have been adjusted to provide greater consistency over time and therefore vary somewhat from published sources. The adjustment lowered the poverty rate among all children by 1.0 to 1.3 percentage points and the total count of poor children by 760,000 to 850,000, depending on the year.
9

FIGURE 1.
POVERTY RATE AMONG CHILDREN, AGES 0-17
26
24- ~
" 22
20
~, . r
18
16 I-z 14-w u n::: 12 w 0...
10
8
6
4-
2
0
59
~ / , A /
"'~= ~ 1:1 0
I I I I I I I I I I I I I I I I I I I I I I I
61 6.3 65 67 69 71
YEAR
7.3 75 77 79 81
NOTE: Rates slightly underestim~ted because of.exclusion of older unrelated children and, since 1979, unrelated subfamilies. See text.
Rates before 1966 adjusted downward for consistency with later years. See text.
8.3

The rapid decline in childhood poverty during this period has not been
fully explained, in part because the data are much more limited for that
period than for subsequent years.'§.! Nonetheless, several factors may have
contributed:
o Good performance of the economy may have played a role; unemployment declined during most of the period (see Figure 2), and wages generally grew faster than prices.21 (In contrast, since 1969, unemployment, despite cyclical fluctuations, has increased, and inflation has outpaced wage growth in many years.)
o The economic well-being of the farm population improved dramatically between 1959 and 1969; the poverty rate in the farm population (among all ages) dropped from 43 to 18 percent • .!.QI The farm population also shrank dramatically during that period, declining from 16.6 million (9.4 percent of the nation's popUlation) to 10.3 million (5.1 percent of the population).lY
o Aid for Families With Dependent Children (AFDC) grew rapidly during the period and may have pulled some children out of poverty. The number of children receiving AFDC benefits more than doubled (to nearly 5 million) between 1960 and 1969, and real benefits per recipient rose by nearly 30 percent. (In <;ontrast, real benefits per recipient fell between 1969 and 1981.)111
8. For example, published data on poverty rates among children for that period do not distinguish between household types, ethnic groups, or age groups (such as school-age versus preschool).
9. Average real weekly wages of production or non-supervisory, nonagricultural workers in the private sector grew 16 percent during the period. Economic Report of the President, February, 1984, Table B-39.
10. Consumer Income: Characteristics of the Population Below the Poverty Level: 1975. Current Population Reports, P-60 No. 106, Table 4. Washington, Bureau of the Census, June, 1977.
11. Statistical Abstract of the United States, 1982-83, Table 1134. Washington, Bureau of the Census, December, 1982.
12. Social Security Bulletin: Annual Statistical Supplement, 1982, Table 192, p. 252.
10

FIGURE 2.
I~ 11 I~
I~ 10 I%:',
~,/' i
I;:;~ ,~
9 ~ ~ v.; 8
7
6
5
3
~i 2
~ ~ 1
/::: 0 %
1960
UNEMPLOYMENT RATES (Percents}, 1960.·1984, AND PERIODS OF RECESSION
" --v.> ~'
~ ~ ~ ~ ~ .
~ ~ ~
1964 1968 1972 1976 1980
Year
, I i
:;;..-:: i
I I, /,.....-:
~i (:a ~ ~ ,;;,{
r~j 0, . ~ ://1 .~ ~!
0 % 19S.
NOTE: Periods of recession indicated by cross-hatched bars.

o While the proportion of children living in female-headed households rose during the period-tending to push the poverty rate up-it rose at a substantially slower rate than in the years after 1969 (Figure 3).
o Immigration was at a lower rate than presently.
Stable and Increasing Poverty: The Years Since 1969
In contrast to the preceding decade, the. period since 1969 has been
marked by an erratic rise in the poverty rate among children--an increase
that is masked in part by short periods in which the poverty rate remained
stable or even declined somewhat (Figure I and Table 2). That is, cyclical
fluctuations are superimposed on an underlying, non-cyclical growth in the
poverty rate. The resulting increase was slight and irregular until 1979. In
contrast, the poverty rate rose rapidly from 1979 to 1982 and has not
declined since. Thus, over the entire 1969-1983 period, the increase in child·
poverty, while erratic, was large.
From 1969 to 1983, the poverty rate among all children through age 17
grew from 14 percent to roughly 22 percent--its highest level in 21 years.
The number of children in poverty also grew by 3.8 million, to nearly 14
million in 1983. This occurred despite a 12 percent decline in the total
number of children during those years.
The poverty rate among children and parents has climbed relative to
the rates in other groups since 1969 (Figure 4), and children have replaced
I I

FIGURE 3.
CHILDREN IN FEMALE-HEAD HOUSEHOLDS, AS PERCENT OF .ALL CHILDREN. AGES 0-17
20 r::l --I
19 /" w rL d
18
17
16
15
14
13
1 2 I-
=---~ ~
/ ~
~ /
..d Z 1 1 w ~ u 10 0::: W 9 D-
8
7
6 5
4
3 2
1
0 I I I I I I I I I I I I I I I I I I I I I I I
59 61 63 65 67 69 71 73 75 77 79 81 83
YEAR

FIGURE 4.
30
28
26
24
22
20
18 I-z w 16 u 0:: 14 w 0..
12
10
8
6
4
2
o
o Elderly Adults
POVERTY RATES FOR INDIVIDUALS
~
" ~
l------ ----k
67 69
(
+ Children, 0-17
BY AGE AND PRESENCE OF CHILDREN
•
~ ~ ~ /-'"-
71
: ------/
~ -n ~
-v
73
~
A
75
YEAR o Non-Elderly Adults,
No Children Present
~
~
J!o.
77
•
i
I
i
/ •
/ ../
-r
~ -- po ~
~
~ L
~
~
I I I
79 81
A Non-Elderly Adults, Children Pres"n~
83

the elderly as the group within which poverty is most widespread. In 1969,
the poverty rate was far higher among elderly individuals (about 25 percent)
than among non-elderly adults (about 9 percent), with children falling in
between (14 percent). The poverty rate among non-elderly adults with
dependent children in their households was comparable to that among other
non-elderly adults. By 1983, the poverty rate was highest among children
(22 percent), by a wide margin. Poverty among the elderly was substantially
less common--a rate of 14 percent. Among non-elderly adults, poverty
rates had diverged; the rate among those without children in their
households had climbed only slightly, while among those with children, it had
nearly doubled--to about 15 percentJ1.1
The most dramatic increase in poverty during this period occured
between 1979 and 1983. The rise in the child poverty rate during those four
years--from 16 to about 22 percent--accounts for fully three-fourths of the
increase since 1969. Indeed, virtually all of the increase in the number of
poor children occurred during those four years.1!t1
13. Although the poverty rate was slightly higher in 1983 among nonelderly adults with children in their households than among the elderly, this difference was small and may be a temporary result of the recent recession.
14. Between 1969 and 1979, the declining size of the child population roughly offset the slight growth in the poverty rate.
12

Children--and their parents--also were affected more seriously than
others by this four-year upturn in poverty. Fully three-fourths of the
growth in the poverty population between 1979 and 1983 occurred among
children and adults with dependent children in their households (Table 3).
Children accounted for only three percent of total population growth but for
37 percent of the increase in the poverty count during those four years.
Adults with dependent children in the household also constituted 37 percent
of the additional poor individuals, although they accounted for only about 7
percent of total population growth. Conversely, the groups that accounted
for 90 percent of total population growth--elderly adults and non-elderly
adults without dependent children in the household--constituted only the
remaining fourth of the additional poor.
DET AILED TRENDS
The following sections present more detail about the trends since 1969
and about other changes that may have influenced poverty rates. They
consider the relationships of child poverty to economic conditions, the
ethnic composition of the school-age population, and household composition.
The discussion focuses primarily on school-age children (ages 6 through 17),
except where explicitly noted otherwise.12!
15. The discussions in these sections extend back to different starting points (generally, between 1967 and 1971), depending on the availability of appropriate data.
13

Poverty and Economic Conditions
The cyclical fluctuations in childhood poverty since 1969 appear to be
closely associated with economic conditions. On the other hand, the
relationship between economic conditions and the underlying, non-cyclical
increase in child poverty is less clear.
Cyclical fluctuations in poverty. All of the upturns in poverty in the
school-age population since 1969 have paralleled or shortly followed
economic recessions (Figures 2 and 5, and Table 4). This association has
become stronger and clearer during each of the recessions of the period.
While the 1970 recession had a relatively minor effect on the poverty rate in
the school-age population, the impact of the 1973-75 and 1980-82 recessions
was striking.l£1 Between 1973 and 1975, the poverty rate rose by more than
3 percentage points, and between 1979 and 1982, it increased by over 5
percentage points--an increase of more than a third.
Although concurrent with recessions, however, the most recent up-
turns in child poverty may have also reflected concomitant factors other
than recession itself. Contributing to an unknown degree to the most recent
16. The period between 1980 and 1982 encompassed two recessions: January 1980 to July 1980, and July 1981 to November 1982. Since this study is based on annual, calendar-year data, however, the two can not be distinguished in the numbers that are presented. Therefore, for the sake of simplicity, the two are jointly referred to as the "1980-82 recession."
14
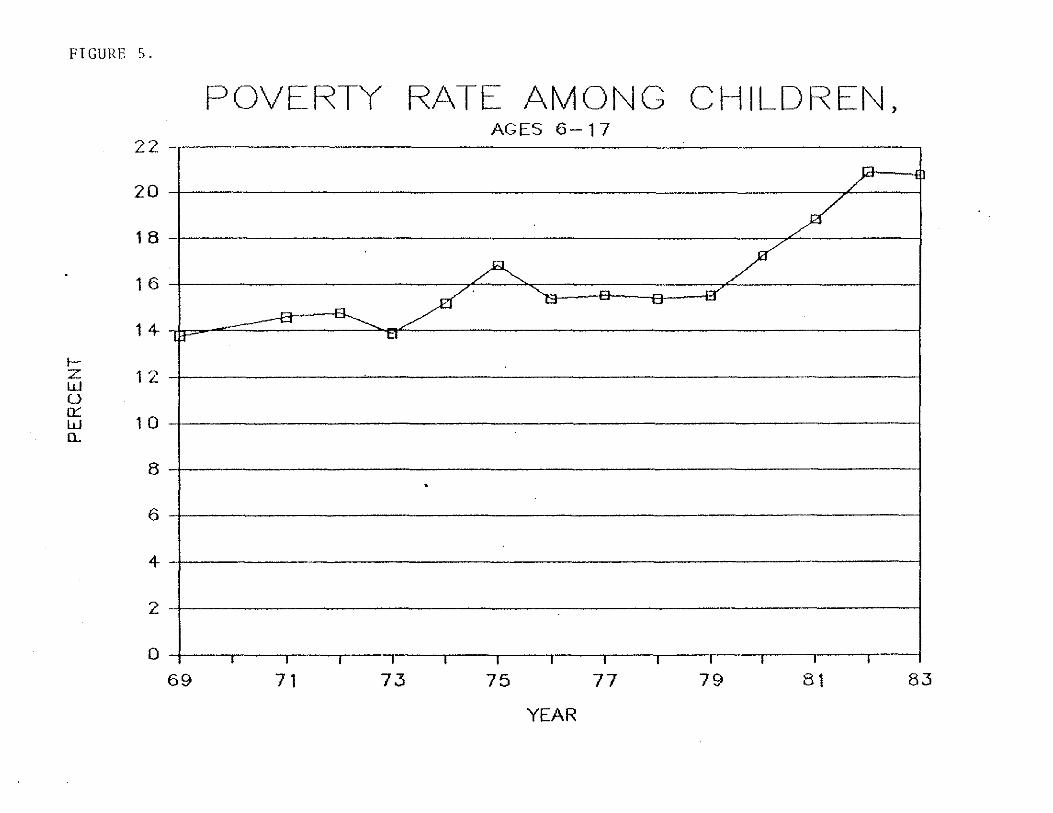
FIGURE 5.
I-z w u a::: w Q..
22
20
18
.
16
14 IT
1 2
10
8
6
4
2
o 69
POVERTY RATE AMONG CHILOREI'-J, AGES 6-17
r::I-
/ ~
/ ~ /
/' " ~ ..a"
-= ~ ....
........... 1:1
. !
i
I
I I
71 73 75 77 79 51 53
YEAR

upturn were changes in income-security programs--such as AFDC--imple-
mented during that period. In addition, the high rate of inflation in 1974,
1979, and 1980 may have accelerated the decline in real AFDC benefits that
has characterized the period since 1970, and this in turn may have pushed
the child poverty rate further upward during both of the last two economic
downturns.Q/
The number of school-age children living in poverty increased by more
than one million in each of the two most recent recessions. The recession of
the mid-70s added roughly 1.3 million sChool-age children to the poverty
count. The increase since 1979 has been greater-a rise of more than 1.8
million, to over 8.5 million. (This increase would likely have been greater
were it not for a concomitant small decline in the size of the total school-
age population.)
While the association between recessions and the increasing poverty
rate among school-age children is clear, the corresponding link between
economic recovery and declining poverty is less so. The small increase in
poverty among school-age children in 1970-73 was nearly fully eliminated in
1973, while only about half of the larger 1974-75 increase was overcome in
17. With regard to the latter factor, see Committee on Ways and Means, Background Material and Data on Programs Within the Jurisdiction of the Committee on Ways and Means, WMCP: 98-22, February 21, 1984, pp. 306-307.
15

the following recovery (Figure 5). (The effects of the current recovery
largely remain to be seen, for whlJe unemployment began declining in
January, 1983, the annual average unemployment rate remained as high in
1983 as in 1982. Thus, much of the impact of declining unemployment on
child poverty will become apparent only in 1984 and 1985.)
While the extent to which school-age poverty rate will decline as a
result of the current recovery is unclear, several factors suggest that it is
unlikely to return to its pre-recession (J 979) low. These same factors may
help explain the failure of the poverty rate to return fully to its pre
recession level following the recession of 1974-75. If unemployment follows
the pattern seen since' 1969, it will stablJize above its 1979 low, impeding
the drop in chlld poverty. Moreover, as noted below, the growing proportion
of chlldren in female-headed households is contributing to a gradual upward
drift in the poverty rate that is largely independent of cyclical changes.
Future budget constraints also make large-scale restoration of income
security benefits unlikely over the next several years. On the other hand, if
the current recovery is strong enough and sufficiently long, it may offset
these factors-for example, by lowering unemployment to a point below the
1979 levels, or by increasing the real incomes of workers with low-paying
jobs--and reduce school-age poverty to or even below its pre-recession level.
16

The underlying increase in poverty. Although the erratic, slight
increase in school-age poverty since 1969 parallels the pattern and timing of
increasing unemployment (compare Figures 2 and 5), rising unemploy
ment--and related economic changes--probably played little or no role in
the underlying, non-cyclical increase in poverty until 1979. As explained in
more detail below, the increase in the poverty rate from 1969 to 1979 was
most likely a result of the rising proportion of school-age children living in
female-headed households.
The bulk of the rapid rise in poverty since 1979, however--and,
accordingly, most of the total increase in child poverty since 1969--cannot
be attributed to changing household composition. That increase may in
substantial part reflect the recent back-to-back recessions and the high
inflation of 1979 and 1980. Thus, changes in economic conditions may have
contributed in large measure to the total increase in child poverty from
1969 to the present.
Poverty and E thnicity
While poverty in the school-age population is far more common among
minorities, recent trends have been fairly similar among non-minority,
Hispanic, and black children (see Figure 6 and Table 5). The poverty rate
among all three groups of children increased during the 1973-75 recession,
17

FIGURE 6.
IZ W o 0:: W u..
POVERTY RATES AMONG CHILOREI~) 50
AGES 6-17. BY ETHNICITY
A
40V ~ ~ ~ ~ "IF" ~ ~~ :;;>
30 '- <r >, /
'" V """" 7
20 ;I------------------------------------------------------~
1 0 ±== --+---.. ---==. ::::::::+=="" ....... I I""'"
O+I--_.--.---,_~,__.--_.--._--,_--,_~--II~ 71 72 73 74 75 76 77 78 79 80 81 82 83
YEAR -l- No n-Mi nority <> Minority 4 Block x Hisponic

dropped somwehat in the ensuing recovery, remained fairly stable until
1979, and then increased sharply after 1979.1.2/
Similarly, the ethnic composition of the school-age poor population has
changed only moderately since 1971 (Figure 7).11/ Non-minority children
have constituted 45 to 48 percent of all poor school-age children in every
year since since then. While minority children have accordingly remained a
bit over half of the school-age poor, the ethnic composition of the minority-
poor group has been changing. Black school-age children constitute a slowly
declining proportion of the poor, dropping from about 37 percent in 1971 to
about 32 percent in 1983. Hispanics are a correspondingly slowly growing
proportion, constituting about 16 percent of the school-age poor in 1983,
18. The recession-related upturns in poverty appear less steep among non-minority children in Figure 6, but that is an artifact of the much lower baseline rate of poverty in that group. In general, any ranking of the severity of the trends in the various ethnic groups is ambiguous, for several alternative rankings can be used. For example, in proportional terms, the most recent increase in the poverty rate was actually greater among non-minority children than among black children. Between 1979 and 1983, the poverty rate among non-minority children increased by 44 percent, while among blacks, it increased by 14 percent. Similarly, the number of poor non-minority children increased by a far greater amount (J million) than the number of poor black children (about 200 thousand)--in large part a reflection of the much larger number of non-minority children overall. On the other hand, the simple increase in the poverty rate was larger among black School-age children than among non-minority school-age children--a 5.4 percentage point increase among blacks, compared to a 4.2 percentage point growth among non-minority children.
19. Data separating Hispanic children are unavailable for earlier years.
18

FIGURE 7.
50
40
30
20
10
o
ETHi'JIC COMPOSITION OF THE POOR
~ Q.
0-~
/' •
-.y
I I I I
71 73 75
o Non-Minority
AGES 6-17
I
~
I
77
YEAR
~
....
I
+ Black
I
79
.r:L ~
. ,
A
I I I
81 83
<> Hispanic

compared to 1:3 percent in 1971. Two factors appear to contribute to this
shift: the growth of the Hispanic share of the school-age population as a
whole, and the proportionately greater recent upturn of poverty rates among
Hispanic and non-minority children, relative to black children.£Q1
Because child poverty rates recently have been largely paraJJel in
different ethnic groups, the proportion of school-age children who are both
poor and minority has risen as the minority share of the entire school-age
population has grown (see Figure 8). The proportion of school-age children
who are both poor and minority has increased in aJJ but three of the past
dozen years, but the bulk of the increase occurred with the sharp rise in
poverty between 1979 and 1982. In 1971, 7.5 percent of the school-age
popUlation was both poor and minority, and an additional 7 percent com-·
prised poor non-minority children. By 1983, nearly 11 percent were both
poor and minority, while an additional 10 percent comprised poor non-
minority students.
20. In addition, the growth in the Hispanic share of the poverty population may be exaggerated to some degree by changes in the accuracy in Census counts of Hispanics.
19
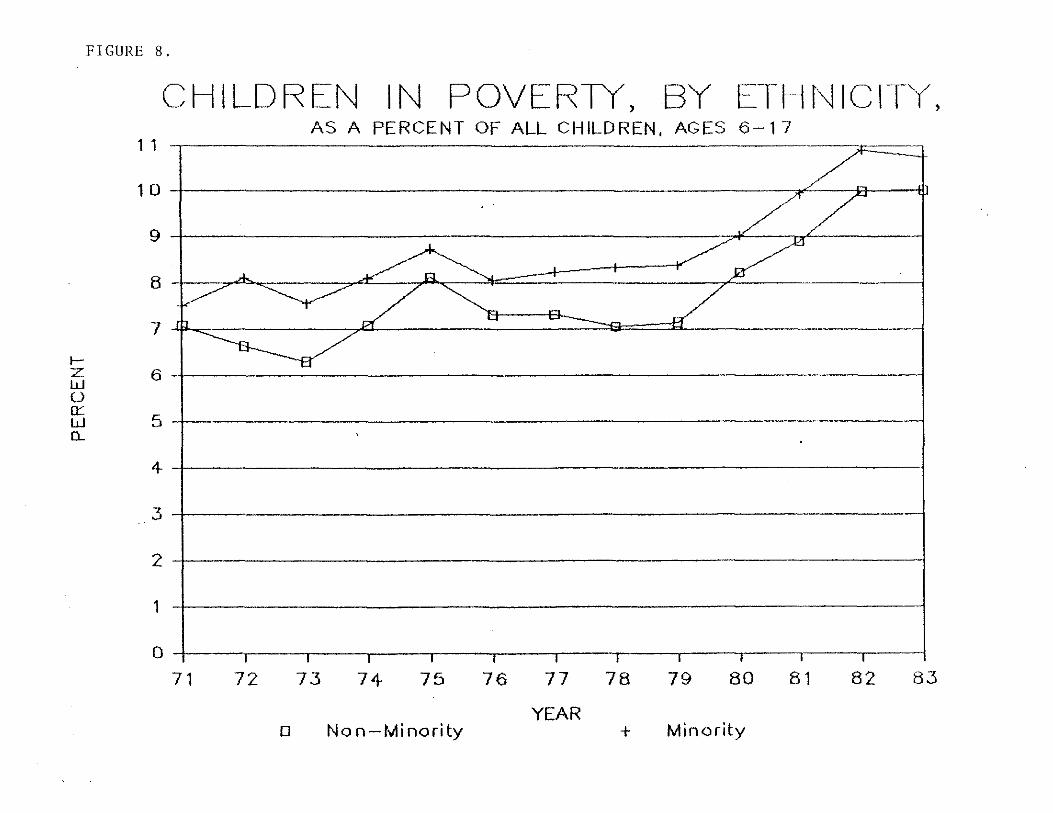
FIGURE 8.
CHILDREI~ IN POVER1'Y, BY ETHNICIT'f, AS A PERCENT OF ALL CHILDREN, AGES 6-1-;
1 1
10
9
8
7
I-Z 6 w
/ ///:~
A.. ~~ ~/ ~~ ~/~ / ~"i:f
U 0::
5 w 0...
4
3
,
2
I
1 •
o , ,
71 72 73 74 75 76 77 78 79 80 81 82 83
YEAR o Non-Minority + Minority

Poverty and Household Composition2l/
As noted earlier, poverty has been far more common among children in
female-headed households for many years. The size of the difference has
changed over time, however, as both long-term trends and short-term
fluctuations in poverty have affected male-present and female-headed
households differently.
1959-1969: children of all ages.22/ Childhood poverty declined
rapidly between 1959 and 1969 in both female-headed and male-present
households. (Table 2 and Figure 9). In proportional terms, however, the
drop was far greater among male-present households. During that decade,
the child poverty rate decreased by over a fifth (from about 70 to 54
percent) among female-headed households but by over -half (from about 21 to
9 percent) among male-present households.
As a result, poor children from male-present households declined
rapidly as a proportion of all children in the decade following 1959 (Figure
10). In 1959, such children constituted almost a fifth of the child
population. Ten years later, they composed about 8 percent of the total. At
21. As explained earlier, the data in this section underestimate the poverty rate slightly for the years 1979 through 1983 because of the exclusion of children in unrelated subfamilies.
22. Because of limitations of the data before 1967, this section is confined to a discussion of all children, ages birth through 17.
20

FIGURE 9.
POVERTY RATES, BY HOUSEHOLD TYPE, CHILDREN AGES 0-17
70
60
50
I- 40 z w u u:: ~ 30
20 ~~ ~& :;aA=1
1 0 I -~""';;" e e~ e :;:::?¥"
o 59 61 63 65 67 69
o All + Female Head
71
YEAR
73
<i
75 77 79
Male Present
81
NOTE: Rates slightly underestimated because of exclusion of older unrelated children and, since 1979, unrelated subfamilies. See text.
Rates before 1966 adjusted downward for consistency with later years. See text.
83

FIGURE 10.
t-z w u a:: w Q..
POOR CHILDREN, BY HOUSEHOLD TYPE, AS PERCENT OF ALL CHILDREN AGES 0-17
20 19 18
17 16
~ .
~ ~
\ \. ~
15 14
13
12
1 1
"'" "\
\ \
\ \.
10 ~ /ri 9 8
7
6 .. 5
4-
3
2
1
0 I I
59 61
+
"'- -'- .. // ~ "" ~ ;f
V" .~-/~ .// /' Y ~ -eo- ~
I I I I I I I I I I I I I I I I I I I , I
63 65 67
Female-Headed
69 71
YEAR <>
73 75 77 79 81
Male-Present NOTE: Rates slightly underestimated because of exclusion of older unrelated children and, since
1979, unrelated subfamilies. See text.
Rates before 1966 adjusted downward for consistency with later years. See text.
I
I
83

the same time, poor children from female-headed households remained
roughly constant at 6 percent of the total child population. The growing
proportion of children living in female-headed households roughly offset
their more slowlY declining rate of poverty.
Recent trends: 1969 to the present. Since 1969, poverty rates among
children have changed less, moving up slightly and erratically until the rapid
rise between 1979 and 1982. The changes that have occurred, however, have
been different among school-age and pre-school children, and in male
present and female-headed households.
The school-age population. In this age group, poverty rates in both
male-present and female-headed households have shown cyclical swings that
parallel economic cycles (Figure jj and Table 4). This pattern did not occur
in the recession of 1970, but it was present in the recession of 1973-75 and
was striking in the 1980-82 recession.
The cyclical fluctuations of the past two recessions have been sizable
among both household types within the school-age population. Between 1979
and 1982, the simple increase in the poverty rate was larger among children
in female-headed households--7.4 percentage points, compared to 4.4 per
centage points among children in male-present households. In proportional
terms, however, both of the most recent two upturns have been larger
21
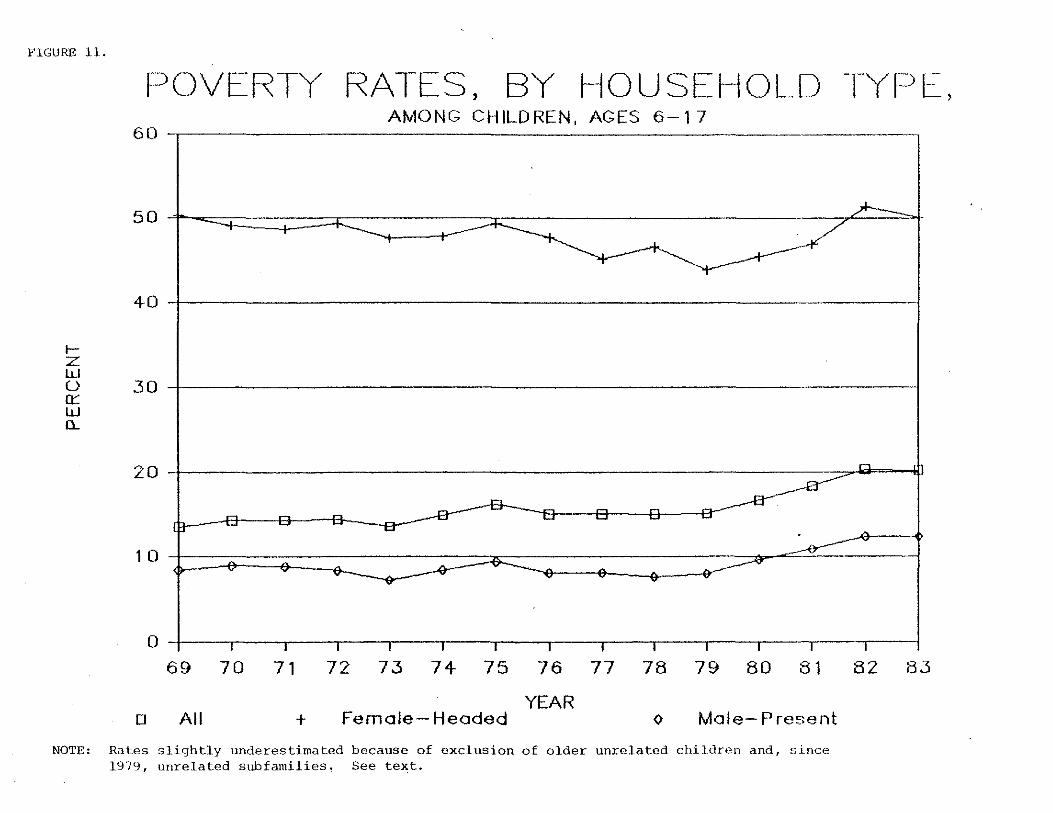
FIGURE 11.
POVERTY RATES, BY HOUSEHOLD T'(PE,
IZ W
60
50
40
u 30 a:: w 0...
20
10
o
o
i="
69
All
•
..,
I I
70 71
+
AMONG CHILDREN, AGES 6-17
,
-= -=
~
~
I I I I
72 73 74 75
Female-Headed
v
I
76
YEAR
"...
'-'
I
77
--+. ~ -.y
~-~
~ ""~~
I I I I
78 79 80 81
<> Male-Present
NOTE: Rates slightly underestimated because of exclusion of older unrelated children and, since 1979, unrelated subfamilies. See text.
~
~ -,
I
82 83

among male-present households. From 1979 to 1982, the poverty rate
increased by less than a fifth in female-headed households but by more than
half in male-present households. As a result, the poverty rate in female
headed households has ranged from 4 to nearly 7 times the rate in male
present households since 1969, with the smallest differentials occurring at
the peaks of recessions.
Despite these cyclical fluctuations, the underlying rise in poverty
rates that occurred in the school-age population as a whole did not occur in
either male-present or female-headed households before 1979. In male
present households, no under lying trend of any magnitude was apparent
during the decade from 1969 to 1979. In female-headed households, the
poverty rate among school-age children actually declined--albeit slightly
and inconsistently--during that period. The period after 1979, on the other
hand, may alter that pattern. If the recovery from the current high levels
of poverty in both male-present and female-headed households is sufficient
ly incomplete, then poverty rates in both household types may in the end
show a net increase over the entire period from 1969 on.
Poor children from female-headed households constitute a steadily
growing proportion of the total school-age population (Figure 12). This
results from both the growing prevalence of female-headed households and,
since 1979, their rapidly increasing poverty rate. In 1969, poor children
22

FIGURE 12.
POOR CHILDREN, BY HOUSEHOLD T"(PE, AS A PERCENT OF ALL CHILDREN, AGES 6-17
1 1 r:l..
10
9
8
7
f-Z 6 w
/
// .A
~~ /~ "" -=-~
~~ / ---- -?"to!. ~ V/ )..
+J ~ T
.
u a:::
5 w (L
4
3
2
1
0 I I I I I I I I I I I I I
69 70 71 72 73 74 75 76 77 78 79 80 81 82 83
YEAR 0 Female-Headed + Male- Present
NOTE: Rates slightly underestimated because of exclusion of older unrelated children and, since 1979, unrelated subfamilies. See text.

from female-headed households composed about 6 percent of the school-age
population--roughly the level of the previous 10 years. By 1982, they
constituted about 10.5 percent. In contrast, no clear trend has appeared
since 1969 in the share of the school-age population comprising poor
children from male-headed families. That share appears to increase
markedly during recessions but to decline similarly during recoveries. (The
sharp increase since 1979 may be an exception, if recovery from the current •
high poverty level in such households turns out to be incomplete.)
Pre-school children. In male-present households, the effects of
economic cycles have been similar among pre-school and school-age chil-
dren. In female-headed households, on the other hand, the pattern has been
markedly different in the two age groups.
Among children in male-present households, the cyclical increase in
poverty rates were proportionately very similar in both age groups during
both of the last two recessions. Between 1979 and 1983, the poverty rate
increased by 55 percent among school-age children in such households and by
60 percent among pre-schoolers (Tables 4 and 6, Figures II and 13). On the
other hand, the poverty rate was nearly twice as high among pre-schoolers
as among school-age children in male-present households in 1983 (24.6
versus 12.li percent), and the simple increase in the poverty rate since 1979
23

FIGURE 13.
POVERTY RATES AMONG PRE-SCHOOLERS MALE-PRESENT AND ALL HOUSEHOLDS
26
.---' 24-
22 ~ 20
18
16
.A.
~ -v
~ v
f-z 14-w u ~ 12 w Il..
10 ~.
-~- ~ ---.
8
6
4-
2
0 I I I I I
71 73 75
o Mole- Present
~ --
=
I
77
YEAR
/ /
-...-
~-------/
""l:::f~
I I I I
79 81
<> Totol NOTE: Rates slightly underestimated because of exclusion of unrelated subfamilies since
1979. See text.
L~ !
!
•
I
83

was correspondingly greater among pre-schoolers (6.7 versus 4.4 percentage
points).
Among children in female-headed households, on the other hand, the
pattern is entirely different in the two age groups. As noted above,
recessions increase poverty among school-age children in female-headed
households, albeit to a lesser extent than in male-present households.
Among pre-schoolers, however, the poverty rate in female-headed house
holds appeared entirely unaffected by recessions until 1979; the fluctuations
until then were small, out of synchrony with economic cycles and poverty
trends in other groups, and possibly random (Figure Iii). The sharp upturn in
poverty since 1979 affected pre-schoolers in female-headed households as
well as other children, but to a lesser degree. This increase, however, might
reflect other factors--such as legislated cuts in benefit programs and the
high rate of inflation in 1979 and 1980--rather than recession itself.
The effect of changing household composition on the poverty rate in
the school-age population. The growing proportion of children living in
female-headed households contributed substantially to the increase in the
sChool-age poverty rate since 1969. This particular change in household
composition probably accounts for:
24

FIGURE 14.
POVERTY RATES AMONG PRE-SCHOOLERS FEMALE-HEADED HOUSEHOLDS
70
I-- ..L -'T •
T T
" ,
60 T . i
• 50
t-- 40 z w . u u:: W Q.. 30
20
10
o I I I I I I I I I I I
71 73 75 77 79 81 83
YEAR NOTE: Rates slightly underestimated because of exclusion of unrelated subfamilies since 19'79.
See text.

o all of the sllght growth in the poverty rate from 1969 to 1979;
o virtually none of the rapid increase in poverty from 1979 to the present; and
o at most, about half of the total increase in poverty from 1969 to the present.
Moreover, while the following explanation focuses on the school-age popula-
tion, the effect of this shift in household composition on the poverty rate in
the entire population of children, ages birth through 17, has been nearly
identical~/
The impact of changing household composition can be seen dearly in
the decade from 1969 to 1979, for during that period the underlying increase
in poverty rates found in the school-age population as a whole did not occur
among either male-present or female-headed households. As noted earlier,
apart from cyclical fluctuations, the poverty rate among male-present
households showed no clear trend during that decade, but it was slightly
lower in 1979 than 10 years earlier. Among female-headed households,
poverty declined somewhat more during the decade. Nonetheless, during
that period, poverty in the school-age population as a whole edged up
23. Other changes in household composition might have also contributed to. the increasing poverty rate. For example, increases in the proportion of school-age children living in father-only and other households might have further increased the poverty rate, but given their small numbers, their impact would be slight.
25

slightly, rising from 13.5 percent in 1969 to 15.1 percent a decade later.
This increase can accordingly be attributed to the changing mix of male
present and female-headed households.
Since 1979, on the other hand, the role of changing household
composition has been less apparent, because poverty rates increased sharply
in both household types as well as in the school-age population as a whole.
Moreover, the change in the poverty rate during those years was rapid, while
the change in household composition was slight.
If nothing had changed other than household composition over the
entire period from 1969 to 1983, the increase in the school-age poverty rate
would have been just over half as large as it actually was. That is, if the
proportion of school-age children living in female-headed households had
increased, while the poverty rate in each type of household had remained
constant, the poverty rate in the sChool-age population would have grown
from 13.5 to perhaps 17 percent--as compared to the level of 20.2 percent
actually reached.
The historical pattern of the increase, however, suggests that this may
overstate the impact of the shift toward female-headed households. During
the decade between 1969 and 1979, the actual increase in school-age
poverty was only half as large as that which changing household composition
26

alone would have produced. In other words, other factors offset half of the
increase that the shift toward female-headed households would have caused.
Conversely, the rapid rise in school-age poverty since 1979--which accounts
for three-fourths of the total increase since 1969-was vastly larger than
the growing share of female-headed households would have predicted.
During that four years, school-age poverty increased by about 5 percentage
points, of which less than one-half percentage point can be attributed to this
change in household composition. Taken together, the proportion of the
1979-83 increase attributable to changing household composition and the
total 1969-79 increase constitute about 30 percent of the overall increase in
poverty among school-age children during the entire period from 1969 to
1983.
Poverty and Community Type
As noted earlier, poverty in the school-age population is most common
in central Cities, somewhat less common in non-metropolitan areas, and far
less common in non-central portions of SMSAs. This pattern, however, is a
relatively recent occurrence; before 1972, sChool-age poverty was most
common in non-metropolitan areas (Table 7 and Figure 15).
Between 1967 and 1979, trends were markedly (:jjfferent in the three
types of communities. In both central cities and non-central portions of
SMSAs, the poverty rate climbed consistently, increasing by 35 and 30
27

FIGURE 15.
POVERTY RATE BY CO~lMUr\jITY TYPE CHILDREN 6-17
32
30
28
26
24
r>
/ -.
~ /
22
20 I- 18 z w
16 u
/ -=- --EJ ~ /'
~ n. / A // ,
~ ~ /~ L ~ -a
I V
k -- ~ ,/ I ""
a::: w 14 0...
,.j.
1 2
10
8
/"
~ ~~T -'- .------Y
6 ..
4
2
0 I I I I I I I I I I I I I I I
67 69 71 73 75 77 79 81 83
YEAR o Cent.City + NonCentrol o NonMetro

percent, respectively (Table 7 and Figure 15). In contrast, the poverty rate
in non-metropolitan areas declined, slightly and erratically.
The steep increase in poverty since 1979, however, occurred to a
similar degree in all three community types. In proportional terms, the
increase was steepest in non-metropolitan areas, but only by a small margin.
Since 1972, the composition of the school-age poor population-with
respect to community types--has been quite stable (Figure 16). Children
from central cities and from non-metropolitan areas have each constituted
36 to IiO percent of the poor population in each year since then. (This
stability reflects the fact that the rising poverty rate in central cities was
roughly offset by a decline in the proportion of school-age children living in
those communities.) Children from non-central areas have composed the
remainder--roughly a fifth to a fourth of the school-age poor population.
This pattern is a change from the late 1960s, when children from non
metropolitan areas constituted the largest group of the poor, and children
from both central and non-central areas composed a substantially smaller
proportion of the poor than they do presently.
Poor minority children. Ii the focus is narrowed further to minority
poor children, recent trends have been radically different in central cities
than in the other types of communities.
28

FIGURE 16.
PEF<CEi"IT OF SCH.OOL-AGE POOR BY COMMUNITY TYPE
60
50 "-
40
~~
-~
IZ W u .30 0:::: W CL.
20
1 0
o 67
=-
I I
69
o Central
-----
I I
71
~ -=
• .....
I I I I I I
7.3 75 77
YEAR + Non-Central
A. ~
~ v ~
-'--. . ....
I I I I I
79 81
<> NonMetro
8.3

Since 1971--the first year for which comparable information was
available--poor minority children have constituted a larger share of the
school-age population in central cities than elsewhere, and a greater share
yet in large central cities (Figure 17 and Table 8).2~/ Moreover, the gap has
widened rapidly over the last 12 years. In 1971, the proportion of school-age
children who were both minority and poor ranged from 3 percent in non-
central portions of SMSAs to 17 percent in large central cities. In 1983, the
proportion in non-central areas had grown to only 5 percent, while the share
in large central cities had climbed to 28 percent. Currently, nearly a fourth
of the school-age population in central cities of aJl sizes comprises poor
minority children.
2~. The term "large central cities" refers to the central cities within the 3~ SMSAs that were the largest in the 1970 census. This group does not overlap entirely with the 34 largest central cities, because it is based on SMSA, rather than city, size. This is the only classification of large cities available on a year-to-year basis in the CPS, however.
29

FIGURE 17.
PERCENT BOTH POOR AND MINORITY 30
Ages 6-17, I:>y Community Type
28 ~
26
24-
22
0-
/ ./
20
18 +' c 16 10 u L-v 14-
Q..
12
10
~~
/ /---. ~ v- / .
A. .,/A-. __ /
/ ~ / ~
..-/ .,. "'tr
8
6
..ll. 11 - ---...:... rL - . --- • .'>L
4- ~ -->L. ,..
I" "- "
2
o I
71 73 75 77 79 81 83
Year ~ LargeCC A Oth.CC X NonCentr. v NonMetro
TABLE 1. POVERTY, BY AGE AND PRESENCE OF RELATED DEPENDENT CHILDREN UNDER AGE 18 IN THE HOUSEHOLD (1983)
GROUP
Ch Ildren Non-Elderly Adults Living With Children al
Non-Elderly Adults Living Without Children al
Elderly Adults bl
Total Poor Persons Persons
In Group In Group (Thousands)(Thousands)
62,140 13,807
68,610 10,347
74,571 7,402 26,291 3,711
Poverty Rate
In Group (Percent)
22.2
-15. 1
9.9 1 4 . 1
Group's Proportion
of Poor Population
(Percent)
39.2
29.3
21.0 10.5
-----------------------------------------------------------------------All Adults All adults without
Children cl
169,473
100,863
21 ,460
11,113
12.7 60.8
11.0 31.5 -----------------------------------------------------------------------TOTAL 231,613
al Age 18 or greater, but under age 65 bl Age 65 or greater
35,267 15.2
cl Excluded are all adults with related dependent children under 18 in the household
SOURCE: CBO Tabulations of March Current Population Surveys
100.0

TABLE 2. POVERTY RATES AMONG ALL CHILDREN UNDER 18 BY HOUSEHOLD TYPE, 1959-1983 a/
1959 1960 1961 1962 1963 1964 1965 1966 1967 ----------------------------------------------------------------------------Total 25.6
Fe.ale head 69.5 Male present 21.3
1968
25.2
65.5 21.1
1969
23.9
62. I 19.9
1970
23.5
67.4 18.9
1971
21.6 ·21.5
63.7 59.2 17.0 17.2
1972 1973
19.6
61.2 14.9
1974
17.4
58.2 12.6
1975
16.3
54.3 11.5
1976 ----------------------------------------------------------------------------Total 15.3 14.1 15.0 15. I 14.9 14.2 15.5 16.8
Feaale head 55.2 54.3 53.4 53.1 53.1 52.6 51.5 52.7 Hale present 10.2 8.8 9.3 9.3 8.6 7.5 8.7 9.8
1977 1978 1979 1980 1981 1982 1983 --------------------------------------------------------------Total 16.0 15.7 16.0 17.9 19.5 21.3 21.7
Feaale head 50.3 50.6 48.6 50.8 52.3 56. I 55.4 Hale present 8.5 7.9 8.5 10.4 11.6 13.0 13.4
a/ Poverty rates for all years are slightly underestlaated because of the exclusion of unrelated children over the age of 14 and, since 1979, children in unrelated subfa.llles. See text.
Poverty rates for the years 1959-1965 have been adjusted to be consistent with later years and are lower than corresponding estiaates in sose published sources. See text.
SOURCE: March CPS, P-60 Series
15.8
52.0 8.5

TABLE 3. RECENT TRENDS IN POVERTY BY AGE AND THE PRESENCE OF DEPENDENT CHILDREN UNDER 18 IN THE HOUSEHOLD Changes from 1979 TO 1983.
Children Non-Elderly Adults Living With Children a/
Non-Elderly Adults Living Without Children a/
Elderly Adults b/
TOTAL
a/ Under age 65 b/ Age 65 or greater
Total Additional Additional Persons
Persons In Poverty (Thousands> (Thousands>
448 3,696
898 3,686
9,872 2,415 2,548 126
13,765 9,922
Group's Percent of Additional Population
3
7
72 19
100
NOTE: Components may not sum to totals because of rounding.
SOURCE: CBO Tabulations of March Current Population Surveys

TABLE 4. POVERTY RATES AMONG CHILDREN. AGES 6-17, BY HOUSEHOLD TYPE. 1971-83 (Percents). a/
1969 1970 1971 1972 1973 1974 1975 1976
----------------------------------------------------------------------Fellale-Headed
Households 50.3 49.0 48.6 49.3 47.6 47.8 49.3
Male-Present Households 8.4 8.9 8.8 8.4 7.3 8.4 9.4
All Households 13.5 14.3 14.3 14.4 13.6 14.9 16.2
1977 1978 1979 1980 1981 1982 1983 ----------------------------------------------------------------Fellale-Headed
Households 45.2 46.6 44.0 45.5 46.9 51.4 50.1
Male-Present Households 8. 1 7.7 8.0 9.7 10.9 12.4 12.3
All Households 15. I 15.0 15. I 16.8 18.4 20.3 20.2
al Poverty rates are slightly underestllllated because of the exclusion of unrelated children over the age of 14 and, since 1979. children In unrelated subfamilies. See text.
SOURCE: Current Population Reports. Series p-60. Table 9. Population Below the Poverty Level; and CBO tabulations.
47.7
8. 1
15 . 1

TABLE 5. POVERTY RATES AMONG CHILDREN, AGES 6-17, BY ETHNICITY, 1971-83 (Percents) .
1971 1972 1973 1974 1975 1976 1977 -------------------------------------------------------------------Non-Minority 8.9 8.5 8. 1 9. 1 10.5 9.5 9.6
Minority 36.4 37.6 34. 1 36. 1 38.4 35.6 35.2
Black 40.2 43.3 40.3 41.7 42.9 40. 1 41.2 Hispanic 32.2 27 .. 7 24.7 29.3 32.8 29.4 27.6
Total 14.6 14.8 13.9 15.2 16.9 15.4 15.6
1978 1979 1980 1981 1982 1983 -------------------------------------------------------------Non-Minority 9.3 9.5 11.0 12.0 13.6 13.7
Minority 35.0 33.8 35.9 38.6 41.1 40.0
Black 41.1 39.7 40.6 43.2 46.5 45. 1 Hispanic 27.6 . 26.6 32.5 35.4 38. 1 36.2
Total 15.4 15.5 17.3 18.9 20.9 20.8
NOTE: Comparable ethnic data are not available prior to 1971.
SOURCE: CBO tabulations from March Current Population Surveys.

TABLE 6. POVERTY RATES AMONG CHILDREN UNDER 6. BY HOUSEHOLD TYPE. 1971-83 (Percents) a/
YEAR 1971 1972 1973 1974 1975 1976 1977 ----------------------------------------------------------------------Female-Headed
Households 64.9 62.8 64.6 61.4 62.0 64.3
Hale-Present Households 10.3 9. 1 8.2 9.3 10.6 9.4
All Households 16.9 16. 1 15.7 16.9 18.2 17.7
YEAR 1978 1979 1980 1981 1982 1983 --------------------------------------------------------------Fe.ale-Headed
Households 61.6 61.7 65.2 65.9 67.0 67.7
Male-Present Households 8.6 9.6 11. 8 13.0 14. 1 15.4
All Households 17.2 17.9 20.3 22.0 23.3 24.6
a/ Poverty rates are slightly underestimated because of the exclusion of unrelated children over the age of 14 and. since 1979. children in unrelated subfamilies. See text.
SOURCE: March CPS. Series P-60. Table 9.
65. 1
9.3
18. 1

TABLE 7. POVERTY RATES AMONG CHILDREN AGES 6-17, BY COMMUNITY TYPE, 1967-83 (Percents)
1967 1969 1971 1972 1973 1974 1975 1976 -------------------------------------------------------------------------Central Cities 17.3 16.9 18. 1 20.3 19.5 21.3 23.3 22.7
Non-Central Areas Within SMSAs 7.4 6.7 7.6 7.9 7.8 8.9 10.0 8.7
Non-Metropolitan Areas 20.8 19.0 19.9 18.6 16.7 17.9 20.1 17.6
1977 1978 1979 1980 1981 1982 1983 ------------------------------------------------------------------Central Cities 22.9 23.9 23.3 25.5 27.1 30.0 29.8
Non-Central Areas Within SMSAs 9.0 8.9 9.6 10.9 11.5 12.8 12.5
Non-Metropolitan Areas 17.5 16.5 16.6 18.7 21.3 23.2 23.3
SOURCE: cao tabulations of the March CPS.

TABLE 8. PERCENT OF SCHOOL-AGE CHILDREN WHO WERE BOTH POOR AND MINORITY, by COllllllunlty Type, 1971-83.
YEAR 1971 1972 1973 1974 1975 1976 1977 -------------------------------------------------------------------------Central Cities 12.9 15. 1 14.5 16. 1 17. 1 16.8 17.6
34 Large at 17. I 18.0 17.2 17.8 20.4 21.5 21.7 Others 10. 1 11.8 11.5 14.3 13.5 11.5 13. I
Non-Central Areas 3. I 3.4 3.2 3.5 3.6 3.3 3.5 Non-Metropolitan
Areas 8. 1 8.0 7. 1 7.3 8.3 7.2 6.8 -------------------------------------------------------------------------Total 7.5 8. 1 7.6 8. 1 8.7 8. 1 8.2
YEAR 1978 1979 1980 1981 1982 1983 -----------------------------------------------------------------Central Cities 18.5 17.9 19.4 21.4 23.3 23.3
34 Large at 21.8 21.6 22.5 26.3 27.0 28.0 Others 14.9 14.0 16.3 16.2 19.5 18.4
Non-Central Areas 3.7 3.6 4.6 5.0 5.2 5.0 Non-Metropolitan
Areas 6. 1 7.0 6.8 7.5 8.1 7.9 -----------------------------------------------------------------Total 8.3 8.4 9.0 10.0 10.9 10.8
SOURCE: CBO tabulations of the March CPS.
at Central Cities within the 34 largest SMSAs, based on the 1970 Census.