potential target method #4 using density and eto factors tom hawkins dwr u4 technical subcommittee...
TRANSCRIPT
Potential Target Method #4Using Density and ETo Factors
Tom HawkinsDWR
U4 Technical Subcommittee Meeting
August 25, 2010
• Tim Barr of Western Municipal Water District proposed a target method that uses variances in urban densities and ETo within a hydrologic region.
• This presentation will be on the analysis performed with the purpose to determine if there is a relationship between these factors and water use.
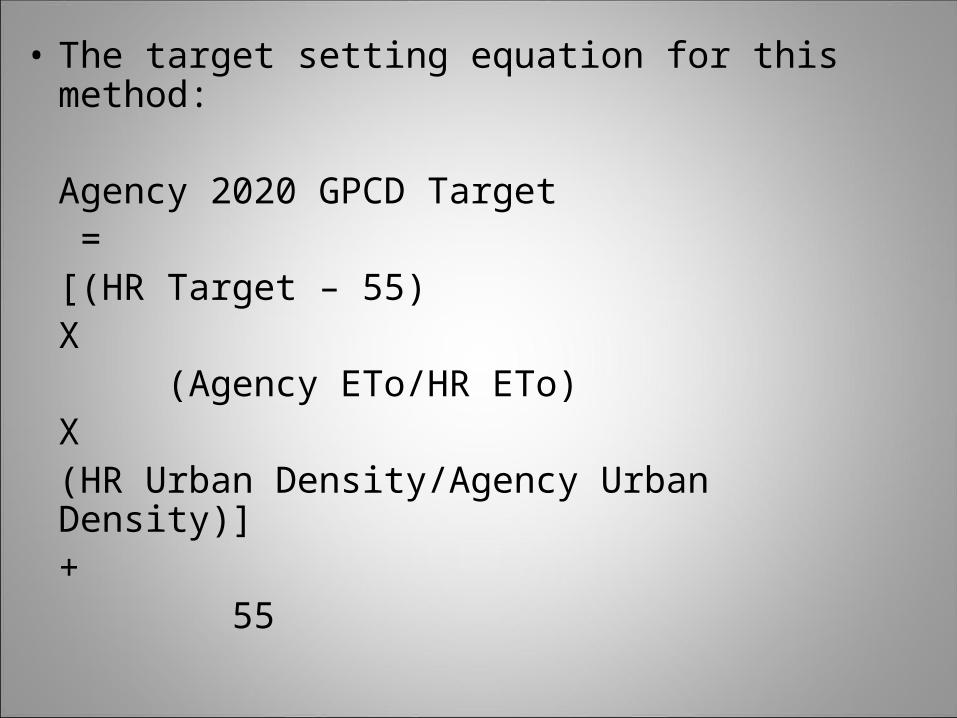
• The target setting equation for this method:
Agency 2020 GPCD Target =
[(HR Target – 55)X
(Agency ETo/HR ETo)X
(HR Urban Density/Agency Urban Density)]+
55

• Primary factor affecting per capita water use is outdoor water use. – Outdoor water use can be affected by urban
density (lower densities would have more irrigated landscape per person).
– Outdoor water use can also be affected by weather (hotter/drier climates would have higher ET rates).
• For this analysis, – Urban densities were developed using DWR
population data and Dept of Conservation’s urban GIS data.
– For weather, normal year annual ETo were used. Water use was DWR’s data from Calif Water Plan Update.
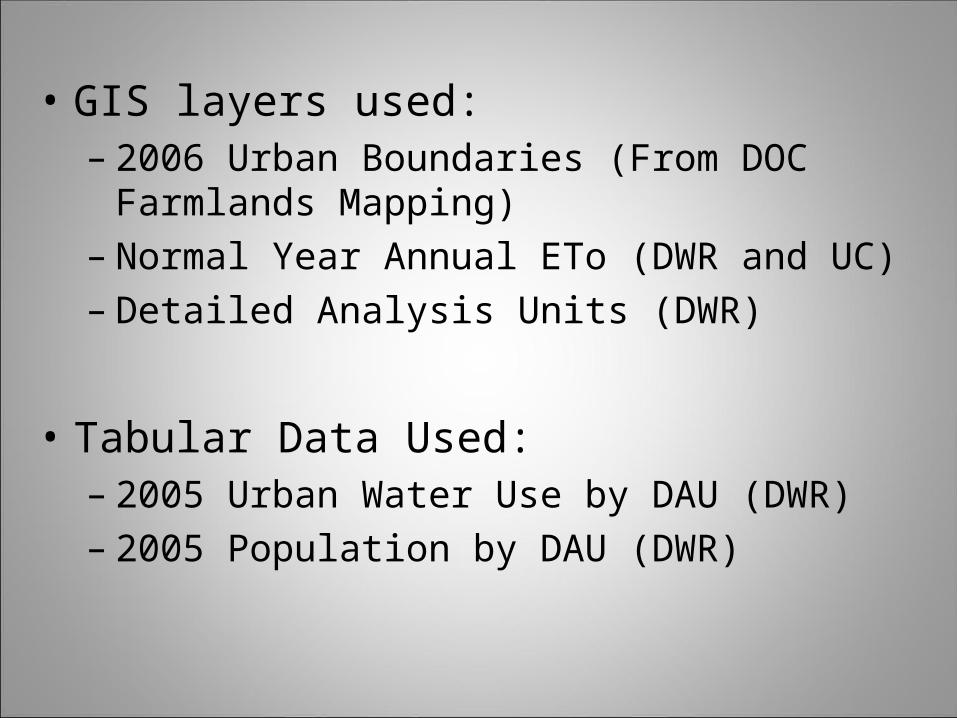
• GIS layers used:– 2006 Urban Boundaries (From DOC Farmlands
Mapping)– Normal Year Annual ETo (DWR and UC)– Detailed Analysis Units (DWR)
• Tabular Data Used:– 2005 Urban Water Use by DAU (DWR)– 2005 Population by DAU (DWR)
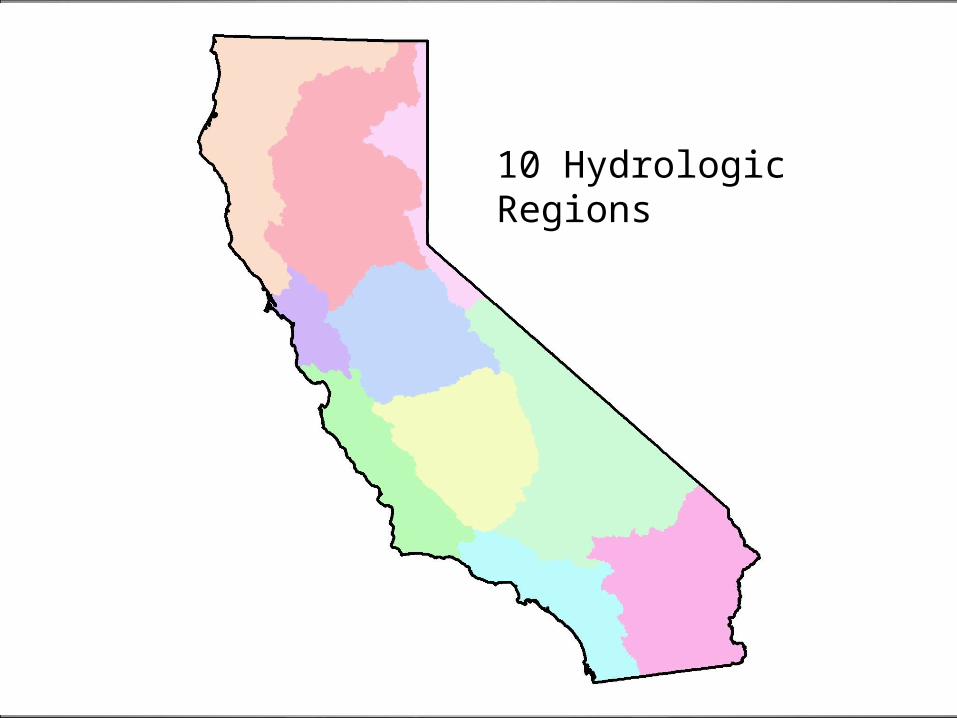
10 Hydrologic Regions
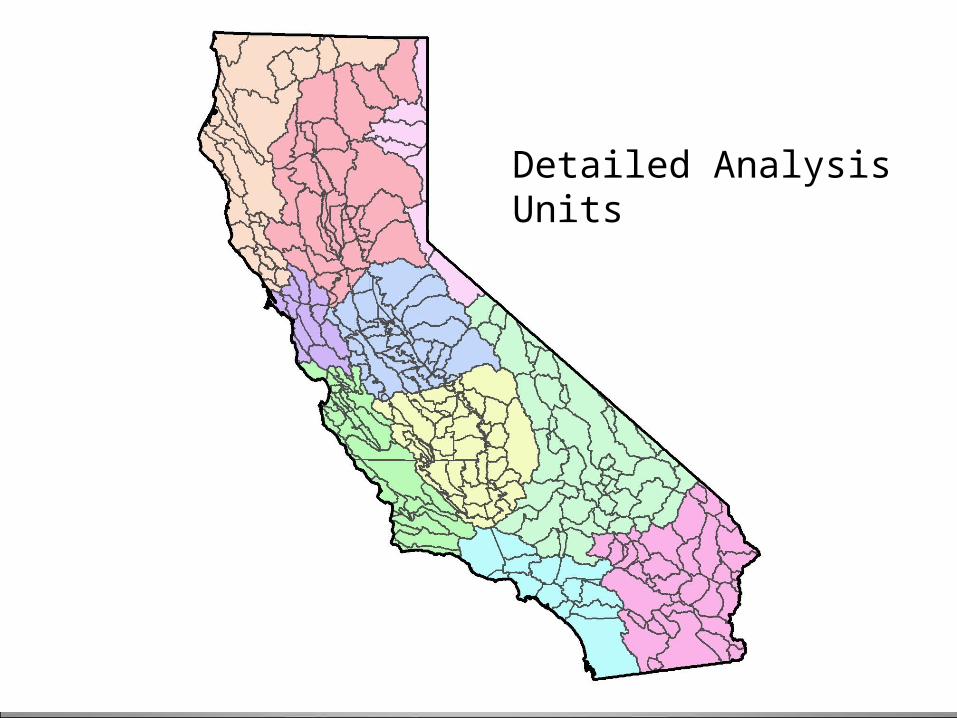
Detailed Analysis Units

Urban Areas (DOC)
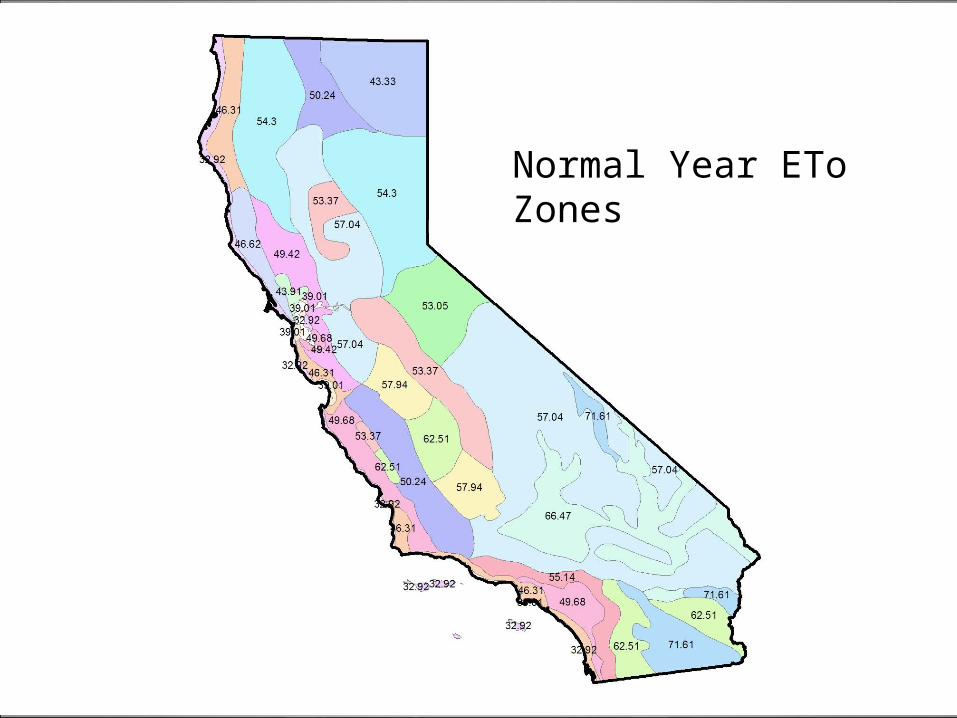
Normal Year ETo Zones

• Within ARCGIS, the three GIS layers, DAU, ETo, and Urban Boundaries, were all intersected to create a new layer.
• From this new layer, a data table was created with this data by DAU:– Acreage of the urban area– Volume of annual normal year ETo for the urban
area
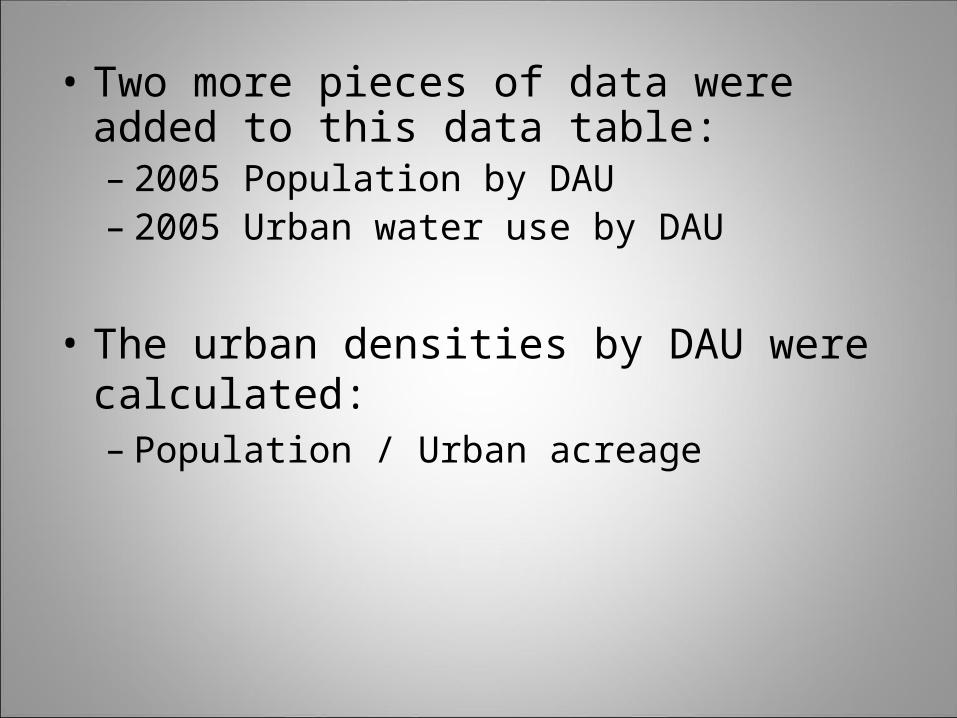
• Two more pieces of data were added to this data table:– 2005 Population by DAU– 2005 Urban water use by DAU
• The urban densities by DAU were calculated:– Population / Urban acreage
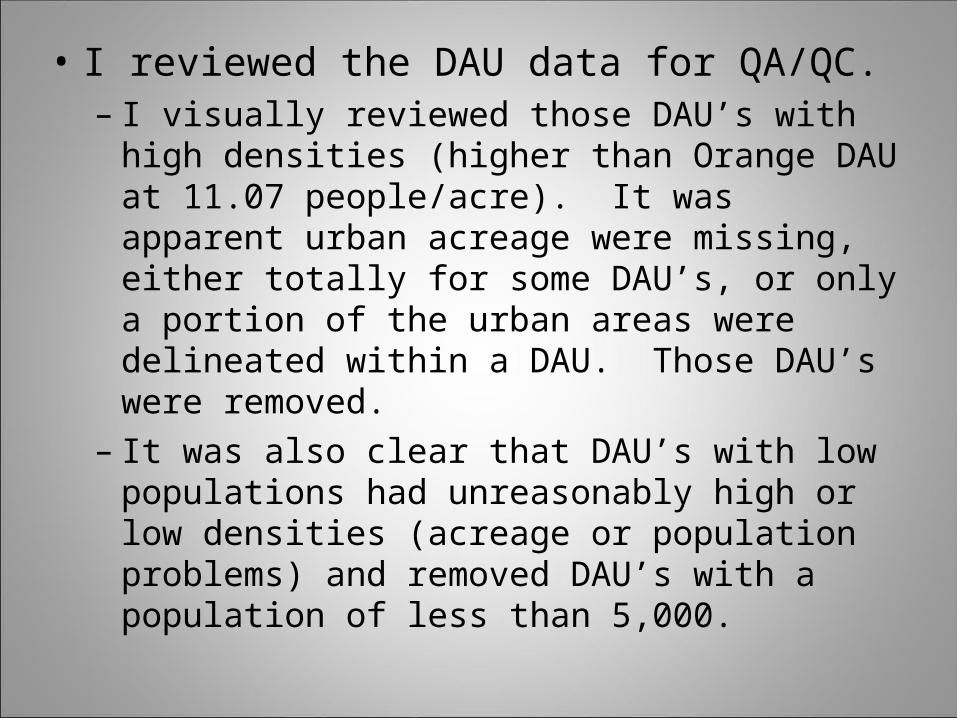
• I reviewed the DAU data for QA/QC. – I visually reviewed those DAU’s with high densities
(higher than Orange DAU at 11.07 people/acre). It was apparent urban acreage were missing, either totally for some DAU’s, or only a portion of the urban areas were delineated within a DAU. Those DAU’s were removed.
– It was also clear that DAU’s with low populations had unreasonably high or low densities (acreage or population problems) and removed DAU’s with a population of less than 5,000.
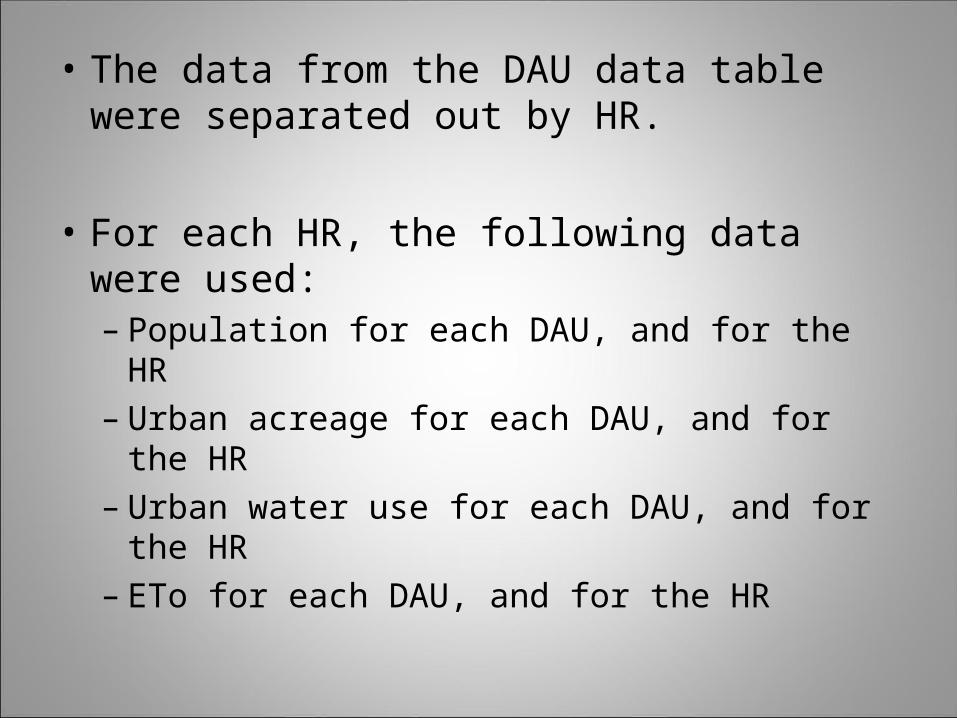
• The data from the DAU data table were separated out by HR.
• For each HR, the following data were used: – Population for each DAU, and for the HR– Urban acreage for each DAU, and for the HR– Urban water use for each DAU, and for the HR– ETo for each DAU, and for the HR
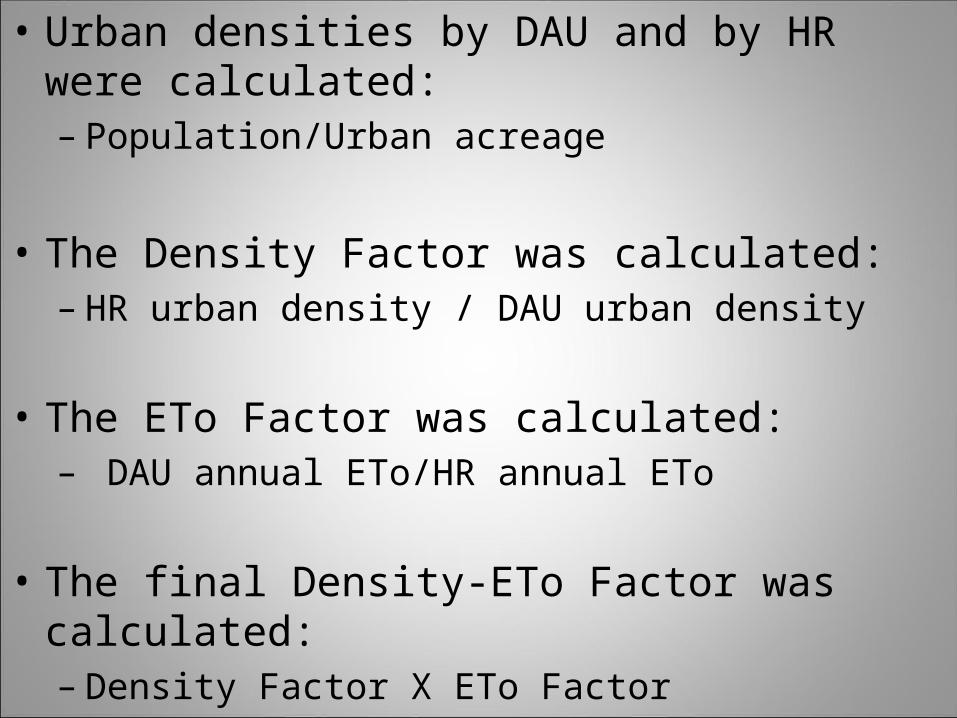
• Urban densities by DAU and by HR were calculated:– Population/Urban acreage
• The Density Factor was calculated:– HR urban density / DAU urban density
• The ETo Factor was calculated:– DAU annual ETo/HR annual ETo
• The final Density-ETo Factor was calculated:– Density Factor X ETo Factor
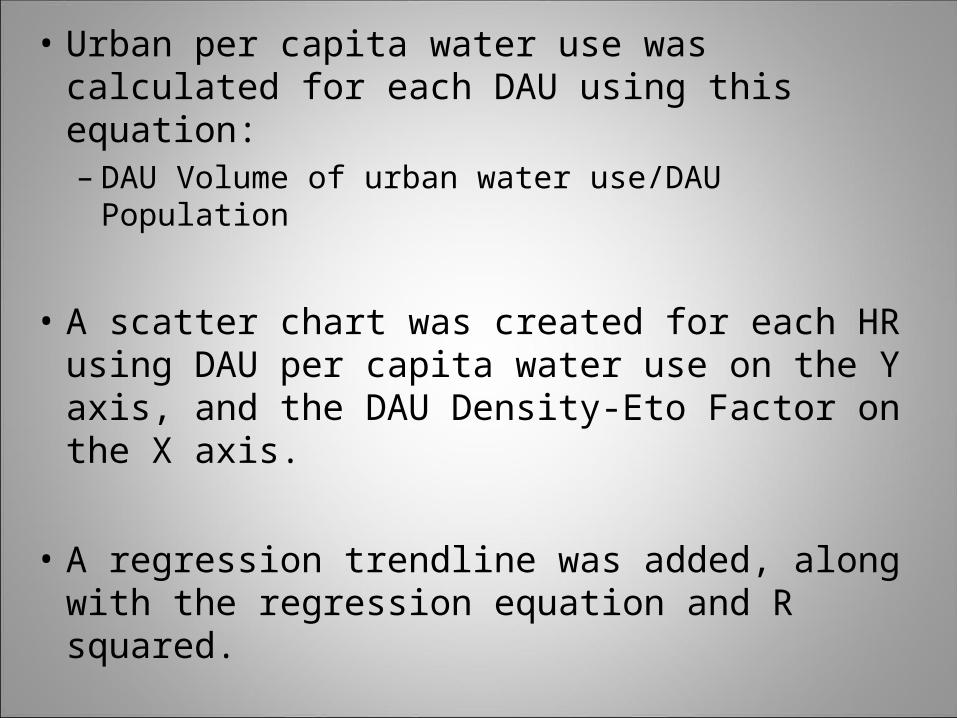
• Urban per capita water use was calculated for each DAU using this equation:– DAU Volume of urban water use/DAU Population
• A scatter chart was created for each HR using DAU per capita water use on the Y axis, and the DAU Density-Eto Factor on the X axis.
• A regression trendline was added, along with the regression equation and R squared.

North Coast HR
Density_factor Ann_Eto_factor Dens_AnnETo_factor Tot_WU_PCU
1.47 0.49 0.72 1741.01 1.09 1.09 2421.25 1.09 1.36 2292.31 1.11 2.57 3111.00 1.03 1.02 2410.87 0.98 0.86 152
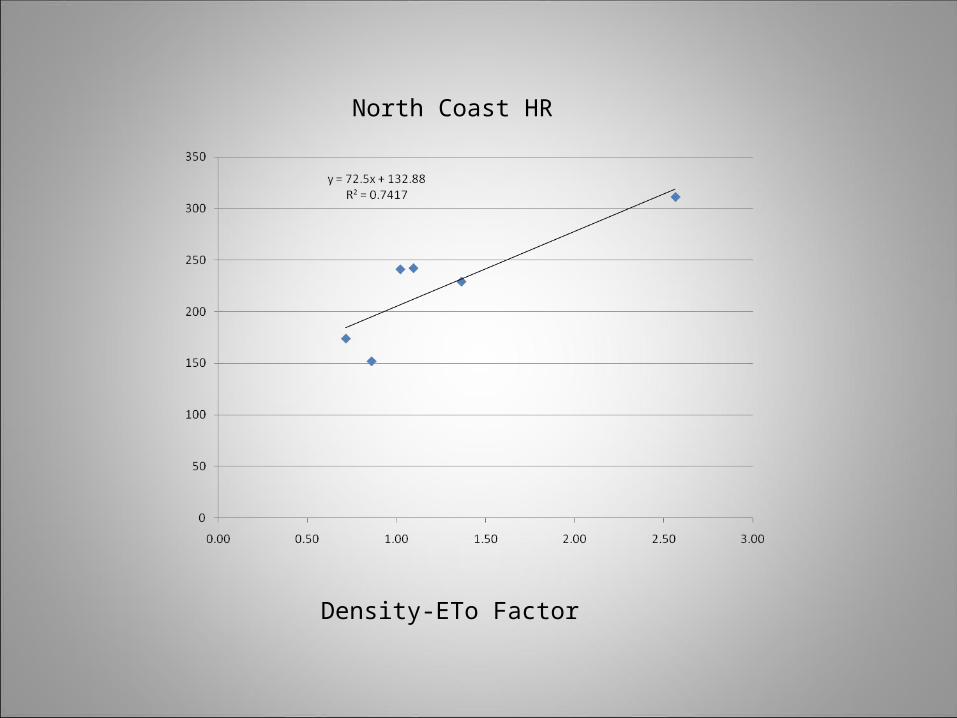
North Coast HR
Density-ETo Factor
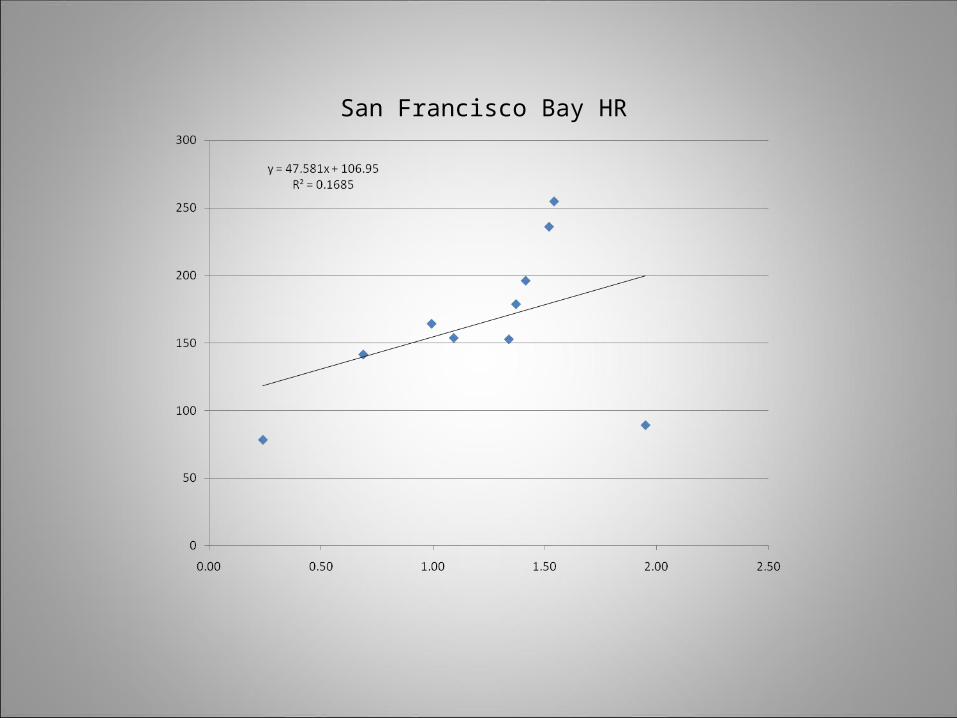
San Francisco Bay HR
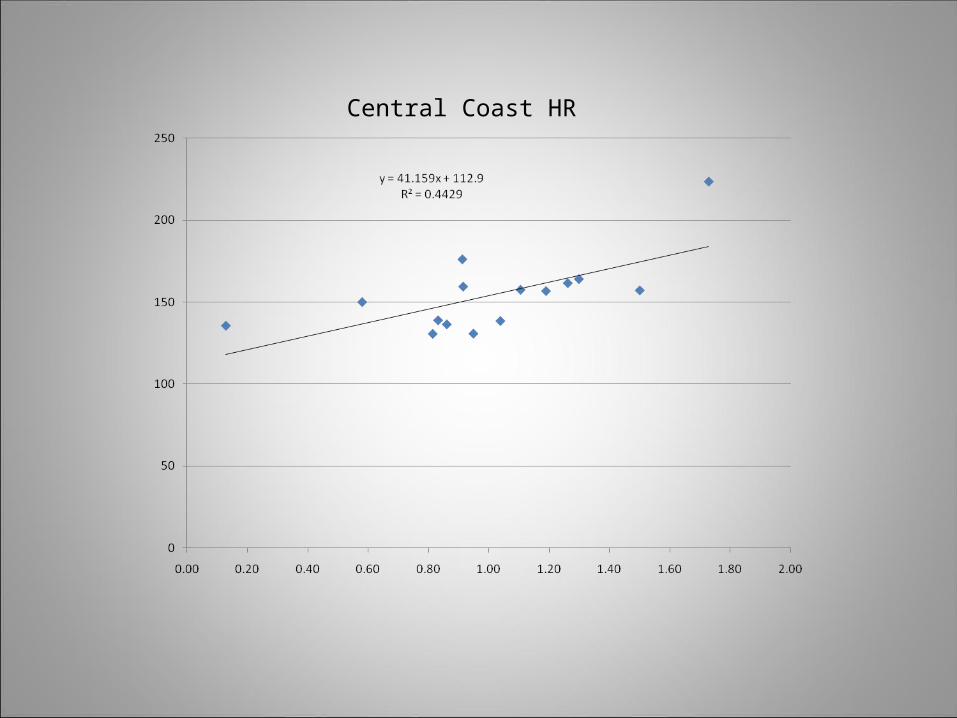
Central Coast HR
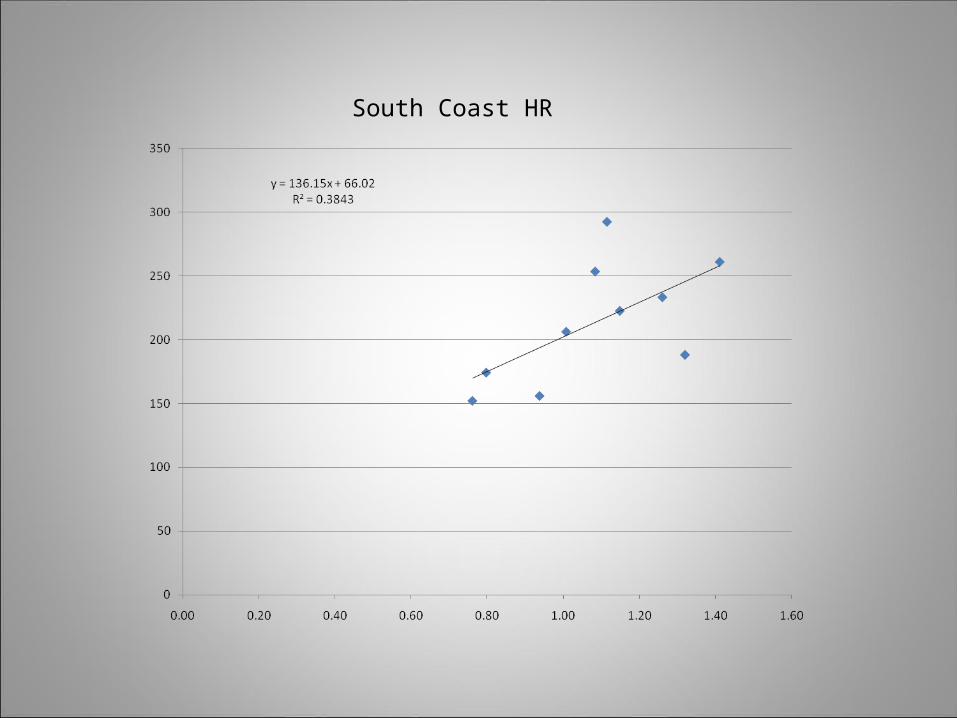
South Coast HR

Sacramento River HR
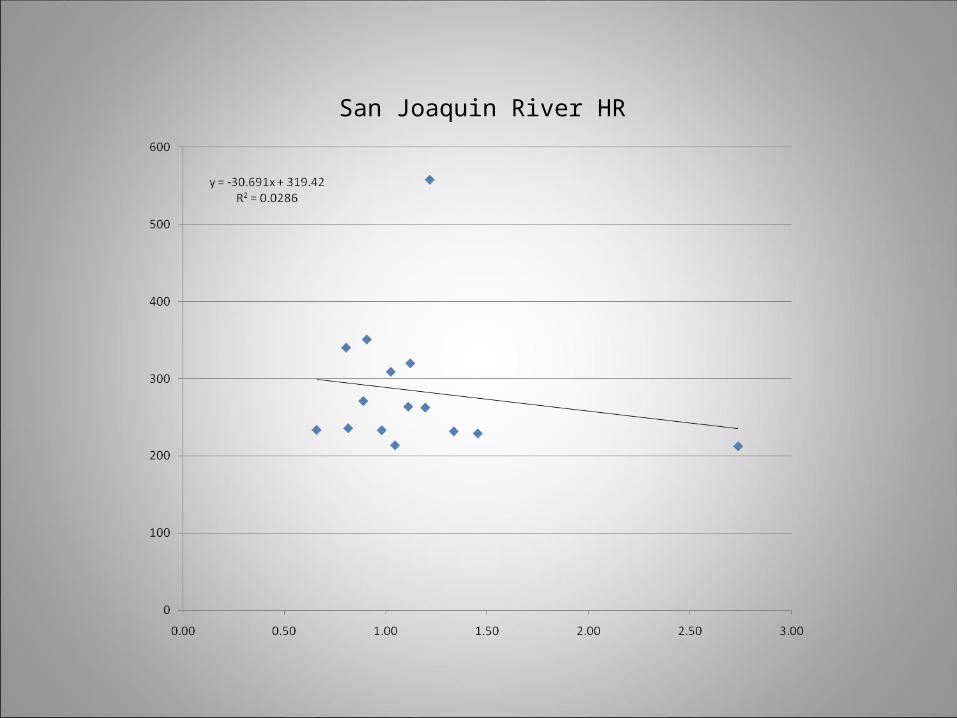
San Joaquin River HR

Tulare Lake HR
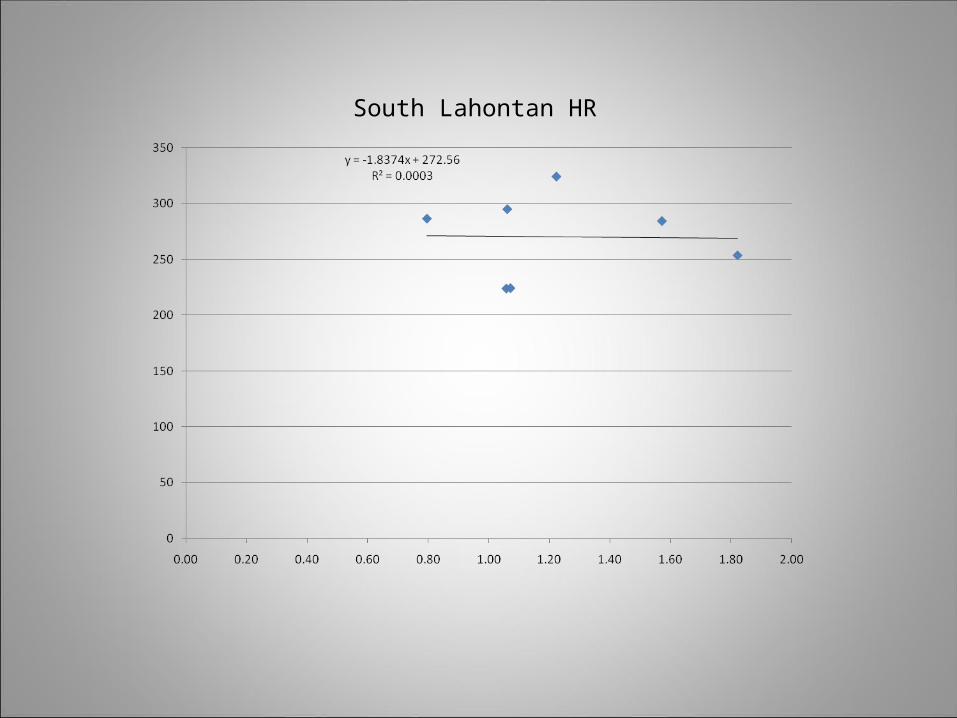
South Lahontan HR
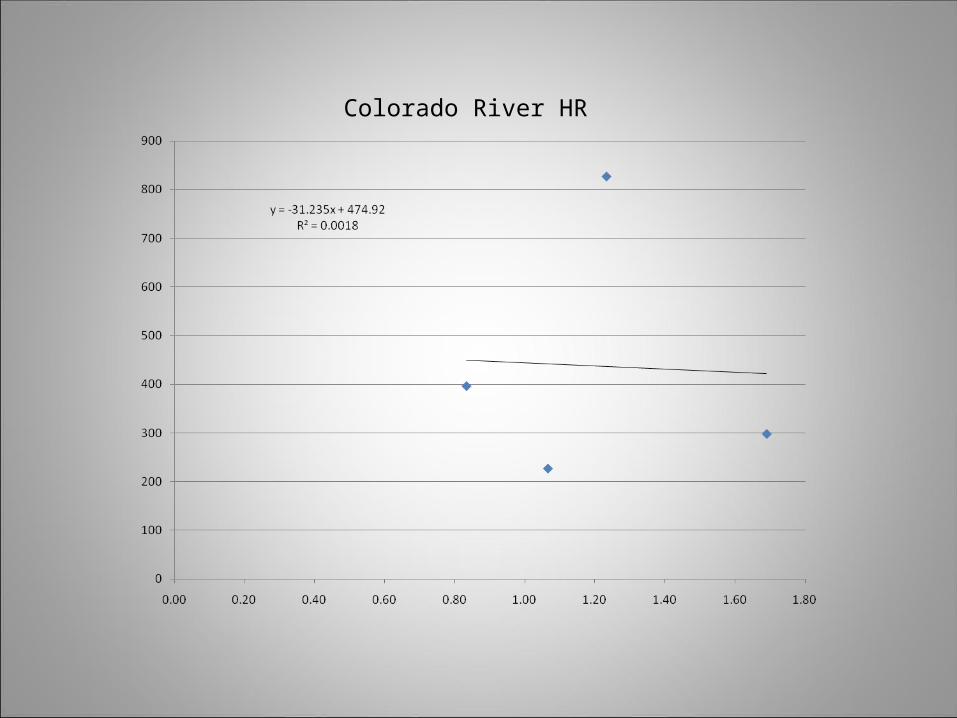
Colorado River HR
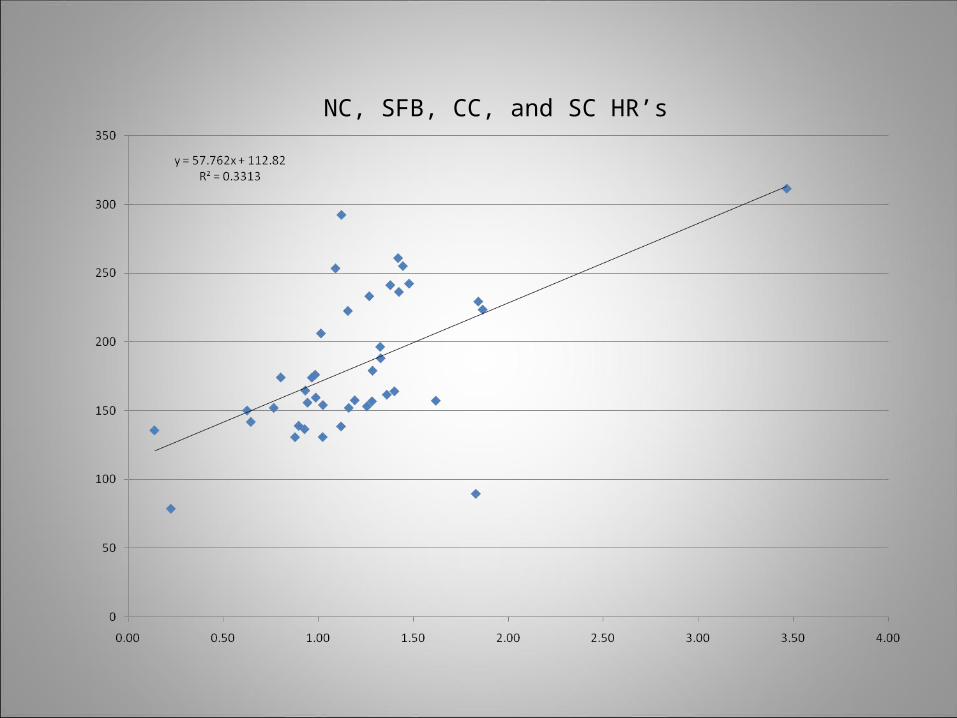
NC, SFB, CC, and SC HR’s
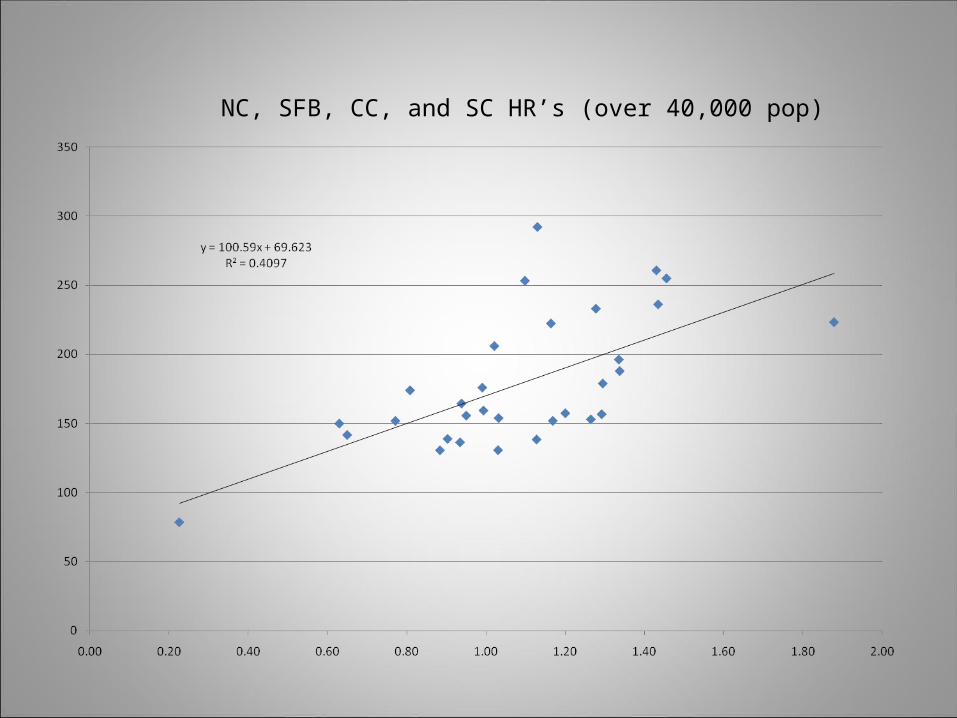
NC, SFB, CC, and SC HR’s (over 40,000 pop)
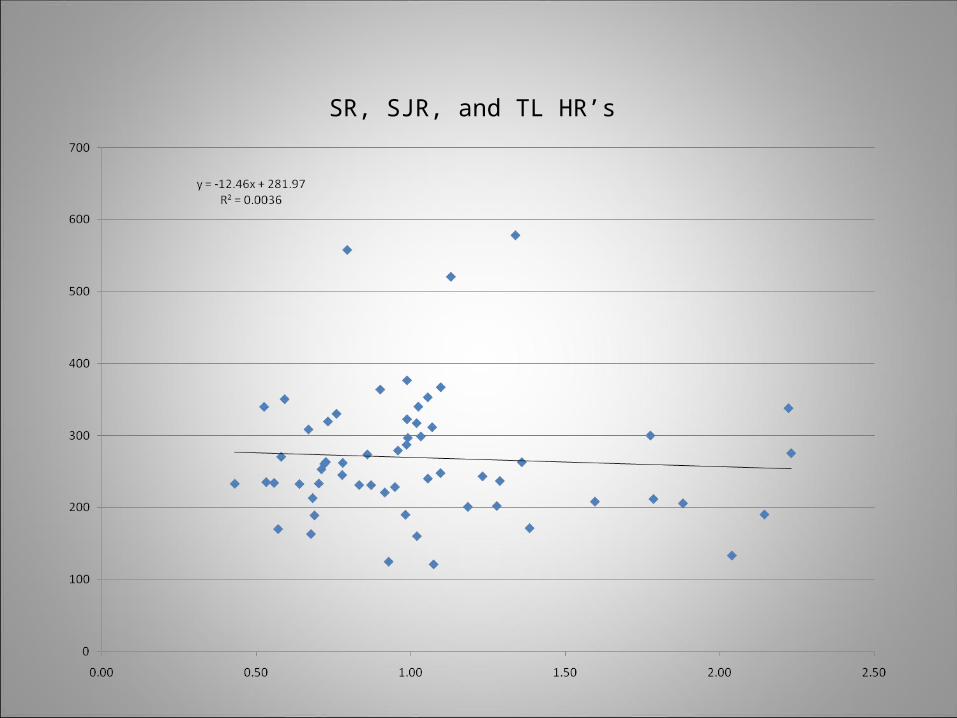
SR, SJR, and TL HR’s
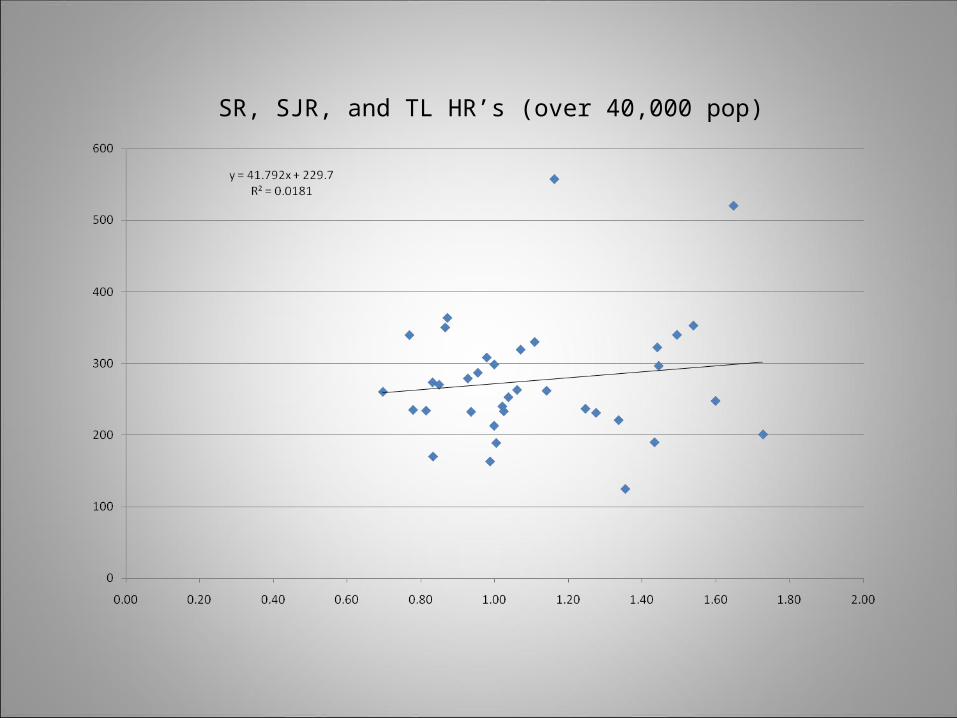
SR, SJR, and TL HR’s (over 40,000 pop)
• The results:– The data analysis did not result in a good regression
relationship.
• Does this disprove the concept?– Do not know– The datasets used may not be of high enough
quality and coverage to be able to show a relationship.
• ETo– Normal year was used, not 2005 data– The GIS layer used did not completely cover the
whole coastline, where some urban acreage were not included in the analysis because of no ETo.
– How accurate is the normal year ETo map? There was not a huge amount of data available in urban areas of the state when developed.
– Is annual ETo the correct factor to use? Would the addition of effective precipitation improve the factor?
• Water Use– The data used is based on voluntarily provided
water use data by water agencies.– Not all provide data, some DAU’s probably are not
represented by a water agency. – The data used for this analysis is all urban water use,
including that supplied by water agencies and self supplied water (private wells).
• Urban Area– DWR’s land use survey data a point-in-time dataset,
and the urban areas would include data from the late 80’s. We don’t have digital surveys in much of the coastal urban areas.
– DOC’s urban layer is missing some significant areas (Los Angeles County, San Francisco, and portions of other counties.
– DOC’s data does show that in some areas, rural (low density) urban areas are delineated, and not in other areas.
– The layer is for all urban, not just that in water agency boundaries.

• Population– DWR has to develop population estimates by DAU.
This is done using Census and DOF data and recent aerial imagery. Always room for improvement.

• Implementing this proposal as a target method would require significant work to be able to come up with a supportable and agreeable urban delineation (acreage) by hydrologic region. – Should it be urban areas within water agency
services areas?– Missing data, how would that be developed?

• Questions/Comments?