potatoes merchandising best practices · optimal merchandising for potatoes in retail settings. the...
TRANSCRIPT

If these principles are executed at store level, opportunities for potato sales increase.
ASSORTMENT SECONDARYLOCATION
SHELVING PLACEMENT
PLACEMENT WITHIN PRODUCE
BACKGROUNDKantar Insights Consulting is a team of brand and marketing specialists who focus on growth opportunities in the retail sector. Kantar Insights Consulting gathered and analyzed performance data to generate quantifiable shelving recommendations for potatoes, executing audits in 23 different grocery retailers across the country in 200 stores.
A review of layout, design and external factors enabled Kantar to develop principles to recommend the optimal merchandising for potatoes in retail settings. The stores that optimized their sets based on the recommended best practices saw an overall lift in potato sales.
The following summarizes the best practices through statistical modeling and breaks it down into four categories that impact potato sales.
FOUR STEPS TO MERCHANDISING OPTIMIZATION
Potatoes Merchandising Best Practices

RAISED BINS
5.2%TOTAL POTATO LIFT POTENTIAL
If the following recommendations are implemented in produce, it can bring a lift to potato sales.
Shelving plays a factor in sales lift. Raised bins, like the one below, are the only type of shelving associated with a positive lift in potato sales.
4.1%raised bins vertical shelving flat bins
-2.9% -3.3%
8.7%LIFT
2.9%LIFT
4.1%LIFT
Produce Location
FRONT AND RIGHT OF STORE
POTATO SIGNAGE VISIBLE FROM STORE ENTRANCE
RAISED BINS
Signage and Visibility
Type ofShelving
SHELVING PLACEMENT

Standalone sections, such as the ones below, help potatoes perform best.
Potatoes placed adjacent to the following products performed as follows:
BEST PLACEMENT NEAR AVOID PLACEMENT NEAR
apples 4.7%-3.8%
onions -4.7%
squash -9.5%
sweet potatoes
Potatoes perform best when they are in the right location in the produce department and merchandised next to the right commodities.
PLACEMENT WITHIN PRODUCE
2.8%LIFT
4.7%LIFT
5.4%LIFT
PotatoLocation
BACK LEFT OF PRODUCE SECTION
APPLES ACROSS FROM POTATOES
HAVE A STAND-ALONE SHELF
Commodities Across from Potatoes
Merchandised Alone
COMMODITIES ACROSS FROM POTATOES
4.3%TOTAL POTATO LIFT POTENTIAL

Merchandising assortment plays a huge role in potato sales. Having the right potatoes organized in the right order creates a lift in sales for the overall category.
1.4%LIFT
3.8%LIFT
5.7%LIFT
Primary Shelf Organization
ORGANIZE SHELF BY POTATO TYPE
VERTICAL BLOCKING
WHITE > YELLOW > RUSSET > RED
Shelf Blocking
Potato Type Flow
ASSORTMENT
While four main types of potatoes are available nationwide, other types are increasing their presence on the shelf. Organizing the potatoes section by type provides the highest lift and is most common.
1.4%
by potato type
by pack size
by pack type
-3.0%
0.6%
Both type and size play a factor in maximizing shelving integration.
3.6%TOTAL POTATO LIFT POTENTIAL

Potatoes arranged vertically by variety in the following order optimize sales: white, yellow, russet and red.
Please email [email protected] for more information.
WHITE YELLOW RUSSET RED
Each percentage is the optimum amount of space allocated for each type of potato.
PRIMARY SHELF ORGANIZATION
While types vary by retailer, the best national planogram including all potatoes is broken down by size, type and color. This assortment will optimize sales across retail outlets.
WHITE YELLOW RUSSET PURPLE RED A/O
9% 21% 35% 22% 11%2%
Small Petite
SmallConvenience
SmallConventional
Medium
Medium
Medium
Bulk
Medium
SmallSteamable Small Petite
Small Organic Small Organic
Medium
SmallMicrowavable
SmallMicrowavable
SmallMicrowavable
SmallConvenience
SmallConvenience
SmallConvenience
SmallConvenience
SmallConvenience
SmallOrganic
Medium Medium Medium Medium Medium
Bulk Large Large
Small Petite
SmallConventional
Small Petite
SmallFlavored
Medium
Bulk
Medium
SmallConventional
SmallCreamer
Small Petite
Small Assorted
SmallConvenience
SmallConventional
MediumCreamer Medium
SmallAssorted
SmallConvenience Medium
SmallConventional
SmallConventional
SmallConventional
SmallConventional
15% 22% 45% 18%

FRESH NATIONAL RECOMMENDED PLANOGRAM
FRESH RECOMMENDED PLANOGRAM: CALIFORNIA
ASSORTMENT RECOMMENDATIONS: CALIFORNIA
LAYOUT EXAMPLE
4.6%VOLUME
POTENTIAL LIFT
Optimal Pack Size SKU Counts
11Medium 8Small Pack – Value Add
3Large 2Small Pack – Organic
3Bulk 8Small Pack – Conventional
Optimal SKU Count by Potato Type
White Yellow Russett Purple Red All Other
2 12 8 2 9 2
The planogram is an example of how the shelf can differ in display and assortment from the national recommendation.
Both sales and dollars can be impacted by optimizing the SKU assortment based
on regional specific recommendations.
Sources: Kantar Insights Consulting. Merchandising and Shelving Study and Best Practices, July 2018. RichMix Methodology, August 2018. IRI Freshlook WE 12/31/17.

ASSORTMENT RECOMMENDATIONS: GREAT LAKES
LAYOUT EXAMPLE
8.1%VOLUME
POTENTIAL LIFT
Optimal Pack Size SKU Counts
9Medium 13Small Pack – Value Add
1Large 3Small Pack – Organic
1Bulk 9Small Pack – Conventional
Optimal SKU Count by Potato Type
White Yellow Russett Purple Red All Other
2 9 9 1 7 8
The planogram is an example of how the shelf can differ in display and assortment from the national recommendation.
Both sales and dollars can be impacted by optimizing the SKU assortment based
on regional specific recommendations.
FRESH NATIONAL RECOMMENDED PLANOGRAM
FRESH RECOMMENDED PLANOGRAM: GREAT LAKES
Sources: Kantar Insights Consulting. Merchandising and Shelving Study and Best Practices, July 2018. RichMix Methodology, August 2018. IRI Freshlook WE 12/31/17.

ASSORTMENT RECOMMENDATIONS: MID-SOUTH
LAYOUT EXAMPLE
4.1%VOLUME
POTENTIAL LIFT
Optimal Pack Size SKU Counts
15Medium 17Small Pack – Value Add
4Large 1Small Pack – Organic
2Bulk 12Small Pack – Conventional
Optimal SKU Count by Potato Type
White Yellow Russett Purple Red All Other
3 7 18 2 13 8
The planogram is an example of how the shelf can differ in display and assortment from the national recommendation.
Both sales and dollars can be impacted by optimizing the SKU assortment based
on regional specific recommendations.
FRESH NATIONAL RECOMMENDED PLANOGRAM
FRESH RECOMMENDED PLANOGRAM: MID-SOUTH
Sources: Kantar Insights Consulting. Merchandising and Shelving Study and Best Practices, July 2018. RichMix Methodology, August 2018. IRI Freshlook WE 12/31/17.

ASSORTMENT RECOMMENDATIONS: SOUTHEAST
LAYOUT EXAMPLE
10.9%VOLUME
POTENTIAL LIFT
Optimal Pack Size SKU Counts
15Medium 17Small Pack – Value Add
3Large 1Small Pack – Organic
2Bulk 13Small Pack – Conventional
Optimal SKU Count by Potato Type
White Yellow Russett Purple Red All Other
5 9 16 2 9 10
The planogram is an example of how the shelf can differ in display and assortment from the national recommendation.
Both sales and dollars can be impacted by optimizing the SKU assortment based
on regional specific recommendations.FRESH NATIONAL RECOMMENDED PLANOGRAM
FRESH RECOMMENDED PLANOGRAM: SOUTHEAST
Sources: Kantar Insights Consulting. Merchandising and Shelving Study and Best Practices, July 2018. RichMix Methodology, August 2018. IRI Freshlook WE 12/31/17.
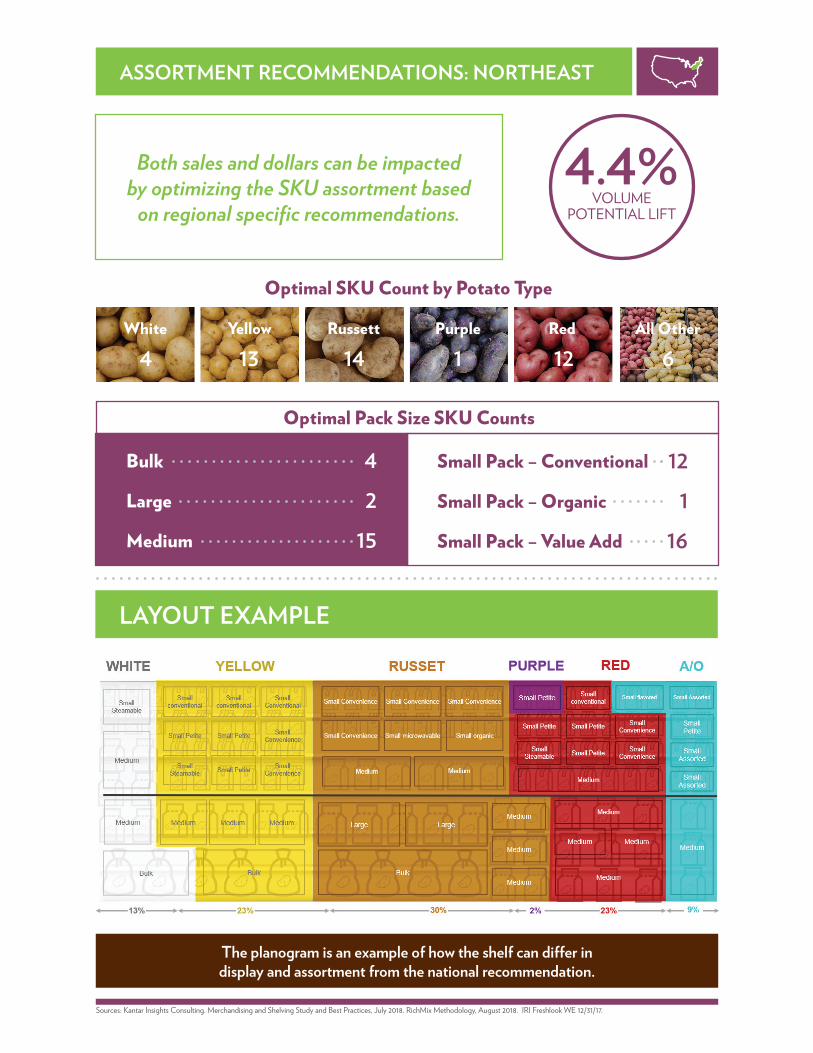
ASSORTMENT RECOMMENDATIONS: NORTHEAST
LAYOUT EXAMPLE
4.4%VOLUME
POTENTIAL LIFT
Optimal Pack Size SKU Counts
15Medium 16Small Pack – Value Add
2Large 1Small Pack – Organic
4Bulk 12Small Pack – Conventional
Optimal SKU Count by Potato Type
White Yellow Russett Purple Red All Other
4 13 14 1 12 6
The planogram is an example of how the shelf can differ in display and assortment from the national recommendation.
Both sales and dollars can be impacted by optimizing the SKU assortment based
on regional specific recommendations.FRESH NATIONAL RECOMMENDED PLANOGRAM
FRESH RECOMMENDED PLANOGRAM: NORTHEAST
Sources: Kantar Insights Consulting. Merchandising and Shelving Study and Best Practices, July 2018. RichMix Methodology, August 2018. IRI Freshlook WE 12/31/17.

ASSORTMENT RECOMMENDATIONS: PLAINS
LAYOUT EXAMPLE
7.7%VOLUME
POTENTIAL LIFT
Optimal Pack Size SKU Counts
18Medium 9Small Pack – Value Add
5Large 1Small Pack – Organic
3Bulk 13Small Pack – Conventional
Optimal SKU Count by Potato Type
White Yellow Russett Purple Red All Other
2 10 16 1 11 8
The planogram is an example of how the shelf can differ in display and assortment from the national recommendation.
Both sales and dollars can be impacted by optimizing the SKU assortment based
on regional specific recommendations.FRESH NATIONAL RECOMMENDED PLANOGRAM
FRESH RECOMMENDED PLANOGRAM: PLAINS
Sources: Kantar Insights Consulting. Merchandising and Shelving Study and Best Practices, July 2018. RichMix Methodology, August 2018. IRI Freshlook WE 12/31/17.

ASSORTMENT RECOMMENDATIONS: SOUTH CENTRAL
LAYOUT EXAMPLE
4.8%VOLUME
POTENTIAL LIFT
Optimal Pack Size SKU Counts
13Medium 15Small Pack – Value Add
3Large 1Small Pack – Organic
3Bulk 8Small Pack – Conventional
Optimal SKU Count by Potato Type
White Yellow Russett Purple Red All Other
3 7 16 1 11 5
The planogram is an example of how the shelf can differ in display and assortment from the national recommendation.
Both sales and dollars can be impacted by optimizing the SKU assortment based
on regional specific recommendations.FRESH NATIONAL RECOMMENDED PLANOGRAM
FRESH RECOMMENDED PLANOGRAM: SOUTH CENTRAL
Sources: Kantar Insights Consulting. Merchandising and Shelving Study and Best Practices, July 2018. RichMix Methodology, August 2018. IRI Freshlook WE 12/31/17.

ASSORTMENT RECOMMENDATIONS: WEST
LAYOUT EXAMPLE
4.0%VOLUME
POTENTIAL LIFT
Optimal Pack Size SKU Counts
15Medium 14Small Pack – Value Add
4Large 5Small Pack – Organic
3Bulk 8Small Pack – Conventional
Optimal SKU Count by Potato Type
White Yellow Russett Purple Red All Other
3 10 16 1 14 5
The planogram is an example of how the shelf can differ in display and assortment from the national recommendation.
Both sales and dollars can be impacted by optimizing the SKU assortment based
on regional specific recommendations.FRESH NATIONAL RECOMMENDED PLANOGRAM
FRESH RECOMMENDED PLANOGRAM: WEST
Sources: Kantar Insights Consulting. Merchandising and Shelving Study and Best Practices, July 2018. RichMix Methodology, August 2018. IRI Freshlook WE 12/31/17.

Sweet Potatoes -3.7% Corn -9.6%Broccoli -5.5%
© 2019 Potatoes USA. All rights reserved.For more information, visit PotatoRetailer.com
Sources: Kantar Insights Consulting,Merchandising and Shelving Study and Best Practices, July 2018.RichMix Methodology, August 2018.IRI Freshlook WE 12/31/17.
2.2%LIFT
4.1%LIFT
PotatoesSecondaryLocation
ENDCAPS IN PRODUCE SECTION
NEXT TO ONIONS
EndcapLocation
SECONDARY LOCATION
ENDCAP LOCATION
Secondary location can add a lift to potato sales by highlighting this commodity during peak selling periods. It is important to place the secondary in the right location to optimize sales.
Potatoes stand out on endcaps in the produce department. While the most common endcap placement is near sweet potatoes, the most successful is near onions.
3.1%TOTAL POTATO LIFT POTENTIAL
onions 4.1%