post-mortem volume-pressure
TRANSCRIPT

Thorax (1976), 31, 534.
Post-mortem studies of the semistaticvolume-pressure characteristics of infants' lungs
DAVID G. FAGAN
Department of Pathology, Children's Hospital, Sheffield
Fagan, D. G. (1976). Thorax, 31, 534-543. Post-mortem studies of the semistatic volume-pressure characteristics of infants' lungs. Semistatic air volume-pressure (V-P) loops were
recorded from 172 isolated lungs obtained from infants and children at necropsy. Techni-cally unsatisfactory V-P loop behaviour and the presence of pathological changes led tothe exclusion of 98 lungs. A further 10 lungs were excluded as it was decided to study theperiod of growth up to 90 cm crown-heel length. A total of 64 left lungs remained whichwere designated 'normal'. Control data were collected in an attempt to quantify theeffects of storage and variations in inflation technique. A maximum inflation pressure
of +30 cmH2O was used as a standard Pmax. The resulting maximum inflation volume(Vmax) data showed a cubic relation to the crown-heel length which deviated from thevalues obtained by the use of in-vivo regression equations. The extent and pattern of thedeviation suggest that the technical factors are not a major contributory cause, andother explanations are discussed.The low-pressure proportional data from the deflation limb of the V-P curve are
plotted against the crown-heel length, and the resulting curve is analysed. There is a
sharp fall in the proportion of Vm.a retained in the lung at +5 cmH2O and +2-5 cmH20with increasing body length, but proportional volume at zero transpulmonary pressure
follows the same growth-related pattern as Vmx..
The semistatic volume-pressure (V-P) loop ob-tained by inflating and deflating a lung with air insteps is a well-recognized method of studying thebasic pulmonary mechanics of the lung (vonNeergaard, 1929; Radford, 1957; Mead, 1961).
In its simplest form, the air V-P loop is obtainedby inflating and deflating the lung at fixed inter-vals of either volume or pressure. Time is allowedfor equilibration after each change. This techniqueproduces the semistatic loop as opposed to thedynamic loop. It is called semistatic because thestress relaxation curve of the lung is such thatno sharp equilibrium point is attainable. Theequilibration time of 30 seconds is assumed bymost workers to give a good approximation.The deflation limb of the dynamic V-P loop is
a measure of the recoil of the lung and the flowcapacity of air passages, while the semistatic loopgives a measure of the recoil force of the lung-alone.The recoil force of the lung during deflation
may be divided into forces due to tissue retractivepower and forces due to surface tension. The
high-pressure portion of the deflation limb isthought to be controlled by tissue forces, and thelow-pressure portion by surface tension forces.The measurement of the semistatic V-P loop givesa measure of the function of both of these ele-ments of the lung's retractive power.
Studies of pulmonary mechanics using thistechnique are mainly performed on experimentalanimals' lungs as these are the only lungs whichcan be obtained under strictly controlled condi-tions. This is highly desirable in order to minimizechanges occurring as a result of the mode ofdeath, the length of postmortem interval, and thepresence of pathological changes. There is littledoubt that changes in V-P loop characteristics dooccur as a result of the death process and post-mortem delay. These factors have been majordifficulties in the use of human material for thestudy of pulmonary mechanics by this method.Mcllroy (1952), and subsequently Mead and
Collier (1959), showed that much of the variationof results from postmortem human material couldbe attributed more to a failure of standardization
534
copyright. on N
ovember 7, 2021 by guest. P
rotected byhttp://thorax.bm
j.com/
Thorax: first published as 10.1136/thx.31.5.534 on 1 O
ctober 1976. Dow
nloaded from
Post-mortem studies of the semistatic volume-pressure characteristics of infants' lungs
of inflation techniques than to the use of necropsymaterial.The experiments of Gribetz, Frank, and Avery
(1959) showed that the semistatic V-P curve wasa useful tool for studying surfactant abnormalityin newborn human infants using necropsymaterial, while Clements, Brown, and Johnson(1958) have made extensive use of the V-P curvein the elucidation of the role of surfactant in con-trolling alveolar stability. Gruenwald (1961) hasalso carried out many inflation cycles on humaninfants' lungs with apparently reproducibleresults.The main objectives of the present study are
the examination of the deflation limbs of thesemistatic V-P loops obtained from the lungs ofinfants up to 2 years of age (circa 90 cm crown-heel length) to ascertain whether the same growth-related differences occur in the human as havebeen reported previously in experimental animals(Agostini, 1959; Avery and Cook, 1961; Gruen-wald, 1966; Havrankov'a and Kuncova, 1971) andto quantify as far as possible the effects on thedeflation limb of variations in postmortem intervaland experimental technique.
MATERIAL AND METHODS
During routine necropsy the left lung or bothlungs were removed from children of all agesdying from various causes at the Children's Hospi-tal, Sheffield. The bodies had been stored at4°C since death. In most cases the lungs wereinflated immediately after removal, and in everycase within 48 hours of death.
The lungs were not rendered airless before in-flation since the lungs of older children couldnot be degassed without producing interstitialemphysema. Instead, they were weighed in waterand in air before inflation, and the volume of airwas recorded. The specific gravity of the lungtissue was assumed to be 1 062.
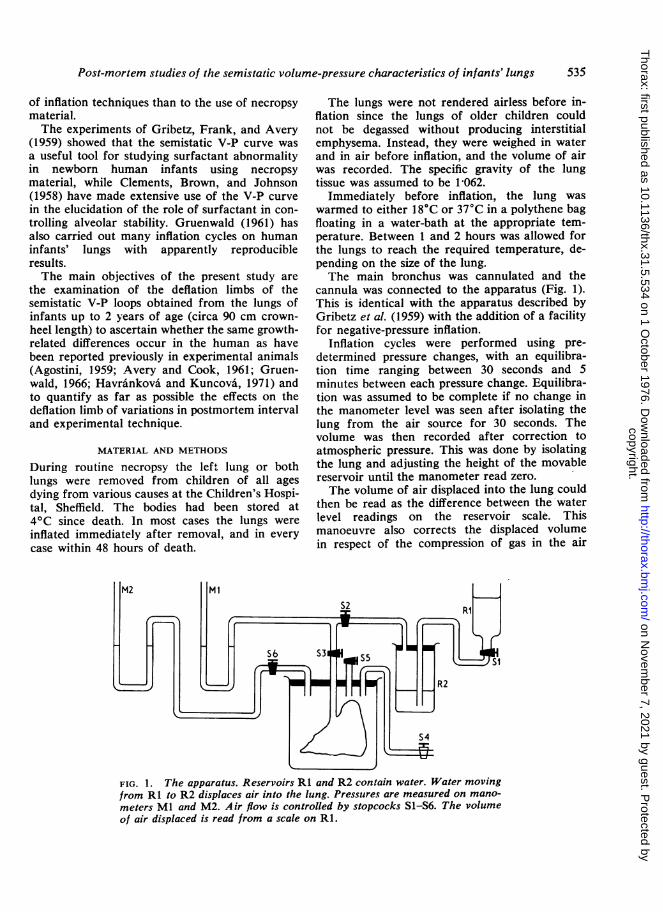
Immediately before inflation, the lung waswarmed to either 18°C or 37°C in a polythene bagfloating in a water-bath at the appropriate tem-perature. Between 1 and 2 hours was allowed forthe lungs to reach the required temperature, de-pending on the size of the lung.The main bronchus was cannulated and the
cannula was connected to the apparatus (Fig. 1).This is identical with the apparatus described byGribetz et al. (1959) with the addition of a facilityfor negative-pressure inflation.
Inflation cycles were performed using pre-determined pressure changes, with an equilibra-tion time ranging between 30 seconds and 5minutes between each pressure change. Equilibra-tion was assumed to be complete if no change inthe manometer level was seen after isolating thelung from the air source for 30 seconds. Thevolume was then recorded after correction toatmospheric pressure. This was done by isolatingthe lung and adjusting the height of the movablereservoir until the manometer read zero.The volume of air displaced into the lung could
then be read as the difference between the waterlevel readings on the reservoir scale. Thismanoeuvre also corrects the displaced volumein respect of the compression of gas in the air
FIG. 1. The apparatus. Reservoirs RI and R2 contain water. Water movingfrom RI to R2 displaces air into the lung. Pressures are measured on mano-meters Ml and M2. Air flow is controlled by stopcocks S1-S6. The volumeof air displaced is read from a scale on Rl.
535
copyright. on N
ovember 7, 2021 by guest. P
rotected byhttp://thorax.bm
j.com/
Thorax: first published as 10.1136/thx.31.5.534 on 1 O
ctober 1976. Dow
nloaded from

D. G. Fagan
reservoir, but does not correct the volume of airin the lung for compression. This correction isperformed later according to Boyle's law.
During inflation cycles the lung was allowed to
hang freely from the cannula exposed to ambientroom temperature. Frequent spraying wishwarmed isotonic saline was necessary to prevent
the pleural surfaces from drying.A pressure of + 30 cmH20 was used as a
standard maximum inflation pressure (P..x).Negative-pressure inflations were carried out by
simply enclosing the lung in a rigid sealed con-
tainer attached to a manometer and a vacuum
pump.
The same inflation and deflation procedure andequilibration times were used regardless of the use
of positive or negative pressure to inflate the lung.Any lung which failed to open completely or
leaked at any stage was excluded from the series.After the V-P studies the lung was fixed, in-
flated with air at different pressure levels, by beingfloated in a closed container filled with 10%formol saline. Thin paper tissues were placedover the surface of the floating lung to preventdrying. The minimum space possible was left be-tween the formol saline and the lid of the con-
tainer. This produced adequate fixation withinthree days for initial block selection, and theselected blocks were post-fixed for a further 24hours. Histological sections were then cut andexamined.Any lung which showed histological evidence of
any pathological change in the lung parenchymawas excluded. Thus all cases of alveolar haemor-rhage, pneumonic consolidation, infarction,fibrosis or interstitial emphysema were totallyexcluded. Evidence of airway obstruction or
occlusion led to exclusion as did any congenitalmalformation of either the lung or the heart andpulmonary vasculature. Cases of respiratory dis-tress syndrome due to surfactant deficiency were
excluded along with focal pulmonary immaturity.The remaining lungs giving satisfactory defla-
tion data and showing none of these pathologicalconditions were designated 'normal'. Lungs were
not excluded for oedema alone.
CONTROLS
Control experiments were carried out to assess theeffects of the following variations in the prepara-
tion of the lung and experimental procedure.Reliable determination of subtle changes in V-P
loop characteristics requires far more controldata in human material than in experimental
animal models as one can control neither thesupply of tissues nor the events preceding theiravailability.The variables studied were:1 The effects of storage at +4°C2 The effect of rendering the lung airless com-
pared to inflating it without degassing3 The temperature at which inflation was
carried out (18°C or 37°C)4 Supporting the lungs5 Inflating the lungs to different maximum
inflation pressures (Pm..)6 Using negative pressure rather than per-
bronchial positive pressure to inflate thelungs
7 The number of cycles performed.Mcllroy (1952) noted that the lung loses air
irregularly after death, and Pattle and Burgess(1961) have warned that the surfactant propertiesmay be rapidly destroyed after death by bothpathological factors and delayed or inadequaterefrigeration.The effects of storage were subdivided into two
periods, that of the delay between death andnecropsy, and between necropsy and inflationstudies. To study this, a series of lungs werestored at 40C for varying lengths of time afternecropsy. Each lung was inflated immediatelyafter necropsy and subsequently after several days'storage. The lungs were only occasionally re-stored to avoid possible alterations in propertiesdue to repeated warming and cooling cycles.On one occasion a lung was left at room tem-
perature overnight before a further inflation cyclewas attempted. Autolysis had proceeded so rapidlythat the lung immediately exhibited massive inter-stitial emphysema at a remarkably low pressure.Overnight storage at room temperature rendersthe lung useless for volume-pressure inflationstudies.
RESULTS
The results are presented as the maximum infla-tion volume (Vn,..) which the lung contained whensubjected to the maximum inflating pressure(Pmrnx). Under standard conditions, Pmax was always+ 30 cmH2O but where higher maximum pressureswere used, +40 cmH2O, the abbreviation P.0 isused. Unless otherwise stated Puta. is always P30.The volumes recorded during deflation are al-
ways expressed as percentages of the Vnax. Forexample, at +5 cmH20, P., the volume, V5, repre-sents the expression: (Volume at +5 cmH20/VmraxX 100/).
536
copyright. on N
ovember 7, 2021 by guest. P
rotected byhttp://thorax.bm
j.com/
Thorax: first published as 10.1136/thx.31.5.534 on 1 O
ctober 1976. Dow
nloaded from

Post-mortem studies of the semistatic volume-pressure characteristics of infants' lungs
J _ ___ _oopB
O 5 10 15Pressure (cm H20)
(a)
20 25 30 0 5 10 15Pressure (cm H20)
(b)FIG. 2. The two curves on each figure are from infants of (a) 88 cm crown-heellength, and (b) 46 cm crown-heel length, presented in absolute volume againstpressure, and proportional volume against pressure.
The volume results are expressed in this pro-
portional manner in order to compare V-P loopdeflation limbs from the lungs of widely varyingcapacities (Fig. 2).
It is emphasized that all volume data presentedwere recorded from the left lung during deflationfrom Vmax.
In total, 172 lungs were studied. Of these, 138gave technically satisfactory V-P loops. A further64 lungs were deleted from the normal series afterhistopathological examination, leaving 74 lungs.Of these, 64 were obtained from infants and child-ren of less than 90 cm crown-heel length. Theselungs constituted the normal series.The results of alterations in technique in respect
of Vma. are shown in Table I. The results of thesame alterations in technique in respect of V5 areshown in Table II.
The results are presented as the mean differ-ences between two successive inflation/deflationcycles with the condition changes as specified be-tween the two cycles. The differences shown inTable II are those obtained during deflation.
In some control comparisons, conditions were
held constant between the first and second cycles,and others between the second and third cycles.
TABLE IMAXIMUM INFLATION VOLUME (Vmax) CONTROLS
% MeanDifferences between No. of Change SD
Lungs in Vmax
Pmax constantI st/2nd inflation, both at 18°C 20 +4-4 ±2 9Ist/2nd, both at 37°C 20 +4-0 ±3 42nd/3rd, regardless of temperature 18 +1 -8 ± 15
T (°C) constant. Pm.x constantIst/2nd cycle, lung airless before
inflation 10 +10-7 :912nd/3rd, lung supported 6 +P10 i1 0Negative/positive pressure cycle 11 + 1 2 ± 3 96
T °C) constant±30 cmH,O cycle/+40 cmH,O cycle 17 + 100 ±3-3+40 cm/+30 cm 12 -4X0 ±2-1+30 cm/+25 cm 9 -03 ±1I9
The controls were carried out by changing the conditions for the nextinflation cycle. The results are presented as the changes between thetwo cycles expressed as percentages of the Vmax of the second controlcycle.
Temperature at initial inflation is always 370Cunless otherwise stated.The results of repeating the volume-pressures
studies at different time intervals after death areshown in Figure 3.
Figure 4 shows the regression equation forcrown-heel length cubed (CH3) against the maxi-mal inflation capacity of the left lung, Vmax. The
E
E>
150
100
50' I(. --
537
copyright. on N
ovember 7, 2021 by guest. P
rotected byhttp://thorax.bm
j.com/
Thorax: first published as 10.1136/thx.31.5.534 on 1 O
ctober 1976. Dow
nloaded from

D. G. Fagan
TABLE IILOW-PRESSURE AIR-RETENTION CONTROLS
% MeanDifferences between No. of Change SD
Lungs in V,
Pmax constantlst/2nd, 18'C 20 +2-4 ±2-0lst/2nd, 37'C 20 +1-9 ±1-42nd/3rd, all temps 17 +0-3 ±1-4
T(C) constant Pmax constantlst/2nd cycle, lungs airless before
inflation 9 +2-4 +2-62nd/3rd, lungs supported 6 +0-4 ±0-5Negative/positive pressure cycles 13 +0-7 +2-2
T ('C) constant+30cm/+40cmH2O 18 +1-2 ±2-9+40cm/+30cmH2O 13 +1-6 +4-7+ 30 cm/+ 25 cmH,O 14 +0-5 ±1-9
80-
70-E
_! 60v
I0,P,x 50
40-6.3-30-o0
The mean change in low pressure air retention is the mean of thenumerical difference between the two values obtained, since this indexis already expressed as a percentage of the Vmax.
90-
80-
70-
60--0 50-
40-
30-
20-
10-
20-
10-
e) I
0 100 200 300 400 500 660Volume (ml)
FIG. 4. The regression equation y=8XCH3X 10 4-25ml, r=0-965, +2 SD where y=(L) lung volume, CH=crown-heel length.
100-
80-
60-
0 2 4 6 8 10 12 14 16 18Total days storoqe at 40C
FIG. 3. The Vi, (V at Ps/VmaxX1OO%) value obtainedbefore and after storage at 4'C for varying time inter-vals. The interval behveen day 0 and the first inflationindicates the interval between death and the firstinflation.
*~~~~~~~~**. a. a| W.30
40130 40 50 60Crown-heel lenqth (cm)
70 80 90
FIG. 5. The V5 value is plotted against the crown-heel length to demonstrate the change with growth.The mean points indicated are the means shown inTable V. The line joining these means differs from astraight line, P<0-001.
equation: Y=8x-25 ml, where X=CH3X10-4and Y=VV..X has a correlation coefficient r=0 965.One other correlation coefficient calculated wasY=31-1 W-6-7 ml where W=body weight andY=Vmax, correlation coefficient r=0-88.
Figure 5 shows the results of plotting theproportion of Vmax remaining in the lung at +5cmH2O (V5) against the crown-heel length.
Figure 6 shows the mean deflation curves ob-tained from the results grouped according tocrown-heel length. The details of the groups areshown in Tables V and VI.
STA'rISTICS
Most of the lungs in the normal series were in-flated by the standard technique resulting fromthe control studies, that is, that the second cyclewas designated the index cycle, and the Pmax wasset at +30 cmH2O.
For some lungs, therefore, these variations oftechnique required application of a correctionfactor to individual values: these factors areshown (Tables III and IV).
538
copyright. on N
ovember 7, 2021 by guest. P
rotected byhttp://thorax.bm
j.com/
Thorax: first published as 10.1136/thx.31.5.534 on 1 O
ctober 1976. Dow
nloaded from

Post-mortem studies of the semistatic volume-pressure characteristics of infants' lungs
x O'
0°70-a,0
c40.
vw0
°50-E
:gAn
30-
20
A---B
C---
0 12-5 5 10Pressure (cm H20)
20
FIG. 6. The mean deflation limb curves from groupsA, B, C, and D (Table V) are shown plotted from+20 cmH20 down. The curves are virtually commonbetween +30 and +20 cmH20, the main growth-related changes lying between +5 and +1 cmH20.These deflation curves shift to the right with increasingstature when plotted in the proportional manner, butin absolute values the curves shift to the left.
TABLE IIIMAXIMAL INFLATION CORRECTION FACTORS
Y. Correction VarianceCondition N (Table I) (Table I)
1st inflation at 18°C 16 +4-4 ±8-411st inflation at 37°C 3 +40 A11562nd inflation (index) 38 - _3rd inflation 7 -1*8 ±2-25
TABLE IVLOW PRESSURE AIR RETENTION (Vj)
CORRECTION FACTORS
% Correction VarianceCondition N (Table II) (from Table II)
1st inflation at 18'C 16 +2-4 ±4-01st inflation at 37°C 3 +P19 ±1-962nd inflation (index) 38 -
3rd inflation 7 -03 +1*96-
Table IV sets out the required corrections forlow-pressure air retention.The correction factors applied are taken from
Tables I and II and the confidence interval aroundeach individual value of all the data corrected asshown in Tables III and IV was calculated fromthe equation:
S= / (n1-1)S12+(n21)S22 +, * (n.-I)S.2V (n1-1)+ (n2-1')+' -(nx-1)
Where S=the mean standard deviation. The meanstandard deviation for all individual Vmax values=
-1 65%, and the mean standard deviation for allindividual V5 values +-, + 1 12%. Since the stan-dard error=
V/ N,-1
where N, =the total number of cases, then the95% confidence interval around each correctedindividual value =+40 2% for Vmax values and-=0-14% for V. values.The data shown in Fig. 5 were examined to
determine whether the mean would be best ex-pressed as a straight line or as a curve with a formresembling the line joining the arithmetic meansshown in Figure 5.The equation: V/V1n..XI0O% at P., V5,
4-3575+521 22 (CH)-0 10691 (CH2)+ 0-00063194(CH3) gave the standard error of the estimate,4-0, where CH=crown-heel length. When this iscompared to mean V5 value of 71-5%, standarddeviation of 81 (where N=64), the cubic regres-sion equation provides a 'better' fit to the datasince the standard deviation is significantly greaterthan the standard error of the estimate, P<0001.
DISCUSSION
The results from both Tables I and II in respectof the first cycle at either 180C or 370C show thatthe first cycle is not reproducible within acceptablelimits, and that there is a big gain in reproduci-bility by repeating the cycle three times at 180Cor twice at 370C.Rendering the lung airless before inflation
studies is seen to be a pointless manoeuvre sinceit does not improve reproducibility and may causeinterstitial emphysema during the degassing pro-cess, leading to wastage of material. Weighing thelung in air and water before inflation is a harmlessway of estimating the initial air content of thelung.
Table III sets out the required corrections formaximum inflation volume.
539
vt
copyright. on N
ovember 7, 2021 by guest. P
rotected byhttp://thorax.bm
j.com/
Thorax: first published as 10.1136/thx.31.5.534 on 1 O
ctober 1976. Dow
nloaded from

D. G. Fagan
Supporting the lung during inflation may im-prove reproducibility, but curves from these lungswere already highly reproducible. It is probablyworth supporting the lung if subsequent saline in-flation studies are to be attempted.The loops produced by negative-pressure infla-
tion did not appear to differ significantly frompositive-pressure inflation, and there was noworthwhile gain in reproducibility.An important point is the effect of variations of
Pnax on the Vmax and the low-pressure air reten-tion. It is hardly surprising that variations of Pmaxhave a profound effect on V..x, but it is less obvi-ous and indeed rather surprising that there is alesser effect on the low-pressure air retention, indi-cated by the V. value.
This is highly relevant since it implies that theselection of a Pmrax value is critical when studyingthe changes in V..ax related to growth, and in com-paring data from other authors' communications.On the other hand, the Pmax value is not, within
limits, a critical value in respect of V5. Data fromthe other authors" series can therefore be regardedas comparable, within limits, although the Pmaxmay have varied. It also means that it is not neces-sary, again within certain limits, to insist on afixed Pm.x for all lung specimens, and one may usefixed-volume steps with records taken of thevarying resultant pressures.
This is also important because measurement ofpressure is inherently more accurate thanmeasurement of volume when visual methods areused, especially when the volume range runs from10 ml to 2000 ml. If the volume is read accuratelyto -+0-25 ml then this represents an intrinsic errorof up to 5% in the small volume range, while it isquite reasonable to measure pressure to within+0 05 cmH2O giving an intrinsic error up to 1%.If the investigator proceeds with fixed-volumesteps, then a much greater accuracy in volumemeasurement is possible.
Notwithstanding the comments above, it maybe necessary to use a fixed Pma. if it is concludedthat this is an essential for the aims of the project,but a lower volume accuracy may be the penalty.
In Fig. 3, the results of measuring the V-P loopat different time intervals after death are shown.Although it is claimed that surfactant remainsstable for prolonged periods under refrigeration(and surfactant is thought to be the main agentcontrolling the low-pressure air retention), it isnoticeable that there was usually a steady declinein V5 in direct relation to the duration of storage.The observation that V, of the surfactant-deficient
lung improved with storage is not immediatelyexplicable.The effect of storage on the V..ax was irregular
but within the limits of variation due to the otherfactors described in Table I.
In summary, it can be seen that the two mostimportant factors in the design of a reproduciblemultipurpose lung cycling procedure are the num-ber of cycles studied (at least two, preferably threeare necessary), and the fixing of a Pmax.The data presented in Figs 4 and 5 are limited
to 90 cm crown-heel length in the present com-munication. A further 10 cases up to 152 cm bodylength were studied, but although technicallysatisfactory they have not been included as thelarge bulk of material was from smaller infants,and more detailed studies of the whole age rangeare being undertaken.The regression equation relating Vm.a to body
length shows the expected high correlation withthe cube of body length (Fig. 4).When the observed mean values for Vmax are
compared to predicted total lung capacity (TLC)values, reduced by a factor of 0-45 to comparewith the present data obtained from the left lungalone, a divergent trend emerges. The predictedvolume of the lung (L) in premature newbornsand infants (groups A and B, Table VI) compareswell with the observed mean Vmax, while the pre-dicted values for groups C and D are some 20%below the mean V.,.X. The regression equationused was: -V=3 XL28X 10-3, where V=total lungcapacity, and L= whole body length (Helliesenet al., 1958). This equation is sex independent.Although there may be some discrepancy betweenthe in-vivo measurement of L and the measure-ment made at necropsy, the measurement atnecropsy is usually higher than that obtained in-vivo. This should tend to reduce the differencesbetween observed and predicted values ratherthan to cause them.The regression equation of Helliesen et al.
(1958) was derived from data from children andyoung adults, over 5 years of age, but if the varia-tions were due to age differences it is both sur-prising and significant that the values are so closein premature and full-term infants but vary in theother groups.The regression equation calculated by Eng-
strom, Karlberg, and Kraepelien (1956) produces asimilar discrepancy between the means of the fourgroups and the predicted volumes, differing slightlyin extent but not in direction of deviation.
It seems improbable that the factor of 0 45
540
copyright. on N
ovember 7, 2021 by guest. P
rotected byhttp://thorax.bm
j.com/
Thorax: first published as 10.1136/thx.31.5.534 on 1 O
ctober 1976. Dow
nloaded from

Post-mortem studies of the semistatic volume-pressure characteristics of infants' lungs
applied to reduce the TLC to a figure comparableto the Vm.. of the left lung could be sufficientlyinaccurate to account for this difference since thepartition coefficient left: right would have to in-crease from 0 45: 0 55 to circa 07: 0 3 to accountfor the observed discrepancy.Attempts to assess whether the Vmax results in
the present series of newborn infants were com-
parable to the results obtained by others haveproved fruitless. All other authors using isolatedhuman lungs have not presented their data in a
fashion which enables detailed comparisons to bemade. In general terms, however, using figures ofml/kg body weight or other related variables, theresults do seem broadly comparable with the otherauthors' results in the newborn period.The choice of a Pm.. is a critical question, since
the Vm.. is obviously closely related to this value.However, volume is not uniformly related to pres-
sure over the whole of the inflation range. In Fig.2, the inflation limb can be seen to consist of twophases, low and high transpulmonary pressures
where the volume is not sensitive to pressure
change, connected by a rapid filling phase whenthe volume is very sensitive to pressure change.Provided the Pmax is at a level where it is clearlyin the low compliance area above the rapid fillingphase, and +30 cmH2O is definitely in this area,
the Vmax is relatively insensitive to the final Pmaxchosen.
This point has been well demonstrated (Salazarand Knowles, 1964, Glaister et al., 1973), and isthe basis of a further possible explanation of thedivergence; that is, that the pressure required toapproach the asymptote of the inflation limb ofthe V-P loop (as defined by the use of exponentialequations such as that of Salazar and Knowles(1964)) falls sharply with the growth over the 50-60 cm body length range. In simple terms, that a
fixed P.10. of +30 cmH2O is distending the olderinfants' lungs to a higher point in the V-P diagram
than in infants; or again, that the Pmas required toinflate the lungs to a volume comparable to TLCin vivo falls after early infancy.Whichever explanation is correct, the compari-
son between the predicted and observed Vmax sug-
gests that the thoracic cavity in vivo could be saidto limit the lung's potential capacity beyond earlyinfancy. More study is required to choose betweenthese several possibilities.The fall in V, between newborn and adult indi-
viduals has been reported previously in experi-mental animals (Agostini 1959; Avery and Cook,1961; Gruenwald, 1966; Havrankova and Kun-cova, 1971) and man (Gruenwald, 1966; Fagan,1969; Zapletal, Misur, and Samenek, 1971). Stigol,Vawter, and Mead (1972) failed to support thesefindings in a study which is open to criticism on
three points. They examined 17 whole lungs and10 portions of lungs obtained at necropsy fromindividuals ranging from a premature infant to a
23-year-old adult. Only four whole lungs were
examined in the body length range of 40-60 cmin which the major changes in deflation limboccur (Fig. 5; Table V). Their numbers are quiteinadequate to differentiate between a straight lineand the expression shown above when the resultsall fall within the same range.
Further, all the four whole lungs as well as twoof the lung portions used in this body size rangewould have been excluded from the present seriesbecause of significant pathological abnormalitieswhich could very well affect the surfactant or
mechanical properties of the lung (pneumonia(Pattle and Burgess, 1961); congenital heartdisease (Bates and Christie, 1964; Johnson et al.,1964; Howlett, 1972)). This leaves only a portionof one lung in this body length range which mightbe considered normal.
Their technique varied considerably from allprevious authors' work in using a Pm.. of only+ 20 cmH2O, whereas all previous workers have
TABLE VRESULTS GROUPED INTO FOUR SUBGROUPS ACCORDING TO BODY LENGTH
A B C D
Body length (cm) 30-45 46-55 56-65 66-90Number of cases 8 26 15 1 5Mean gestational age (wk) 33-71 ±5 22 39+2-45 - -
Mean postnatal age 13 d 26 d 4-4 mth 16 mthMean Vo(%) 9740 ±15 9620±1 4 96-10±1-6 96 30±1t5Mean V,, 89-30i2-1 87 60±2 5 82-40±4-4 81-70±4d1Mean V, 81*0 ±2-2 77 40±4*1 6560±3-8 62-30±2*5Mean V,., 7140±3-7 6110±8 4 48-30i±52 43-40±4-6Mean V,.. 50-90±7-8 41*10±7-4 32*0 ±6-6 32*90±5*0Mean Ve 19*70±4-4 23-60±91 18*70±7-3 22-20±7-0
The mean values for air retention during deflation are presented as percentages of the Vmsx. All ranges shown are the standard deviation.
541
copyright. on N
ovember 7, 2021 by guest. P
rotected byhttp://thorax.bm
j.com/
Thorax: first published as 10.1136/thx.31.5.534 on 1 O
ctober 1976. Dow
nloaded from

D. G. Fagan
used between +25 cmH2O and +40 cmH2O. Theuse of a P... of only +20 cmH20 gives seriousproblems in interpretation because, as has beendiscussed above, this pressure lies squarely in therange of maximum volume sensitivity to pressure.
Salazar and Knowles (1964) and Glaister et al.(1973) have shown that the form of the deflationlimb of the V-P loop depends largely on whetherthe Pmax exceeds the rapid filling phase or not. Ifthe rapid filling phase is exceeded, the results inTables I and II in respect of Vmax and V5 showthat increasing the Pmax from + 30 cm to + 40 cmmay increase the Vmax by between 6% and 13%,but it only produces a change of up to 4% in theV5 value. Thus, if Pn2ax exceeds the rapid fillingphase, the low-pressure air retention, and there-fore the form of the curve, change to a lesserdegree than if the rapid filling phase is notexceeded.The rapid fall in early postnatal life is also
reflected in the V2.5 and V, values, although therate of change between groups A and D (Table V)is different for each of V5, V2.5, and V1.o. Itwould appear that the V2.5 value falls most, andin Table VI the V2.5 is compared to the in-vivopredicted total gas volume (TGV) at functionalreserve capacity (FRC), again reduced by a factorof 0-45 to compare predicted (L) lung capacitywith V2.5 (observed).The TGV at FRC has been calculated by sub-
stituting the mean body length and weights fromgroups A, B, C, and D in the regression equationsof Phelan and Williams (1969), Doershuk et al.(1970), and Howlett (1972) relating to physicalindices of growth, with a correlation coefficient,r>0 92. The predicted TGV at FRC value shownin Table VI is the mean of these equations. InTable VI, this value has been divided by theVmax (observed) and, to allow for any unwarrantedassumption in the observed Vmax data, it has also
been divided by the predicted Vmax value obtainedfrom the combined sex regression equation ofHelliesen et al. (1958).
It is notable that, using both the observed Vma.data and the predicted Vmax data, the TGV atFRC: TGV at TLC ratio shows a similar fall be-tween groups A, B, C, and D and that the ratioTGV at FRC (predicted): Vmax (observed) followsthe fall in V2., more closely than the V5 or V1.0.In a previous communication (Fagan, 1969),
the data were presented in such a form that itappeared that the V0 might fall with increasingbody length. Stigol et al. (1972) failed to find acorrelation between body length and V0. Table Vshows the complete V-P data down to V0. A nega-tive phase of endobronchial pressure was not ap-plied to these lungs, and the data shown as V0 inTable V refer to passive collapse lung volume only.No convincing trend is seen relating V0 to
whole body length when examined in the propor-tional manner. It should be noted that this meansthat the volume of air in the lung at transpul-monary pressure zero in absolute terms increasesin the same fashion as the Vmax in absolute terms(Fig. 4). This suggests that the anatomical factorsresponsible for the Vm.. and V0 differ from thefactors governing the low-pressure air retentionrange, V-, to V1.0.
This paper presents part of the work submitted as anMD thesis to the University of Cambridge.
Part of the work was financed by a grant from theEndowment Fund of the United Sheffield Hospitals.My grateful thanks are due to Professor J. L. Emery
for his advice and encouragement, to Miss E. Swannof the Department of Biostatistics, Hospital for SickChildren, Toronto for her statistical advice, and toMr. M. Starr for the preparation of the figures.
TABLE VI
A B C D
Mean body weight (kg) 1x69±0 57 3*13+0 75 5-68± 1-12 941l+ 2-72Mean body length (cm) 41-25 ±4-43 50-35 ±2'48 61-13- 2-42 7533 ± 5-92Mean Vmax (observed) (ml) 42-38±15-4 79-1 ±30 9 170-1 ±30-1 316-9 ±111P4Mean Vmas (predicted) (ml) 45 0 78x7 135x5 243-13
Ratio mean Vmax predicted 1 06 099 0-80 0 77observed
Predicted TGV at FRC x 0 45 (ml) 30-5 47-9 74-4 124 2Ratio TGV at FRC:Vmax observed 0-72 0-60 0 44 0139Ratio TGV at FRC:Vmax predicted 0-68 0-61 0 55 0X51V2.5 (observed) 0X71 0-61 0-48 0 43
The predicted TGV at FRC value is the mean value derivedfrom the equations ofPhelan and Williams (1969), Doershuk et al. (1970), and Howlett(1972) with regression coefficients r > 0-92. The predicted Vmns value is derived from the equation V= 3 x LI"8 x 10⁻³of Helliesen et al. (1958),reduced by a factor of 0*45 to compare with Vmaz values of the left lung. All ranges shown are the standard deviation.
542
copyright. on N
ovember 7, 2021 by guest. P
rotected byhttp://thorax.bm
j.com/
Thorax: first published as 10.1136/thx.31.5.534 on 1 O
ctober 1976. Dow
nloaded from

Post-mortem studies of the semistatic volume-pressure characteristics of infants' lungs
REFERENCES
Agostini, E. (1959). Volume-pressure relationships ofthe thorax and lung in the newborn. Journal ofApplied Physiology, 14, 909.
Avery, M. E. and Cook, C. D. (1961). Volume-pressurerelationships of lungs and thorax in fetal, new-
born and adult goats. Journal of Applied Physi-ology, 16, 1034.
Bates, D. V. and Christie, R. V. (1964). Respiratoryfunction in disease. Saunders, Philadelphia.
Clements, J. A., Brown, E. S., and Johnson, R. P.(1958). Pulmonary surface tension and the mucuslining of the lungs: some theoretical considera-tions. Journal of Applied Physiology, 12, 262.
Doershuk, C. F., Downs, T. D., Matthews, L. W., andLough, M. D. (1970). A method for ventilatorymeasurements in subjects 1 month to 5 years ofage: normal results and observations in disease.Pediatric Research, 4, 165.
Engstrom, I., Karlberg, P., and Kraepelien, S. (1956).Respiratory studies in children. 1. Lung volumesin healthy children 6-14 years of age. ActaPaediatrica (Uppsala), 45, 277.
Fagan, D. G. (1969). Functional development of thehuman lung. In The Anatomy of the DevelopingLung, edited by J. L. Emery, p. 191. Heinemann,London.
Glaister, D. H., Schroter, R. C., Sudlow, M. F., andMilic-Emili, J. (1973). Bulk elastic properties ofexcised lungs and the effect of a transpulmonarypressure gradient. Respiration Physiology, 17, 347.
Gribetz, I., Frank, N. R., and Avery, M. E. (1959).Static volume-pressure relations of excised lungsof infants with hyaline membrane disease, new-born and stillborn infants. Journal of ClinicalInvestigation, 38, 2168.
Gruenwald, P. (1961). Normal and abnormal expan-sion of the lungs of newborn infants obtained atautopsy. Anatomical Record, 139, 471.
Gruenwald, P. (1966). Effect of age on surface pro-perties of excised lungs. Proceedings of theSociety of Experimental Biology, 122, 388.
Havrankova, J. and Kuncova, M. (1971). Der Einflussdes Korpergewichtes auf die statischen Druck-volumen-Diagramme isolierter Rattenlungen.Respiration, 28, 186.
Helliesen, P. J., Cook, C. D., Friedlander, L., andAgathon, S. (1958). Studies of respiratory physi-ology in children. 1. Mechanics of respiration and
lung volumes in 85 normal children 5-17 yearsof age. Pediatrics, 22, 80.
Howlett, G. (1972). Lung mechanics in normal infantsand infants with congenital heart disease. Archivesof Disease in Childhood, 47, 707.
Johnson, J. W. C., Permutt, S., Sipple, J. H., andSalem, E. S. (1964). Effect of intra-alveolar fluidon pulmonary surface tension properties. Journalof Applied Physiology, 19, 769.
Mcllroy, M. B. (1952). The physical properties of nor-mal lungs removed after death. Thorax, 7, 285.
Mead, J. (1961). Mechanical properties of lungs. Physi-ological Reviews, 41, 281.
Mead, J. and Collier, C. (1959). Relation of volumehistory of lungs to respiratory mechanics inanesthetized dogs. Journal of Applied Physiology,14, 669.
von Neergaard, K. (1929). Neue Auffassungen ubereinen Grundbegriff der Atemmechanik. Zeit-schrift fur die gesamte experimentelle Medizin,66, 373.
Pattle, R. E. and Burgess, F. (1961). The lung liningfilm in some pathological conditions. Journal ofPathologyy and Bacteriology, 82, 315.
Phelan, P. D. and Williams, H. E. (1969). Ventilatorystudies in healthy infants. Pediatric Research, 3,425.
Radford, E. P. Jr (1957). Recent studies of mechanicalproperties of mammalian lungs. In Tissue Elasti-city, edited by J. W. Remington, p. 177. Ameri-can Physiological Society, Washington, D.C.
Salazar, E. and Knowles, J. H. (1964). An analysis ofpressure-volume characteristics of the lungs.Journal of Applied Physiology, 19, 97.
Stigol, L. C., Vawter, G. F. and Mead, J. (1972).Studies on elastic recoil of the lung in a pediatricpopulation. American Review of RespiratoryDisease, 105, 552.
Zapletal, A., Misur, M., and Samanek, M. (1971).Static recoil pressure of the lungs in children.Bulletin de Physio-Pathologie Respiratoire(Nancy), 7, 139.
Requests for reprints to: Dr. D. G. Fagan, Depart-ment of Pathology, Hospital for Sick Children, 555University Avenue, Toronto, Ontario, Canada M5G1X8.
541
copyright. on N
ovember 7, 2021 by guest. P
rotected byhttp://thorax.bm
j.com/
Thorax: first published as 10.1136/thx.31.5.534 on 1 O
ctober 1976. Dow
nloaded from