post-election economic and revenue outlook · post-election economic and revenue outlook terry...
TRANSCRIPT

POST-ELECTION ECONOMIC AND REVENUE OUTLOOK
Terry Rephann Center for Economic and Policy Studies
Thomas Jefferson Planning District Public Service Training Program December 13, 2012

Outlook Outline • National Economic Trends
• Planning District Recent Economic Performance
• Planning District Tax Revenue Trends
• The Fiscal Cliff • State Fiscal Cliff Impacts • Planning District Fiscal Cliff Impacts
• Conclusions

National Economic Trends

Gross Domestic Product Components
• Gross Domestic Product (GDP). Total Value of Goods and Services Produced in the United States
• GDP=C+I+G+(X-M) • C= Personal Consumption • I=Investment • G=Government Expenditures • X-M= Net Exports
Expenditures
-5 0 5 10
Personal Consumption
Investment
Government
Exports
Imports
Trillions ($)

Components of GDP Growth
-10
-8
-6
-4
-2
0
2
4
6
-10
-8
-6
-4
-2
0
2
4
6
2007 2008 2009 2010 2011 2012
Personal consumption
Structures
Equipment and software
Residential
Inventories
Net exports
National defense
Nondefense
State and local
GDP Source: Bureau of Economic Analysis

Contribution of Residential Investment to GDP Growth
-2
-1.5
-1
-0.5
0
0.5
1
2007 2008 2009 2010 2011 2012
Source: Bureau of Economic Analysis

Contribution of Federal Government Expenditures to GDP Growth
-1
-0.5
0
0.5
1
1.5
2007 2008 2009 2010 2011 2012
Source: Bureau of Economic Analysis

Contribution of Personal Consumption Expenditures to GDP Growth
-4
-3
-2
-1
0
1
2
3
2007 2008 2009 2010 2011 2012
Source: Bureau of Economic Analysis

Federal Reserve Assets
0
0.5
1
1.5
2
2.5
3
3.5
2007 2008 2009 2010 2011 2012
Trill
ions
($)
Other
Support for Specific Institutions All Liquidity Facilities
Securities Held Outright
Source: Federal Reserve
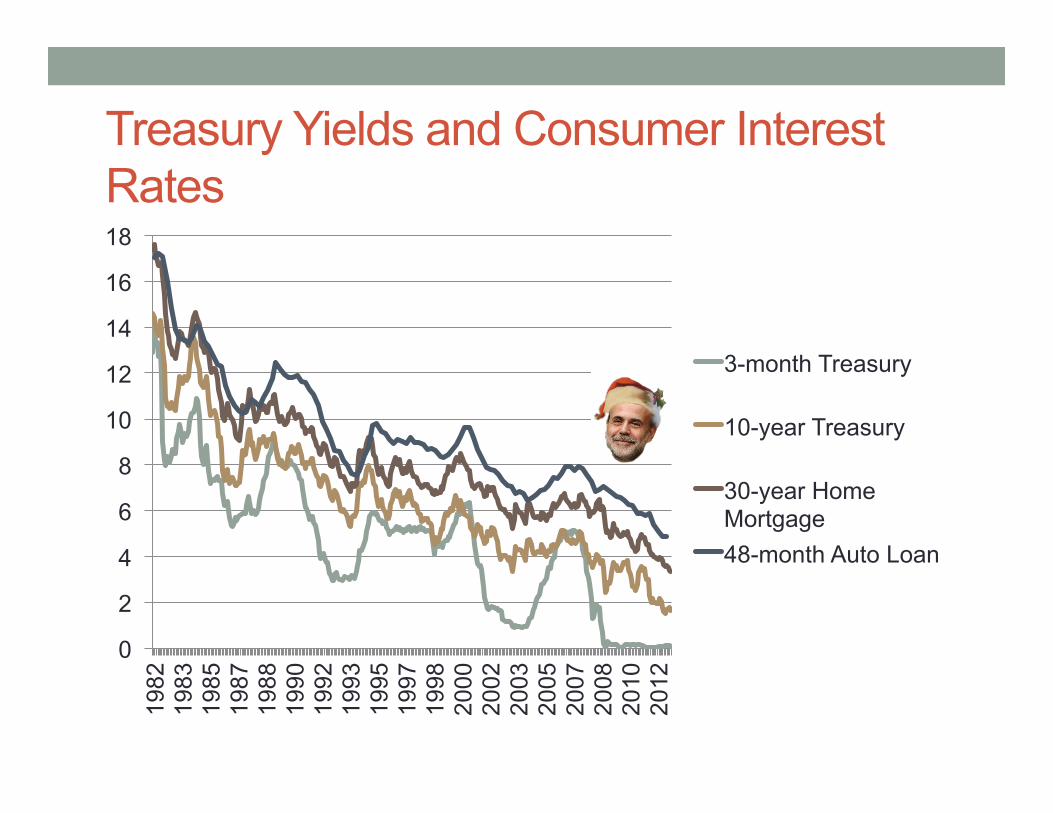
Treasury Yields and Consumer Interest Rates
0
2
4
6
8
10
12
14
16
18
1982
19
83
1985
19
87
1988
19
90
1992
19
93
1995
19
97
1998
20
00
2002
20
03
2005
20
07
2008
20
10
2012
3-month Treasury
10-year Treasury
30-year Home Mortgage 48-month Auto Loan

Private Balance Sheet Repair • Household debt has decreased • Debt payoff • Defaults
• Asset values have increased • Real Estate is no longer
a drain on wealth • Stock and bond markets
have been relatively buoyant

Public Balance Sheet Disrepair • Absent Major Reforms,
Federal Debt reaches 90 percent of GDP in 2021 • Reinhart and Rogoff (2011).
Above 90 percent, median growth roughly 1 percent lower; average growth almost 4 percent lower
• Federal Debt reaches 100 percent of GDP in 2024
• Budget Control Act of 2011 (Sequestration) alone doesn’t control the debt
Federal Debt as % of GDP without Changes
0 20 40 60 80
100 120 140 160 180 200
2000
20
04
2008
20
12
2016
20
20
2024
20
28
2032
20
36
Allow Fiscal Cliff
Suspend Fiscal Cliff
Source: Congressional Budget Office

Thomas Jefferson Planning District Recent Performance
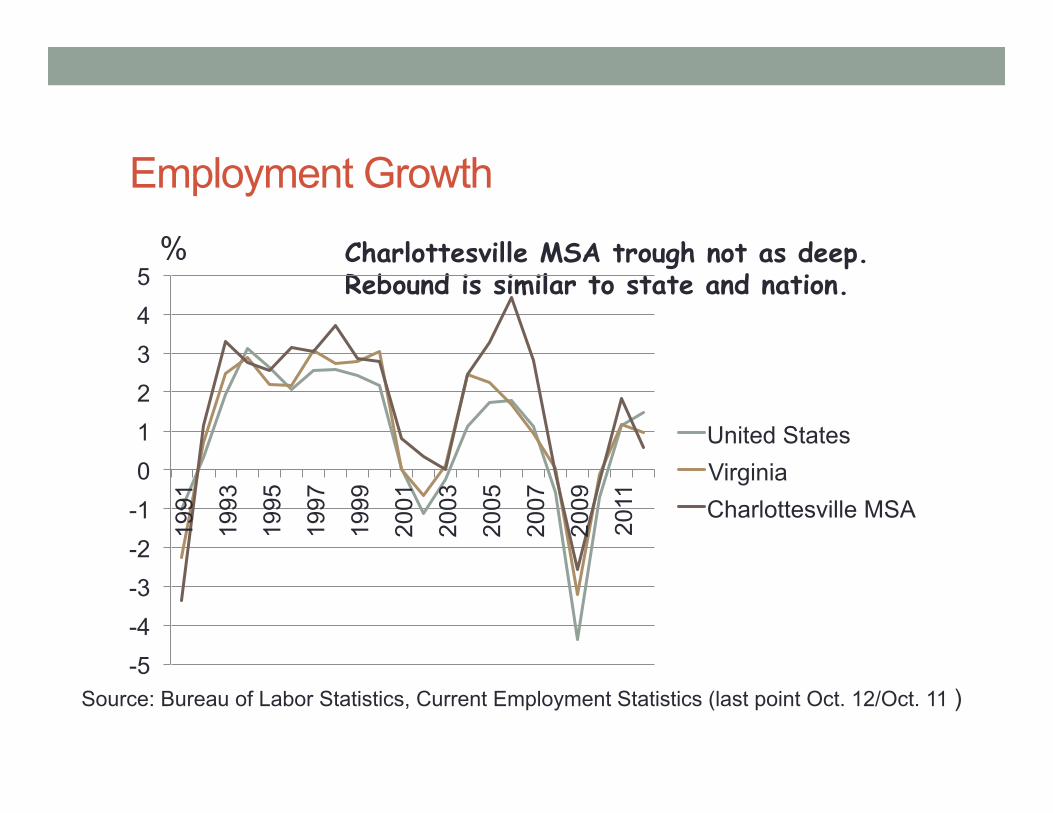
Employment Growth
Source: Bureau of Labor Statistics, Current Employment Statistics (last point Oct. 12/Oct. 11 )
% Charlottesville MSA trough not as deep. Rebound is similar to state and nation.
-5 -4 -3 -2 -1 0 1 2 3 4 5
1991
1993
1995
1997
1999
2001
2003
2005
2007
2009
2011
United States Virginia Charlottesville MSA

Unemployment Rate
Source: Bureau of Labor Statistics (last point in October 2012)
% TJPD unemployment rate spread with Virginia has grown in recovery.
0
2
4
6
8
10
12
United States Virginia TJPD

Thomas Jefferson Planning District Unemployment and Poverty Rates
0
2
4
6
8
10
12
14
Povery Rate Unemployment Rate
Source: Bureau of Labor Statistics and U.S. Census Bureau
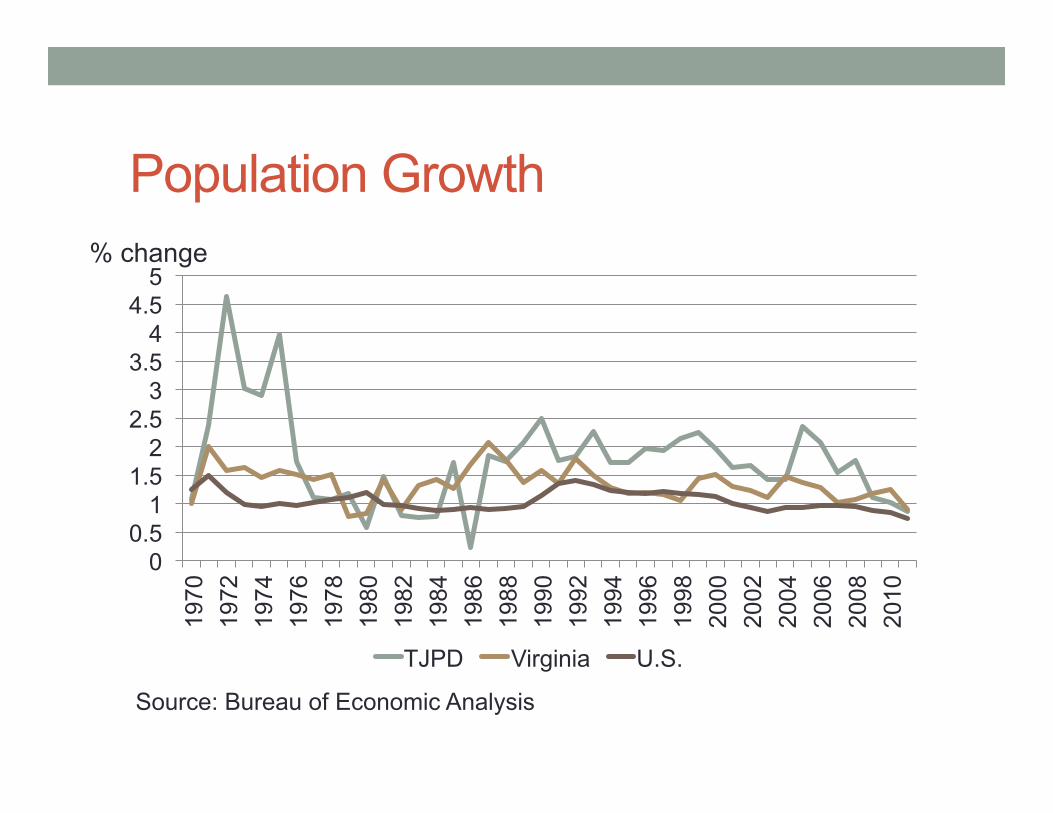
Population Growth
0 0.5
1 1.5
2 2.5
3 3.5
4 4.5
5
1970
19
72
1974
19
76
1978
19
80
1982
19
84
1986
19
88
1990
19
92
1994
19
96
1998
20
00
2002
20
04
2006
20
08
2010
TJPD Virginia U.S.
% change
Source: Bureau of Economic Analysis

Per Capita Income Compared to U.S
80
85
90
95
100
105
110
115
1969
19
71
1973
19
75
1977
19
79
1981
19
83
1985
19
87
1989
19
91
1993
19
95
1997
19
99
2001
20
03
2005
20
07
2009
20
11
Virginia TJPD
Source: Bureau of Economic Analysis
% of U.S.

Intraregional Per Capita Income Convergence
50
60
70
80
90
100
110
120
1969
19
72
1975
19
78
1981
19
84
1987
19
90
1993
19
96
1999
20
02
2005
20
08
2011
Albemarle & Charlottesville Fluvanna
Greene
Lousia
Nelson
Source: Bureau of Economic Analysis
% of U.S.

Retail Sales: Local Option Sales Tax
-10
-5
0
5
10
15
Jan-
01
Oct
-01
Jul-0
2 A
pr-0
3 Ja
n-04
O
ct-0
4 Ju
l-05
Apr
-06
Jan-
07
Oct
-07
Jul-0
8 A
pr-0
9 Ja
n-10
O
ct-1
0 Ju
l-11
Apr
-12
% 1
2 M
onth
Cha
nge
Virginia TJPD
Retail sales rebound.
Source: Virginia Department of Taxation, 12 month moving average

Building Permits % of 2000 Census single unit detached housing units . . . .
Source: U.S. Census Bureau (2012 estimated based on Jan.-Oct.)
0 0.5
1 1.5
2 2.5
3 3.5
4 4.5
1996
19
97
1998
19
99
2000
20
01
2002
20
03
2004
20
05
2006
20
07
2008
20
09
2010
20
11
2012
United States Virginia TJPD
Housing construction pickup not as pronounced as VA, US

Building Permits by Locality
0
500
1,000
1,500
2,000
2,500
1996
19
97
1998
19
99
2000
20
01
2002
20
03
2004
20
05
2006
20
07
2008
20
09
2010
20
11
2012
Other Louisa Greene Fluvanna Albemarle
Source: U.S. Census Bureau (2012 estimated based on Jan.-Oct.)

Building Permits by Locality
0% 10% 20% 30% 40% 50% 60% 70% 80% 90%
100%
1996
19
97
1998
19
99
2000
20
01
2002
20
03
2004
20
05
2006
20
07
2008
20
09
2010
20
11
2012
Other Louisa Greene Fluvanna Albemarle
Source: U.S. Census Bureau (2012 estimated based on Jan.-Oct.)
% of District Total

Housing Price Changes
Source: Federal Housing Finance Agency
% annual change
-10
-5
0
5
10
15
20
25
1984
19
85
1986
19
87
1988
19
89
1990
19
91
1992
19
93
1994
19
95
1996
19
97
1998
19
99
2000
20
01
2002
20
03
2004
20
05
2006
20
07
2008
20
09
2010
20
11
2012
United States Virginia Charlottesville MSA
Housing prices are stabilizing

TJPD Employment Change, 2006-2011
Source: Virginia Employment Commission
Source: Bureau of Economic Analysis *Size represents total employment
Economy is less diversified

Eds and Meds Economic Footprint • Eds and Meds
• Eds (higher education--2 year college and university)
• Meds (hospitals, ambulatory care, doctor’s offices, nursing homes, home health)
• Economic Footprint • 33,000 direct jobs • 52,000 total (direct,
indirect, and induced) • 52,000 economic
footprint/147,000 total jobs=35%

Thomas Jefferson Planning District Revenue Trends

Sources of TJPD Local Revenue, FY 2011
Sources of Local Government Revenue
Local 64%
State aid
28%
Federal aid 8%
Sources of Local Tax Revenue
Real property
61% Personal property
10%
Local sales and use
7%
Public service
corporation property
6%
Business license
4%
Restaurant meals
3%
All other 9%
Source: Virginia Auditor of Public Accounts

TJPD Sources of Local Government Revenue, FY 2001 to FY 2011
0
100
200
300
400
500
600
Local State aid Federal aid
Source: Virginia Auditor of Public Accounts
TJPD Change in Sources of Local Government Revenue
-10
0
10
20
30
40
50
2001
2002
2003
2004
2005
2006
2007
2008
2009
2010
2011
Local State aid Federal aid Total
% change
Source: Virginia Auditor of Public Accounts
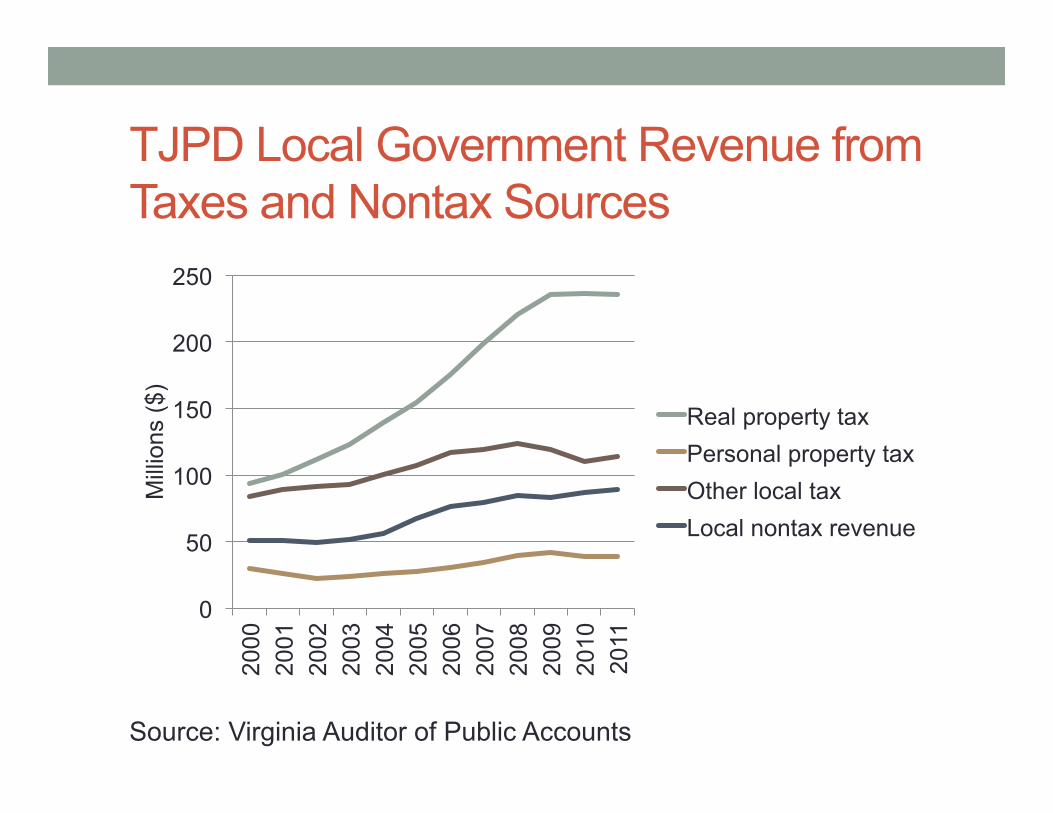
TJPD Local Government Revenue from Taxes and Nontax Sources
0
50
100
150
200
250 20
00
2001
20
02
2003
20
04
2005
20
06
2007
20
08
2009
20
10
2011
Mill
ions
($)
Real property tax Personal property tax Other local tax Local nontax revenue
Source: Virginia Auditor of Public Accounts

TJPD Local Government Revenue from Tax Sources
0% 10% 20% 30% 40% 50% 60% 70% 80% 90%
100%
2000
20
01
2002
20
03
2004
20
05
2006
20
07
2008
20
09
2010
20
11
Other taxes Personal property tax Real property tax
Source: Virginia Auditor of Public Accounts

TJPD Per Capita Local Tax Revenue in Constant Dollars
$600
$800
$1,000
$1,200
$1,400
$1,600
$1,800 20
00
2001
2002
2003
2004
2005
2006
2007
2008
2009
2010
2011
Albemarle Fluvanna Greene Louisa Nelson TJPD Virginia
4 year assessment cycle
Source: Virginia Auditor of Public Accounts

TJPD Consumer Taxes
0
2
4
6
8
10
12
0
5
10
15
20
25
30
2000
20
01
2002
20
03
2004
20
05
2006
20
07
2008
20
09
2010
20
11
Per
sona
l Inc
ome
(Bill
ions
$)
Tax
Rev
enue
(Mill
ions
$)
Hotel Motel
Restaurant and Food
Sales and Use
Personal Income
Source: Virginia Auditor of Public Accounts and Bureau of Economic Analysis

TJPD Consumer Tax Revenue and Personal Income Growth
-8 -6 -4 -2 0 2 4 6 8
10 12
2001
2002
2003
2004
2005
2006
2007
2008
2009
2010
2011
Tax Revenue (Sales and Use, Restaurant and Food) Personal Income
Source: Virginia Auditor of Public Accounts and Bureau of Economic Analysis
% change

The Fiscal Cliff

Components of Fiscal Cliff, FY 2013 • “Fiscal Cliff” term coined
by Fed Chair Ben Bernanke
• Spending Decreases (1/5) • Sequestration • Expiration of Emergency
Unemployment Benefits • “Doc Fix”
• Tax Increases (4/5) • “Bush Tax Cuts” (2001-2003) • AMT (Alternative Minimum
Tax) expansion • Tax Extenders Expiration • Payroll Tax Increase • Taxes in Affordable Care Act 0
100
200
300
400
500
600
Bill
ions
($)
Affordable Care Act
Other Taxes
Payroll Tax
Bush Tax Cuts and AMT
Doc Fix
Unemployment Insurance
Sequestration
Source: Congressional Budget Office (May)

Fiscal Cliff Hype versus Reality • Many cuts/tax increases have
routinely been deferred (e.g., Doc Fix, AMT, “Tax Extenders”)
• Fiscal Cliff type policies are already occurring • The first phase of sequestration
imposed discretionary spending caps that began in FY12
• Affordable Care Act spending decreases already implemented
• Some components will be spread out throughout this fiscal year and next
• Fiscal Cliff has already affected business activity • Companies have been delaying or
decreasing business investment and hiring

“Sequestration” ($103 Billion) • Budget Control Act (BCA) of
2011 • Provided increases in debt limit
in return for budget caps and cuts later ($2.1 million savings).
• Sum over 10 years is equal to debt limit increase.
• Cuts divided evenly between between defense and nondefense.
• Cuts needed because of failure of “Supercommittee”
• Some expenditures are exempt (e.g. social security, most unemployment payments, veterans benefits, Medicaid)
$1.2 Trillion Sequester (2013-2021)
$984 Billion Sequester (split evenly over 9 years,
$109 bn/yr)
Defense Cuts
$492 bn
Lower Annual Discretionary
Funding $492 bn
Non-Defense Cuts $492 bn
Lower Annual Discretionary
Funding $322 bn
Medicare 2% Cut $116 bn
PPACA* Exchange Subsidy
Cuts $7 bn
Other Mandatory
Cuts $41 bn
Assumed Debt Service Savings
$216 bn
Breaking Down the Sequester

Unemployment Insurance Benefits ($26 Billion) • Emergency Unemployment Compensation (EUC) created by and American Recovery and Reinvestment Act (“Fiscal Stimulus”) • Extended one year by The
Tax Relief, Unemployment Insurance Reauthorization, and Job Creation Act of 2010
• Extended again by Middle Class Tax Relief and Job Creation Act of 2012
0 20 40 60 80
100 120 140 160
2000
20
02
2004
20
06
2008
20
10
2012
20
14
Bill
ions
($)
Emergency Benefits and Federal Additional Compensation Regular and Extended Benefits
Source: Congressional Budget Office

Sustainable Growth Rate ($11 Billion) • Sustainable Growth Rate (SGR) “Doc Fix” • Enacted by the Balanced
Budget Act of 1997 to control health care costs
• Physician service costs are growing at twice the rate allowed by SGR
• Medicare physician payment rates would be reduced by 27 percent.
• Congress routinely cancels cuts
• The adjustment becomes more expensive each time
Source: Congressional Budget Office

Bush Tax Cuts and Alternative Minimum Tax (AMT) ($221 Billion) • Economic Growth and Tax Relief
Reconciliation Act of 2001 and Jobs and Growth Tax Relief Reconciliation Act of 2003. • Bush Tax Cuts were passed using
“reconciliation process”. They are subject to 10 year window imposed by Byrd Rule.
• Cliff Components • Raise individual income tax rates • Raise tax rates on long-term capital
gains and dividends • Reduce child tax credit and earned
income tax credit • Lower estate threshold and raise tax
rate • Extended 2 years by Tax Relief,
Unemployment Insurance Reauthorization, and Job Creation Act of 2010

Alternative Minimum Tax (AMT) • AMT designed so high earners would
pay some minimum level of taxes • Add back in tax preferences. Use basic
exemption and apply tax rate. Pay larger of regular income tax or AMT
• Basic exemption not indexed for inflation. More taxpayers affected.
• Basic exemption raised many years to avoid affecting more taxpayers
• 1997: 605,000 taxpayers (1% of all taxpayers)
• 2009: 3.8 million (2.7% of all taxpayers) • 2012: 34 million (20% of all taxpayers) • 2022: 58 million
• AMT patch becomes more expensive over time
• Repealing AMT without Bush tax cuts costs $1.3 trillion 2013-2022, with tax cuts $4.1 million
AMT Basic Exemption
$30,000 $35,000 $40,000 $45,000 $50,000 $55,000 $60,000 $65,000 $70,000 $75,000
1993
19
95
1997
19
99
2001
20
03
2005
20
07
2009
20
11
Married Unmarried
Source: Congressional Research Service

Payroll Tax Increase ($95 Billion) • Created by Tax Relief,
Unemployment Insurance Reauthorization, and Job Creation Act of 2010 (“Obama-GOP Tax Deal”) • Reduced employee’s payroll
tax rate from 6.2% to 4.2% • Lost SS Trust Fund revenue
made up with transfers from the general fund
• Extended to 2012 by The Middle Class Tax Relief and Job Creation Act of 2012
0
1
2
3
4
5
6
7
1937
19
43
1949
19
55
1961
19
67
1973
19
79
1985
19
91
1997
20
03
2009
Source: U.S. Social Security Administration

Other Expiring Tax Provisions ($65 billion)
• Tax Extenders • Individual deductions • Business deductions and
credits (R&D, foreign source income, depreciation)
• Charitable giving • Energy • Community Development • Disaster Relief
• ARRA tax cuts • American Opportunity Tax
credit
Number of Federal Tax Provisions Expiring
Source: American Enterprise Institute
0
50
100
150
200
250

Affordable Care Act Taxes ($18 Billion)
• Budgetary stimulus effects vary over FY 2010-2019 period • Early cuts in expenditures and
steady increase in revenues. • Real spending impetus begins in
2014. • 2013 Provisions
• 0.9% increase in Medicare HI (hospital insurance) payroll tax for higher earners and 3.8 percent increase on investment income
• 2.3% excise tax on medical devices -40
-20
0
20
40
60
80
100
120
2010
2011
2012
2013
2014
2015
2016
2017
2018
2019
Bill
ions
of $
Outlays Revenues Surplus
Source: Congressional Budget Office (2010)

What Effect will the Fiscal Cliff have in on the Economy in the Short Run? • Fiscal contraction of this size (3-5% of GDP) is very
unusual: • Revenue and Expenditure Control Act (1968).
• 10% surcharge on income taxes. Social security payroll tax hike. Increase in phone and auto excise taxes (3.1% of GDP)
• From GDP growth pace of 5% and 4% unemployment into recession • Recession was very mild and short (11 months duration)
• Most forecasts show that fiscal cliff will push economy into recession. • Forecasts of magnitude and length of recession vary
• Different types of models (underlying features) • Different input data (types of scenarios modeled, estimates of
magnitude of fiscal cliff components)

Fiscal Cliff Forecasts, 2013 Organization Budgetary Impact
(% of GDP) Economic Impact (% of GDP)
Policies Included
CBO 3.3% 0.3% to 2.9% Tax cuts, AMT, jobs measures, sequester
CRFB 4.2% 2.2% Tax cuts, AMT, sequester, doc fix, ACA, jobs measures
Moody’s 4.2%-4.5% 3.6% Tax cuts, AMT, sequester, doc fix, ACA, jobs measures
Morgan Stanley 5% 2.5% to 7.5% Tax cuts, jobs measures, sequester, war drawdown, ACA
Goldman Sachs 4% 4% Tax cuts, sequester, jobs measures
Bank of America Merrill Lynch
4.6% N/A Tax cuts, AMT, jobs measures, sequester, doc fix, BCA
Source: Committee for a Responsible Federal Budget (CRFB)

Virginia is More Vulnerable to Federal Cuts
0 5 10 15 20
Federal Grants Subject to Sequester as % of State Revenue
Federal Spending as % of GDP
Defense Spending as % of GDP
Nondefense Spending as % of GDP
Federal Nondefense Workforecase as % of Total
U.S. Virginia
Source: Pew Center on the States Note: DC, MD, and VA combined because of common commuting area

Some Virginia Results • Sequestration
• Center for Regional Analysis (George Mason University) and Chmura Analytics.
• The Economic Impact of the Budget Control Act of 2011 on DOD and non-DOD Agencies (for the Aerospace Industries Association)
• 207,571 job losses in FY 2013 • Assessing the Impact of the Federal
Budget Cuts on the Virginia Economy (for the Virginia Economic Development Partnership)
• 164,225 cumulative job year losses FY 2012-2013
• Hampton Roads Planning District Commission.
• Total job impact in Hampton Roads region—26,500 (2014)
• Fiscal Cliff • American Action Forum. The Fiscal
Cliff: What you need to know and how to avoid it.
• 35,700 to 223,400 total jobs

State Fiscal Cliff Impacts

Methodology
• Regional Economic Models Inc. Policy Insight (REMI PI+) Model for Virginia
• Model is well respected with solid theoretical foundation
• Components of Fiscal Cliff expenditure and tax changes were mapped onto REMI policy variables
• Input data were drawn from Congressional Budget Office (2013) and National Association of Manufacturers (2014-2022)

Economic Impact Scenarios • Three Economic Impact Scenarios • #1: Health care tax
implementation, payroll tax holiday suspension, emergency unemployment insurance benefit suspension
• #2: +Sequestration • #3: Fall off the fiscal cliff

Virginia Employment Under Scenarios
4.2
4.4
4.6
4.8
5
5.2
5.4
5.6 20
00
2002
2004
2006
2008
2010
2012
2014
2016
2018
2020
2022
Em
ploy
men
t (M
illio
ns)
Baseline Scenario I Scenario II Scenario III
Source: Weldon Cooper Center, Virginia REMI Model

Virginia Employment Growth Under Scenarios
-3
-2
-1
0
1
2
3
4
2000
20
01
2002
20
03
2004
20
05
2006
20
07
2008
20
09
2010
20
11
2012
20
13
2014
20
15
2016
20
17
2018
20
19
2020
20
21
2022
Base Scenario I Scenario II Scenario III
% change
Source: Weldon Cooper Center, Virginia REMI Model
Contraction is sharper and deeper than Great Recession for VA

Virginia Employment Impacts under Scenarios
-226,755
-255,152
-256,840 -252,911
-249,705 -244,712
-300,000
-250,000
-200,000
-150,000
-100,000
-50,000
0 2013 2014 2015 2016 2017 2018
Scenario I Scenario II Scenario III
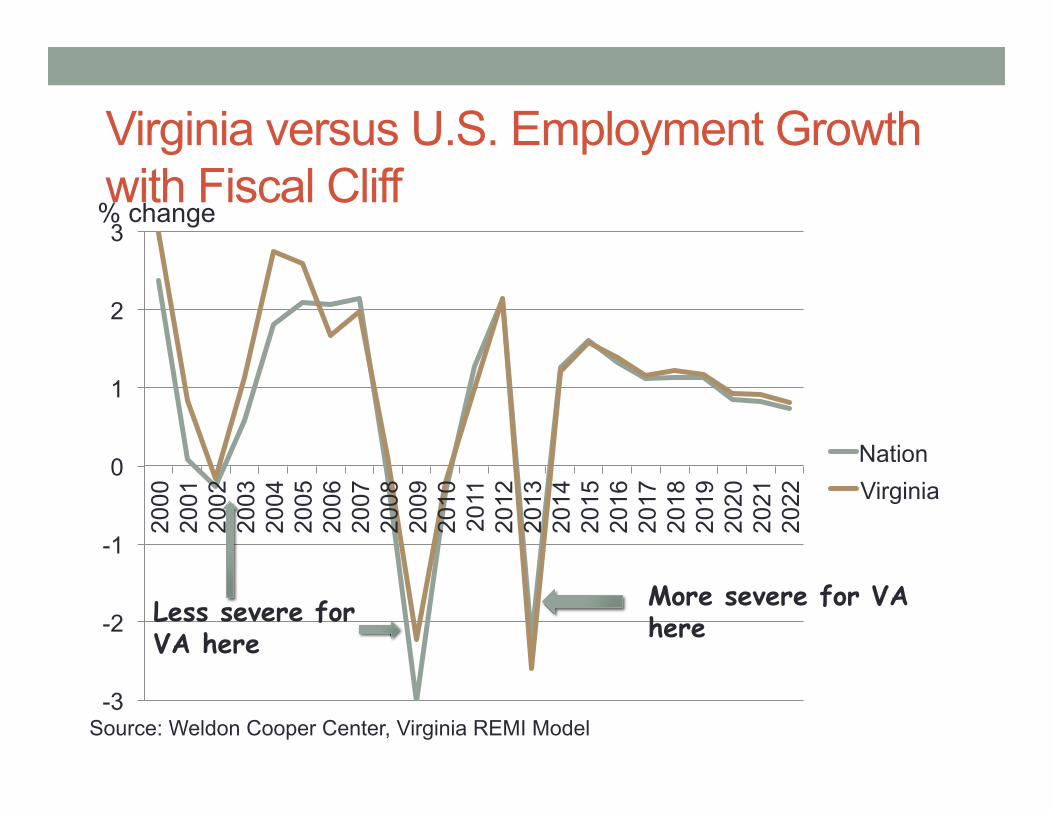
Virginia versus U.S. Employment Growth with Fiscal Cliff
-3
-2
-1
0
1
2
3
2000
20
01
2002
20
03
2004
20
05
2006
20
07
2008
20
09
2010
20
11
2012
20
13
2014
20
15
2016
20
17
2018
20
19
2020
20
21
2022
Nation Virginia
% change
Source: Weldon Cooper Center, Virginia REMI Model
Less severe for VA here
More severe for VA here

Longer Run Trends
-4
-3
-2
-1
0
1
2
3
4
5
The Great Stagnation
Source: Weldon Cooper Center, Virginia REMI Model

State Revenue, Actual and Forecast by Calendar Year
-10
-5
0
5
10
15
2000
20
01
2002
20
03
2004
20
05
2006
20
07
2008
20
09
2010
20
11
2012
20
13
2014
20
15
2016
Forecast Historical
% change
Source: U.S. Census Bureau, State Government Finances; Weldon Cooper Center, Virginia REMI Model
Governor’s Revenue Estimates will be released with budget on December 17

Other State Revenue Effects • Virginia tax code is linked
to the federal tax code • Reduction in federal tax
credits (Earned Income Tax Credit, Child and Dependent Care Credit) Reduction in federal business deductions
• Decrease in federal corporate income deductions (e.g. enhanced expensing and bonus depreciation rules)
• Change in treatment of Estate Taxes

Thomas Jefferson Planning District Fiscal Cliff Impacts

Virginia versus U.S. Growth with Fiscal Cliff
-3
-2
-1
0
1
2
3
4
2000
20
01
2002
20
03
2004
20
05
2006
20
07
2008
20
09
2010
20
11
2012
20
13
2014
20
15
2016
20
17
2018
20
19
2020
20
21
2022
Nation Virginia TJPD
% change
Source: Weldon Cooper Center, Virginia REMI Model
Less severe for TJPD here
More severe than US but less than VA here

TJPD Employment Growth
-4
-3
-2
-1
0
1
2
3
4
5
Fiscal Cliff Business As Usual
4/5ths as deep as Great Recession and half as long
% change
Source: Weldon Cooper Center, Virginia REMI Model

TJPD Employment
90,000
95,000
100,000
105,000
110,000
115,000
120,000 20
00
2001
20
02
2003
20
04
2005
20
06
2007
20
08
2009
20
10
2011
20
12
2013
20
14
2015
20
16
2017
20
18
2019
20
20
2021
20
22
Source: Weldon Cooper Center, Virginia REMI Model

Consumer Tax Revenue and Personal Income Growth
-8 -6 -4 -2 0 2 4 6 8
10 12
Taxes Personal Income
% change
Source: Weldon Cooper Center, Virginia REMI Model

List of Federal Grants/Programs on Sequestration Chopping Block • Community Development Block Grants (CDBG) and USDA Rural
Development Programs • U.S. Economic Development Administration (EDA) • Home Investment Partnership Program (affordable housing) • Section 8 Housing • Department of Justice State and Local Law Enforcement Assistance
Grants and The Community Oriented Policing Services (COPS) Program • EPA State and Local Grants • The Department of Labor Training and Employment Services account • The Department of Education Accelerating Achievement and Ensuring
Equity Account • FEMA State and Local Programs, which include Urban Area Security
Initiative grants and the State Homeland Security Grant program • AMTRAK funding • Federal Transit Capital Investment Grants • Rebate payments on Build America Bonds
Source: National League of Cities based on Office of Management and Budget

Conclusions

Conclusions • TJPD has weathered the recent five years as well as the state
and better than the nation. • There is much uncertainty about how severely Sequestration
would affect Virginia. The composition and geographical distribution of the cuts is undetermined. But, it will undoubtedly be more severe than other states.
• A Fiscal Cliff induced recession SHOULD be less deep and of shorter duration than the Great Recession for TJPD. For the state, it will be deeper but shorter than Great Recession.
• Even if Fiscal Cliff is avoided, nation, state, and region face slower growth than easy money induced growth of 90s and 2000s. Adapting to new era of lower expectations may be difficult.

e-REMI http://data.eremi.com Username: demo Password: demo