post 16 institutions and providers omnibus survey
TRANSCRIPT
Post 16 Institutions and Providers Omnibus Survey Wave 6 findings
March 2019
IFF Research

2
Contents Contents 2
1. Executive summary 4
2. Introduction 15
2.1. Methodology 15
2.2. Terminology 18
3. AS and A level reform 19
3.1. Post-16 institutions 19
3.2. Private training providers 21
4. Technical Courses and Applied General qualifications 22
4.1. Post-16 institutions 22
4.2. Private training providers 24
5. Apprenticeships and Traineeships 25
5.1. Post-16 institutions 25
5.2. Private training providers 27
6. Provision of post-16 qualifications (excluding Apprenticeships and Traineeships) 29
6.1. Post-16 institutions 29
6.2. Private training providers 32
7. Level 4 and 5 provision 34
7.1. Post-16 institutions 34
7.2. Private training providers 36
8. Post-16 Mathematics 38
8.1. Post-16 institutions 38
9. English for speakers of other languages (ESOL) 42
9.1. Post-16 institutions 42
9.2. Private training providers 43
10. Careers education 44
10.1. Post-16 institutions 44
10.2. Private training providers 48
11. Special Educational Needs and Disabilities (SEND) 49
3
11.1. Post-16 institutions 49
11.2. Private training providers 52
12. Teacher workloads 54
12.1. Post-16 institutions 54
12.2. Private training providers 55
13. Outreach and assessing needs 57
13.1. Post-16 institutions 57
13.2. Private training providers 60
14. Mental health post-16 institutions 62
14.1. Post-16 institutions 62
14.2. Private training providers 65
15. The Prevent Duty and Fundamental British Values 67
15.1. Post-16 institutions 67
15.2. Private training providers 69
16. Social Mobility 70
16.1. Post-16 institutions 70
16.2. Private training providers 73
Annex A: Response rate 75
Annex B: Weighting 76
4
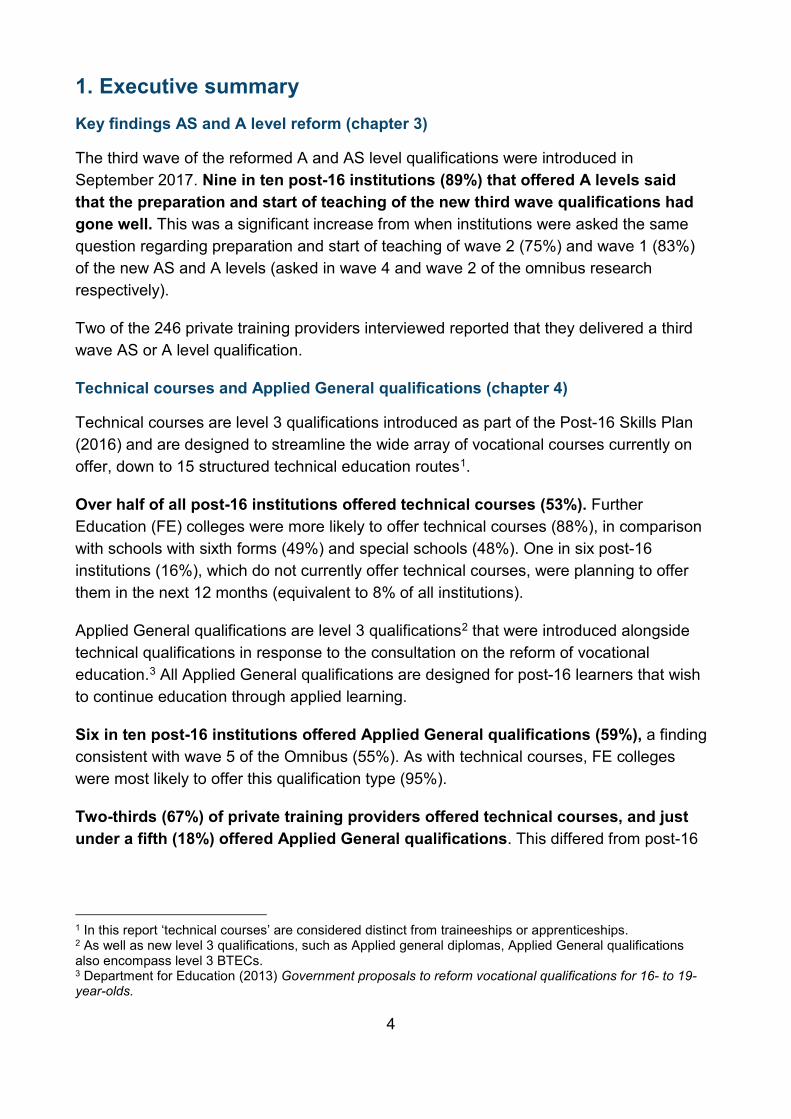
1. Executive summary Key findings AS and A level reform (chapter 3)
The third wave of the reformed A and AS level qualifications were introduced in September 2017. Nine in ten post-16 institutions (89%) that offered A levels said that the preparation and start of teaching of the new third wave qualifications had gone well. This was a significant increase from when institutions were asked the same question regarding preparation and start of teaching of wave 2 (75%) and wave 1 (83%) of the new AS and A levels (asked in wave 4 and wave 2 of the omnibus research respectively).
Two of the 246 private training providers interviewed reported that they delivered a third wave AS or A level qualification.
Technical courses and Applied General qualifications (chapter 4)
Technical courses are level 3 qualifications introduced as part of the Post-16 Skills Plan (2016) and are designed to streamline the wide array of vocational courses currently on offer, down to 15 structured technical education routes1.
Over half of all post-16 institutions offered technical courses (53%). Further Education (FE) colleges were more likely to offer technical courses (88%), in comparison with schools with sixth forms (49%) and special schools (48%). One in six post-16 institutions (16%), which do not currently offer technical courses, were planning to offer them in the next 12 months (equivalent to 8% of all institutions).
Applied General qualifications are level 3 qualifications2 that were introduced alongside technical qualifications in response to the consultation on the reform of vocational education.3 All Applied General qualifications are designed for post-16 learners that wish to continue education through applied learning.
Six in ten post-16 institutions offered Applied General qualifications (59%), a finding consistent with wave 5 of the Omnibus (55%). As with technical courses, FE colleges were most likely to offer this qualification type (95%).
Two-thirds (67%) of private training providers offered technical courses, and just under a fifth (18%) offered Applied General qualifications. This differed from post-16
1 In this report ‘technical courses’ are considered distinct from traineeships or apprenticeships. 2 As well as new level 3 qualifications, such as Applied general diplomas, Applied General qualifications also encompass level 3 BTECs. 3 Department for Education (2013) Government proposals to reform vocational qualifications for 16- to 19-year-olds.
5
institutions, who were more likely to offer Applied General qualifications (59%), but less likely to offer technical courses (53%).
One quarter of private training providers (25%) who did not offer technical courses were planning to introduce them in the next 12 months (equivalent to 9% of all training providers), whilst 4% who did not offer Applied General qualifications were planning to offer them.
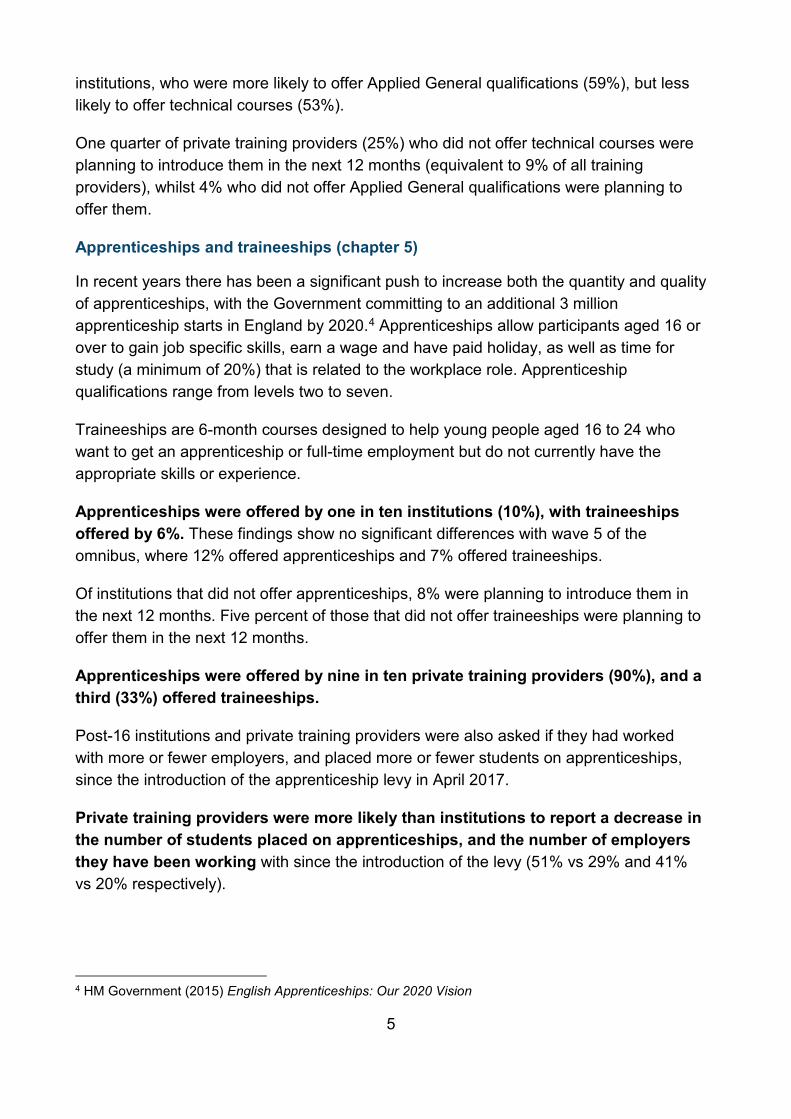
Apprenticeships and traineeships (chapter 5)
In recent years there has been a significant push to increase both the quantity and quality of apprenticeships, with the Government committing to an additional 3 million apprenticeship starts in England by 2020.4 Apprenticeships allow participants aged 16 or over to gain job specific skills, earn a wage and have paid holiday, as well as time for study (a minimum of 20%) that is related to the workplace role. Apprenticeship qualifications range from levels two to seven.
Traineeships are 6-month courses designed to help young people aged 16 to 24 who want to get an apprenticeship or full-time employment but do not currently have the appropriate skills or experience.
Apprenticeships were offered by one in ten institutions (10%), with traineeships offered by 6%. These findings show no significant differences with wave 5 of the omnibus, where 12% offered apprenticeships and 7% offered traineeships.
Of institutions that did not offer apprenticeships, 8% were planning to introduce them in the next 12 months. Five percent of those that did not offer traineeships were planning to offer them in the next 12 months.
Apprenticeships were offered by nine in ten private training providers (90%), and a third (33%) offered traineeships.
Post-16 institutions and private training providers were also asked if they had worked with more or fewer employers, and placed more or fewer students on apprenticeships, since the introduction of the apprenticeship levy in April 2017.
Private training providers were more likely than institutions to report a decrease in the number of students placed on apprenticeships, and the number of employers they have been working with since the introduction of the levy (51% vs 29% and 41% vs 20% respectively).
4 HM Government (2015) English Apprenticeships: Our 2020 Vision
6
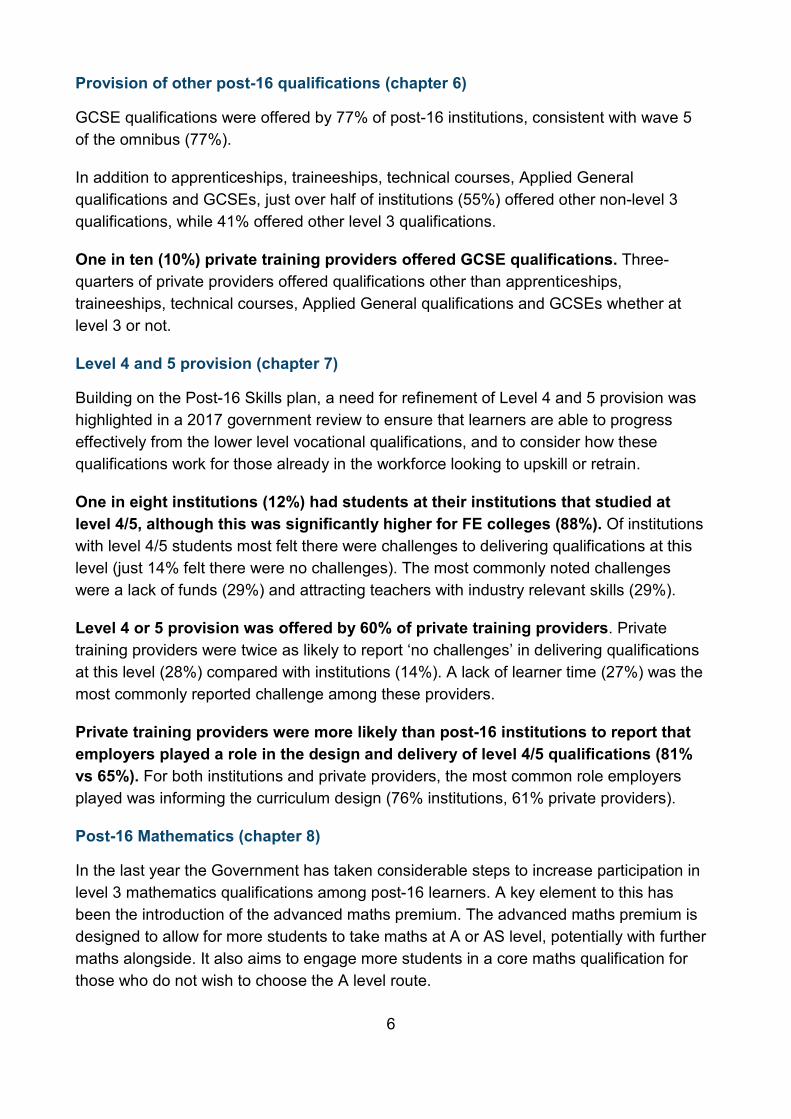
Provision of other post-16 qualifications (chapter 6)
GCSE qualifications were offered by 77% of post-16 institutions, consistent with wave 5 of the omnibus (77%).
In addition to apprenticeships, traineeships, technical courses, Applied General qualifications and GCSEs, just over half of institutions (55%) offered other non-level 3 qualifications, while 41% offered other level 3 qualifications.
One in ten (10%) private training providers offered GCSE qualifications. Three- quarters of private providers offered qualifications other than apprenticeships, traineeships, technical courses, Applied General qualifications and GCSEs whether at level 3 or not.
Level 4 and 5 provision (chapter 7)
Building on the Post-16 Skills plan, a need for refinement of Level 4 and 5 provision was highlighted in a 2017 government review to ensure that learners are able to progress effectively from the lower level vocational qualifications, and to consider how these qualifications work for those already in the workforce looking to upskill or retrain.
One in eight institutions (12%) had students at their institutions that studied at level 4/5, although this was significantly higher for FE colleges (88%). Of institutions with level 4/5 students most felt there were challenges to delivering qualifications at this level (just 14% felt there were no challenges). The most commonly noted challenges were a lack of funds (29%) and attracting teachers with industry relevant skills (29%).
Level 4 or 5 provision was offered by 60% of private training providers. Private training providers were twice as likely to report ‘no challenges’ in delivering qualifications at this level (28%) compared with institutions (14%). A lack of learner time (27%) was the most commonly reported challenge among these providers.
Private training providers were more likely than post-16 institutions to report that employers played a role in the design and delivery of level 4/5 qualifications (81% vs 65%). For both institutions and private providers, the most common role employers played was informing the curriculum design (76% institutions, 61% private providers).
Post-16 Mathematics (chapter 8)
In the last year the Government has taken considerable steps to increase participation in level 3 mathematics qualifications among post-16 learners. A key element to this has been the introduction of the advanced maths premium. The advanced maths premium is designed to allow for more students to take maths at A or AS level, potentially with further maths alongside. It also aims to engage more students in a core maths qualification for those who do not wish to choose the A level route.

7
Just under two-thirds of institutions were aware of the advanced maths premium (63%), with FE colleges more likely to be aware (93%) than both schools with sixth forms (72%) and special schools (26%).
A level maths was offered by almost all post-16 institutions (96%), while three-quarters offered A level further maths (77%). Just under half offered AS level maths (49%), further maths (46%), or core maths (42%) qualifications. Of the institutions that offered any level 3 maths qualification, the most frequently mentioned one challenge was the suitability of the qualification for students (47%).
Private training providers were less aware of the advanced maths premium (38%) than post-16 institutions (63%). Post-16 level 3 maths qualifications, were offered by three of the 246 private training providers interviewed.
English for speakers of other languages (ESOL) (chapter 9)
In recent years there has been considerable focus from the government on integration to create more cohesive tolerant communities. English language skills are considered to be a key factor to successful integration, with the government-commissioned Casey Review5 (2016) highlighting the link between the level of English spoken and level of qualifications attained, and between levels of English and employment rates and workplace capabilities.6 In an analysis of 2011 census data, the government’s Integrated Communities green paper (2018) also reported that the employment rate for adults with low level English language proficiency was 17% lower than those with high English language proficiency.7
Just over one in five institutions offered ESOL provision (22%), with the figure much higher among FE colleges (74%) than special schools (33%) and schools with sixth forms (13%).
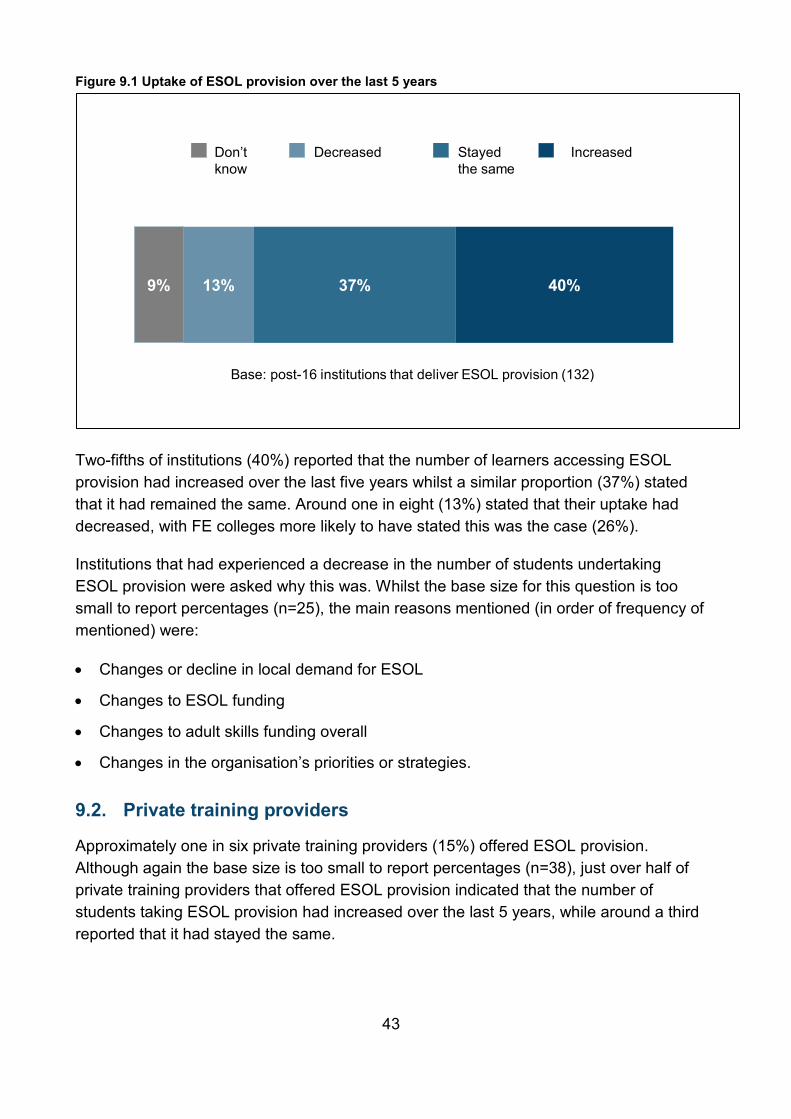
Of those that offered ESOL provision, two-fifths (40%) reported that their ESOL provision had increased over the last five years and a similar proportion (37%) stated that it had remained the same. Around one in eight (13%) noted a decrease over the last 5 years.
Private training providers were less likely to offer ESOL provision (15%), compared with post-16 institutions (22%)
Careers education (chapter 10)
The increasing pressure on schools to deliver high quality careers education is well-documented. The government aims to develop a careers system where all young people
5 Dame Louis Casey DBE CB (2016) The Casey Review: A review in to opportunity and integration 6 Ibid 7 HM Government (2018) Integrated Communities green paper
8
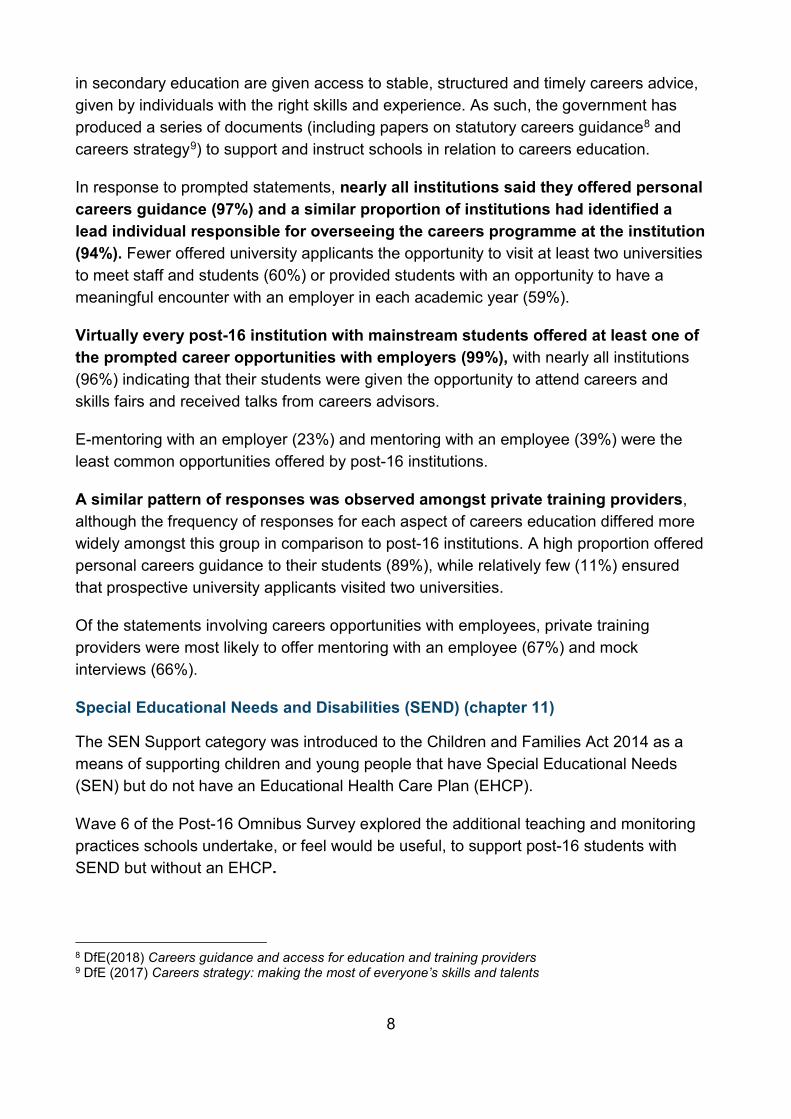
in secondary education are given access to stable, structured and timely careers advice, given by individuals with the right skills and experience. As such, the government has produced a series of documents (including papers on statutory careers guidance8 and careers strategy9) to support and instruct schools in relation to careers education.
In response to prompted statements, nearly all institutions said they offered personal careers guidance (97%) and a similar proportion of institutions had identified a lead individual responsible for overseeing the careers programme at the institution (94%). Fewer offered university applicants the opportunity to visit at least two universities to meet staff and students (60%) or provided students with an opportunity to have a meaningful encounter with an employer in each academic year (59%).
Virtually every post-16 institution with mainstream students offered at least one of the prompted career opportunities with employers (99%), with nearly all institutions (96%) indicating that their students were given the opportunity to attend careers and skills fairs and received talks from careers advisors.
E-mentoring with an employer (23%) and mentoring with an employee (39%) were the least common opportunities offered by post-16 institutions.
A similar pattern of responses was observed amongst private training providers, although the frequency of responses for each aspect of careers education differed more widely amongst this group in comparison to post-16 institutions. A high proportion offered personal careers guidance to their students (89%), while relatively few (11%) ensured that prospective university applicants visited two universities.
Of the statements involving careers opportunities with employees, private training providers were most likely to offer mentoring with an employee (67%) and mock interviews (66%).
Special Educational Needs and Disabilities (SEND) (chapter 11)
The SEN Support category was introduced to the Children and Families Act 2014 as a means of supporting children and young people that have Special Educational Needs (SEN) but do not have an Educational Health Care Plan (EHCP).
Wave 6 of the Post-16 Omnibus Survey explored the additional teaching and monitoring practices schools undertake, or feel would be useful, to support post-16 students with SEND but without an EHCP.
8 DfE(2018) Careers guidance and access for education and training providers 9 DfE (2017) Careers strategy: making the most of everyone’s skills and talents

9
Training in ‘inclusive teaching’ was the most common form of training that post-16 institutions felt would be useful for teachers to effectively support students with SEND but without an EHCP (61%).10 This was followed by training on designing study programmes with pathways to employment for students with SEND (56%).
Among post-16 institutions, the most frequently cited method used to assess whether support for SEND students without an EHCP had improved their progress or attainment was the collection of parents, carers or students’ views on progress (96%). Over four in five also cited information obtained from a previous education provider (84%) and progress assessments from colleagues or external professionals (82%).
For private training providers the types of training they felt would be most useful for their teachers in effectively supporting post-16 students with SEND were ‘how to identify and support students with different SEND (66%) and inclusive teaching (51%).
In assessing the impact of support on progress or attainment on students with SEND, private training providers were most likely to say that teachers used ‘progress assessments from colleagues or external professionals’ (82%) and ‘more frequent and focused assessments of progress’ (81%).
Teacher workloads (chapter 12)
In February 2017, results of the first teacher workload survey highlighted that teachers had worked 54.4 hours per week on average in the week prior to their interview. In response to this finding, the DfE published a workload reduction toolkit (in July 2018) which provides practical advice and tools to help school leaders and teachers review workloads at their school.11
Nine in ten institutions (87%) had taken some steps to reduce teacher workload. Over half (56%) of these post-16 institutions felt these actions had made teacher workloads more manageable (51% slightly more manageable, 6% much more manageable).
10 Inclusive teaching or practice is defined in DfE’s Inclusive Teaching and Learning in Higher Education as a route to Excellence Teaching report (2017), as “teaching which engages students in learning that is meaningful, relevant and accessible to all, embracing a view of the individual and of individual difference as a source of diversity that can enrich the lives and the learning of others. Inclusive learning therefore invests in the following principles: • Learning is enriched by the varied experiences of students • Accessible learning is relevant and approachable by all students • The curriculum and the means of delivery are both part of this accessibility • Students with full access to learning and teaching are more likely to engage with learning, and to reach their full potential” 11DfE (2018) Guidance: reducing workload in your school (2018)

10
A similar proportion of private training providers (85%) had undertaken some activity to reduce teaching workloads.
Outreach and assessing needs (chapter 13)
The government is interested in understanding the activities that post-16 institutions are engaging in to recruit students with low prior attainment and complex additional needs to reduce levels of exclusion in post-16 education and widen participation rates. This wave of the omnibus post-16 omnibus examined the channels used by post-16 institutions to promote further education.
The key form of outreach noted by post-16 institutions was contact with parents and carers (97%). Taster days were also used by the vast majority of institutions (88%), and around three-quarters of institutions used links to other local colleges (76%), visits to schools in their area (76%) and links to local authority services (e.g. guidance services) (75%) as forms of outreach.
Contact with parents was reported as the most effective method of outreach activity by institutions (33%).
In contrast with findings for institutions, private training providers most commonly used links to other local colleges (70%), and LA services (67%) as forms of outreach.
Mental health (chapter 14)
Assuring the protection of young people’s mental health is a central priority for government.
Post-16 institutions were asked the extent to which they agreed or disagreed with statements about their ability to support students with mental health issues. Most agreed that their staff were aware of what support was available to offer students with mental health issues at their institution (88% vs 6% that disagreed) and were equipped to identify behaviour linked to a mental health issue (83% vs 8% that disagreed).
They were less likely to agree that they knew how to help students with mental health issues access support outside their institution (52% vs 29% that disagreed).
Levels of agreement with all 3 statements were similar for private training providers.
The Prevent Duty and Fundamental British Values (chapter 15)
The Counter-Terrorism and Security Act was published by government in 2015.12 This document contained a duty for ‘specified authorities’ in England and Wales to have “due
12 Home office (2015) Counter-Terrorism and Security Act
11
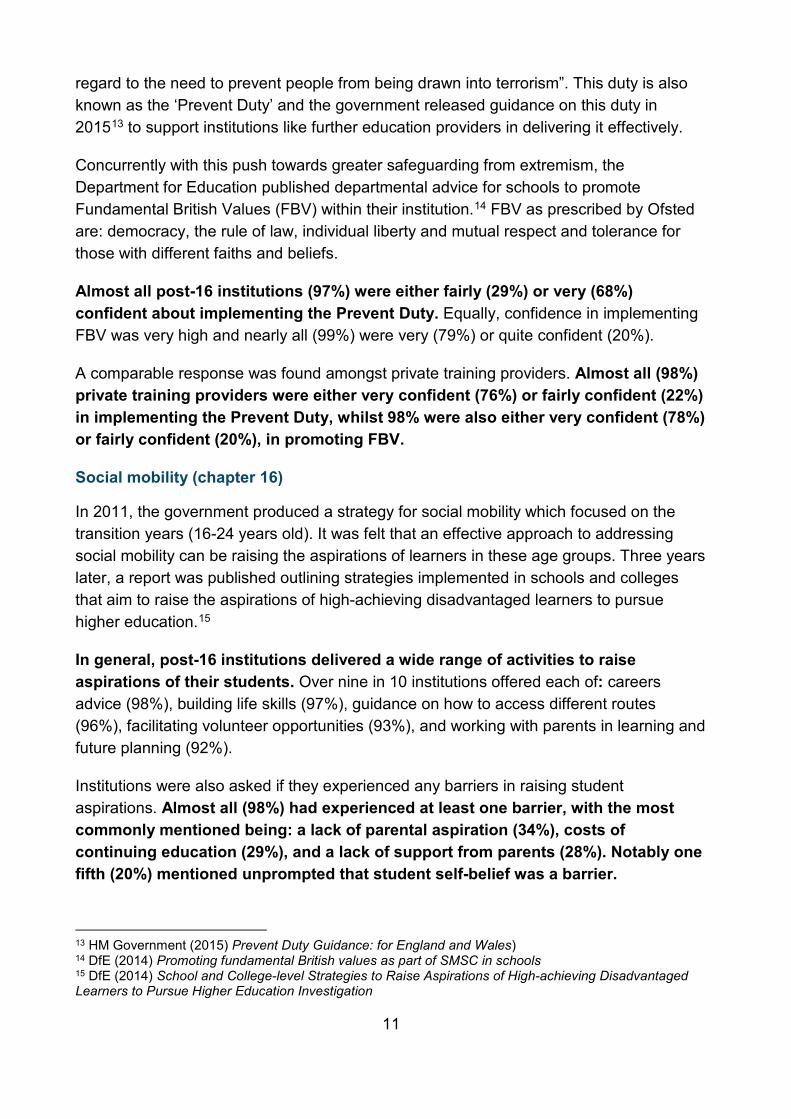
regard to the need to prevent people from being drawn into terrorism”. This duty is also known as the ‘Prevent Duty’ and the government released guidance on this duty in 201513 to support institutions like further education providers in delivering it effectively.
Concurrently with this push towards greater safeguarding from extremism, the Department for Education published departmental advice for schools to promote Fundamental British Values (FBV) within their institution.14 FBV as prescribed by Ofsted are: democracy, the rule of law, individual liberty and mutual respect and tolerance for those with different faiths and beliefs.
Almost all post-16 institutions (97%) were either fairly (29%) or very (68%) confident about implementing the Prevent Duty. Equally, confidence in implementing FBV was very high and nearly all (99%) were very (79%) or quite confident (20%).
A comparable response was found amongst private training providers. Almost all (98%) private training providers were either very confident (76%) or fairly confident (22%) in implementing the Prevent Duty, whilst 98% were also either very confident (78%) or fairly confident (20%), in promoting FBV.
Social mobility (chapter 16)
In 2011, the government produced a strategy for social mobility which focused on the transition years (16-24 years old). It was felt that an effective approach to addressing social mobility can be raising the aspirations of learners in these age groups. Three years later, a report was published outlining strategies implemented in schools and colleges that aim to raise the aspirations of high-achieving disadvantaged learners to pursue higher education.15
In general, post-16 institutions delivered a wide range of activities to raise aspirations of their students. Over nine in 10 institutions offered each of: careers advice (98%), building life skills (97%), guidance on how to access different routes (96%), facilitating volunteer opportunities (93%), and working with parents in learning and future planning (92%).
Institutions were also asked if they experienced any barriers in raising student aspirations. Almost all (98%) had experienced at least one barrier, with the most commonly mentioned being: a lack of parental aspiration (34%), costs of continuing education (29%), and a lack of support from parents (28%). Notably one fifth (20%) mentioned unprompted that student self-belief was a barrier.
13 HM Government (2015) Prevent Duty Guidance: for England and Wales) 14 DfE (2014) Promoting fundamental British values as part of SMSC in schools 15 DfE (2014) School and College-level Strategies to Raise Aspirations of High-achieving Disadvantaged Learners to Pursue Higher Education Investigation

12
Private training providers also delivered a wide range of activities to raise student aspirations, although overall they were less likely to mention each individual activity than post-16 institutions. For example, whereas 93% of institutions facilitated volunteering opportunities, just under half (48%) of private providers did so.
Private training providers were more likely than institutions to state that they did not face barriers to raising aspirations amongst students (9%). The most commonly mentioned barrier for private training providers was the cost of continued education, noted by just under a fifth of providers (17%).

13
Post-16 Omnibus infographic: Summer 2018 findings
Post-16 Institution OmnibusWave 6: findings from Summer 2018
Qualifications, post-16 maths, careers education
Methods of careers education delivery
94% had an identified lead individual to oversee the careers
programme
97% offered personal careers guidance
59% offered at least one encounter with an employer each year (up
from 52% in summer 2017)
80% had a careers programme that is written down (up from
74% in summer 2017)
66% offered students considering applying to university at least
two university visits (down from 75% in summer 2017)
Level 3 maths qualifications offered
Post-16 qualifications offered or planned to offer
A level maths96%
A level further maths77%
AS level maths49%
post-16 institutions (this excludes findings from interviews with 246 private training providers)
From interviews with
61%
60%
17%
10%
Applied Generalqualifications
Technical courses
Apprenticeships
Traineeships

14
Post-16 Institution Omnibus Wave 6 findings from Summer 2018
post-16 educational institutions surveyed
3rd wave of reforms89%
Pupil mental health, AS and A level reform and
SEND
Methods of assessing progress of SEND students
without an EHCP
know what support is on offer (85% in
summer 2016)
post-16 institutions (this excludes findings from interviews with 246 private training providers)
From interviews with
Preparation for each wave of the new AS and A levels
(% very or fairly well prepared)
2nd wave of reforms(asked winter 2016)75%
1st wave of reforms (asked winter 2015)83%
96%
84%
82%
74%
94%
85%
86%
69%
Collecting view ofparents/carers
Information fromprevious school
Progressassessments
Use of externalevidence Wave 6
Wave 4
In supporting students’ mental health, most staff…
88%
can identify behaviour linked to
a mental health issue (81% in summer 2016)
83%

15
2. Introduction In recent years there have been a number of changes that have impacted the post-16 education landscape, from reforms to AS and A level qualifications, to the introduction Applied General qualifications, the apprenticeship levy and advanced maths premium.
The purpose of this survey was to gain a better understanding of post-16 institution and private provider views about these changes and explore how they are adapting to ensure learners are prepared for further education or employment, as well as adult life in general.
This is the sixth survey in the Post-16 Institutions Omnibus series. It was previously delivered biannually (since June 2015) to allow the Department for Education (DfE) to track changes over the course of each school year but has been converted to an annual survey for this wave, with fieldwork for wave 5 taking place from June 2017. This wave was conducted between June and October 201816 and was the first wave to include the views of private training providers.
2.1. Methodology
This report presents the findings of telephone interviews with 421 post-16 institutions17 and 246 private training providers18 in England.
Almost all interviews with post-16 institutions took place with Head Teachers or Principals. Interviews with private training providers took place with Directors, CEOs, and senior leaders with an oversight of the whole organisation.
16 Most of the fieldwork took place in the summer term of the academic year 2017/18. However, due to other survey work taking place among FE colleges at this time, fieldwork with FE colleges for the Omnibus took place in September and October 2018. 17 Institutions in scope of the study were state-funded institutions providing post-16 education. This included FE colleges (including specialist colleges), sixth form centres, schools with sixth forms (including maintained, academies, free schools and special schools), studio schools and University Technical Colleges/ The study excluded commercial and charitable providers and higher education providers. 18 Only institutions classed as ‘independent learning providers’ were included within the scope of this study, with employer and HEI providers excluded.

16
Table 1.1 Post-16 institutions respondent job titles
Job title Number of completed interviews
% of completed interviews19
Head teacher (including acting/interim head)
228 54%
Principal 175 41%
Executive Head teacher 9 2%
Other senior staff 5 1%
CEO 4 1%
Table 2.2 Private training providers respondent job titles
Job title Number of completed interviews
% of completed interviews
Managing Director 83 34%
Business/Operations Manager 38 15%
Training/Education/Learning & Development Manager 29 12%
Quality Manager 21 9%
Chief Executive Officer 18 7%
Apprenticeship Manager 16 7%
Contracts/Compliance Manager 12 5%
Finance/Funding Manager 11 4%
Administrative Manager 6 2%
Other / refused to give job role 12 5%
Prior to the main fieldwork, the questionnaire went through two development phases to ensure it was relevant, engaging and consistently understood by the range of different institutions and private training providers offering post-16 education:
19 Please note that the percentages in this table add up to 99% rather than 100% due to rounding.

17
• In the first phase, eight cognitive interviews were conducted by telephone. After running through the survey, respondents were asked follow-up questions to examine their understanding of the questions and the reasons for their responses.
• Following this, the questionnaire was piloted with twelve institutions. These telephone interviews were monitored to check the flow of the interview, that respondents understood the questions, and that the interview length was as intended.
Sampling and weighting
The post-16 institution sample for the survey was drawn from Get information about schools (formerly EduBase), DfE’s register of educational establishments in England. A sample of 975 post-16 institutions was drawn from which 421 interviews were achieved (a response rate of 49% of usable sample, see Annex A for further information). The private training provider sample was drawn from an Education and Skills Funding register of private training providers offering post-16 provision, provided by DfE. A sample of 507 private training providers was drawn, and from a useable sample of 436 records20 246 interviews were achieved (a response rate of 56% of usable sample).
The post-16 institution sample was stratified to cover all of the different types of post-16 institutions, including small subgroups such as studio schools and University Technical Colleges (see Table 1.3).
Weighting was applied to the final data to ensure that the results were representative of the entire population of post-16 institutions and private training providers offering post-16 education, by correcting for the over-sampling of small subgroups mentioned above (see Annex B for further details).
Throughout the report, subgroup differences are only reported where the difference is statistically significant at the 95% confidence level.
20 This excludes records without a valid telephone number
18
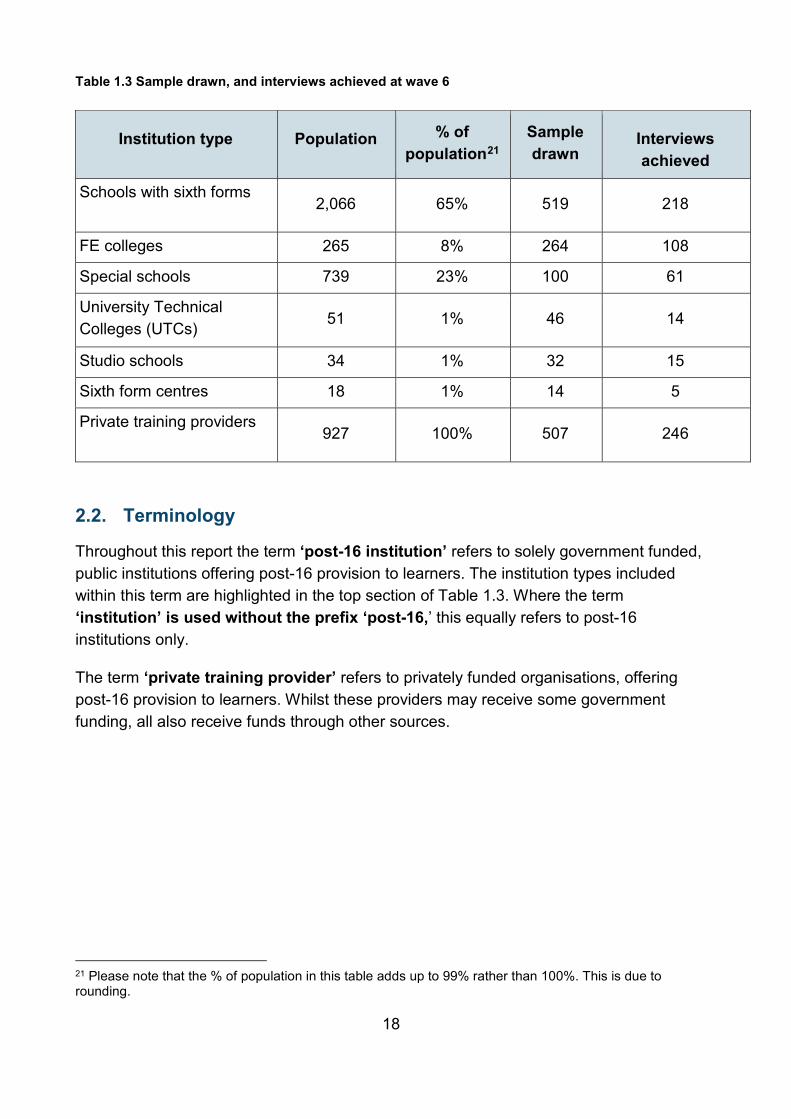
Table 1.3 Sample drawn, and interviews achieved at wave 6
Institution type Population % of population21
Sample drawn
Interviews achieved
Schools with sixth forms 2,066 65% 519 218
FE colleges 265 8% 264 108
Special schools 739 23% 100 61
University Technical Colleges (UTCs) 51 1% 46 14
Studio schools 34 1% 32 15
Sixth form centres 18 1% 14 5
Private training providers 927 100% 507 246
2.2. Terminology
Throughout this report the term ‘post-16 institution’ refers to solely government funded, public institutions offering post-16 provision to learners. The institution types included within this term are highlighted in the top section of Table 1.3. Where the term ‘institution’ is used without the prefix ‘post-16,’ this equally refers to post-16 institutions only.
The term ‘private training provider’ refers to privately funded organisations, offering post-16 provision to learners. Whilst these providers may receive some government funding, all also receive funds through other sources.
21 Please note that the % of population in this table adds up to 99% rather than 100%. This is due to rounding.

19
3. AS and A level reform This chapter looks at the provision of AS levels and A levels across post-16 institutions and private training providers. In particular, it looks at how well these groups felt that preparation for and the start of teaching of the third wave of new AS and A levels went.22
AS level and A level qualifications in England are being reformed in four phases to ensure they better prepare learners for higher education or employment.23 The first and second waves of new AS level and A level qualifications were introduced in September 2015 and September 2016 respectively. Teaching of the third wave of new AS and A level qualifications commenced in September 2017. The fourth and final wave of new A level qualifications were introduced in September 2018.24 The fourth wave of qualifications were not included within the scope of this survey, given their introduction during the fieldwork period.
As part of the reforms, AS level and A level qualifications have been decoupled. This means that an AS level no longer counts towards an A level. All waves of the new AS levels and A level qualifications are linear, with all external assessment taking place at the end of the course. Most subjects will be assessed by examination rather than coursework.
3.1. Post-16 institutions
A levels were offered by 73% of institutions, while 3% offered standalone AS levels. This finding is consistent with wave 5 of the Omnibus (in Spring 2017), when 76% of institutions offered A level qualifications. Nearly all schools with sixth forms offered A level qualifications (96%), in comparison with 64% of FE colleges and 10% of special schools. The proportion of special schools that offered A levels (10%) represents a significant increase from previous wave of research (1% in W5).
Almost all institutions that offered A levels (98%) offered at least one of the third wave subjects.
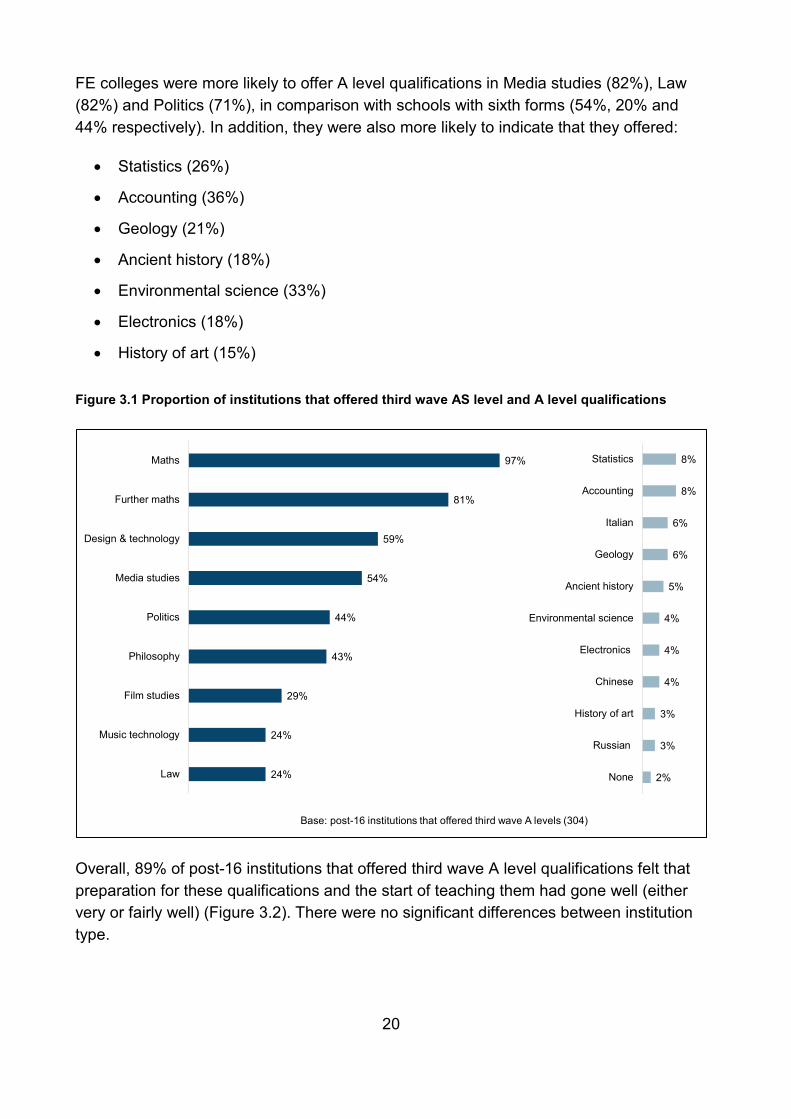
Of institutions that offered third wave A levels, the most common A level offered was maths (97%), followed by further maths (81%), design and technology (59%) and media studies (54%).
22 The third wave AS and A level subjects are: accounting, ancient history, Chinese, classical civilisation, design and technology, electronics, environmental science, film studies, further mathematics, geology, history of art (A level only), Italian, law, mathematics, media studies, music technology, philosophy, politics, Russian and statistics. 23 DfE (2010). The importance of teaching: the schools white paper 2010 24 A full timetable of the subjects which are being reformed at each phase can be found in: Ofqual (2017) Get the facts: AS and A level reform
20
FE colleges were more likely to offer A level qualifications in Media studies (82%), Law (82%) and Politics (71%), in comparison with schools with sixth forms (54%, 20% and 44% respectively). In addition, they were also more likely to indicate that they offered:
• Statistics (26%)
• Accounting (36%)
• Geology (21%)
• Ancient history (18%)
• Environmental science (33%)
• Electronics (18%)
• History of art (15%)
Figure 3.1 Proportion of institutions that offered third wave AS level and A level qualifications
24%
24%
29%
43%
44%
54%
59%
81%
97%
Law
Music technology
Film studies
Philosophy
Politics
Media studies
Design & technology
Further maths
Maths
Base: post-16 institutions that offered third wave A levels (304)
2%
3%
3%
4%
4%
4%
5%
6%
6%
8%
8%
None
Russian
History of art
Chinese
Electronics
Environmental science
Ancient history
Geology
Italian
Accounting
Statistics
Overall, 89% of post-16 institutions that offered third wave A level qualifications felt that preparation for these qualifications and the start of teaching them had gone well (either very or fairly well) (Figure 3.2). There were no significant differences between institution type.

21
Institutions were asked the same question regarding preparation and start of teaching for wave 1 and 2 A level qualifications (in wave 2 and 4 of the omnibus survey respectively). As shown in Figure 3.2, institutions were more likely to have felt teaching and preparation had gone well in relation to wave 3 of the new AS and A levels compared with both previous waves.
Figure 3.2 How well post-16 institutions felt preparation and start of teaching had gone for third, second and first waves of new AS and A levels
0% 1% 0%1% 4% 2%
7%11%
11%
60%
57%57%
29%17%
26%Very well
Fairly well
Neither well nornot well
Not very well
Not at all well
Base: post-16 institutions that offered A levels (316, W6), (368, W4), (406, W2)
89% 75% 83%
W6 AS and A levels W4 AS and A levels W2 AS and A levels
3.2. Private training providers
Two percent of private training providers offered A levels, and an additional 1% planned to offer them to their students in the next 12 months. Two of the 246 private training providers interviewed delivered a third wave AS or A Level qualification.

22
4. Technical Courses and Applied General qualifications This chapter looks at provision of technical courses and Applied General qualifications at post-16 institutions and private training providers.
‘Technical courses’ in this chapter refer to technical qualifications at level 3 that exist alongside apprenticeships and traineeships. In 2014, the Wolf Report reported that 350,000 16 to 19 year olds were studying qualifications with ‘limited labour market value’.25 As part of their response to this assessment, the Government introduced technical courses to raise standards and to make technical education more closely aligned to the needs of employers.26 These are delivered alongside a range of other vocational qualifications, apprenticeships, traineeships and supported internships. Applied General qualifications are level 3 qualifications that were introduced alongside technical qualifications in response to the 2013 consultation on the reform of vocational education.27 Applied General qualifications encompass existing qualifications such as BTECs and new qualifications such as Applied General diplomas. All Applied General qualifications are designed for post-16 learners who wish to continue education through applied learning. Following a government review of these qualifications in July 2017, it was confirmed by the Department of Education that the category of Applied General qualifications would be retained in official performance tables.28
4.1. Post-16 institutions
Applied General qualifications
Applied General qualifications were offered by 59% of institutions, consistent with the findings from wave 5 of the Omnibus in Spring 2017 (55%). FE colleges were more likely to offer these qualifications (95%) in comparison with both schools with sixth form (69%) and special schools (15%). There were no significant differences in the likelihood to offer Applied General qualifications between institutions in the most deprived and least deprived areas.
Among institutions that did not offer Applied General qualifications, 6% were planning to introduce them within the next 12 months (equivalent to 2% of all post-16 institutions).
25 Wolf A. (2011 – updated in 2014). Review of Vocational Education, Department for Education 26 At the time of the survey, there were two types of technical qualifications for 16-19 year olds: Tech Levels (level 3) and Technical Certificates (level 2). 27 DfE (2013). Government proposals to reform vocational qualifications for 16- to 19-year-olds 28 For a full list of accessible Applied General qualifications please see: DfE (2017) Applied General Qualifications

23
As shown in Figure 4.1, the majority of institutions that offered Applied General qualifications planned to maintain their current offer (71%), while around one in five (21%) planned to increase the number of Applied General qualifications they offer. In comparison, 7% planned to decrease the number of Applied General qualifications that they offered to students.
Figure 4.1 Post-16 institutions offering or planning to offer technical courses or Applied General qualifications and whether those currently offering these courses plan to increase or decrease provision
21% 71% 7% 1%
Increase Maintain the same Decrease Don't know
59% 2% 39%
Offer Planing to offer Neither
Base: post-16 institutions that offered Applied General qualifications (289)
Base: post-16 institutions that offered technical courses (256)
53% 8% 40%
Offer Planning to offer NeitherBase: all post-16 institutions (421)
Base: all post-16 institutions (421)
Technical courses
Applied General qualifications
27% 67% 4%2%
Increase Maintain the same Decrease Don't know
Technical courses
Technical courses were offered by just over half of post-16 institutions (53%, Figure 4.1). In wave 5 of the omnibus (in Spring 2017), a slightly different question was asked, and hence results are not directly comparable (in wave 5, 67% offered either vocational or technical qualifications).
As with Applied General qualifications, FE colleges were more likely to offer technical courses (88%) compared to schools with sixth forms (49%) and special schools (48%). Among institutions that did not offer technical qualifications, 16% were planning to offer them in the next 12 months (equivalent to 8% of all post-16 institutions).
Almost all institutions that offered apprenticeships also offered technical courses (96%). Institutions with level 4 and 5 students were also more likely to offer technical courses (87%) than those who had no level 4 or 5 learners (48%).

24
The majority of institutions that offered technical courses planned to maintain their current offering (67%), while just over a quarter 27% were planning to increase the number of technical courses they offer. Four percent that offered technical courses expected to decrease the number of these courses that they offered to students.
4.2. Private training providers
Two-thirds (66%) of private training providers offered technical courses and just under a fifth (18%) offered Applied General qualifications. A quarter of providers who did not offer technical courses were planning to introduce them in the next 12 months (equivalent to 9% of all private training providers), while 4% of providers who did not offer Applied General qualifications were planning to offer them in the same timeframe.
As shown in Figure 4.2, just under a half of providers (49%) that offered technical courses were planning to increase their offer in the next 12 months (e.g. by offering qualifications in more subjects or at more levels), whilst 37% reported that their provision would remain the same. Similar findings were found for Applied General qualifications, with 53% of private training providers planning to increase their offer in the next 12 months and 38% stating that their provision would remain the same.
Figure 4.2 Private training providers planning to increase, maintain or decrease the number of technical courses and Applied General qualifications students take in the next 12 months
53% 38% 4% 4%
Increase Maintain the same Decrease Don't know
81% 4% 15%
Offer Planing to offer Neither
Base: private training providers that offer Applied General qualifications (45)
Base: private training providers that offer technical courses (163)
66% 9% 25%
Offer Planning to offer Neither
Base: all private training providers (246)
Technical courses
Applied General qualifications
49% 37% 3% 10%
Increase Maintain the same Decrease Don't know
Base: all private training providers (246)
25
5. Apprenticeships and Traineeships This chapter examines the provision of apprenticeships and traineeships at post-16 institutions and private training providers. It also investigates whether the introduction of the apprenticeship levy in April 2017 has impacted the number of employers that institutions and providers now work with, and the number of their students now placed on apprenticeships.
Recently there has been a significant push to increase both the quantity and quality of apprenticeships, with the Government committing to an additional 3 million apprenticeship starts in England by 202029. The cost of this will be offset in part by the apprenticeship levy (for businesses with annual pay bills of more than £3 million), which was announced in the summer budget of 2015 and came in to force in April 2017.30
Apprenticeships combine practical training in the workplace, allowing participants aged 16 or over to gain job specific skills, earn a wage and have paid holiday, as well as time for study (a minimum of 20%) that is related to the workplace role. Apprenticeships can be taken at levels 2 to 7, and last from one to five years dependent upon the level.31
Traineeships are designed to help young people aged 16 to 24 who want to get an apprenticeship or full-time employment but do not currently have the appropriate skills or experience. Traineeships last up to 6 months and include: work preparation training provided by a training organisation, English and maths support if required, provided by a training organisation and a high-quality work experience placement with an employer.
5.1. Post-16 institutions
Apprenticeships were offered by one in ten institutions (10%), and traineeships offered by 6%. These findings show no significant change from wave 5 of the omnibus (in Spring 2017), when 12% offered apprenticeships and 7% offered traineeships. There was quite a range of response by type of institution, with FE Colleges much more likely than schools with sixth forms and special schools to offer both apprenticeships and traineeships, as shown by Table 5.1.
29 HM Government (2015) English Apprenticeships: Our 2020 Vision 30 HM Revenue and Customs (2016): Apprenticeship levy
26
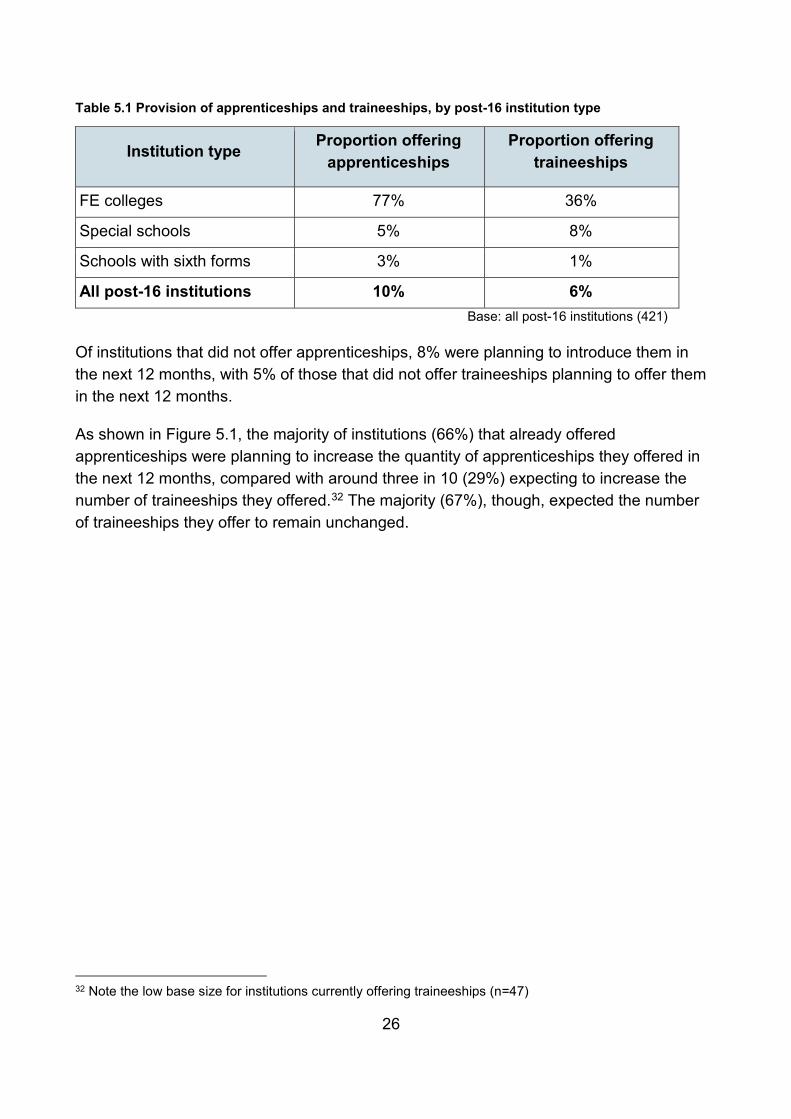
Table 5.1 Provision of apprenticeships and traineeships, by post-16 institution type
Institution type Proportion offering apprenticeships
Proportion offering traineeships
FE colleges 77% 36%
Special schools 5% 8%
Schools with sixth forms 3% 1%
All post-16 institutions 10% 6% Base: all post-16 institutions (421)
Of institutions that did not offer apprenticeships, 8% were planning to introduce them in the next 12 months, with 5% of those that did not offer traineeships planning to offer them in the next 12 months.
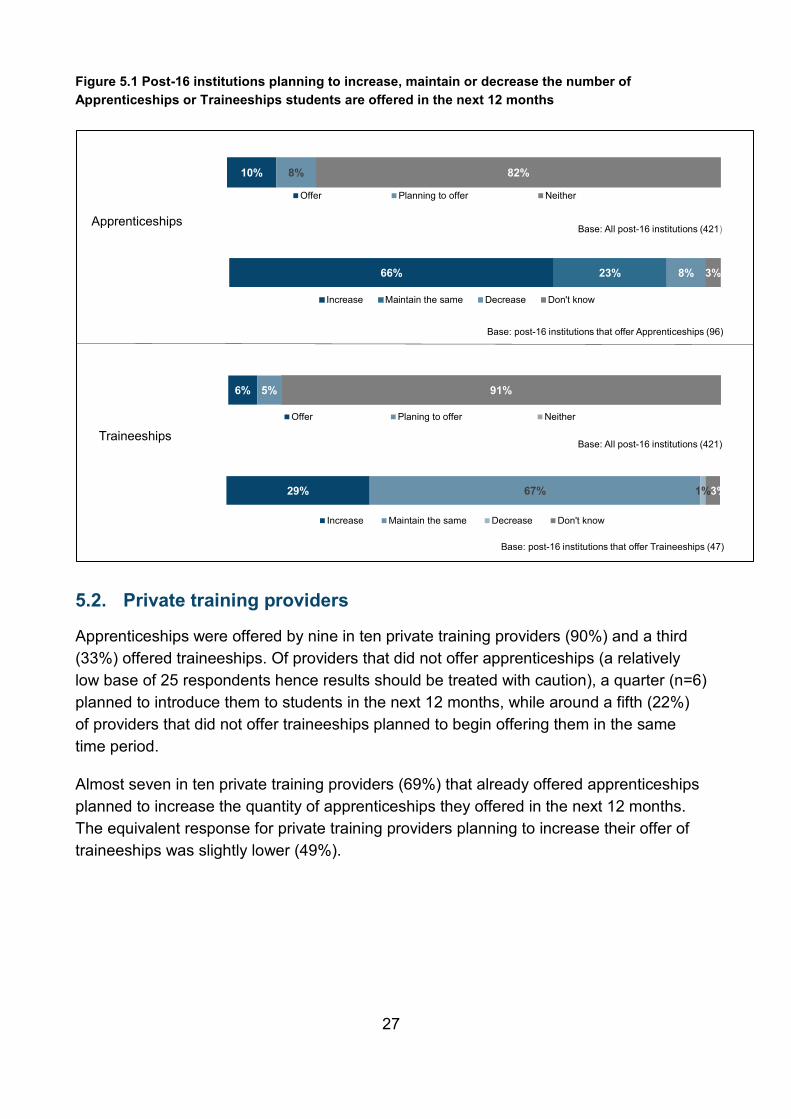
As shown in Figure 5.1, the majority of institutions (66%) that already offered apprenticeships were planning to increase the quantity of apprenticeships they offered in the next 12 months, compared with around three in 10 (29%) expecting to increase the number of traineeships they offered.32 The majority (67%), though, expected the number of traineeships they offer to remain unchanged.
32 Note the low base size for institutions currently offering traineeships (n=47)
27
Figure 5.1 Post-16 institutions planning to increase, maintain or decrease the number of Apprenticeships or Traineeships students are offered in the next 12 months
6% 5% 91%
Offer Planing to offer Neither
Traineeships
66% 23% 8% 3%
Increase Maintain the same Decrease Don't know
29% 67% 1%3%
Increase Maintain the same Decrease Don't know
Base: post-16 institutions that offer Traineeships (47)
Base: post-16 institutions that offer Apprenticeships (96)
10% 8% 82%
Offer Planning to offer Neither
Base: All post-16 institutions (421)
Base: All post-16 institutions (421)
Apprenticeships
5.2. Private training providers
Apprenticeships were offered by nine in ten private training providers (90%) and a third (33%) offered traineeships. Of providers that did not offer apprenticeships (a relatively low base of 25 respondents hence results should be treated with caution), a quarter (n=6) planned to introduce them to students in the next 12 months, while around a fifth (22%) of providers that did not offer traineeships planned to begin offering them in the same time period.
Almost seven in ten private training providers (69%) that already offered apprenticeships planned to increase the quantity of apprenticeships they offered in the next 12 months. The equivalent response for private training providers planning to increase their offer of traineeships was slightly lower (49%).
28
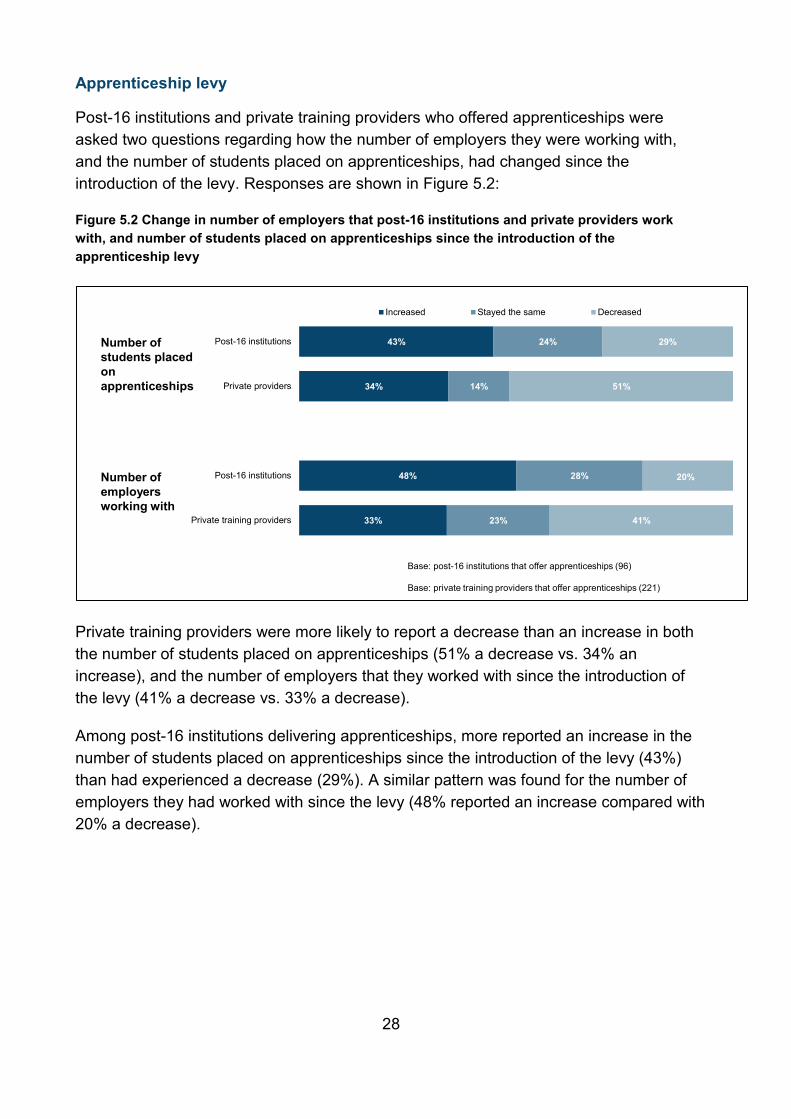
Apprenticeship levy
Post-16 institutions and private training providers who offered apprenticeships were asked two questions regarding how the number of employers they were working with, and the number of students placed on apprenticeships, had changed since the introduction of the levy. Responses are shown in Figure 5.2:
Figure 5.2 Change in number of employers that post-16 institutions and private providers work with, and number of students placed on apprenticeships since the introduction of the apprenticeship levy
33%
48%
34%
43%
23%
28%
14%
24%
41%
20%
51%
29%
Private training providers
Post-16 institutions
Private providers
Post-16 institutions
Increased Stayed the same Decreased
Base: post-16 institutions that offer apprenticeships (96)
Base: private training providers that offer apprenticeships (221)
Number of employers working with
Number of students placed on apprenticeships
Private training providers were more likely to report a decrease than an increase in both the number of students placed on apprenticeships (51% a decrease vs. 34% an increase), and the number of employers that they worked with since the introduction of the levy (41% a decrease vs. 33% a decrease).
Among post-16 institutions delivering apprenticeships, more reported an increase in the number of students placed on apprenticeships since the introduction of the levy (43%) than had experienced a decrease (29%). A similar pattern was found for the number of employers they had worked with since the levy (48% reported an increase compared with 20% a decrease).

29
6. Provision of post-16 qualifications (excluding Apprenticeships and Traineeships)
This chapter explores the provision of GCSEs and other post-16 qualifications offered by post-16 institutions and private training providers.
In alignment with reforms to AS and A level qualifications, GCSE qualifications have undergone significant reform in recent years, moving to a two-year linear design model, a new grading scale, and more demanding content.33 The first of the new GCSEs in English literature, English language and mathematics became available for first teaching from September 2015, with first exams in 2017. A further wave of new GCSEs were taught for the first time in 2016, 2017 and 2018. Some GCSE, AS and A level subjects were removed during the reform process.34
Post-16 institutions and private training providers also continue to offer a wide range of qualifications at different levels to suit students with a more vocational focus, or for whom an academic pathway may not be relevant.
6.1. Post-16 institutions
GCSEs
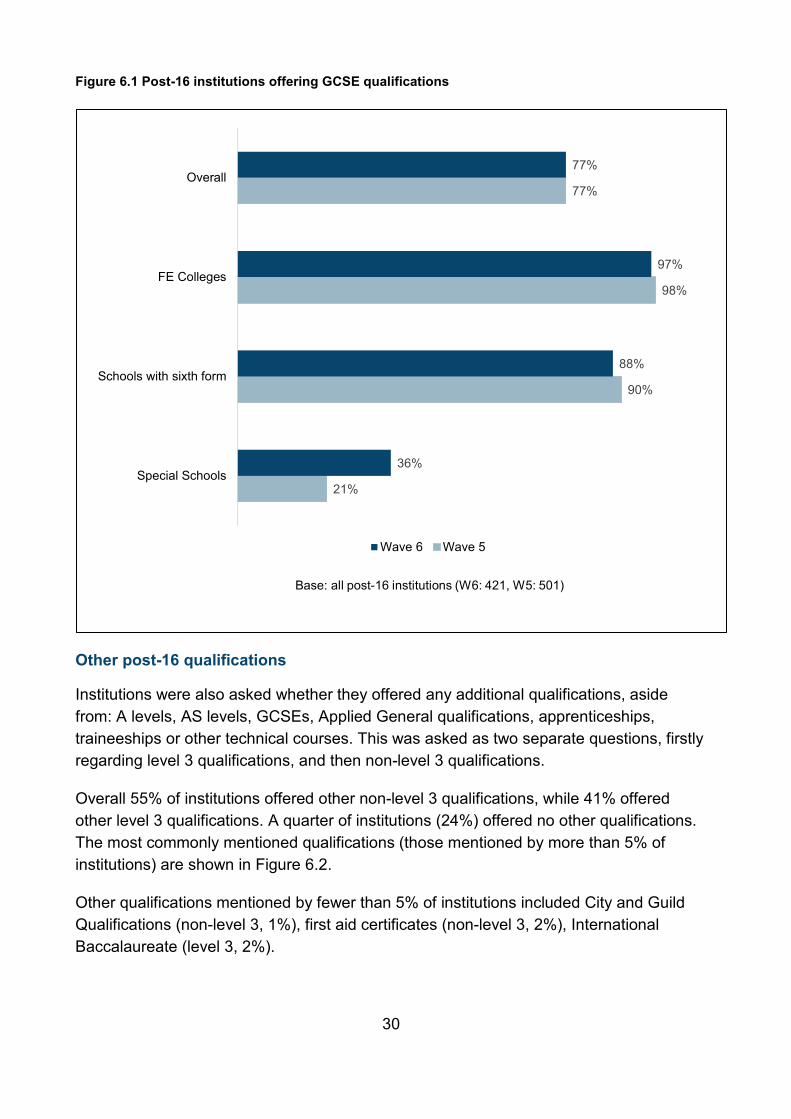
GCSE qualifications were offered by 77% of institutions. As shown in Figure 6.1 this is unchanged from wave 5 of the omnibus in Spring 2017 (77%). Almost all FE colleges offered GCSEs (97%) and were more likely to do so than schools with sixth forms (88%) and special schools (36%) – the latter figure, although lower than the average across all post-16 institutions, represents an increase on the wave 5 figure (21%).
33 Ofqual (2015) Ofqual postcards: GCSE, AS and A level reforms 34 Ofqual (2015) guidance: GCSE, AS and A level subjects that are not being reformed
30
Figure 6.1 Post-16 institutions offering GCSE qualifications
21%
90%
98%
77%
36%
88%
97%
77%
Special Schools
Schools with sixth form
FE Colleges
Overall
Wave 6 Wave 5
Base: all post-16 institutions (W6: 421, W5: 501)
Other post-16 qualifications
Institutions were also asked whether they offered any additional qualifications, aside from: A levels, AS levels, GCSEs, Applied General qualifications, apprenticeships, traineeships or other technical courses. This was asked as two separate questions, firstly regarding level 3 qualifications, and then non-level 3 qualifications.
Overall 55% of institutions offered other non-level 3 qualifications, while 41% offered other level 3 qualifications. A quarter of institutions (24%) offered no other qualifications. The most commonly mentioned qualifications (those mentioned by more than 5% of institutions) are shown in Figure 6.2.
Other qualifications mentioned by fewer than 5% of institutions included City and Guild Qualifications (non-level 3, 1%), first aid certificates (non-level 3, 2%), International Baccalaureate (level 3, 2%).

31
Figure 6.2 Other qualifications offered by institutions (unprompted responses)35
24%
7%
9%
11%
14%
14%
None
Functional Skills
Duke of Edinburgh
ASDAN qualfications
Extended Project qualifications*
BTEC *
Base: all post-16 institutions (421) *Level 3 qualifications
Schools with sixth forms were more likely to offer Extended Project qualifications (20%), and BTECs (18%), in comparison with special schools (0% and 2% respectively) and FE Colleges (3% and 8% respectively). Special schools were more likely to offer ASDAN qualifications (46%), than either schools with sixth forms (1%) or FE colleges (1%).
35 This question was asked for level 3 qualifications firstly, then non-level 3 qualifications. Figure 6.2 combines responses to these two questions, with level 3 qualifications highlighted with an asterisk. ‘Other’ qualifications refers to qualifications excluding A levels, AS levels, GCSEs, Applied General qualifications, apprenticeships, traineeships, and technical courses.

32
There were also several qualifications that while only offered by a small percentage of all institutions, were offered more prominently amongst special schools:
Qualification(s) Special schools FE colleges
Entry level 1 and 2 16% 8%
Entry level 3 and 4 13% 3%
The Arts award 16% 0%
AQA Unit awards 11% 0% Base (61) Base (108)
FE colleges were also more likely to offer Level 3 Diplomas (19%) than schools with sixth forms (2%) and no special schools (none did so).
6.2. Private training providers
GCSEs
One in ten (10%) private training providers offered GCSE qualifications.
Other qualifications
Private training providers were asked if they offered any additional qualifications aside from: A levels, AS levels, GCSEs, Applied General qualifications, apprenticeships, traineeships or other technical courses. In spontaneous responses, private training providers were more likely than institutions to list the additional qualifications they offered by level (rather than qualification type), in contrast with institutions, as shown in Figure 6.3 below which shows all responses given by 5% or more of private providers.

33
Figure 6.3 Other qualifications offered by private providers (unprompted responses)36
23%
7%
7%
8%
8%
9%
10%
12%
25%
None
Level 2 apprenticeships
Functional Skills level 1
Functional Skills level 2
Level 3 diploma*
Level 5 qualifications (inc. DipHE or foundation degree)
Level 4 (inc. CertHE, level 4 certificate)
Level 1 qualifications (inc. first certificate or level 1diploma)
Level 2 qualifications (inc. level 2 certificate or musicgrades 4 and 5)
Base: all private training providers (246) * Level 3 qualifications
A quarter (25%) of providers offered level 2 qualifications, whilst around 1 in 10 offered level 1 qualifications (12%), level 4 qualifications (10%) and level 5 qualifications (9%). Almost a quarter (23%), offered no other level 3 or non-level 3 qualifications.
36 This question was asked for level 3 qualifications firstly, then non-level 3 qualifications. Figure 6.3 combines responses to these two questions, with level 3 qualifications offered highlighted with an asterisk. ‘Other’ qualifications refer to qualifications excluding A levels, AS levels, GCSEs, Applied General qualifications, apprenticeships, traineeships, and technical courses.

34
7. Level 4 and 5 provision This chapter looks at the provision of level 4 and 5 qualifications in post-16 institutions and private training providers, as well as challenges institutions and providers experience in offering qualifications at these levels.
Level 4 and 5 provision is equivalent to Higher Education Certificates or Diplomas, and includes a range of technical, vocational and academic qualifications. In 2017 a government review, building on the Post-16 Skills plan, was undertaken with a focus on technical qualifications at levels 4 and 5, to ensure that learners are able to progress effectively from the lower level vocational qualifications, and to consider how these qualifications work for those already in the workforce looking to upskill or retrain. 37
7.1. Post-16 institutions
One in eight institutions (12%) had students studying at level 4/5. This was higher for FE colleges (88%) than schools with sixth forms (5%) or special schools (5%). Institutions that offered provision at these levels were asked what they felt the challenges were offering this provision to their students (Figure 7.1).
Figure 7.1 Challenges to post-16 institutions in offering level 4/5 provision (spontaneous)
14%
5%
9%
13%
26%
29%
29%
None
Learners lack time to study
Lack of suitable qualifications
Ensuring learners have the skills/ability to cope with the demands of L4/5study
Level of interest among potential students in accessing L4/5 provision
Attracting and retaining teachers with industry relevant skills
Lack of funds to support investment in L4/5 infrastructure and capacity
Base: post-16 institutions that offer level 4 and 5 provision (110)
37 Gov.uk (2017) Level 4 & 5 technical education to be reviewed

35
The majority of institutions with level 4/5 students felt there were challenges to delivering qualifications at this level (just 14% felt there were no challenges). The three key challenges, mentioned by just over a quarter, were: a lack of funding to support investment in Level 4/5 infrastructure and capacity (29%), attracting and retaining teachers with relevant industry skills (29%) and the perceived level of interest among potential students in undertaking qualifications at this level (26%).
Institutions that offered level 4/5 provision were also asked about the input of employers in to the design and delivery of their courses, to ensure they are fit for entering employment. Almost two-thirds (65%) stated that employers contributed to the design or delivery, with FE colleges most likely to state that employers were involved in this way (93%).
Figure 7.2 presents results on the ways in which institutions indicated that employers are involved in the design and delivery of their courses. As the proportions of schools with sixth forms and special schools offering level 4/5 provision were very low, results are shown just for FE colleges (and based on those FE colleges indicating employers’ contributions). Employers most often contributed to design and delivery of L4/5 provision through involvement in informing curriculum design (76%). A third of FE colleges (34%) also reported employer involvement in providing students with work placements.
Figure 7.2 Ways in which employers contribute to the design and delivery of Level 4/5 courses in FE colleges
76%
Informing curriculum
design
34%
Providing work placements
20%
Offering work based projects
16%
Consultation / feedback
Base: FE colleges where employers contribute to L4/5 course (88)

36
7.2. Private training providers
Level 4 or 5 provision was offered by 60% of private training providers. Private training providers were twice as likely as institutions to report they had ‘no challenges’ in delivering qualifications at this level (28% vs 14% of post-16 institutions)
Private training providers who offered level 4/5 provision most commonly cited a lack of learner time as a challenge to offering this provision (27%), followed by lack of funds (16%) and attracting and retaining teachers with industry relevant skills (12%).
Figure 7.3 Challenges to private training providers in offering level 4/5 provision (spontaneous)
28%
7%
3%
4%
7%
7%
9%
9%
12%
16%
27%
None
Other challenges
Increased demand on staff
Repeated changes to apprenticeships / qualifications
Lack of suitable qualifications
Level of interest among potential students in accessing L4/5 provision
Ensuring learners have the skills/ability to cope with the demands of L4/5 study
Employers are more engaged with other levels of provision
Attracting and retaining teachers with industry relevant skills
Lack of funds to support investment in L4/5 infrastructure and capacity
Learners lack time to study
Base: private training providers that offer level 4 and 5 provision (148)
Among private training providers that offered level 4/5 provision, four in five (81%) stated that employers were involved in the delivery or design of the provision to ensure it was relevant to entering employment. Figure 7.4 shows how employers contributed to level 4/5 provision at these providers.

37
Figure 7.4 How employers contribute to the design and delivery of Level 4/5 courses for Private training providers
61%
Informing curriculum
design
21%
Providing work placements
27%
Offering work based projects
24%
Consultation / feedback
Base: private training providers where employers contribute to L4/5 course (120)
As with institutions, where employers contributed to design and delivery of level 4 and 5 courses, they most commonly contributed to informing curriculum design (61%). Around a quarter of private training providers indicated that employers provided consultations / feedback (27%) or offered work-based projects (24%), while around a fifth (21%) worked with employers to provide work placements.

38
8. Post-16 Mathematics This chapter examines the awareness and impact of the maths premium announced in the 2017 Autumn budget, as well as the provision of AS level and A level maths, AS level and A level further maths and core maths qualifications in post-16 institutions and private training providers. Finally, it looks at the challenges faced in offering level 3 maths qualifications to their students.
In the last year the Government has taken considerable steps to increase participation in level 3 mathematics qualifications among post-16 learners. A key element to this has been the introduction of the advanced maths premium, providing institutions and providers with £600 per year per additional student studying a level 3 maths qualification. The first premium will be paid in the 16 to 19 funding allocations for the 2019-20 academic year.38
The advanced maths premium is designed to increase opportunity and choice for more students to take maths at A or AS level, potentially with further maths alongside. It also aims to engage more students who have not chosen the A level route in a core maths qualification. Core maths qualifications were introduced in 2014 to encourage those that achieve a C or above in GCSE maths who do not wish to move on to maths A level, to engage in a qualification that will help them to gain valuable quantitative skills.
8.1. Post-16 institutions
Maths premium
All post-16 institutions were asked whether they were aware of the maths premium announced in the 2017 Autumn budget, and if they were aware, whether they planned to offer more maths qualifications as a result of the premium.
Just under two-thirds of institutions were aware of the Maths premium (63%), with FE colleges more likely to be aware (93%) than both schools with sixth forms (72%) and particularly special schools (26%).
Awareness was higher amongst institutions in the least deprived areas (69%) than the most deprived (49%).
38Education and Skills Funding Agency (ESFA) (2018) 16 to 19 funding: advanced maths premium

39
Of those who were aware of the maths premium, three in ten institutions (31%) planned more maths qualifications in response. This is equivalent to one in five (20%) of all post-16 institutions. There were no significant differences between types of provider when considering planning to offer more maths qualifications in response to the maths premium.
Level 3 Maths provision
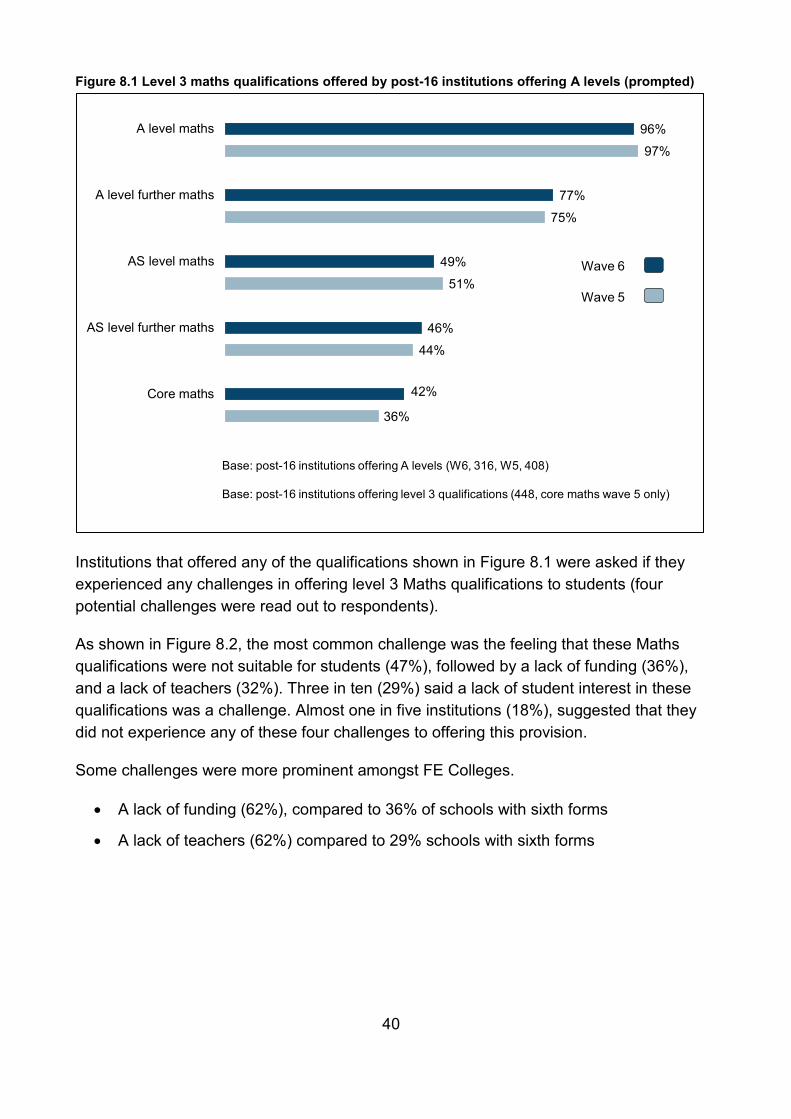
Institutions that offered A levels were asked what level 3 Maths qualifications they offered. As shown in Figure 8.1, A level maths was offered by almost all institutions (96%), with over three-quarters offering A level further maths (77%). Just under half offered AS level maths (49%), further maths (46%), or core maths (42%) qualifications.
The proportions of institutions that offered level 3 maths qualifications were largely consistent with wave 5 findings (in Spring 2017), however the proportion that offered core maths in wave 6 (42%) represented an increase from the wave 5 Figure (34%).
FE colleges were more likely to offer AS level further maths (59%) and core maths (64%) in comparison with schools with sixth forms (46%, 39% respectively).
Institutions in the most deprived areas (quintile 5) were more likely to offer AS level maths (63%) than all other areas (quintiles 1-4).
40
Figure 8.1 Level 3 maths qualifications offered by post-16 institutions offering A levels (prompted)
36%
42%
44%46%
51%49%
75%77%
97%96%
Core maths
AS level further maths
AS level maths
A level further maths
A level maths
Wave 6
Wave 5
Base: post-16 institutions offering A levels (W6, 316, W5, 408)
Base: post-16 institutions offering level 3 qualifications (448, core maths wave 5 only)
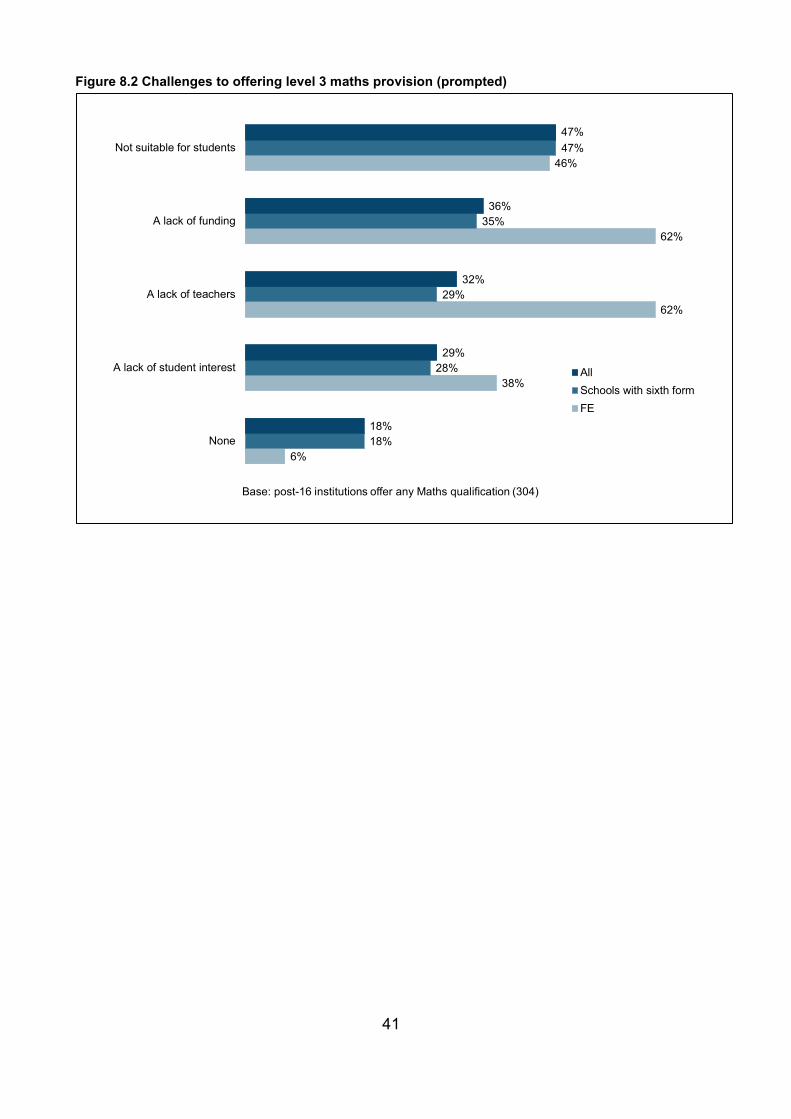
Institutions that offered any of the qualifications shown in Figure 8.1 were asked if they experienced any challenges in offering level 3 Maths qualifications to students (four potential challenges were read out to respondents).
As shown in Figure 8.2, the most common challenge was the feeling that these Maths qualifications were not suitable for students (47%), followed by a lack of funding (36%), and a lack of teachers (32%). Three in ten (29%) said a lack of student interest in these qualifications was a challenge. Almost one in five institutions (18%), suggested that they did not experience any of these four challenges to offering this provision.
Some challenges were more prominent amongst FE Colleges.
• A lack of funding (62%), compared to 36% of schools with sixth forms
• A lack of teachers (62%) compared to 29% schools with sixth forms
41
Figure 8.2 Challenges to offering level 3 maths provision (prompted)
6%
38%
62%
62%
46%
18%
28%
29%
35%
47%
18%
29%
32%
36%
47%
None
A lack of student interest
A lack of teachers
A lack of funding
Not suitable for students
AllSchools with sixth formFE
Base: post-16 institutions offer any Maths qualification (304)

42
9. English for speakers of other languages (ESOL) This chapter looks at ESOL provision in post-16 institutions and private training providers and any change in demand for this provision over the last 5 years.
In recent years there has been considerable focus from the government on integration to create more cohesive, tolerant, communities. The government-commissioned Casey Review (2016) noted that a lack of integration as a nation could result in significant economic and social costs (with one study noting that a poorly integrated society could result in an approximate cost of £6 billion a year).39 Actions to improve English language proficiency in the UK were set out in the government’s Integrated Communities Strategy Green Paper (March 2018).40
English language skills are considered to be a key factor to both successful integration and employability. Analysis of 2011 census data reported that the employment rate of those with low English language proficiency is 17% lower than those with high English language proficiency.41
9.1. Post-16 institutions
Just over one in five institutions (22%) offered ESOL provision to their students, with FE colleges (74%) more likely to offer ESOL than special schools (33%) and schools with sixth forms (13%).
Provision of ESOL was higher among:
• Institutions with level 4/5 learners (53% vs 18%)
• Institutions in most deprived areas (33%)
Institutions that delivered ESOL provision were asked the extent to which the number of students taking up the provision had increased, stayed the same or decreased over the last 5 years (Figure 9.1).
39 Dame Louis Casey DBE CB (2016) The Casey Review: A review in to opportunity and integration 40 HM Government (2018) Integrated Communities green paper 41 Ibid
43
Figure 9.1 Uptake of ESOL provision over the last 5 years
9% 13% 37% 40%
IncreasedStayed the same
DecreasedDon’t know
Base: post-16 institutions that deliver ESOL provision (132)
Two-fifths of institutions (40%) reported that the number of learners accessing ESOL provision had increased over the last five years whilst a similar proportion (37%) stated that it had remained the same. Around one in eight (13%) stated that their uptake had decreased, with FE colleges more likely to have stated this was the case (26%).
Institutions that had experienced a decrease in the number of students undertaking ESOL provision were asked why this was. Whilst the base size for this question is too small to report percentages (n=25), the main reasons mentioned (in order of frequency of mentioned) were:
• Changes or decline in local demand for ESOL
• Changes to ESOL funding
• Changes to adult skills funding overall
• Changes in the organisation’s priorities or strategies.
9.2. Private training providers
Approximately one in six private training providers (15%) offered ESOL provision. Although again the base size is too small to report percentages (n=38), just over half of private training providers that offered ESOL provision indicated that the number of students taking ESOL provision had increased over the last 5 years, while around a third reported that it had stayed the same.

44
10. Careers education This chapter considers the activities that post-16 institutions and private training providers undertake to prepare their learners for employment and higher education. It explores the nature of careers provision within these institutions and providers as well as the number and scale of opportunities available to learners to engage with employers.
The increasing pressure on schools to deliver high quality careers education is well-documented. Following the release of the Post-16 Skills Plan42 in 2016 – a framework outlining the proposed reformation of post-16 education – the government has produced a series of documents (including papers on statutory careers guidance43 and careers strategy44) to support and instruct schools in relation to careers education.
The government aims to develop a careers system where all young people in secondary education are given access to stable, structured and timely careers advice, given by individuals with the right skills and experience.24 The Careers and Enterprise Company was established in 2014 with the aim of connecting employers with schools and colleges and providing greater opportunities for young people to learn about the workplace.
A key focus of Wave 6 of the Post-16 Omnibus was to ascertain schools’ current approach to careers education and identify areas where schools require more support to provide a high-quality careers service.
10.1. Post-16 institutions
Delivery of key indicators of careers education
Institutions were asked to indicate whether a series of statements applied to careers education at their institution. This included whether the institution had identified a lead individual with responsibility for overseeing the institution’s careers programme and whether on leaving the institution university applicants had visited at least two providers of higher education.
As illustrated in Figure 10.1, a majority of institutions offered (or fulfilled) the aspects of careers education covered in the survey. Nearly all offered personal careers guidance (97%) and a similar proportion had identified a lead individual responsible for overseeing the careers programme at the institution (94%). Fewer institutions offered university applicants the opportunity to visit at least two universities to meet staff and students 42 Department for Business, Innovation & Skills (BEIS), DfE (2016) Post-16 Skills Plan 43 Careers guidance and access for education and training providers https://assets.publishing.service.gov.uk/government/uploads/system/uploads/attachment_data/file/748474/181008_schools_statutory_guidance_final.pdf 44 Careers strategy: making the most of everyone’s skills and talents https://assets.publishing.service.gov.uk/government/uploads/system/uploads/attachment_data/file/664319/Careers_strategy.pdf
45
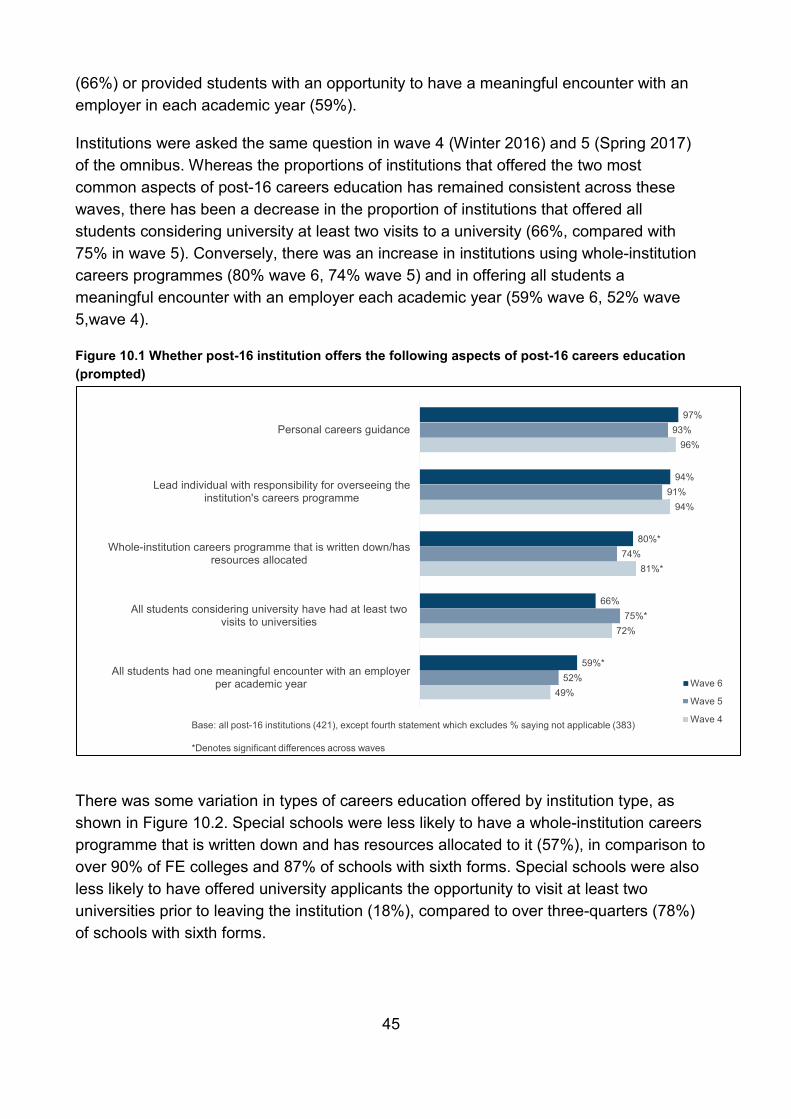
(66%) or provided students with an opportunity to have a meaningful encounter with an employer in each academic year (59%).
Institutions were asked the same question in wave 4 (Winter 2016) and 5 (Spring 2017) of the omnibus. Whereas the proportions of institutions that offered the two most common aspects of post-16 careers education has remained consistent across these waves, there has been a decrease in the proportion of institutions that offered all students considering university at least two visits to a university (66%, compared with 75% in wave 5). Conversely, there was an increase in institutions using whole-institution careers programmes (80% wave 6, 74% wave 5) and in offering all students a meaningful encounter with an employer each academic year (59% wave 6, 52% wave 5,wave 4).
Figure 10.1 Whether post-16 institution offers the following aspects of post-16 careers education (prompted)
49%
72%
81%*
94%
96%
52%
75%*
74%
91%
93%
59%*
66%
80%*
94%
97%
All students had one meaningful encounter with an employerper academic year
All students considering university have had at least twovisits to universities
Whole-institution careers programme that is written down/hasresources allocated
Lead individual with responsibility for overseeing theinstitution's careers programme
Personal careers guidance
Wave 6
Wave 5
Wave 4Base: all post-16 institutions (421), except fourth statement which excludes % saying not applicable (383)
*Denotes significant differences across waves
There was some variation in types of careers education offered by institution type, as shown in Figure 10.2. Special schools were less likely to have a whole-institution careers programme that is written down and has resources allocated to it (57%), in comparison to over 90% of FE colleges and 87% of schools with sixth forms. Special schools were also less likely to have offered university applicants the opportunity to visit at least two universities prior to leaving the institution (18%), compared to over three-quarters (78%) of schools with sixth forms.

46
Figure 10.2 Proportion of post-16 institutions offering the following aspects of careers education by institution type
99%
96%
87%
78%
62%
98%
98%
92%
46%
61%
92%
85%
57%
18%
46%
Personal careers guidance
Lead individual for overseeing careers programme
Whole-institution careers programme that is written down and hasresources allocated
University applicants have had at least two visits to universities
Post-16 students had encounter with an employer in each academic year
Schools with sixth formsFE collegesSpecial schools
Base: all post-16 institutons (421), *except the 4th statement which excludes the 9% of institutions saying ‘not applicable’ (383)
Institutions that offered A levels were more likely than those who did not to report that students considering university had visited at least two universities to meet staff and students. Over three-quarters (77%) of institutions that offered A levels delivered this aspect of careers education.

47
Careers opportunities with employers
Institutions with learners in mainstream education were asked what opportunities they offered students (without SEND) to engage with employers in the 2017/18 academic year. Nearly all (96%) institutions reported that their students were given the opportunity to attend careers and skills fairs and receive talks from careers advisors. E-mentoring with an employer (23%) and mentoring with an employee (39%) were the least common opportunities offered by institutions.
The survey also asked institution that offered each type of opportunity, what the student take-up was. The Figures in circles at the right of Figure 10.3 show the proportion of institutions where more than half the students had undertaken a particular opportunity.45
Figure 10.3 Proportion of post-16 institutions offering specific careers opportunities to students at least once during each year of their course (prompted)
23%
39%
47%
51%
67%
75%
86%
88%
96%
96%
E-mentoring with an employer
Mentoring with an employee
Employer-led career learning
Enterprise competition
Employability workshops
Enterprise activities
Mock interviews
CV workshops
Attending careers and skills fairs
Talks with careers advisors
% with ‘more than half’ ofstudents experiencing these in each year of
their course
77%
81%
46%
70%
31%
36%
9%
25%
12%
4%
Base: post-16 institutions with mainstream pupils (361)
81%
85%
53%
79%
41%
53%
17%
53%
30%
18%
Institutions that offered opportunityAll
% of institutions offering at all
The opportunities that institutions were most likely to report that at least half of their students had taken up were generally those that were offered by the largest proportion of institutions overall. Around four in five (77%) institutions reported at least half their students had attended talks with careers advisors, and 81% said the same of attending
45 The first column of circular figures include the institutions not offering a particular type of careers opportunity – for these institutions, it was assumed that because they do not offer the opportunity in question, ‘none’ of the students would be participating that opportunity.

48
careers and skills fairs – these were two of the careers opportunities offered by the largest proportion of institutions. However, this was not always the case. Although 86% of institutions offered mock interviews, less than half (46%) said that more than half their students had undertaken mock interviews during each year of their course.
10.2. Private training providers
A similar pattern of provision of careers education opportunities was found among private training providers. Private providers were equally likely to have provided personal careers guidance to their students (89%) and relatively few (11%) ensured prospective university applicants visited two universities to meet staff and students.
Of the careers opportunities provided to students in mainstream education by private providers, the most prevalent were mentoring with an employee (67%) and mock interviews (66%). Around one in eight (13%) did not offer any careers opportunities to students. Just over half (55%) reported they had provided opportunities for their students to attend careers and skills fairs.
Figure 10.4 Careers opportunities offered by private training providers to their mainstream pupils (prompted)
67%
66%
64%
61%
60%
55%
44%
32%
29%
17%
Mentoring with an employee
Mock interviews
CV workshops
Talks with careers advisors
Employer-led career learning
Attending careers and skills fairs
Employability workshops
Enterprise activities
E-mentoring with an employer
Enterprise competition
Base: private training providers with mainstream pupils (246)
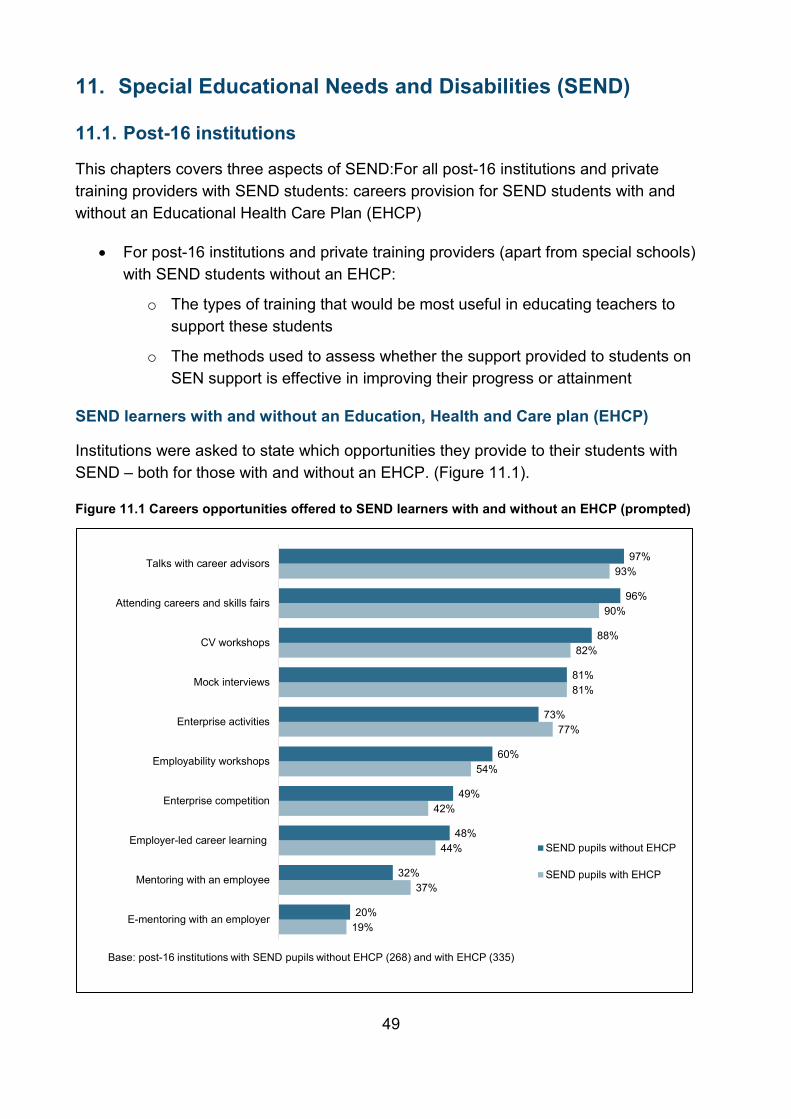
49
11. Special Educational Needs and Disabilities (SEND)
11.1. Post-16 institutions
This chapters covers three aspects of SEND:For all post-16 institutions and private training providers with SEND students: careers provision for SEND students with and without an Educational Health Care Plan (EHCP)
• For post-16 institutions and private training providers (apart from special schools) with SEND students without an EHCP:
o The types of training that would be most useful in educating teachers to support these students
o The methods used to assess whether the support provided to students on SEN support is effective in improving their progress or attainment
SEND learners with and without an Education, Health and Care plan (EHCP)
Institutions were asked to state which opportunities they provide to their students with SEND – both for those with and without an EHCP. (Figure 11.1).
Figure 11.1 Careers opportunities offered to SEND learners with and without an EHCP (prompted)
19%
37%
44%
42%
54%
77%
81%
82%
90%
93%
20%
32%
48%
49%
60%
73%
81%
88%
96%
97%
E-mentoring with an employer
Mentoring with an employee
Employer-led career learning
Enterprise competition
Employability workshops
Enterprise activities
Mock interviews
CV workshops
Attending careers and skills fairs
Talks with career advisors
SEND pupils without EHCP
SEND pupils with EHCP
Base: post-16 institutions with SEND pupils without EHCP (268) and with EHCP (335)

50
In line with the findings from the previous chapter (for mainstream learners), ‘talks with career advisors’ and ‘attending careers and skills fairs’ were the most frequently reported opportunities available, with nearly all institutions with SEND students stating that they provided these to SEND learners without an EHCP (97% and 96% respectively) and around nine in 10 provided these opportunities to SEND learners with an EHCP (93% and 90% respectively).
Similar to provision for mainstream students, ‘e-mentoring with an employer’ was the least common careers opportunity offered to SEND students (20% to SEND learners without an EHCP and 19% to those with an EHCP).
Comparing the order of responses in Figure 11.1 with those for mainstream students (shown in Figure 10.1), the opportunities available to students with SEND were very similar. They also did not vary greatly between students with and without an EHCP.
Supporting post-16 students with SEND
The SEN Support category was introduced to the Children and Families Act 2014 as a means of supporting children and young people who have SEND, but do not have an EHCP. Wave 6 of the Post-16 Omnibus Survey explored the additional teaching and monitoring practices schools undertook to support post-16 students with SEND but without an EHCP.
Institutions were also asked about the types of training that would be most useful in enabling teachers at the institution to effectively support students with SEND.
As shown in the left-hand column of Figure 11.2, ‘inclusive teaching46’ was the most common form of training institutions felt would be useful in enabling their teachers to effectively support post-16 students with SEND (61%). This was closely followed by training on designing study programmes with pathways to employment for students with SEND (56%).
46 Inclusive teaching or practice is defined in DfE’s ‘Inclusive Teaching and Learning in Higher Education as a route to Excellence Teaching’ report (2017), as “teaching which engages students in learning that is meaningful, relevant and accessible to all, embracing a view of the individual and of individual difference as a source of diversity that can enrich the lives and the learning of others. Inclusive learning therefore invests in the following principles: • Learning is enriched by the varied experiences of students • Accessible learning is relevant and approachable by all students • The curriculum and the means of delivery are both part of this accessibility • Students with full access to learning and teaching are more likely to engage with learning, and to reach their full potential”

51
The forms of training that fewest institutions felt would be useful for enabling teachers to support their SEND students were ‘EHC training’ (18%), ‘SEND Code of Practice’ (16%) and ‘awareness of appropriate legislation’ (13%).
Figure 11.2 Proportion of schools who would find certain teacher training useful to effectively support post-16 learners with SEND without an EHCP (prompted)
13%
16%
18%
29%
47%
56%
61%
Awareness of legislation
SEND Code of Practice
EHCP training
Awareness of funding
How to identify and support students with different SEND
Designing study programmes with pathways to employment
Inclusive teaching
*Post-16 institutions were asked to give up to three responsesBase: post-16 institutions with SEN students who do not have EHCP (268)
FE colleges (30%) were almost twice as likely as schools with sixth forms (16%) to report that EHCP training would be useful for their teachers in the process of effectively supporting post-16 students with SEND.
Also explored in the survey were the approaches used by teachers to monitor the impact of support provided to students with SEND (Figure 11.3). The most frequently used method to assess whether support for these students had improved their progress or attainment was the collection of parents, carers or students’ views on progress (96%). This was followed by information obtained from a previous education provider (84%) and progress assessments from colleagues or external professionals (82%).
In contrast, less than half (48%) of institutions used ‘more frequent and focused assessments of progress and ‘non-standard/bespoke progress measures’ (31%). FE colleges were significantly more likely than schools with sixth forms to employ these two methods; 77% of FE colleges reported they used ‘more frequent and focused assessments of progress’ for SEND students compared with to 44% of schools with sixth forms.
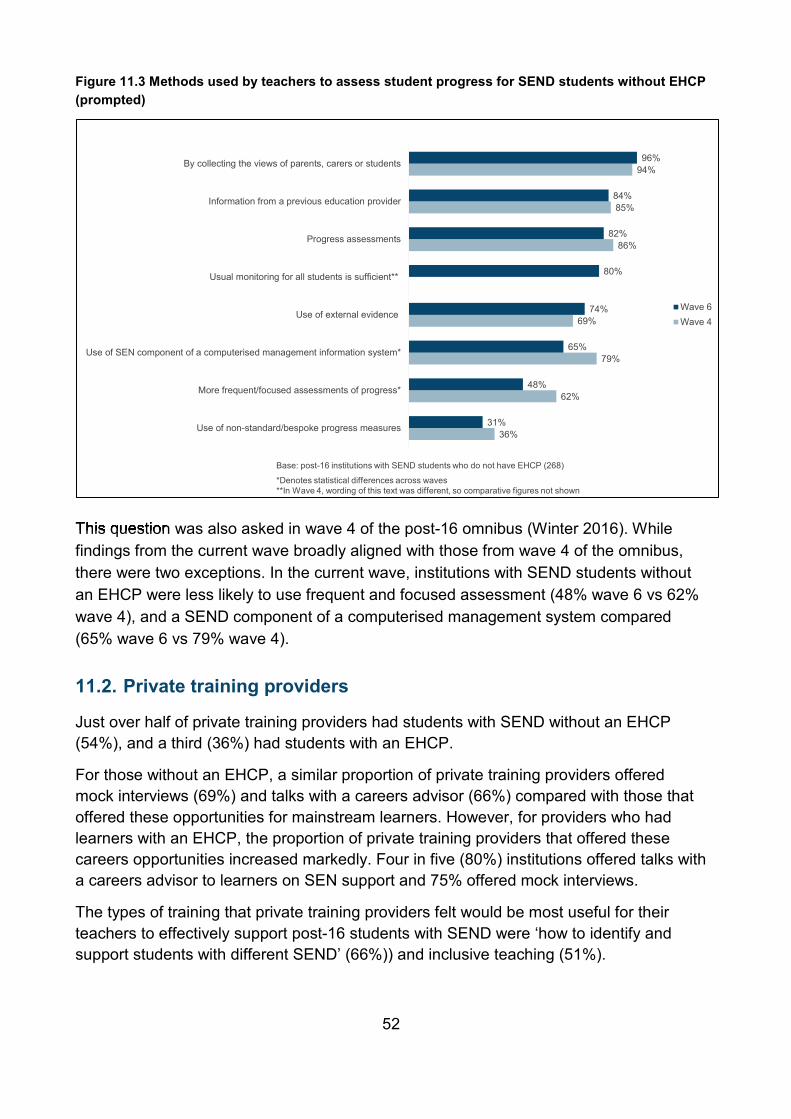
52
Figure 11.3 Methods used by teachers to assess student progress for SEND students without EHCP (prompted)
Base: post-16 institutions with SEND students who do not have EHCP (268)
36%
62%
79%
69%
86%
85%
94%
31%
48%
65%
74%
80%
82%
84%
96%
Use of non-standard/bespoke progress measures
More frequent/focused assessments of progress*
Use of SEN component of a computerised management information system*
Use of external evidence
Usual monitoring for all students is sufficient**
Progress assessments
Information from a previous education provider
By collecting the views of parents, carers or students
Wave 6Wave 4
*Denotes statistical differences across waves **In Wave 4, wording of this text was different, so comparative figures not shown
This question was also asked in wave 4 of the post-16 omnibus (Winter 2016). While findings from the current wave broadly aligned with those from wave 4 of the omnibus, there were two exceptions. In the current wave, institutions with SEND students without an EHCP were less likely to use frequent and focused assessment (48% wave 6 vs 62% wave 4), and a SEND component of a computerised management system compared (65% wave 6 vs 79% wave 4).
11.2. Private training providers
Just over half of private training providers had students with SEND without an EHCP (54%), and a third (36%) had students with an EHCP.
For those without an EHCP, a similar proportion of private training providers offered mock interviews (69%) and talks with a careers advisor (66%) compared with those that offered these opportunities for mainstream learners. However, for providers who had learners with an EHCP, the proportion of private training providers that offered these careers opportunities increased markedly. Four in five (80%) institutions offered talks with a careers advisor to learners on SEN support and 75% offered mock interviews.
The types of training that private training providers felt would be most useful for their teachers to effectively support post-16 students with SEND were ‘how to identify and support students with different SEND’ (66%)) and inclusive teaching (51%).

53
In terms of assessing the impact of support on progress or attainment of students with SEND, private training providers were most likely to say that teachers used ‘progress assessments from colleagues or external professionals’ (82%) and ‘more frequent and focused assessments of progress’ (81%). They were least likely to use the ‘SEND component of a computerised management information system’ (37%).

54
12. Teacher workloads This chapter focuses on the actions post-16 institutions and private training providers have taken to evaluate and reduce ‘unnecessary’ teacher workload (using questions also asked in the School Snapshot Survey47) and the extent to which this has impacted the manageability of teacher workloads.
12.1. Post-16 institutions
Activities undertaken by institutions to reduce unnecessary workload
Institutions were asked if they had undertaken specific activities to reduce unnecessary workloads, and then asked if they had conducted any other activities. Nine in ten institutions (87%), had taken some steps to reduce workload as shown in Figure 12.1.
Figure 12.1 Activities undertaken by post-16 institutions to reduce unnecessary workload
Base: all post-16 institutions (421)
9%
6%
7%
10%
23%
44%
47%
47%
None
Reduced or changed planning
Introduced software / IT systems
Introduced teacher support schemes and training / wellbeingprogrammes
Reduced or changed marking
Actively addressed the recommendations for schools in the threereports mentioned above
Used the independent reports on marking, planning and resourcesand/or data management
Carried out a workload survey of staff *
*
*
48
Just under half of institutions had carried out a workload survey of staff (47%); used the independent reports on marking, planning and or data management as a basis to review current policies (47%); and actively addressed the recommendations for institutions outlined in the independent reports (44%).
The most common spontaneously mentioned activity institutions had undertaken to reduce unnecessary workload was the reduction or change in time spent marking (23%),
47 DfE (2018)The School Snapshot Survey: Winter 2017 48 Asterisk (*) denotes activities respondents were prompted with during the survey.

55
and a further one in 10 (10%) schools had introduced a teacher support scheme or training/wellbeing programme.
Roughly, one in ten (9%) institutions stated that they had undertaken no activity to reduce workload.
Schools with sixth forms and special schools were more likely than FE colleges to have carried out some of the activities to reduce unnecessary workload. For instance, 54% of schools with sixth forms and 36% of special schools had used the independent reports on marking, planning and resources to review current policies, compared to just 18% of FE colleges. One in ten (10%) FE colleges had reduced or changed marking compared to 24% of schools with sixth forms and 25% of special schools.
Schools in the least deprived quintile were more likely than those in the most deprived quintile to have carried out a workload survey of staff (56% vs. 31%) and to have actively addressed the recommendations made in the three independent reports on workload (56% vs. 39%).
Making teacher workload more manageable
Institutions that had taken action to reduce unnecessary workload were asked the extent to which they felt their actions had made teaching workloads more manageable.
Over half 56% felt their actions had made teacher workloads more manageable; this was usually by making workloads slightly more manageable (51%) rather than much more manageable (6%). Special schools (74%) were much more likely than schools with sixth forms (52%) and FE colleges (46%) to believe that their actions had made teacher workloads more manageable.
Just over one third (36%) of post-16 institutions felt that the activities they had undertaken to reduce teacher workload had actually not made a difference. In addition, 7% were unsure what effect their activities had, or felt that it was too early for them to say.
12.2. Private training providers
Most private training providers (85%) had undertaken some activity to reduce teaching workloads. As shown in Figure 12.2, the most common activities undertaken were carrying out a workload survey of staff (57%) and using the independent reports on marking, planning and resources as a basis to review current policies (40%). One in seven (15%) had not undertaken any such activities to reduce workload, in comparison to 9% of post-16 institutions.

56
Figure 12.2 Activities undertaken by private training providers to reduce unnecessary workload49
Base: all private training providers (246)
15%
3%
7%
19%
27%
40%
57%
None
Reduced or changed planning
Recruited new staff
Introduced software / IT systems
Actively addressed the recommendations for schools in the threereports mentioned above
Used the independent reports on marking, planning and resourcesand/or data management
Carried out a workload survey of staff *
*
*
Of those who had addressed teacher workload in some way, 71% said that this had made workloads at the institution more manageable (29% much more manageable, 42% slightly more manageable).
49 Asterisk (*) denotes activities respondents were prompted with during the survey

57
13. Outreach and assessing needs The government is interested in understanding the activities that post-16 institutions and private training providers are engaging in to recruit students with low prior attainment and complex additional needs to reduce levels of exclusion in post-16 education and widen participation rates. In order to gain an insight in to this, the survey asked about the channels used by post-16 institutions and private training providers to promote further education.
13.1. Post-16 institutions
Institutions were read a list of forms of outreach and asked which their institution used. They were then given the opportunity to detail additional outreach activities they had undertaken. They were next asked which the single most effective activity was for engaging students with low prior attainment or additional needs.
As shown in Figure 13.1, contact with parents and carers was the most common form of outreach, employed by 97% of institutions. Taster days were also used by the vast majority (88%). Around three-quarters of institutions used links to other local colleges (76%), visits to schools in their area (76%) and links to local authority services (e.g. guidance services) (75%) as forms of outreach.
Of the forms of outreach spontaneously mentioned by post-16 institutions, the most prevalent were links to employers (6%) and links to universities (5%). The use of links to universities was higher among schools with sixth forms (7%) than special schools (0%) and FE colleges (1%).
In the main, special schools and FE colleges were more likely than schools with sixth forms to have used each form of outreach at their institution. For instance, 93% of special schools and 82% of FE colleges had links to other local colleges as a form of outreach in comparison to 69% of schools with sixth forms. Around two thirds (67%) of FE colleges used link courses, e.g. students attending institution for up to one day a week, compared to just 22% of schools with sixth forms.
Additionally, FE colleges were more likely to visit schools in their area (93%) than special schools (75%) and schools with sixth forms (75%).

58
Figure 13.1 Forms of outreach used by post-16 institution and the most effective for engaging students with low prior attainment or additional needs50
10
1%
0%
0%
1%
2%
4%
6%
5%
9%
25%
33%
5%
5%
5%
5%
6%
31%
75%
76%
76%
88%
97%
Links with charities
Run events e.g. STEM events
Marketing and social media
Links to Universities
Links to employers
Link courses*
Links to local authority services *
Visits to schools in your area*
Links to other local colleges*
Taster days*
Contact with parents / carers*
Forms of outreach used
Single most effective method forengagement
Base: all post-16 institutions (421)
The lighter coloured bars in Figure 13.1 show the proportion of institutions that stated the form of outreach was the most effective for engaging students with low prior attainment or additional needs. The two approaches most commonly cited as most effective were contact with parents and carers (33%) and taster days (25%). One in ten institutions (11%), said they were unable to choose what method they found most effective.
50 Forms of outreach mentioned by under 10% of post-16 institutions are not shown on this Figure. Asterisk (*) denotes forms of outreach respondents were prompted with during the survey

59
As shown earlier, links to other colleges, visits to local schools and links to LAs were employed by almost the same proportion of institutions (75%-76%). Of these approaches, links to colleges was the approach most likely to be selected as the most effective form of outreach (9%). A fifth of special schools (21%) felt links to other colleges was the most effective form of outreach compared to just one in 20 (5%) schools with sixth forms and FE colleges.
Institutions were asked how they assessed the number of students with low attainment at the beginning of the year/course. The responses given are shown in Table 13.1.
Table 13.1: Forms of assessment used by post-16 institutions to assess students with low attainment
Form of assessment
Through an in-house designed diagnostic tool/s 46%
Through one-to-one interview 30%
Through a commercially available diagnostic tool/s
24%
Information from previous provider 21%
Through tutor observation during induction 19%
Exam results / prior attainment 16%
Through contact with parents/carers 13%
Students' needs already known as arrived at institution prior to post-16 education
5%
By consulting students' EHCP (Educational Health Care Plan)
4%
Reports from other professionals / agencies 3%
None 2% Base: all post-16 institutions (421)
The majority (64%) of institutions used at least two methods to assess these types of students’ needs.
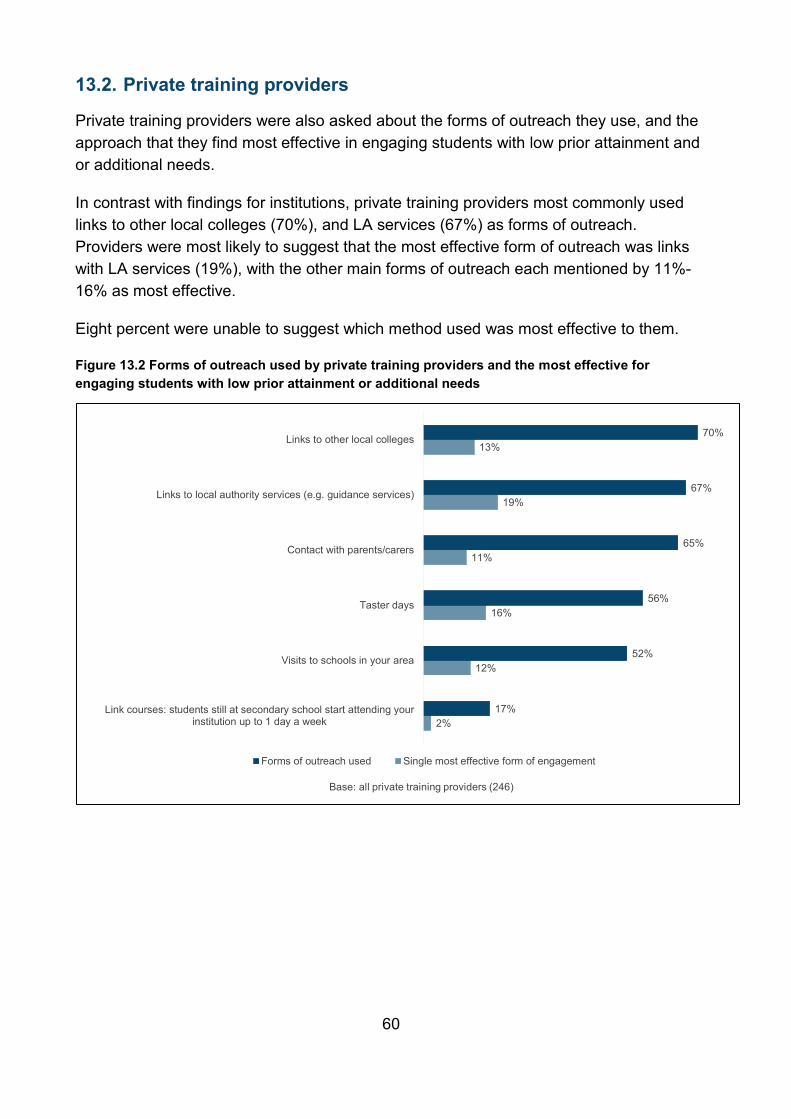
60
13.2. Private training providers
Private training providers were also asked about the forms of outreach they use, and the approach that they find most effective in engaging students with low prior attainment and or additional needs.
In contrast with findings for institutions, private training providers most commonly used links to other local colleges (70%), and LA services (67%) as forms of outreach. Providers were most likely to suggest that the most effective form of outreach was links with LA services (19%), with the other main forms of outreach each mentioned by 11%-16% as most effective.
Eight percent were unable to suggest which method used was most effective to them.
Figure 13.2 Forms of outreach used by private training providers and the most effective for engaging students with low prior attainment or additional needs
2%
12%
16%
11%
19%
13%
17%
52%
56%
65%
67%
70%
Link courses: students still at secondary school start attending yourinstitution up to 1 day a week
Visits to schools in your area
Taster days
Contact with parents/carers
Links to local authority services (e.g. guidance services)
Links to other local colleges
Forms of outreach used Single most effective form of engagement
Base: all private training providers (246)

61
Private providers also reported the ways in which they assess the needs of students with low attainment and/or additional needs at the beginning of the year/course (Table 13.2).
Table 13.2: Forms of assessment used by private training providers to assess students with low attainment Form of Assessment Through one-to-one interview 60% Through an in-house designed diagnostic tool/s 53% Through a commercially available diagnostic tool/s 48% Through tutor observation during induction 19% Through contact with parents/carers 5% Information from previous provider 5% Exam results / prior attainment 2% None 4%
Base: all private training providers (246)

62
14. Mental health post-16 institutions Over one in ten (13%) of children and young people aged 5-19 in England have a diagnosable mental health problem.51 Children and young people’s mental health is a priority for this Government, and the DfE has committed to supporting schools ‘to promote good mental wellbeing in children, to provide a supportive environment for those experiencing problems, and to secure access to more specialist help for those who need it’52.
Children and young people's mental health is a priority for this Government, and the DfE has committed to supporting schools and colleges ‘to promote good mental wellbeing in children, to provide a supportive environment for those experiencing problems, and to secure access to more specialist help for those who need 53. The Government’s response to ’Transforming Children and Young People’s Mental Health: a Green Paper’ sets out the Government response to how they will incentive every school and college to identify a Designated Senior Lead (DSL) for Mental Health to oversee the approach to mental health and wellbeing, introduce Mental Health Support Teams (MHSTs), and pilot four-week waiting times54.
It is important that schools and colleges establish the processes to support the mental health of young people and form partnerships with other service providers. This will give children and young people access to appropriate specialist support. Wave 6 of the omnibus survey asked questions on whether practitioners understood their responsibilities, have the necessary knowledge to be able to initiate support, and know how and when to refer learners.
14.1. Post-16 institutions
Institutions were asked the extent to which they agreed or disagreed with statements about their institution’s ability to support students with mental health issues (Figure 14.1).
51 NHS, 2018. Mental health of Children and Young People in Great Britain. 52 Department for Education, 2016. DfE Strategy 2015-2020: World Class Education and Care. 53 Department for Education (2018). Mental health and behaviour in schools: Departmental advice for school staff 54 Department of Health and Social Care and Department for Education, 2017. Transforming children and young people’s mental health provision: a green paper.

63
Figure 14.1 Ability of post-16 institutions to support students with mental health difficulties in the following ways
1%
2%
9%
3%
5%
7%
14%
20%
26%
6%
8%
14%
9%
18%
47%
50%
50%
39%
38%
42%
33%
19%
23%
14%
Know what support the institution offers studentswith mental health issues and how students can
access it
Are equipped to identify behaviour that may belinked to a mental health issue
Are equipped to teach students in their classeswho have mental health needs
Have good access to mental health professionals ifthey need specialist advice on students' mental
health
Know how to help students with mental healthissues access specialist support outside of your
institution
Strongly disagree Disagree Neither/nor Agree Strongly Agree
Base: all post-16 institutions (421)
52% Agree
62% Agree
69% Agree
83% Agree
89% Agree
Four in five institutions felt their staff were aware of what support their institution offered to students with mental health issues (89% vs 6% disagreed) and considered that their staff were equipped to identify behaviour that may be linked to a mental health issue (83% vs 8% disagreeing). Two-thirds felt they were equipped to teach students who have mental health needs (69% vs 16% disagreed).
Agreement was lower (regarding access to external support. Three in five thought they have good access to mental health professionals if they required specialist advice (62% vs 29% disagreed). Similarly, half agreed they knew how to help students with mental health issues access support outside their institution (52% vs 29% disagreed)
With exception of the statement regarding staff knowledge of mental health support offered by their institution (where agreement was high among all institution types), special schools were more likely than schools with sixth forms and FE colleges to have agreed with each statement. In particular, 92% of special schools agreed that staff at their school knew how to teach students in their class who had mental health conditions compared to 61% of schools with sixth forms and 56% of FE colleges. This may reflect the frequency with which teachers at special schools encounter students with mental

64
health conditions and the level of training staff at special schools undertake in this area. In order to administer mental health provision, institutions are encouraged to identify a mental health lead to oversee this process. Over three-quarters (77%) of institutions had identified a mental health lead. This was higher (91%) among FE colleges compared to schools with sixth forms (75%) and special schools (74%).
Institutions with a designated lead for mental health were also asked to specify which activities these individuals were responsible for within the institution. As shown in Figure 14.2, mental health leads had several responsibilities, with around nine in 10 providers saying that each responsibility lay with their designated lead, apart from monitoring and supporting staff well-being (62%).
Figure 14.2 Activities undertaken by mental health leads at post-16 institutions (prompted)
Base: post-16 institutions with designated mental health lead (336)
62%
86%
89%
90%
90%
90%
91%
93%
99%
Monitoring and supporting staff wellbeing
Teaching pupils about mental health and well-being
Monitoring mental health and wellbeing across the school
Coordinating mental health provision in the school
Identifying and/or assessing pupils' needs
Providing pastoral or therapeutic support to individual pupils
Being a contact point for parents with concerns about theirchild's mental health
Staff training about young people's mental health andwellbeing
Liaising with external mental health services

65
14.2. Private training providers
Private training providers were also presented with the same statements about support for students with mental health issues. The majority of private training providers either agreed or strongly agreed with each statement. Almost nine in ten (86%) private training providers agreed that their institution knew what support their institution offered students with mental health issues, and how they could access it. This is consistent with findings for institutions (88%). Around three-quarters agreed that they were equipped to identify behaviour that may be linked to a mental health issue (79%), knew how to help students with mental health issues access outside support (76%), and had good access to mental health professionals (74%). Private training providers were slightly less confident in being equipped to teach students with mental health needs: three-fifths felt they were equipped (61%), but a fifth (20%) disagreed.
Figure 14.3 Ability of private training providers to support students with mental health difficulties
Base: all private training providers (246)
0%
0%
2%
1%
5%
7%
11%
14%
19%
8%
13%
13%
10%
17%
51%
49%
49%
48%
44%
35%
30%
27%
25%
17%
Know what support the institution offers studentswith mental health issues and how students can
access it
Are equipped to identify behaviour that may belinked to a mental health issue
Know how to help students with mental healthissues access specialist support outside of your
institution
Have good access to mental health professionals ifthey need specialist advice on students' mental
health
Are equipped to teach students in their classeswho have mental health needs
Strongly disagree Disagree Neither/nor Agree Strongly Agree
61% Agree
74% Agree
76% Agree
79% Agree
86% Agree
In comparison with institutions, private training providers were more likely to agree that they had good access to mental health professionals (74% vs 61%) and know how to access specialist external support (76% vs 52%), but less likely to agree that they were equipped to teach students in classes with mental health needs (61% vs 69%).
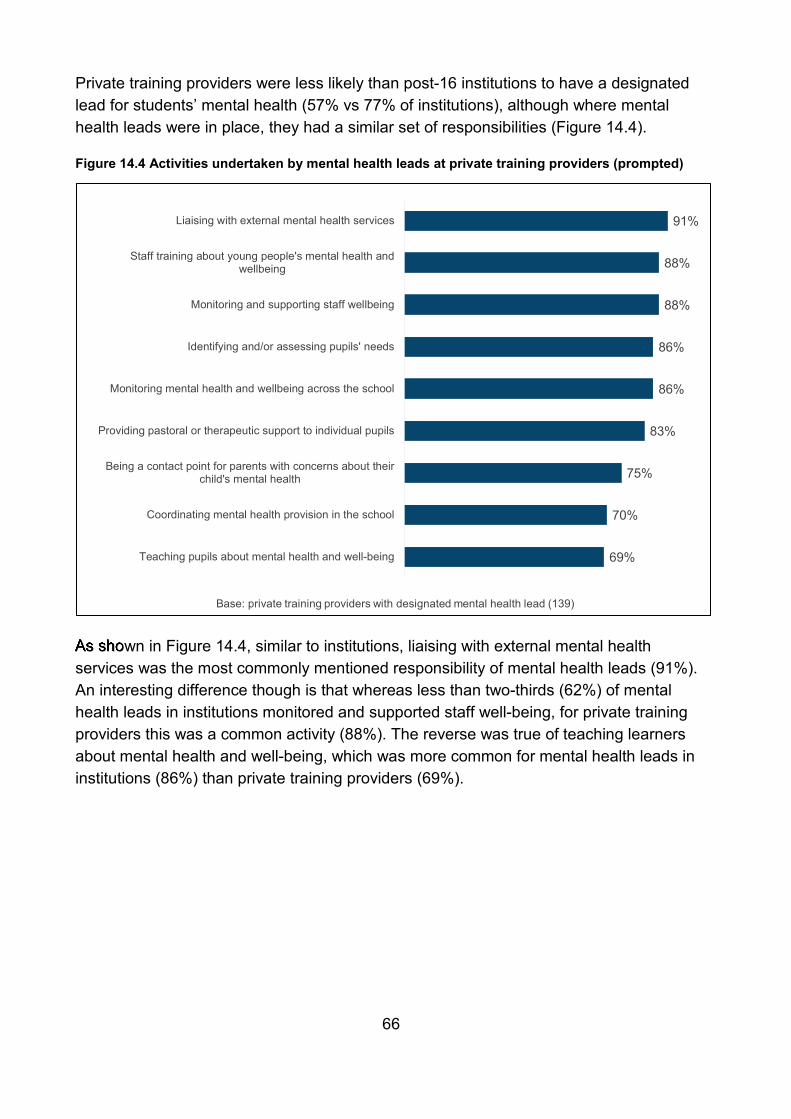
66
Private training providers were less likely than post-16 institutions to have a designated lead for students’ mental health (57% vs 77% of institutions), although where mental health leads were in place, they had a similar set of responsibilities (Figure 14.4).
Figure 14.4 Activities undertaken by mental health leads at private training providers (prompted)
Base: private training providers with designated mental health lead (139)
69%
70%
75%
83%
86%
86%
88%
88%
91%
Teaching pupils about mental health and well-being
Coordinating mental health provision in the school
Being a contact point for parents with concerns about theirchild's mental health
Providing pastoral or therapeutic support to individual pupils
Monitoring mental health and wellbeing across the school
Identifying and/or assessing pupils' needs
Monitoring and supporting staff wellbeing
Staff training about young people's mental health andwellbeing
Liaising with external mental health services
As shown in Figure 14.4, similar to institutions, liaising with external mental health services was the most commonly mentioned responsibility of mental health leads (91%). An interesting difference though is that whereas less than two-thirds (62%) of mental health leads in institutions monitored and supported staff well-being, for private training providers this was a common activity (88%). The reverse was true of teaching learners about mental health and well-being, which was more common for mental health leads in institutions (86%) than private training providers (69%).

67
15. The Prevent Duty and Fundamental British Values This chapter looks at how confident post-16 institutions and private training providers were in implementing the Prevent Duty and embedding fundamental British values.
The Counter-Terrorism and Security Act was published by government in 2015.55 This document contained a duty for ‘specified authorities’ in England and Wales to have “due regard to the need to prevent people from being drawn into terrorism”. This duty is also known as the ‘Prevent Duty’ and the government released guidance on this duty in 201556 to support institutions like further education providers in delivering it effectively.
15.1. Post-16 institutions
Nearly all institutions (97%) were either fairly (29%) or very (68%) confident in implementing the Duty (see Figure 15.1). This rose to 100% of special schools. One percent of institutions were not very confident about implementing the duty, with special schools (82%) and FE colleges (82%) were more likely than schools with sixth forms (61%) to be ‘very confident’ about implementing the duty.
55 Counter-Terrorism and Security Act (2015) https://www.gov.uk/government/collections/counter-terrorism-and-security-bill 56 Prevent Duty Guidance (2015) https://assets.publishing.service.gov.uk/government/uploads/system/uploads/attachment_data/file/445977/3799_Revised_Prevent_Duty_Guidance__England_Wales_V2-Interactive.pdf

68
Figure 15.1 Confidence post-16 institutions have in implementing the Prevent Duty and promoting Fundamental British Values
Base: all post-16 institutions (421)
1% 2%
29% 68%
Not very confident Neither/nor Fairly confident Very Confident
1%
20% 79%
Not very confident Neither/nor Fairly confident Very Confident
Confidence in implementing the Prevent Duty
Confidence promotion of Fundamental British Values
Concurrently with the push towards greater safeguarding from extremism, the Department for Education (DfE) published departmental advice for schools to promote Fundamental British Values (FBV) within their institution.57 The aim was to achieve this by promoting learners’ spiritual, moral, social and cultural (SMSC) development as part of a broad and balanced curriculum. FBV as prescribed by Ofsted are: democracy, the rule of law, individual liberty and mutual respect and tolerance for those with different faiths and beliefs.
As with Prevent Duty confidence in implementing FBV was very high and nearly all institutions (99%), very (79%) or quite confident (20%). The proportion of ‘very confident’ responses was higher for FBV than the Prevent Duty.
57 DfE (2014): Promoting fundamental British values as part of SMSC in schools (2014)

69
15.2. Private training providers
Private provider confidence in implementing the Prevent Duty and the promotion of Fundamental British Values largely mirrored findings of institutions. As shown in Figure 15.2, 98% of private training providers were either very confident (76%) or fairly confident (22%) in implementing the Prevent Duty, and the same proportion were either very confident (78%) or fairly confident (20%), in promoting Fundamental British Values.
Figure 15.2 Confidence private training providers have in implementing the Prevent Duty and promoting Fundamental British Values
Base: all private training providers (246)
0%2%
22% 76%
Not very confident Neither/nor Fairly confident Very Confident
1%
20% 78%
Not very confident Neither/nor Fairly confident Very Confident
Confidence in implementing the Prevent Duty
Confidence promotion of Fundamental British Values

70
16. Social Mobility This chapter discusses some of the strategies post-16 institutions and private training providers have employed to raise the aspirations of their students.
Social mobility is a key feature of government policy. In 2011, the government produced a strategy for social mobility which focused on the transition years (16-24 years old). It highlighted that “the paths that individuals follow begin to diverge sharply after the age of 16”.58 It was felt that an approach for addressing social mobility can be achieved through raising the aspirations of learners in these age groups. Three years later, a report was published outlining strategies implemented in schools and colleges that aim to raise the aspirations of high-achieving disadvantaged learners to pursue higher education.59
16.1. Post-16 institutions
Institutions were asked whether they had engaged in a series of activities to encourage students to have high aspirations or to help them achieve their potential. As shown in Figure 16.1, providers used a range of activities to encourage students to aim high.
58 HM Government (2011) Opening Doors, Breaking Barriers: A Strategy for Social Mobility 59 DfE (2014)School and College-level Strategies to Raise Aspirations of High-achieving Disadvantaged Learners to Pursue Higher Education Investigation

71
Figure 16.1 Activities post-16 institutions had engaged in to encourage students to have high aspirations or to help them achieve their potential (prompted)
75%
78%
87%
92%
93%
96%
97%
98%
Offer peer mentoring from within institution, FE or HE
Education on long term benefits of further training/education
Specific support offered to raise aspirations for certain routes (e.g.HE)
Work with parents/parental engagement in learning and futureplanning
Facilitate volunteering opportunities
Guidance on how to access different routes and/or applicationprocesses
Building life skills - team working, communication skills, leadership,social skills, resilience
Careers advice - including wide range of potential options
Base: all post-16 institutions (421)
Five of the activities that institutions were asked about were undertaken by over nine in 10 institutions: careers advice (98%), building life skills (97%), guidance on how to access different routes (96%), facilitating volunteer opportunities (93%), and working with parents in learning and future planning (92%). Many of these were more likely to be a feature of schools with sixth forms and FE colleges than special schools. 94% of FE colleges and 81% of schools with sixth forms said they had educated students on the long-term benefits of further training and education, compared to 62% of special schools.
Additionally, institutions in the least deprived areas were considerably more likely than those in the most deprived areas to facilitate volunteering opportunities as a means of engendering high aspirations within the student population (98% vs. 85%).
The activity least likely to have been undertaken by institutions to raise aspirations was to offer peer mentoring from within the institution, further education or higher education. Still, three-quarters (75%) of institutions had offered this.
Institutions were also asked about the barriers to raising the aspirations of their students. Figure 16.2 shows barriers that were mentioned by at least 5% of post-16 institutions.

72
Figure 16.2 Barriers faced by post-16 institutions in raising aspirations within the student population (prompted and unprompted)60
2%
6%
6%
7%
8%
10%
11%
14%
20%
28%
29%
34%
We don't face any barriers to raising attainment
Ability to access out of school activities*
Societal perceptions of disability / additional needs
Lack of support from peer groups*
Cost to the institution of providing work experience*
Lack of time for staff to engage with individual students*
Lack of funding (post-16, and general)
Socio-economic factors / social expectations
Students lack self-belief / motivation and /or have additional needs
Lack of support from parents*
Costs e.g. of university/continued education*
Lack of parental aspiration*
Base: all post-16 institutions (421)
Institutions were presented with a list of barriers that they might face in raising aspirations of their students, and then asked if they faced any other barriers. Almost all (98%) mentioned at least one barrier (prompted or unprompted).
The most commonly mentioned barriers were a lack of parental aspiration (34%), costs of continuing education (29%) and a lack of support from parents (28%). A fifth (20%) mentioned unprompted that students self-belief was a barrier.
FE colleges were more likely to have reported a lack of government funding (29%), compared with special schools (11%) and schools with sixth forms (9%). Schools with six forms were more likely however to have reported the cost of higher education as a barrier (36% vs 29% other institutions).
Some barriers were more likely to be mentioned by special schools than other provider types as shown in Table 16.1.
60 Asterisk (*) denotes promoted barriers mentioned to respondents during the survey

73
Table 16.1: Barriers more prevalent amongst special schools (unprompted) Barrier Special schools Schools with
sixth forms FE colleges
Students lack self-belief / motivation and /or have additional needs (e.g. mental health or behavioural issues)
33% 16% 22%
Societal perceptions of disability / additional needs
25% 0% 0%
Availability of work experience for SEN students
16% 0% 2%
Base (61) Base (218) Base (108)
16.2. Private training providers
Figure 16.3 shows the activities undertaken by private training providers to encourage students to have high aspirations and/or achieve their potential.
Almost all private providers (94%) reported building life skills, while career advice (85%) and guidance in different pathways and application processes (83%) were offered by over four-fifths of providers.
Figure 16.3 Activities private training providers had engaged in to encourage students to have high aspirations or to help them achieve their potential (prompted)
48%
50%
61%
74%
80%
83%
85%
94%
Facilitate volunteering opportunities
Work with parents/parental engagement in learning and futureplanning
Offer peer mentoring from within institution, FE or HE
Specific support offered to raise aspirations for certain routes (e.g.HE)
Education on long term benefits of further training/education
Guidance on how to access different routes and/or applicationprocesses
Careers advice - including wide range of potential options
Building life skills - team working, communication skills, leadership,social skills, resilience
Base: all private training providers (246)
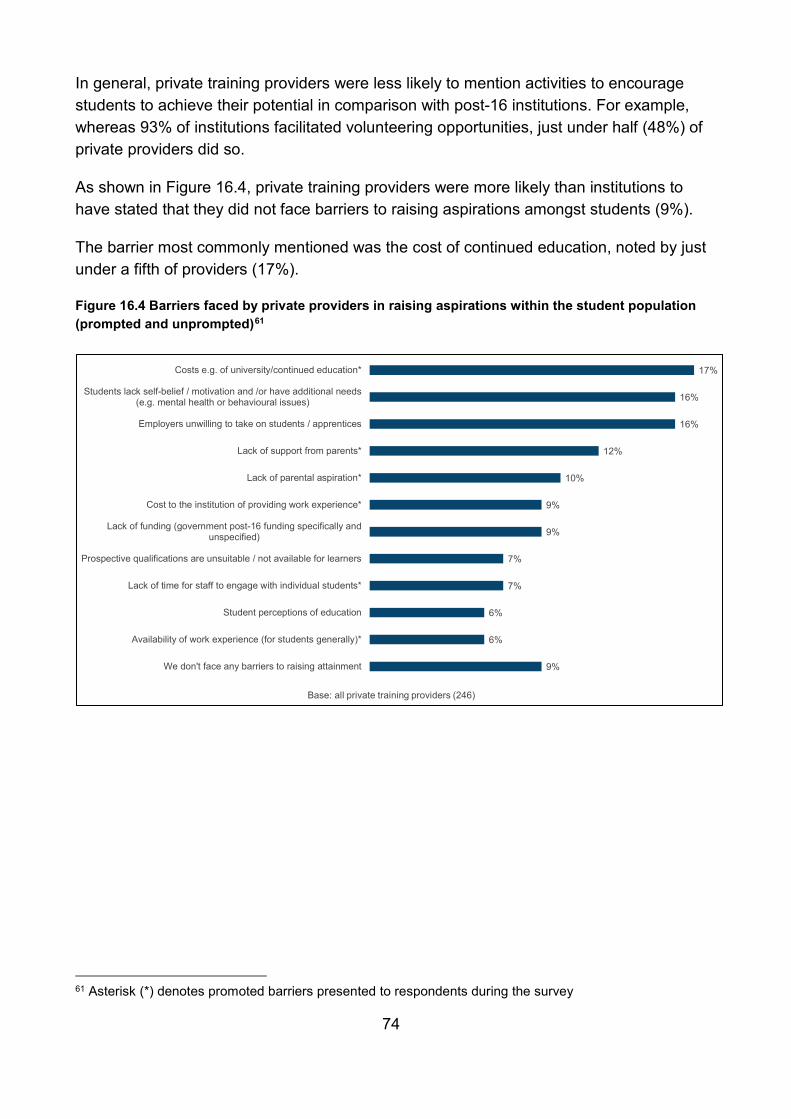
74
In general, private training providers were less likely to mention activities to encourage students to achieve their potential in comparison with post-16 institutions. For example, whereas 93% of institutions facilitated volunteering opportunities, just under half (48%) of private providers did so.
As shown in Figure 16.4, private training providers were more likely than institutions to have stated that they did not face barriers to raising aspirations amongst students (9%).
The barrier most commonly mentioned was the cost of continued education, noted by just under a fifth of providers (17%).
Figure 16.4 Barriers faced by private providers in raising aspirations within the student population (prompted and unprompted)61
9%
6%
6%
7%
7%
9%
9%
10%
12%
16%
16%
17%
We don't face any barriers to raising attainment
Availability of work experience (for students generally)*
Student perceptions of education
Lack of time for staff to engage with individual students*
Prospective qualifications are unsuitable / not available for learners
Lack of funding (government post-16 funding specifically andunspecified)
Cost to the institution of providing work experience*
Lack of parental aspiration*
Lack of support from parents*
Employers unwilling to take on students / apprentices
Students lack self-belief / motivation and /or have additional needs(e.g. mental health or behavioural issues)
Costs e.g. of university/continued education*
Base: all private training providers (246)
61 Asterisk (*) denotes promoted barriers presented to respondents during the survey

75
Annex A: Response rate Table A1 presents the response rate achieved from the eligible sample of post-16 institutions at wave 6. A small proportion of the sample proved to be ineligible due to some institutions having closed or no longer offering post-16 education.
In Table A1, ‘other’ shows those where it was not possible to achieve an interview with the institution by the end of fieldwork, though they had not refused to take part.
Table A1: Response rate achieved from eligible sample by institution type
Institution type Total sample
Usable sample
Unusable Interviews achieved
% of usable sample
interviewed
Schools with sixth forms
519 437 82 218 50%
FE colleges 264 255 9 108 42%
Special schools 100 87 13 61 70%
University Technical Colleges (UTCs)
46 43 3 14 33%
Studio schools 32 24 8 15 63%
Sixth form centres 14 12 2 5 42%
Total 975 858 117 421 49%
Institution type Total sample
Usable sample
Unusable Interviews achieved
% of usable sample
interviewed
Private training providers
507 436 71 246 56%

76
Annex B: Weighting The data was weighted by institution type to correct for the over-sampling of small institution types. The population data used for weighting is shown in Table B1 below. Population data was obtained from Get information about schools (formerly EduBase) for institutions and the ESFA for private providers.
Table B1: Population (number of institutions)
Institution type N %
Schools with sixth forms 2,066 65%
FE colleges 265 8%
Special schools 739 23%
University Technical Colleges (UTCs) 51 1%
Studio schools 34 1%
Sixth form centres 18 1%
Total 3,173 100.0%
Private training providers 927 100%
Source: Get information about schools Source: ESFA

77
© IFF Research 2019
Reference: DFE-RR912
ISBN: 978-1-83870-002-7
The views expressed in this report are the authors’ and do not necessarily reflect those of the Department for Education.
Any enquiries regarding this publication should be sent to us at: [email protected] or www.education.gov.uk/contactus
This document is available for download at www.gov.uk/government/publications