portsmouth demographic study
TRANSCRIPT
PortsmouthDemographic Study
June 2015
Demographics Research GroupWeldon Cooper Center for Public ServiceUniversity of Virginia

Weldon Cooper Center Demographics Research Group | University of Virginia | coopercenter.org/demographics 2
About this ReportThis report describes recent demographic changes in the City of Portmouth, Virginia. It was commissioned by the city’s Planning Department in order to help city leaders in their upcoming revision of the city’s comprehensive plan.
The Demographics Research GroupThe Demographics Research Group produces the official annual population estimates for Virginiaand its localities; conducts practical and policy-oriented analysis of census and demographicsurvey data under contract; and communicates rigorous research and its policy implications tothe general public, as well as to clients including state and local governments, employers, andnon-profit organizations through meaningful, intuitive publications and presentations.
About the AuthorsLuke Juday is a Research and Policy Analyst for the Demographics Research Group. He receivedhis Bachelor’s degree in political science from Grove City College and a Master of Urban andEnvironmental Planning from the University of Virginia. His expertise is in mapping and spatialanalysis and he focuses on how demographic trends are related to local government decisions andmetropolitan change.
Hamilton Lombard is a Research Specialist for the Demographics Research Group. His expertise is in demographic change, particularly the different components of population growth and decline, and the effect of government policy on population patterns. Hamilton has worked in local and regional planning in Virginia and the United Kingdom.
AcknowledgementsMeredith Gunter and Qian Cai provided excellent guidance and editing throughout this project. Qian Cai is Director of the Demographics Research Group and Meredith Gunter is Outreach Director for the group.

Weldon Cooper Center Demographics Research Group | University of Virginia | coopercenter.org/demographics 3
Summary...................................................................... 4
Population change...................................................... 6
Age................................................................................ 8 Age and migration..................................................... 10
Race and ethnicity...................................................... 11
School enrollment...................................................... 14
Educational attainment............................................. 17
Employment and labor force.................................... 18
Income......................................................................... 21
Housing type............................................................... 23
Housing age................................................................. 24
Households.................................................................. 26
Housing occupancy.................................................... 27
Taxable value per acre................................................ 28
Commuters ................................................................. 29
Commuting into Portsmouth................................... 30
Commuting within Portsmouth............................... 32
Commuting out of Portsmouth................................ 33
Conclusion................................................................... 34
Contents

Weldon Cooper Center Demographics Research Group | University of Virginia | coopercenter.org/demographics 4
Portsmouth is an historic city on the Elizabeth River in the heart of Hampton Roads. Once dominated by working families in shipping and naval industries, Portsmouth has experienced a slow but steady transformation over the last few decades.
During much of the twentieth century, Portsmouth had a large, concentrated African-American population. After desegregation, many moved to previously white neighborhoods, while many white residents moved out to neighboring cities. Today Portsmouth continues to have a relatively large black population, but its racial and ethnic landscape is becoming more complex as is true in the rest of the United States. Hispanic residents and those identifying as multiracial or “other” make up a small but growing portion of the population.
Portsmouth was primarily developed in the early- to mid-1900s. While it has an urban character in many areas, its housing stock is dominated by small single-family homes and low-end suburban-style apartment complexes. As Hampton Roads’ population has grown and its urbanized area has exanded, the vanguard of new home buyers at the expanding edge has demanded steadily larger houses with more indoor and outdoor living space. Portsmouth, unable to annex land after the incorporation of the cities of Chesapeake and Suffolk, was left behind by these residents, and its built form remained largely unchanged for decades. Sixty percent of Portsmouth’s housing units are more than 45 years old, compared to only 35% of homes in the metro area.
The steady exodus of wealthier residents means that Portsmouth’s median income and educational attainment levels have lagged behind the rest of Hampton Roads. Its overall population has declined also, due primarily to outmigration of middle-class families with children. Twenty percent of children born in Portsmouth do not enroll in first grade six years later, and enrollment continues to decrease into high school. In a national context, this is unsurprising since families tend to migrate to suburban neighborhoods on the geographic edges of metropolitan areas, a type of neighborhood in plentiful supply in Hampton Roads.
Because Portsmouth loses many middle-aged residents who are at the height of their careers, workers commuting into the city have higher household incomes than those living in the city or commuting out. Despite being the home of the Norfolk Naval Shipyard, Portsmouth has fewer residents working at the shipyard than Norfolk, Virginia Beach, or Chesapeake.
Portsmouth can take steps to compete for these middle-class families, but it will likely do so at a significant disadvantage for the foreseeable future. Portsmouth’s development patterns range from aging suburban to low-density urban. It lacks significant undeveloped land to offer for construction of newer suburban-style single-family homes. Focusing on this type of housing will probably result in net population loss. The median value of new homes is significantly lower than in the rest of Hampton Roads, suggesting that there is also a lack of demand from these buyers.
The number of married couples with children at home has fallen by more than 50% since 1990, and the number of single parents with children has fallen as well. Meanwhile, the number of residents living alone or in other non-nuclear family arrangements has increased. Households in Portsmouth and across Virginia are much more varied than they have been in the past, which may mean demand for a more varied housing stock. This could be an advantage for Portsmouth if its range of redevelopment projects and older houses can appeal to different types of residents.
The age groups experiencing some net in-migration are young adults in their 20’s, and late middle-age residents likely to be empty-nesters or retirees. Young adults may be drawn to the city’s low housing prices. Their presence is notable especially because Portsmouth lacks a college or university and has done little to target either of these groups. While married couples with children are falling as a percentage of households everywhere, the drop in Portsmouth has been precipitous.
The areas of Portsmouth where median income and home values have increased are urban neighborhoods near the water and the historic downtown. This is also
summary

Weldon Cooper Center Demographics Research Group | University of Virginia | coopercenter.org/demographics 5
the area where land values are highest and where the city is reaping the most tax dollars.
If Portsmouth wants to see more economic activity, infill development, and population growth, it should focus on the demographic groups it is already attracting and the new housing options that are undersupplied in the city, without losing large amounts of the affordable housing that its current residents depend on. This means encouraging more multifamily development and denser single-family development around the city’s historic core, as well as taking steps to appeal to young adults and new retirees seeking an affordable urban lifestyle in a largely suburban metropolitan area. These groups are more likely to value living in a central, walkable location and less likely to care about yard size, house size, or schools. Their increased presence is generally positive for cities’ financial situations because they boost property values while using fewer city resources.
Attracting these groups will not necessarily stop the continued decline in school enrollment, which is a natural result of children becoming a smaller proportion of an aging population. However, a surge in popularity among young adults can result in rising school enrollment several years down the road if there is enough new housing supply to keep prices low and entice young families to stay. This is the pattern that cities such as Charlottesville, Falls Church, and Richmond followed to recover from population loss and begin growing their population of families again.

Weldon Cooper Center Demographics Research Group | University of Virginia | coopercenter.org/demographics 6
PoPulation Change
Portsmouth City’s population has declined every decade since 1960, when it peaked at nearly 115,000 residents. Since 1990, the city’s population has declined by over 7 percent while Hampton Roads’ population grew by 18 percent (in this report, “Hampton Roads” will refer to the Virginia Beach-Norfolk-Newport News-Hampton, VA-NC Metropolitan Statistical Area, as defined by the US Office of Management and Budget).
Since 2010, the population growth rate has slowed in most localities within the Hampton Roads metro area, even in those that grew quickly during the 1990s and
2000s. The only localities to experience an increase in growth rate since 2010 were those with the least growth before, including Portsmouth and Norfolk.
Portsmouth’s population has grown by about 1,250 residents since 2010, when it reached a historic low of 95,535 residents. By 2020, Portsmouth is projected to grow by an additional 1,700 residents and to add an additional 6,000 residents by 2040. Because the bulk of Hampton Roads’ population growth continues to come from suburban expansion and Portsmouth lacks large amounts of open land for development, Portsmouth’s growth rate will likely continue to lag the
-
200,000
400,000
600,000
800,000
1,000,000
1,200,000
1,400,000
1,600,000
1,800,000
2,000,000
-
20,000
40,000
60,000
80,000
100,000
120,000
140,000
1990 1997 2004 2011 2018 2025 2032 2039
Hampton RoadsPortsmouthPopulation Comparison
Portsmouth Hampton Roads Metro
Data from U.S. Census Bureau, Weldon Cooper Center population estimates, and Weldon Cooper Center population projections, revised for this report based on most recent available data
Population History and Projections1990 2000 2010 2014 2020 2030 2040
Portsmouth 103,910 100,565 95,535 96,802 98,516 100,687 102,838 Hampton Roads 1,430,974 1,551,898 1,641,078 1,690,090 1,739,170 1,835,534 1,932,882
Weldon Cooper Center Demographics Research Group | University of Virginia | coopercenter.org/demographics 7
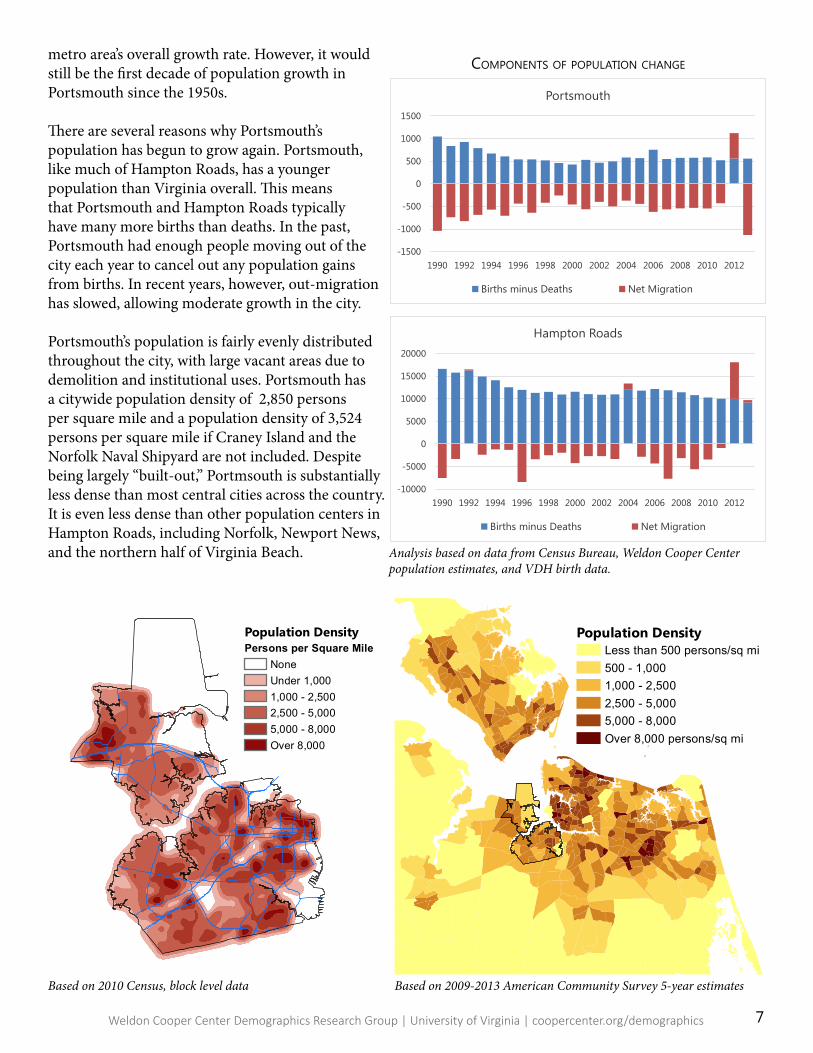
metro area’s overall growth rate. However, it would still be the first decade of population growth in Portsmouth since the 1950s. There are several reasons why Portsmouth’s population has begun to grow again. Portsmouth, like much of Hampton Roads, has a younger population than Virginia overall. This means that Portsmouth and Hampton Roads typically have many more births than deaths. In the past, Portsmouth had enough people moving out of the city each year to cancel out any population gains from births. In recent years, however, out-migration has slowed, allowing moderate growth in the city.
Portsmouth’s population is fairly evenly distributed throughout the city, with large vacant areas due to demolition and institutional uses. Portsmouth has a citywide population density of 2,850 persons per square mile and a population density of 3,524 persons per square mile if Craney Island and the Norfolk Naval Shipyard are not included. Despite being largely “built-out,” Portmsouth is substantially less dense than most central cities across the country. It is even less dense than other population centers in Hampton Roads, including Norfolk, Newport News, and the northern half of Virginia Beach.
Population DensityLess than 500 persons/sq mi500 - 1,0001,000 - 2,5002,500 - 5,0005,000 - 8,000Over 8,000 persons/sq mi
ComPonents of PoPulation Change
Population DensityPersons per Square Mile
NoneUnder 1,0001,000 - 2,5002,500 - 5,0005,000 - 8,000Over 8,000
Analysis based on data from Census Bureau, Weldon Cooper Center population estimates, and VDH birth data.
Based on 2010 Census, block level data Based on 2009-2013 American Community Survey 5-year estimates
-1500
-1000
-500
0
500
1000
1500
1990 1992 1994 1996 1998 2000 2002 2004 2006 2008 2010 2012
Portsmouth
Births minus Deaths Net Migration
-10000
-5000
0
5000
10000
15000
20000
1990 1992 1994 1996 1998 2000 2002 2004 2006 2008 2010 2012
Hampton Roads
Births minus Deaths Net Migration

Weldon Cooper Center Demographics Research Group | University of Virginia | coopercenter.org/demographics 8
age
0 2,000 4,000 6,000 8,000 10,000
0 to 45 to 9
10 to 1415 to 1920 to 2425 to 2930 to 3435 to 3940 to 4445 to 4950 to 5455 to 5960 to 6465 to 6970 to 7475 to 7980 to 84Over 85
Portsmouth - 1990
0 2000 4000 6000 8000 10000
0 to 45 to 9
10 to 1415 to 1920 to 2425 to 2930 to 3435 to 3940 to 4445 to 4950 to 5455 to 5960 to 6465 to 6970 to 7475 to 7980 to 84Over 85
Portsmouth - 2010
0 2,000 4,000 6,000 8,000
0 to 45 to 9
10 to 1415 to 1920 to 2425 to 2930 to 3435 to 3940 to 4445 to 4950 to 5455 to 5960 to 6465 to 6970 to 7475 to 7980 to 84Over 85
Portsmouth - 2030
Portsmouth’s birthrate has declined since the middle of the century along with birthrates across the country, but it is still higher than the birthrate of Virginia as a whole. Because Portsmouth tends to attract young adults in their 20’s, it always has a large population in the prime child-bearing years, even if those parents move out of Portsmouth as their children get older. This pattern is similar to that of most central cities, including Arlington and Richmond.
Births and increasing life expectancy will likely continue to be the main drivers of population growth, slightly outpacing the stream of outward migration. Like the rest of the country, Portsmouth’s age structure will fill out on top as the large generations of Baby Boomer and Millennials enjoy longer life expectancies than past generations while having fewer babies.
The increasing population of elderly residents means that children will likely make up a smaller percentage of the population as a whole. In 1970, 35.6% of Portsmouth’s population was under 18 (compared to 34.4% for the state). By 1990, only 26.8% of Portsmouth’s population was under 18 (vs 24.3% for Virginia). In 2013, that number had dropped to 23.6% for Portsmouth and 22.9% for Virginia.
29.8
33.6
35.4
31.9
34.5
35.7
28
29
30
31
32
33
34
35
36
1990 2000 2010
Median Age
Hampton Roads
Portsmouth
Data from decennial census and Weldon Cooper Center population estimates

Weldon Cooper Center Demographics Research Group | University of Virginia | coopercenter.org/demographics 9
Portsmouth Age ProjectionAge Group 1990 2000 2013 2020 2030 2040Total 103,907 100,565 96,205 98,516 100,687 102,8380 to 4 8,710 7,171 7,249 6,663 6,559 6,6305 to 9 7,869 7,294 6,455 6,244 6,339 6,29610 to 14 7,230 7,167 5,749 6,197 5,875 5,90515 to 19 7,051 7,337 5,308 6,200 6,134 6,35720 to 24 8,440 8,012 7,818 6,567 7,271 7,03725 to 29 9,533 7,032 8,315 7,009 6,977 7,04730 to 34 9,115 7,073 7,350 6,716 6,002 6,78435 to 39 7,576 7,704 5,661 6,807 6,200 6,30140 to 44 6,114 7,476 5,336 5,940 6,043 5,51445 to 49 4,812 6,716 5,753 5,401 6,533 6,07550 to 54 4,204 5,653 6,646 5,823 5,993 6,22555 to 59 4,054 4,315 6,174 6,588 5,380 6,64360 to 64 4,800 3,761 5,342 6,582 5,635 5,92165 to 69 5,174 3,338 4,114 5,535 5,938 4,95170 to 74 3,880 3,541 2,899 4,002 5,386 4,70875 to 79 2,714 3,374 2,323 2,585 4,066 4,45380 to 84 1,548 2,048 1,690 1,660 2,355 3,236Over 85 1,083 1,553 2,023 1,999 2,001 2,755
Data from U.S. Census Bureau, Weldon Cooper Center population estimates, and Weldon Cooper Center population projections, revised for this report based on most recent available data
While populations across the country are aging quickly and Portsmouth’s population is older than other cities in the region, the current national trend is for central cities to be getting younger while rural and suburban areas age more quickly. The beginnings of this may be visible in the graph of median age, where Portsmouth’s median age is approaching that of Hampton Roads as a whole.

Weldon Cooper Center Demographics Research Group | University of Virginia | coopercenter.org/demographics 10
age and migration
-2000
-1500
-1000
-500
0
500
1000
1500
Children 20's 30's 40's 50's 60's 70's 80's
Net Migration by Age - 2000 to 2010*
-2000
-1500
-1000
-500
0
500
1000
1500
Children 20's 30's 40's 50's 60's 70's 80's
Net Migration by Age - 1990 to 2000*
While its median age is higher than the median age of the Hampton Roads metro area, Portsmouth’s migration patterns are similar to generally younger central cities and college towns.
Portsmouth has positive net migration of young adults in their 20’s and older middle-aged adults nearing retirement, but significant out-migration of families with children. This is a typical pattern for central urban localities, especially those with an older housing stock and school districts that struggle with negative perceptions. The in-migration of young adults is particularly notable because of the lack of any colleges or universities in Porstmouth. While there has been a slight uptick statewide in young families staying in central cities after having children, Portsmouth can expect to lose a sizeable percentage of its families every year.
Young adults and older couples without children are two opportunity demographics for the city. Based on national trends, younger migrants are probably attracted by the affordability and central location of the city. They do not require the same housing and schooling options as established families. Older couples approaching retirement may come for many of the same reasons, but are more likely to have disposable income to rehabilitate older housing stock.
*Data based on 1990, 2000, and 2010 decennial census. These graphs show net migration, not total migration, which is much larger and varies from year to year.
To determine net migration, the number of residents in an age cohort is subtracted from the corresponding group ten years later. Deaths were factored in based on locality-specific numbers from the Virginia Department of Health. For instance, the first bar on the top graph refers to children born between 1995-2000. In the 2000 census, Portsmouth had 7,167 children age 0-4. Over the next ten years, there were approximately 83 deaths in Portsmouth in this age cohort, leaving an expected 2010 total of 7,084 remaining. However, in 2010 there were only 5,615 children age 10-14, meaning that Porstmouth had an estimated net loss of 1,469 residents in the early school-age years over this ten year period. The 85+ age group was removed because of problems in determining whether location at death corresponds to last permanent residence.

Weldon Cooper Center Demographics Research Group | University of Virginia | coopercenter.org/demographics 11
raCe and ethniCity
Portsmouth City is one of seven localities in Virginia where African-Americans make up the majority of the population. Because of this, other racial and ethnic groups make up a smaller portion of the city’s population than in the rest of Hampton Roads. Asians are underrepresented in the city, making up 4 percent of Hampton Roads’ population, but only 1 percent of Portsmouth’s population. Hispanics make up 6 percent of Hampton Roads’ population and an even larger portion of Virginia’s, but are only 4 percent of Portsmouth’s population.
The most significant change in Portsmouth’s population distribution during the past 25 years has been its transition from being predominantly white to predominantly black just before the 2000 census. Since 2000, the city’s racial and ethnic makeup has remained largely unchanged, with further decline in the white population and a slight increase in the black population.
Percent WhiteLess than 10%10-25%25-50%50-75%Over 75%
Based on 2009-2013 American Community Survey 5-year estimates, decennial Census, and Weldon Cooper Center projections
*”White” refers to non-Hispanic white, etc. Note that “race” and “ethnicity” are two separate questions in Census data. “Hispanic” is an ethnicity, not a race. Hispanics may identify as any race, but most commonly identify as “white” or “other.” The pie charts on the left show Hispanics as a separate racial category by subtracting all persons of Hispanic origin from the racial groups they have identified with. The race projection in the chart at right does not include Hispanics, but the increase in Hispanics is one of the main drivers of growth in the “other” category.
White*40%
Black*52%
Asian*1%
Other*3%
Hispanic4%
Portsmouth
51% 46% 42% 42% 39% 37% 34%
47%50%
54% 53% 53% 52% 50%
1%3%
3% 3% 6% 9% 13%
0
20,000
40,000
60,000
80,000
100,000
120,000
1990 2000 2010 2013 2020 2030 2040
Popu
latio
n
Portsmouth Racial Composition
White Black Other Asian
White*56%Black*
31%
Asian*4%
Other*3%
Hispanic6%
Hampton Roads

Weldon Cooper Center Demographics Research Group | University of Virginia | coopercenter.org/demographics 12
Percent Black - 1970Less than 10%10-25%25-75%75-90%Over 90%
Percent Black - 1990Less than 10%10-25%25-75%75-90%Over 90%
Percent Black - 2010
Less than 10%10-25%25-75%75-90%Over 90%
While Portsmouth’s black population has increased and its white population has decreased, that change is part of a larger trend of blacks moving out of formerly segregated areas. In the decades since desegregation, the number of census tracts that are 90% white or more has plummeted. In 1970, Portsmouth had 14 census tracts, holding over 50,000 people, which were 90% white or more. Now it has none and only 5 census tracts are 75% white or more. The story in other parts of Hampton Roads is similar.
There is, however, still a pocket of heavily black census tracts in the center of Hampton Roads, which have been slower to integrate than inner-city areas in Richmond or Northern Virginia. Even with the introduction of “two or more races” as an option on census forms, Portsmouth still has ten census tracts, holding over 26,000 people, that are 85% black or more. Compare that to 1970, when Portsmouth also had ten census tracts, holding almost 40,000 people, that were 85% black or more. Five of those ten tracts were 99% black or more in 1970, however. Today there is only one tract approaching that level of racial homogeny.
In the future, this slow dispersion of black residents into all parts of the metropolitan area means Portsmouth’s black population will continue its net out-migration and will not rise significantly, though it may not have peaked quite yet. Whether that means population loss for Portsmouth depends on whether other racial groups migrate inward. In other metropolitan areas, such as Richmond, whites returning to the urban core have also been a significant factor in reducing racial segregation and increasing overall population size, but this trend has been less pronounced in Hampton Roads.
Data from decennial census

Weldon Cooper Center Demographics Research Group | University of Virginia | coopercenter.org/demographics 13
Though other racial and ethnic groups make up a small portion of Portsmouth’s population, they have grown rapidly in recent years. The city’s Hispanic population nearly doubled in size, as did the number of Portsmouth residents who are more than one race. Portsmouth’s small Asian population also grew by over 50 percent between 2000 and 2013.
While this growth is significant as a percentage, it is still fairly small in absolute terms. Portsmouth has fewer Hispanics than the rest of Hampton Roads, which in turn has fewer than other parts of the state. Hispanic and Asian residents are much more likely to live in Virginia Beach, Newport News, or Norfolk.
During the next 25 years these smaller racial and ethnic groups will likely contribute to much of the city’s population growth, as Portsmouth becomes more like the rest of Hampton Roads and Virginia.
Percent Hispanic(of any race) - 2010
Under 3%3-6%6-10%Over 10%
Data from decennial census
Data from decennial census, 2009-2013 American Community Survey 5-year estimates, and Weldon Cooper Center projections. Note “Hispanic” is not a race. The four “race” categories above add up to the total population. “Hispanic” is from a separate Census question.
Portsmouth Race and EthnicityYear 1990 2000 2010 2020 2030 2040Total Population 103,907 100,565 95,535 98,516 100,687 102,838
Race White 53,212 46,104 39,701 38,722 36,946 34,992Black 49,180 50,742 50,878 52,235 52,249 51,435Asian 781 815 1,019 1,619 2,276 3,119Other races 734 2,904 3,937 5,940 9,216 13,292
Ethnicity Hispanic 1,364 1,745 2,919 5,096 8,763 13,107
1% 2% 3% 4% 5%9%
13%
99% 98% 97% 96% 95% 91% 87%
0%
10%
20%
30%
40%
50%
60%
70%
80%
90%
100%
1990 2000 2010 2013 2020 2030 2040
Population Hispanic Origin
Hispanic Non-Hispanic
0%
2%
4%
6%
8%
10%
12%
14%
16%
NorthernVirginia
HamptonRoads
Richmond Virginia
Percent Hispanic by Metro Area

Weldon Cooper Center Demographics Research Group | University of Virginia | coopercenter.org/demographics 14
sChool enrollment
During the late 1990s and 2000s, Portsmouth experienced a steady enrollment decline in its public schools. From 1995 to 2010, the division’s size shrunk by 18 percent. Enrollment in the Hampton Roads metro area’s public schools has also declined, though that decline began later than Portsmouth’s. Between 2004 and 2014, Hampton Roads public school enrollment declined by 7 percent. The main cause of Hampton Roads’ declining enrollment is that children make up a decreasing percentage of the population as more Baby Boomers age. In Portsmouth, this is augmented by fewer families enrolling their children in public school. One of the most common ways of measuring this is by looking at the ratio between births and 1st grade enrollment six years later. If this ratio is less than 100 percent, it means that families are enrolling their children in other schools or, more commonly, moving to other localities before enrolling them in school. In 2014, Portsmouth had one of the lowest retention rates for families in the region, with 80 percent of children born six years earlier enrolling in 1st grade.
On the other end of the spectrum, cities with a ration of over 100 percent are gaining families with young children. In contrast to the 1990s and 2000s however, few school divisions now have a percentage above 100, suggesting that moving to a suburban locality for the schools is becoming less attractive. In Portsmouth, the recent stabilization in enrollment indicates an increase in the percentage of families staying in the city to enroll their children in public school.
Over the next ten years, enrollment in Portsmouth’s public schools is likely to continue to decline, but more moderately than in the past and slower than the metro area’s overall enrollment. Much of the projected decrease in enrollment is due to the low number of births since the recession, which will result in smaller class sizes as the next generation enrolls in school. There may be less decline, and possibly even some growth in upper grades’ sizes as more students stay in Portsmouth schools to graduate than in the past.
-
50,000
100,000
150,000
200,000
250,000
300,000
-
5,000
10,000
15,000
20,000
1995
1997
1999
2001
2003
2005
2007
2009
2011
2013
2015
2017
2019
2021
2023
Public School Enrollment
Portsmouth Hampton Roads Metro
Portsmouth Hampton Roads
Weldon Cooper Center analysis of VDOE fall count

Weldon Cooper Center Demographics Research Group | University of Virginia | coopercenter.org/demographics 15
0 200 400 600 800 1,000 1,200 1,400
Kinderg…
1 Grade
2 Grade
3 Grade
4 Grade
5 Grade
6 Grade
7 Grade
8 Grade
9 Grade
10 Grade
11 Grade
12 Grade
Grade Enrollment Projection
2024-25 2014-15
Poquoson
York
Mathews
Williamsburg-James City
Suffolk
Gloucester
Isle of Wight
Chesapeake
Virginia Beach
Hampton
Portsmouth
Newport News
Norfolk
60% 80% 100% 120% 140% 160% 180%
Ratio of First Graders to Births 6 Years Earlier2004-2005 2009-2010 2014-2015
Weldon Cooper Center analysis and projections from birth data and VDOE fall count

Weldon Cooper Center Demographics Research Group | University of Virginia | coopercenter.org/demographics 16
sChool enrollment ProjeCtions
Grade 2020-21 2021-22 2022-23 2023-24 2024-25 10 yr changeK 1207 1182 1154 1126 1099 -11.5%1 1223 1192 1168 1140 1113 -12.9%2 1194 1216 1186 1162 1134 -9.5%3 1138 1159 1181 1151 1128 -2.2%4 1145 1092 1113 1134 1105 -6.1%5 1120 1110 1059 1079 1099 1.0%6 1059 1097 1088 1037 1058 -4.7%7 1110 1028 1066 1057 1007 -7.5%8 1051 1087 1007 1044 1035 -1.1%9 1106 1169 1209 1120 1161 1.4%10 1046 968 1023 1058 980 -5.9%11 841 894 828 875 905 0.0%12 884 854 907 840 888 5.6%Total K-12 14124 14049 13988 13824 13713 -4.6%
Grade 2014-15 2015-16 2016-17 2017-18 2018-19 2019-20K 1242 1256 1244 1196 1213 12371 1278 1214 1244 1232 1180 12002 1253 1285 1197 1240 1227 11723 1153 1216 1247 1163 1204 11914 1177 1103 1165 1201 1115 11555 1088 1148 1069 1128 1166 10816 1110 1063 1126 1047 1105 11427 1089 1073 1029 1097 1016 10738 1046 1068 1047 1010 1075 9949 1145 1166 1184 1166 1123 119410 1041 991 1024 1038 1019 98411 905 890 848 875 888 87112 841 924 900 861 889 900Total K-12 14368 14398 14325 14255 14219 14195

Weldon Cooper Center Demographics Research Group | University of Virginia | coopercenter.org/demographics 17
eduCational attainment
Education levels in Portsmouth are considerably lower than the rest of the Hampton Roads metro area and Virginia. In 2013, nearly half of Portsmouth’s population ages 25 and over had only a high school diploma or had not finished high school. Similarly, only 19 percent of Portsmouth’s residents have received a Bachelor’s degree or higher, compared to 29 percent in the Hampton Roads metro area and 37 percent in Virginia overall.
Since 1990, the percentage of Portsmouth’s population over the age of 25 with at least a Bachelor’s degree has risen steadily, though it is still the lowest in the metro area. Educational attainment has risen significantly across the country and thus far Portsmouth’s increase has only been keeping pace with the larger trend.
Percent with 4-year college degree
Under 10%
10-20%
20-30%
Over 30%
Graduate degree
11%
Bachelor's degree
18%
Some college
35%
High school26%
Less than high
school10%
Hampton Roads
Graduate degree
7%Bachelor's
degree12%
Some college
33%
High school30%
Less than high
school18%
Portsmouth
Map and charts based on 2009-2013 American Community Survey 5-year estimates
Portsmouth’s low levels of educational attainment relative to the region are closely related to its higher poverty rate and lower median income. The educated workers and families that move out to neighboring localities are also likely to be college graduates.

Weldon Cooper Center Demographics Research Group | University of Virginia | coopercenter.org/demographics 18
emPloyment and labor forCe
The unemployment rate in Portsmouth has consistently trended higher than in the Hampton Roads metro area and Virginia. During the recent recession, unemployment in Portsmouth reached nearly 10 percent but has since declined to just above 7 percent in 2014. While unemployment in Portsmouth remains the highest in the metro area, it is not dramatically higher as it was during the 1990s and early 2000s. Since the mid-2000s, Portsmouth’s unemployment rate has grown closer to the metro area’s rate. The unemployment rate is based on residents who consider themselves in the labor force and who are looking for a job. It does not capture residents who have given up looking for a job or who have chosen not to work. In addition to having a high unemployment rate, the percentage of Portsmouth’s total population age 16 and over who are employed is also among the lowest in the metro area. Williamsburg and Norfolk have lower employment rates, but both have a relativly large portion of their population enrolled in college. Matthews County also has a lower employment rate due to its large retiree population. Two demographic factors that may be contributing to Portsmouth’s high unemployment rate and low employment rate are its education levels and age distribution. During at least the past two decades, unemployment rates have been higher for those with less education. Additionally, as addressed in the “Age and Migration” section, Portsmouth has a smaller portion of its population age 35 to 54 than the rest of the metro area. These are the years when workers tend to be at the height of their careers and this age group has the highest employment levels. Its underrepresentation in Portsmouth may be part of the reason for the city’s low overall employment rate.
Unemployment RateToo few residentsUnder 5%
5-10%
10-15%
15-20%
Over 20%
0.0
2.0
4.0
6.0
8.0
10.0
12.0
Unemployment Rate
Portsmouth Metro Area

Weldon Cooper Center Demographics Research Group | University of Virginia | coopercenter.org/demographics 19
Labor Force ParticipationToo few residentsUnder 60%
60-67%
67-74%
Over 74%
53% 55% 56% 59% 60% 62% 63% 63%
43% 40% 40% 36% 36% 33% 33% 34%
4% 5% 4% 4% 4% 5% 4% 4%
0%
10%
20%
30%
40%
50%
60%
70%
80%
90%
100%
Norfolk city Portsmouthcity
Hampton city NewportNews city
Suffolk city Virginia Chesapeakecity
Virginia Beachcity
Labor force status in 2013 for population 16 and over
Employed Not in Labor Force Unemployed
Map and chart based on 2009-2013 American Community Survey 5-year estimates and Bureau of Labor Statistics Local Area Unemployment Statistics program.
49%
74% 73%
57%
12%
36%
16% 21%40%
87%
14% 10% 6% 3% 1%
0%
10%
20%
30%
40%
50%
60%
70%
80%
90%
100%
16 to 24 25 to 34 35 to 54 55 to 64 65 and up
Porstmouth labor force status by age
Employed Not in Labor Force Unemployed
Weldon Cooper Center Demographics Research Group | University of Virginia | coopercenter.org/demographics 20
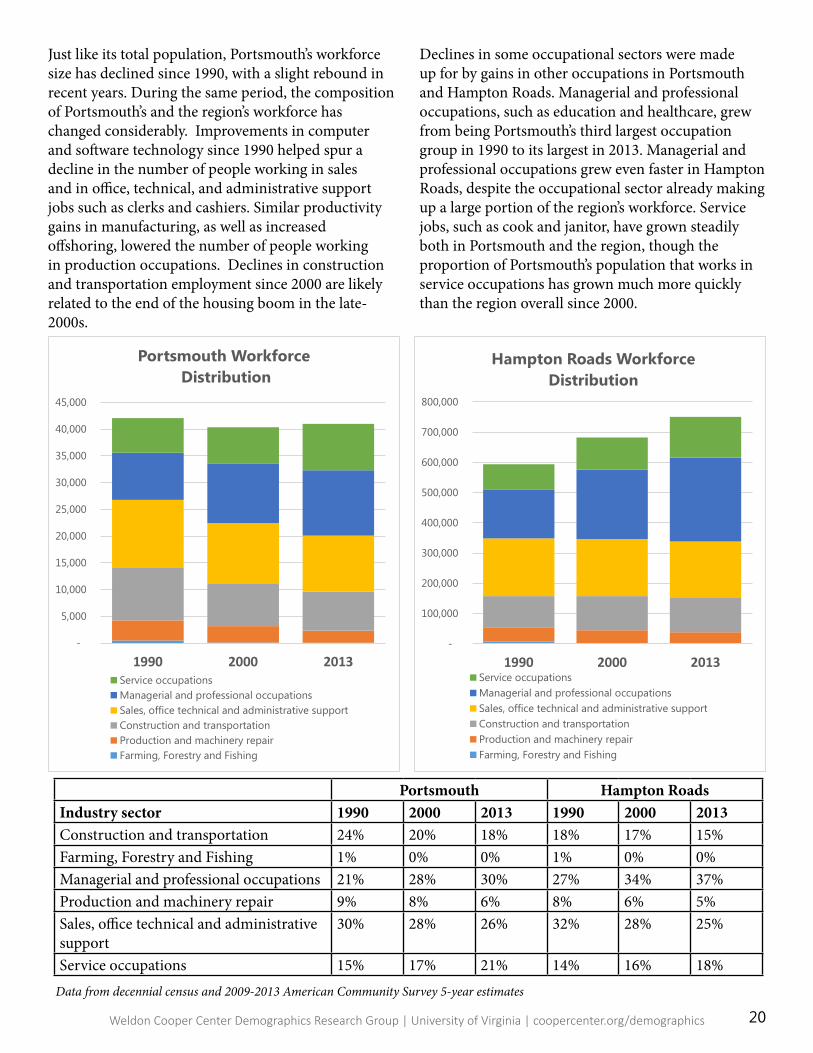
Just like its total population, Portsmouth’s workforce size has declined since 1990, with a slight rebound in recent years. During the same period, the composition of Portsmouth’s and the region’s workforce has changed considerably. Improvements in computer and software technology since 1990 helped spur a decline in the number of people working in sales and in office, technical, and administrative support jobs such as clerks and cashiers. Similar productivity gains in manufacturing, as well as increased offshoring, lowered the number of people working in production occupations. Declines in construction and transportation employment since 2000 are likely related to the end of the housing boom in the late-2000s.
Declines in some occupational sectors were made up for by gains in other occupations in Portsmouth and Hampton Roads. Managerial and professional occupations, such as education and healthcare, grew from being Portsmouth’s third largest occupation group in 1990 to its largest in 2013. Managerial and professional occupations grew even faster in Hampton Roads, despite the occupational sector already making up a large portion of the region’s workforce. Service jobs, such as cook and janitor, have grown steadily both in Portsmouth and the region, though the proportion of Portsmouth’s population that works in service occupations has grown much more quickly than the region overall since 2000.
-
100,000
200,000
300,000
400,000
500,000
600,000
700,000
800,000
1990 2000 2013
Hampton Roads Workforce Distribution
Service occupationsManagerial and professional occupationsSales, office technical and administrative supportConstruction and transportationProduction and machinery repairFarming, Forestry and Fishing
-
5,000
10,000
15,000
20,000
25,000
30,000
35,000
40,000
45,000
1990 2000 2013
Portsmouth WorkforceDistribution
Service occupationsManagerial and professional occupationsSales, office technical and administrative supportConstruction and transportationProduction and machinery repairFarming, Forestry and Fishing
Portsmouth Hampton RoadsIndustry sector 1990 2000 2013 1990 2000 2013Construction and transportation 24% 20% 18% 18% 17% 15%Farming, Forestry and Fishing 1% 0% 0% 1% 0% 0%Managerial and professional occupations 21% 28% 30% 27% 34% 37%Production and machinery repair 9% 8% 6% 8% 6% 5%Sales, office technical and administrative support
30% 28% 26% 32% 28% 25%
Service occupations 15% 17% 21% 14% 16% 18%Data from decennial census and 2009-2013 American Community Survey 5-year estimates

Weldon Cooper Center Demographics Research Group | University of Virginia | coopercenter.org/demographics 21
inCome
Household income in Portsmouth is among the lowest in the Hampton Roads metro area. Over half of Portsmouth’s households earned less than $50,000 in 2013. The proportion of households in Portsmouth earning more than $100,000 in 2013 was 14 percent, the lowest in the metro area.
Median household income in Portsmouth has remained among the lowest in the metro area since 1990, with only Norfolk having a lower median household income. Overall, median household
income has changed little in Portsmouth and most of the metro area since 1990. The recent recession is likely one reason for this, causing Portsmouth and many of its neighboring localities to have lower household incomes in 2013 than in 2000. As in the case of employment, Portsmouth’s low household income levels are related to its low education levels and age distribution. Low education levels often depress earnings, but Portsmouth also has a relatively small portion of its adult population within the peak earning ages between 35 and 54.
0%
10%
20%
30%
40%
50%
60%
70%
80%
90%
100%
Household Income Groups
Less than $25,000 $25,000 to $50,000 $50,000 to $100,000 Over $100,000
Data from 2009-2013 American Community Survey 5-year estimates
Weldon Cooper Center Demographics Research Group | University of Virginia | coopercenter.org/demographics 22
Median Household Income 1990(inflation-adjusted 2013 dollars)
Under $25,000$25,000 - $35,000$35,000 - $40,000$40,000 - $45,000$45,000 - $55,000$55,000 - $65,000Over $65,000
Median Household Income 2013
Under $25,000
$25,000 - $35,000$35,000 - $40,000
$40,000 - $45,000
$45,000 - $55,000
$55,000 - $65,000
Over $65,000
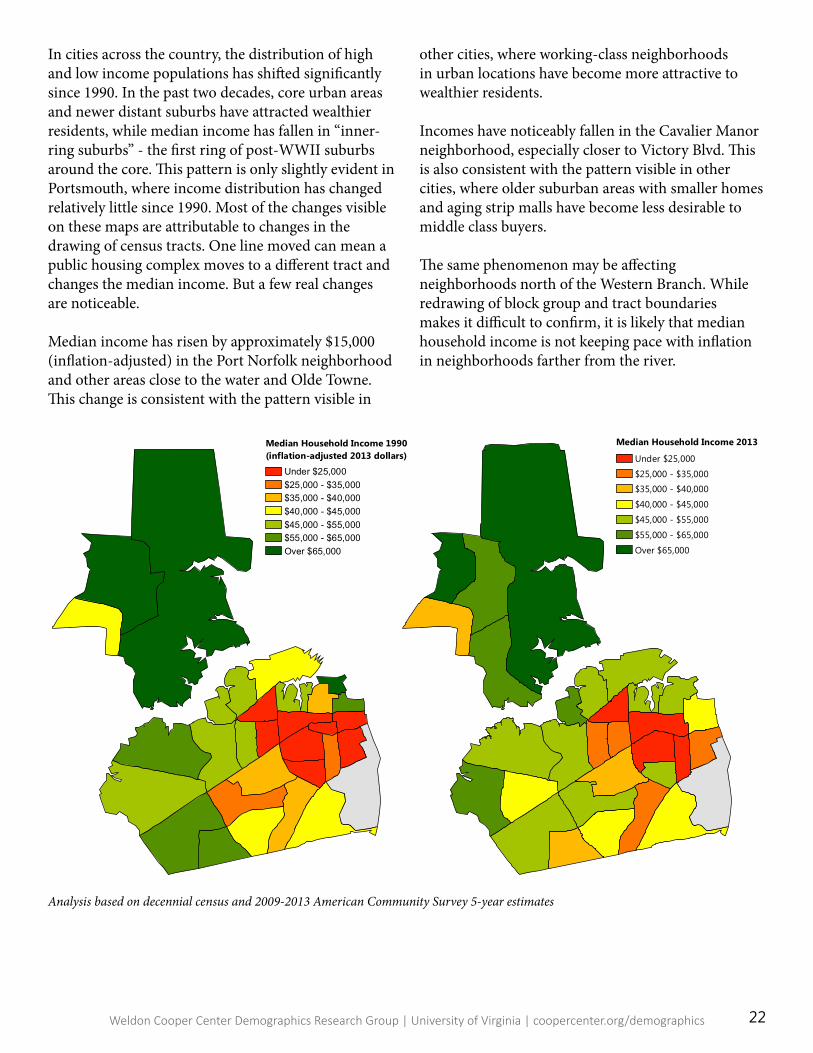
In cities across the country, the distribution of high and low income populations has shifted significantly since 1990. In the past two decades, core urban areas and newer distant suburbs have attracted wealthier residents, while median income has fallen in “inner-ring suburbs” - the first ring of post-WWII suburbs around the core. This pattern is only slightly evident in Portsmouth, where income distribution has changed relatively little since 1990. Most of the changes visible on these maps are attributable to changes in the drawing of census tracts. One line moved can mean a public housing complex moves to a different tract and changes the median income. But a few real changes are noticeable.
Median income has risen by approximately $15,000 (inflation-adjusted) in the Port Norfolk neighborhood and other areas close to the water and Olde Towne. This change is consistent with the pattern visible in
other cities, where working-class neighborhoods in urban locations have become more attractive to wealthier residents.
Incomes have noticeably fallen in the Cavalier Manor neighborhood, especially closer to Victory Blvd. This is also consistent with the pattern visible in other cities, where older suburban areas with smaller homes and aging strip malls have become less desirable to middle class buyers.
The same phenomenon may be affecting neighborhoods north of the Western Branch. While redrawing of block group and tract boundaries makes it difficult to confirm, it is likely that median household income is not keeping pace with inflation in neighborhoods farther from the river.
Analysis based on decennial census and 2009-2013 American Community Survey 5-year estimates
Weldon Cooper Center Demographics Research Group | University of Virginia | coopercenter.org/demographics 23
housing tyPes
Hampton Roads
1 Detached
1 Attached
Duplex
3-9 Units
10-49 Units
50 or more units
Mobile Home
Portsmouth
1 Detached
1 Attached
Duplex
3-9 Units
10-49 Units
50 or more units
Mobile Home
Chesapeake, Suffolk, & Isle of Wight
1 Detached
1 Attached
Duplex
3-9 Units
10-49 Units
50 or more units
Mobile Home
Norfolk
1 Detached
1 Attached
Duplex
3-9 Units
10-49 Units
50 or more units
Mobile Home
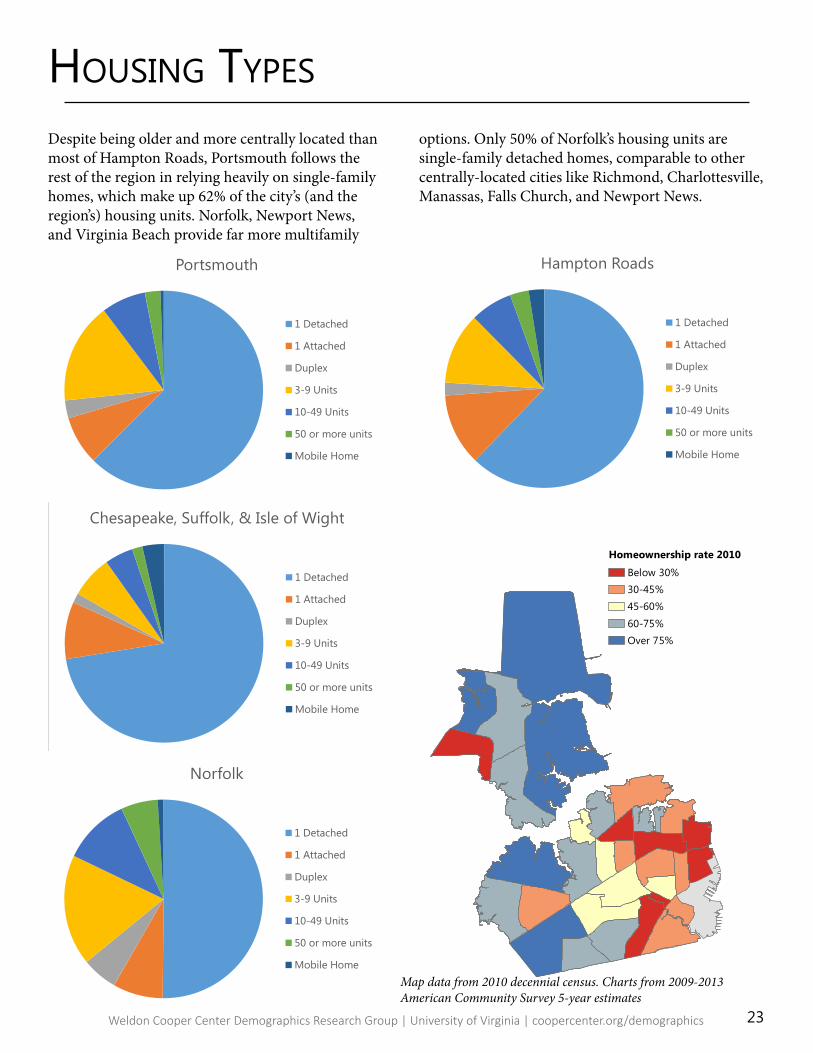
Despite being older and more centrally located than most of Hampton Roads, Portsmouth follows the rest of the region in relying heavily on single-family homes, which make up 62% of the city’s (and the region’s) housing units. Norfolk, Newport News, and Virginia Beach provide far more multifamily
options. Only 50% of Norfolk’s housing units are single-family detached homes, comparable to other centrally-located cities like Richmond, Charlottesville, Manassas, Falls Church, and Newport News.
Homeownership rate 2010
Below 30%30-45%45-60%
60-75%Over 75%
Map data from 2010 decennial census. Charts from 2009-2013 American Community Survey 5-year estimates

Weldon Cooper Center Demographics Research Group | University of Virginia | coopercenter.org/demographics 24
housing age
*Data for all decades except 2010’s from 2009-2013 ACS 5-year estimates. Data for 2010’s comes from 2011-2013 building permit data collected by Weldon Cooper Center from local governments
One of the challenges Portsmouth faces in attracting and retaining residents is its aging housing stock.According to the Census Bureau, the median size of a single-family home completed in 2014 was 2,453 square feet. The most common decade of construction for Portsmouth homes is the 1950’s. In 1950, a Federal Housing Administation study found that the average new house was only 983 square feet. Older homes may also lack modern amenities, especially additional bathroooms, and have more maintenance issues. As houses reach 40-60 years of age, the bulk of low and mid-grade housing is often torn down and replaced (if there is a market for new homes), while the best old housing is restored and renovated.
The most common housing options for middle-class families in Hampton Roads are single family homes built in the 1970’s, 80’s, and 90’s. The region has a high rate of homeownership across its cities. Portsmouth has a much smaller inventory of these types of houses.
Given the option of paying more for new construction or taking a smaller and older house, many families are likely opting to buy in nearby Chesapeake or Suffolk.
0
5,000
10,000
15,000
20,000
25,000
Housing Age: Chesapeake
0
20,000
40,000
60,000
80,000
100,000
120,000
140,000
160,000
Housing Age: Hampton Roads
0
1,000
2,000
3,000
4,000
5,000
6,000
7,000
8,000
9,000
Housing Age: Portsmouth
02,0004,0006,0008,000
10,00012,00014,00016,00018,00020,000
Housing Age: Norfolk
01,0002,0003,0004,0005,0006,0007,0008,0009,000
10,000
Housing Age: Suffolk

Weldon Cooper Center Demographics Research Group | University of Virginia | coopercenter.org/demographics 25
This effect can be seen in the graphs below, which show owned and rented homes by the age of the house and the age of the homeowner or head of household.
In both Portsmouth and Hampton Roads at large, 35-64 year-old householders, those most likely to have families and to be in the prime of their careers, dominate the purchase of homes built in the last 35 years. The difference for Portsmouth is that there are fewer of these homes. The breakdown by age of householder is similar in other cities in Hampton Roads, but the number of older homes is much higher in Portsmouth.
0
200
400
600
800
1000
1200
1400
1600
2010s 2000s 1990s 1980s 1970s 1960s 1950s 1940s Pre-War
Age of Renter-Occupied Homes: Portsmouth
Under 35 35-64 Over 65Homeowner age:
0
10000
20000
30000
40000
50000
60000
2010s 2000s 1990s 1980s 1970s 1960s 1950s 1940s Pre-War
Age of Owner-Occ. Homes: Hampton Roads
Under 35 35-64 Over 65Homeowner age:
0
5000
10000
15000
20000
25000
2010s 2000s 1990s 1980s 1970s 1960s 1950s 1940s Pre-War
Age of Renter-Occ. Homes: Hampton Roads
Under 35 35-64 Over 65Homeowner age:
0
500
1000
1500
2000
2500
2010s 2000s 1990s 1980s 1970s 1960s 1950s 1940s Pre-War
Age of Owner-Occupied Homes: Portsmouth
Under 35 35-64 Over 65Homeowner age:
Another notable sign in these graphs is that Portsmouth’s rental units are newer on average than its owner-occupied units. This is in contrast to most cities and Hampton Roads at large, where renter-occupied units are somewhat older. This suggests (along with the migration and household data) that there is a higher demand currently for quality rental housing than conventional homes. Currently, Portsmouth has a higher percentage of renters than the region, which is odd given that its median age is higher than Hampton Roads’.
Data from 2009-2013 American Community Survey 5-year estimates

Weldon Cooper Center Demographics Research Group | University of Virginia | coopercenter.org/demographics 26
households
-
2,000
4,000
6,000
8,000
10,000
12,000
1990 2000 2010
Portsmouth
Married couple with children Married couple without children
Single parent with children Other families
Nonfamilies Living Alone
-
20,000
40,000
60,000
80,000
100,000
120,000
140,000
160,000
180,000
200,000
1990 2000 2010
Hampton Roads
Married couple with children Married couple without children
Single parent with children Other families
Nonfamilies Living Alone
As discussed in the “Age and Migration” section, Portsmouth has significant and consistent out-migration of families with children, who can find more attractive single-family housing options in Chesapeake and Suffolk. As families demand more living space, Portsmouth will continue to struggle to provide comparable housing options within a constrained land area without losing population.
But Portsmouth may also be failing to appeal as much as it could to young professionals and retiring couples, a natural market for an older central city with a good location and functioning urban areas. Currently these are the only age groups with net in-migration. Portsmouth’s older single-family detached homes may be ill-suited to the growing number of couples with no children present and adults who live alone or with unrelated roommates. The multifamily units it does offer have historically been concentrated in public housing complexes and suburban-style garden apartments. In the future, the city could allow for more construction of new multifamily housing to fill this gap.
It is important to understand that these changes are not all unique to Portsmouth. Across the country, there are more empty-nesters and aging adults, more young adults delaying marriage, and lower birthrates than in any decade since World War II. These trends mean that conventional nuclear families will make up a much smaller percentage of total households and housing options will have to be more flexible in many cities.
Data from decennial census. “Other families” refers to any group of related persons living together without children under 18 in the home. This could include adult children at home, several siblings living together, etc. “Nonfamilies” are groups of unrelated adults. “Married couples without children” refer to all married couples who do not have any of their own children under 18 living with them. This could include both childless couples and “empty-nesters.”

Weldon Cooper Center Demographics Research Group | University of Virginia | coopercenter.org/demographics 27
housing oCCuPanCy
Vacancy rate - 2000
Below 5%
5-7.5%7.5-10%10-15%Over 15%
Vacancy rate - 2010
Below 5%5-7.5%7.5-10%
10-15%Over 15%
Change in housing units2000-2010
Loss of 200 or more unitsLoss of 50-199 unitsLoss of 49-gain of 50
Gain of 51-200 unitsGain of more than 200 units
As Portsmouth’s lack of newer housing suggests, the number of housing units has not changed significantly across the city. The growth that does exist is largely the result of the last undeveloped parts of the city being built out and the continued redevelopment of the downtown. The most significant losses of units are in tracts where public housing or aging multifamily housing has been demolished. Across the rest of the city, there has been only a mild loss of units, reflecting typical attrition of aging units in single-family neighborhoods that are not necessarily desirable enough to attract rebuilding.
In 2000, vacancy rates were high in the southeastern part of the city and extremely low in wealthier or more established neighborhoods. Today, the same pattern is visible, but vacancy rates are evening out across the city as historic areas become more attractive.
Data from decennial census with analysis and verification from Portsmouth city parcel data

Weldon Cooper Center Demographics Research Group | University of Virginia | coopercenter.org/demographics 28
Taxable Value per Acre
Less than $100,000
$100-300,000
$300-500,000
$500-750,000
$750-1,000,000
Over $1,000,000
taxable land Value
The quality and density of residential and commercial buildings is closely related to land value. As Portsmouth deals with budgeting and long-term maintenance of infrastructure, it should be aware of the value created by different investments and the ability of development patterns to capture that value. Because the cost of infrastructure like roads, emergency services, and utilities often varies by land area more than population, maximizing land value
per acre can help keep neighborhoods from becomng a net loss for the city. This is especially true in cities like Portsmouth with constrained boundaries. Several in-depth studies are now available from other cities, most recently Lafayette, LA, that examine this subject in more depth.
Portsmouth’s downtown and Olde Towne neighborhoods generate the most tax revenue per
acre, with significant revenue also coming from Port Norfolk, River Pointe, and several other newer multifamily developments and commercial areas. Some neighborhoods with high home values actually have fairly low property tax yields compared to the space they occupy.
Weldon Cooper Center analysis of Portsmouth City land use and tax assessor’s data

Weldon Cooper Center Demographics Research Group | University of Virginia | coopercenter.org/demographics 29
Commuters
WithinPortsmouth
IntoPortsmouth
Out ofPortsmouth
-
5,000
10,000
15,000
20,000
25,000
30,000
35,000
40,000
45,000
50,000Household Income of Commuters
Over $100,000
$75,000 - $100,000
$35,000 - $75,000
Less than $35,000
There is a significant difference between Portsmouth’s “daytime population” and its nighttime population. This section breaks workers down into three groups - residents of Portsmouth who also work in Portsmouth, residents of other cities who commute into Portsmouth, and Portsmouth residents who commute to jobs in other cities.
All data in these sections is taken from the most recent edition of the CTPP (Census Transportation Planning Product), which includes data gathered from 2006-2010.
19%
11%
13%
12%
23%
8%
14%
Agriculture, forestry, fishing and hunting, and mining;Construction; Armed Forces
Manufacturing
Wholesale trade; Retail Trade; Transportation andwarehousing, and utilities
Information; Finance, insurance, & real estate; Professional,scientific, administrative, & waste mgmt services
Educational, health and social services
Arts, entertainment, and recreation; Accommodation andfood services
Other services; Public Administration
21%
20%
11%9%
19%
3%
17% 12%
8%
21%
20%
20%
9%
10%
Portsmouth residents who work in Portsmouth
workers Commuting into Portsmouth Portsmouth residents Commuting out of Portsmouth

Weldon Cooper Center Demographics Research Group | University of Virginia | coopercenter.org/demographics 30
Commuting to PortsmouthPortsmouth as job CenterAlong with Norfolk, Portsmouth functions in some ways as a “core city” for the Hampton Roads area. It has more jobs than working residents and thus has a significant number of people commuting into the city from neighboring localities.
Portsmouth draws large numbers of workers from Norfolk and Virginia Beach, but its dominance as a job center is in the western part of Tidewater, especially neighboring Chesapeake and Suffolk. It is probably fair to say that a large proportion of Portsmouth employees are choosing between Portsmouth, Chesapeake, and Suffolk when deciding where to live.
The fastest growing sources of Porstmouth commuters include Suffolk and Isle of Wight County, which have allowed significant residential development over the past two decades. There was also a noticeable uptick in the number of Peninsula residents commuting to Portsmouth between 1990 and 2000, presumably helped by completion of the Monitor-Merrimac Bridge-Tunnel in 1992.
Workers commuting into Portsmouth tend to have significantly higher incomes than workers living in Portsmouth, suggesting that many well-paid workers are opting to drive farther in order to live in a different locality.
Residents Commuting TO Portsmouth
1
10
1,000
0.000000 - 0.050000
0.050001 - 0.100000
0.100001 - 0.150000
0.150001 - 0.200000
0.200001 - 0.271709
2006-2010 Census Transportation Planning Product

Weldon Cooper Center Demographics Research Group | University of Virginia | coopercenter.org/demographics 31
Virginia Beach7,530
Norfolk6,545
Chesapeake11,510
Suffolk4,780
Isle of Wight890
Hampton1,240
Newport News1,745
York270*
Gloucester153*
Southampton166*
Franklin159*
Workers who commute into Portsmouth
Less than$35,000$35,000 -$75,000$75,000 -$100,000Over $100,000
Less than$35,000$35,000 -$75,000$75,000 -$100,000Over $100,000
-
2,000
4,000
6,000
8,000
10,000
12,000
1990 2000 2010
Commuting to Portsmouth: 1990-2010 CTPP
Chesapeake, VA
Norfolk, VA
Virginia Beach, VA
Suffolk/Isle of Wight
Peninsula
Workers who live in Portsmouth
Data from 1986-90, 1996-2000, and 2006-2010 Census Transportation Planning Product
Weldon Cooper Center Demographics Research Group | University of Virginia | coopercenter.org/demographics 32
Portsmouth as bedroom Community
Commuting from Portsmouth
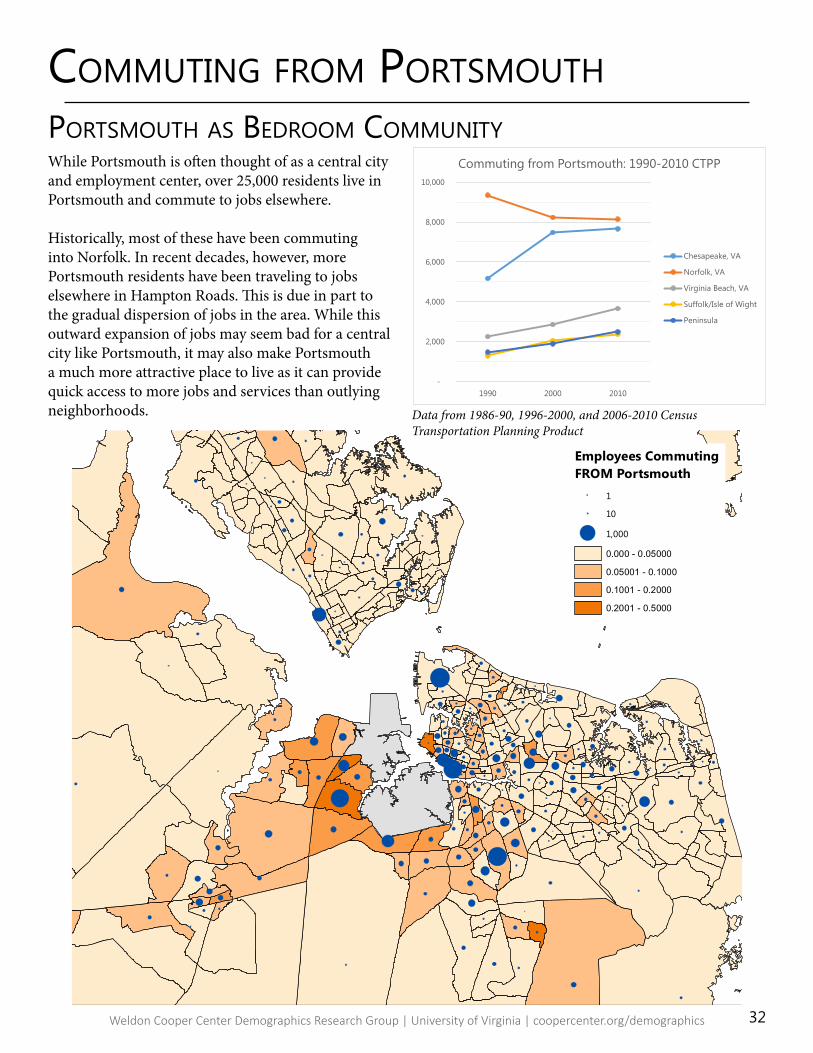
Employees Commuting FROM Portsmouth
1
10
1,000
0.000 - 0.05000
0.05001 - 0.1000
0.1001 - 0.2000
0.2001 - 0.5000
-
2,000
4,000
6,000
8,000
10,000
1990 2000 2010
Commuting from Portsmouth: 1990-2010 CTPP
Chesapeake, VA
Norfolk, VA
Virginia Beach, VA
Suffolk/Isle of Wight
Peninsula
While Portsmouth is often thought of as a central city and employment center, over 25,000 residents live in Portsmouth and commute to jobs elsewhere.
Historically, most of these have been commuting into Norfolk. In recent decades, however, more Portsmouth residents have been traveling to jobs elsewhere in Hampton Roads. This is due in part to the gradual dispersion of jobs in the area. While this outward expansion of jobs may seem bad for a central city like Portsmouth, it may also make Portsmouth a much more attractive place to live as it can provide quick access to more jobs and services than outlying neighborhoods. Data from 1986-90, 1996-2000, and 2006-2010 Census
Transportation Planning Product
Weldon Cooper Center Demographics Research Group | University of Virginia | coopercenter.org/demographics 33
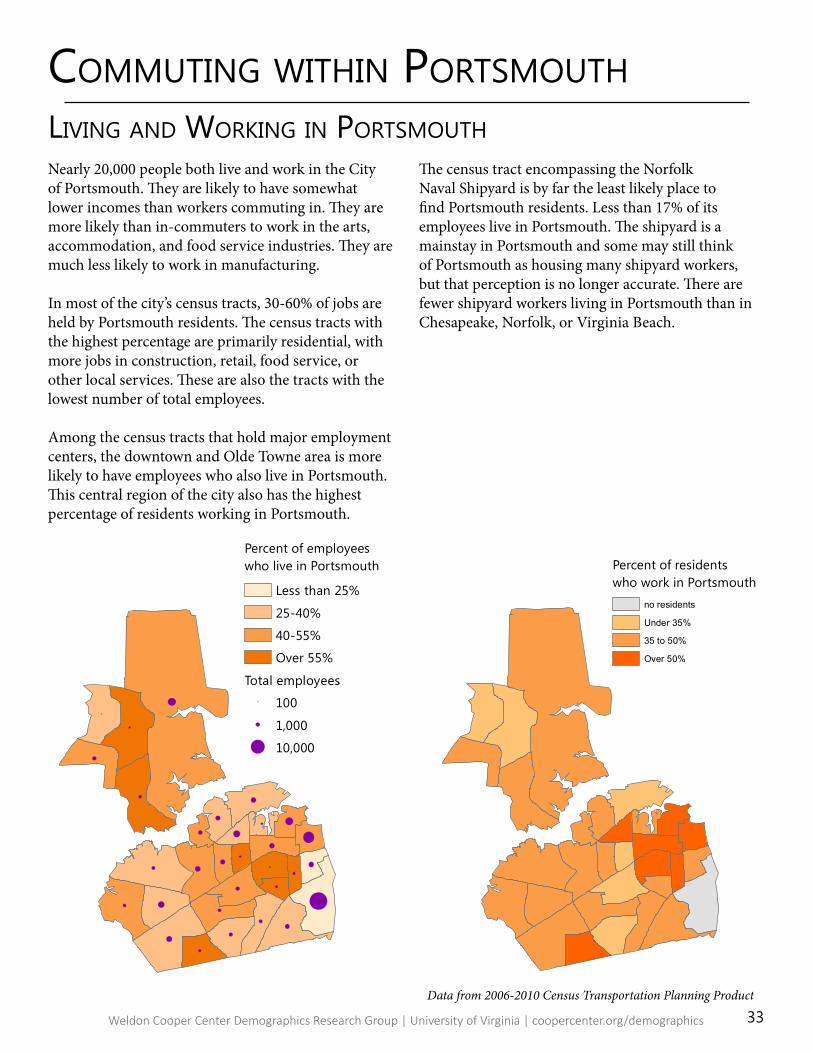
liVing and working in Portsmouth
Commuting within Portsmouth
Percent of residentswho work in Portsmouth
no residents
Under 35%
35 to 50%
Over 50%
Percent of employeeswho live in Portsmouth
Less than 25%
25-40%
40-55%
Over 55%
Total employees
100
1,000
10,000
Nearly 20,000 people both live and work in the City of Portsmouth. They are likely to have somewhat lower incomes than workers commuting in. They are more likely than in-commuters to work in the arts, accommodation, and food service industries. They are much less likely to work in manufacturing.
In most of the city’s census tracts, 30-60% of jobs are held by Portsmouth residents. The census tracts with the highest percentage are primarily residential, with more jobs in construction, retail, food service, or other local services. These are also the tracts with the lowest number of total employees.
Among the census tracts that hold major employment centers, the downtown and Olde Towne area is more likely to have employees who also live in Portsmouth. This central region of the city also has the highest percentage of residents working in Portsmouth.
The census tract encompassing the Norfolk Naval Shipyard is by far the least likely place to find Portsmouth residents. Less than 17% of its employees live in Portsmouth. The shipyard is a mainstay in Portsmouth and some may still think of Portsmouth as housing many shipyard workers, but that perception is no longer accurate. There are fewer shipyard workers living in Portsmouth than in Chesapeake, Norfolk, or Virginia Beach.
Data from 2006-2010 Census Transportation Planning Product

Weldon Cooper Center Demographics Research Group | University of Virginia | coopercenter.org/demographics 34
ConClusion
Is Portsmouth a central city or a suburb? Confusion over this question seems to be at the root of some of the city’s problems.
Portsmouth’s age structure and the age groups it attracts suggest it has the natural advantages and disadvantages of a central city. Its location, commuting numbers, and redevelopment issues also suggest it functions more as a central city. However, most of the city has the density, urban form, and housing stock of a suburb.
For Portsmouth, gaining residents and businesses may mean embracing its role within the metro area. It has the potential to be a vibrant urban core for areas west of the Elizabeth River at a time when demand for urban residential options is higher than it has been in the past. The type of neighborhoods it could offer are sparse in the Hampton Roads area.
Families gravitating towards new suburbs will be more difficult to attract due to the city’s land constraints and perceptions of its school system. Their numbers may increase in time, however, as part of an overall population increase driven by other groups.

Weldon Cooper Center Demographics Research Group | University of Virginia | coopercenter.org/demographics 35
Sources: Esri, HERE, DeLorme, TomTom, Intermap, increment P Corp., GEBCO,USGS, FAO, NPS, NRCAN, GeoBase, IGN, Kadaster NL, Ordnance Survey, EsriJapan, METI, Esri China (Hong Kong), swisstopo, MapmyIndia, © OpenStreetMapcontributors, and the GIS User Community
aPPendix: 2010-2013 Census traCts

Weldon Cooper Center Demographics Research Group | University of Virginia | coopercenter.org/demographics 36
aPPendix: 1990 Census traCts
Sources: Esri, HERE, DeLorme, TomTom, Intermap, increment P Corp., GEBCO,USGS, FAO, NPS, NRCAN, GeoBase, IGN, Kadaster NL, Ordnance Survey, EsriJapan, METI, Esri China (Hong Kong), swisstopo, MapmyIndia, © OpenStreetMapcontributors, and the GIS User Community