demographic study: sandringham college - … · scope and level of the ... demographic study: ......
TRANSCRIPT

DEMOGRAPHIC STUDY: SANDRINGHAM COLLEGE
Final Report
Developed for the Department of Education and Early Childhood Development
Prepared by Spatial Vision Innovations Pty Ltd
ABN 28 092 695 951
October 2012
Level 4 575 Bourke Street Melbourne 3000 Victoria Australia
Tel +61 3 9691 3000 Fax +61 3 9691 3001 E-mail [email protected] Web www.spatialvision.com.au
DEMOGRAPHIC STUDY: SANDRINGHAM COLLEGE Spatial Vision
Department of Education and Early Childhood Development
Ref: SV003491 10/10/12 Commercial-in-Confidence Page 2 of 71 Spatial Vision
About this Document
Project Number SV003491
Project Name DEMOGRAPHIC STUDY: SANDRINGHAM COLLEGE
Document File Name Sandringham Demographic Profile v3.1
Project Client Department of Education and Early Childhood Development
Document Type Final Report
Document Status Final
Contact Person Liam Densley
Telephone (03) 9691 3000
Email [email protected]
Revision History
Version
No.
Date Author Status Revision Notes
1.0 27/07/2012 Liam Densley Draft
1.1 02/08/2012 Liam Densley Final Draft
2.0 20/08/2012 Liam Densley Final Report Additional charts and executive summary added
3.0 13/09/2012 Liam Densley Updated
Final Report
Yield rate scenario analysis included
3.1 10/10/2012 Liam Densley Updated
Final Report
Yield rate scenario analysis included
Authorisation
Author Date Signature
Prepared by Liam Densley 02/08/2012 n/a
Reviewed by Stephen Farrell 10/10/2012 n/a
Approved by Stephen Farrell 10/10/2012 n/a
Disclaimer
It is Spatial Vision’s understanding that this report provided to the client is to be used for the
purpose agreed between the parties. This purpose was a significant factor in determining the
scope and level of the Services being offered to the Client. Should the purpose for which the
report is to be used change, the report may no longer be valid or appropriate and any further
use of or reliance upon the report in those circumstances by the Client without Spatial Vision's
review and advice shall be at the Client's own or sole risk.
Version Number 3.1
Date of Issue 10/10/2012

DEMOGRAPHIC STUDY: SANDRINGHAM COLLEGE Spatial Vision
Department of Education and Early Childhood Development
Ref: SV003491 10/10/12 Commercial-in-Confidence Page 3 of 71 Spatial Vision
Contents
Demographic Study: Sandringham College .............................................................................. 6
1. Introduction ................................................................................................................... 7
1.3 Schools Included in Study .................................................................................................................... 9
1.4 Methodology .......................................................................................................................................... 9
1.5 Geographical Classifications .............................................................................................................. 10
1.6 This Report .......................................................................................................................................... 10
2. Demographic Overview: Melbourne – Inner South (Broad Study Area) ........................ 12
3. Demographic Overview: Sandringham College Catchment (Detailed Study Area) ........ 22
3.1 Sandringham College Catchment – Population Counts ................................................................... 23
3.2 Sandringham College Catchment – Household Demographics ....................................................... 31
3.3 Sandringham College Catchment – School Age Population ............................................................. 36
3.4 Sandringham College Catchment – Education Attendance and Student Yield Rates ..................... 43
3.1 Sandringham College Catchment – Projections 2011-2026 ............................................................. 55
4. Yield Rate Scenario Analysis ....................................................................................... 63
5. Student Address Analysis ............................................................................................ 67
LIST OF FIGURES
Figure 1: Detailed Study Area – Sandringham College Catchment ................................................................ 8
Figure 2: Broad Study Area ................................................................................................................................. 8
Figure 3: Total Population Change (2001-2011) ............................................................................................... 13
Figure 4: Population Change of Persons 5-12 years of age – (2001-2011) ..................................................... 14
Figure 5: Population Change of Persons 12-18 years of age (2001-2011) ...................................................... 15
Figure 6: Change in the Percentage of Families with a Dependent Child (2001-2011) .................................. 16
Figure 7: Change in Median Family Income (2001-2011) ................................................................................. 17
Figure 8: Change in Government Share of Primary School Attendance (2001-2011) ..................................... 18
Figure 9: Change in Government Share of Secondary School Attendance (2001-2011) ................................. 19
Figure 10: Forecast Change in Primary School Aged Children (5-12 years of age) (2011-2026) ................... 20
Figure 11: Forecast Change in Secondary School Aged Children (12-18 years of age) (2011-2026) ............. 21
Figure 12: Historical Population - Sandringham College Catchment – (2001 - 2011) .................................... 24
Figure 13: Total Population Sandringham College Catchment - 2011 ............................................................ 25
Figure 14: Population Age Cohorts - Sandringham College Catchment - 2011 ............................................. 26
Figure 15: Population Age Cohorts- Percentage of Total Population - Sandringham College Catchment -
2011 ....................................................................................................................................................... 27
Figure 16: School Age Population Cohorts- Percentage of Total Population - Sandringham College
Catchment - 2011 .................................................................................................................................. 28

DEMOGRAPHIC STUDY: SANDRINGHAM COLLEGE Spatial Vision
Department of Education and Early Childhood Development
Ref: SV003491 10/10/12 Commercial-in-Confidence Page 4 of 71 Spatial Vision
Figure 17: Primary School Age Population Cohort by Sex - Sandringham College Catchment – 2011 ......... 29
Figure 18: Secondary School Age Population Cohort by Sex - Sandringham College Catchment – 2011 ..... 30
Figure 19: Family Composition - Sandringham College Catchment - 2011 .................................................... 32
Figure 20: Family Composition by Percentage of Total Families - Sandringham College Catchment - 201133
Figure 21: Language Spoken at Home – English and Non English Speaking - Sandringham College
Catchment - 2011 .................................................................................................................................. 34
Figure 22: Language Spoken at Home - Language Distribution of Non English Speakers - Sandringham
College Catchment - 2011 .................................................................................................................... 35
Figure 23: Pre-school Age Population (0-4) - Sandringham College Catchment - 2011 ............................... 37
Figure 24: Primary School Age Population (5-12) - Sandringham College Catchment - 2011 ...................... 38
Figure 25: Secondary School Age Population (12-18) - Sandringham College Catchment - 2011 ................ 39
Figure 26: Primary and Secondary School Age Population (5-12 & 12-18) - Sandringham College
Catchment - 2011 .................................................................................................................................. 40
Figure 27: Historical School Age Population Change - Sandringham College Catchment – (2001-2011) ..... 41
Figure 28: Primary and Secondary School Age Population – Percentage of Total Population- Sandringham
College Catchment - 2011 .................................................................................................................... 42
Figure 29: Victoria - Victorian and Primary and Secondary School Attendance by Age (2006) ...................... 44
Figure 30: Pre School and Primary School Attendance - Sandringham College Catchment – 2011 ............. 46
Figure 31: Primary School Attendance - Share of Total Attendance - Sandringham College Catchment –
2011 ....................................................................................................................................................... 47
Figure 32: Secondary School Attendance - Sandringham College Catchment – 2011 ................................... 48
Figure 33: Secondary School Attendance – Share of Total Attendance - Sandringham College Catchment –
2011 ....................................................................................................................................................... 49
Figure 34: Government Primary School Yield Rate - Sandringham College Catchment – 2011 .................... 50
Figure 35: Government Secondary School Yield Rate - Sandringham College Catchment – 2011 ................ 51
Figure 36: Historical Primary School Yield Rate s- Sandringham College Catchment – 2001 - 2011 ........... 52
Figure 37: Historical Secondary School Yield Rates - Sandringham College Catchment – 2001 - 2011 ....... 53
Figure 38: Historical School Yield Rate - Sandringham College Catchment – 2011 ...................................... 54
Figure 39: Total Population Forecasts - Sandringham College Catchment – 2011-2026 .............................. 56
Figure 40: School Age Population Forecasts - Sandringham College Catchment – 2011-2026 .................... 57
Figure 41: Primary School Age Population Forecasts - Sandringham College Catchment – 2011-2026 ...... 58
Figure 42: Secondary School Age Population Forecasts - Sandringham College Catchment – 2011-2026 .. 59
Figure 43: School Age Population Forecasts - Sandringham College Catchment – 2011-2026 .................... 60
Figure 44: Forecast Government School Demand - Sandringham College Catchment – 2011-2026 ............ 61
Figure 45: Forecast Change in Government School Demand - Sandringham College Catchment – 2011-
2021 ....................................................................................................................................................... 62
Figure 46: Forecast Government School Demand – Yield Scenarios - Sandringham College Catchment –
2011-2026 .............................................................................................................................................. 64
Figure 47: Forecast Government School Demand by Suburb for 2021 – Yield Scenarios - Sandringham
College Catchment ............................................................................................................................... 65
Figure 48: Forecast Government School Demand by Suburb for 2026 – Yield Scenarios - Sandringham
College Catchment ............................................................................................................................... 66
Figure 49: 2012 student address mapping ....................................................................................................... 68
Figure 50: Historical student address comparison ......................................................................................... 69

DEMOGRAPHIC STUDY: SANDRINGHAM COLLEGE Spatial Vision
Department of Education and Early Childhood Development
Ref: SV003491 10/10/12 Commercial-in-Confidence Page 5 of 71 Spatial Vision
Figure 51: Student Address Analysis: Location of Student Residences for Study Area Schools vs Defined
Regions .................................................................................................................................................. 70
Figure 52: Student Address Analysis: Student Residences within Sandringham College Catchment for all
Government Schools vs Defined Regions ............................................................................................ 71

DEMOGRAPHIC STUDY: SANDRINGHAM COLLEGE Spatial Vision
Department of Education and Early Childhood Development
Ref: SV003491 10/10/12 Commercial-in-Confidence Page 6 of 71 Spatial Vision
Demographic Study: Sandringham College
Executive Summary
This demographic study has revealed that:
Sandringham College draws students from a wide area, with approximately, 54% of its
students living outside its catchment.
The primary school age population resident in the School’s catchment is forecast to
grow at a comparatively low rate of 0.10% per annum compound over the next 15 years
(compared to 1.40% pa for the Metropolitan Melbourne).
The secondary school age population resident in the School’s catchment is forecast to
grow at a comparatively low rate of 0.20% per annum compound over the next 15 years
(compared to 1.18% pa for the Metropolitan Melbourne).
Government secondary school education attendance rates (or yields) were found to
have decreased from 34.35% in 2006 to 31% in 2011 (i.e. a 3.35% drop).
Assuming attendance rates (or yields) remain at 2011 levels (i.e. they do not deteriorate
further), demand for government education institutions is therefore likely to experience only
modest growth (1.50 - 4%) for primary and secondary school programs to 2026.
Enrolments at Sandringham College will expand at or below the school age population
growth presented, unless one or both of the following occurs:
1. The deterioration in attendance rates for government education across the study
area is reversed. This may occur through initiatives unique to Sandringham College
or in collaboration with other government schools (primary and secondary)
throughout the local network.
2. The share of government education demand satisfied by Sandringham College
increases relative to other government schools in the network: Sandringham
College has been chosen by approximately 45% of government secondary school
students who live within its catchment. An increase in this figure of, say, 10%
would result in approximately 130 additional enrolments.
Section 4 presents an analysis of several yield rate scenarios and their impact on demand
forecasts. For example, one scenario identified that if the government school yield within
the Sandringham College catchment increased by 5%, and the College maintained its share
of enrolments within the catchment, this would result in approximately 120 additional
enrolments at 2021.
Building on the above scenario, in combination with an increase in the share of government
school attendance satisfied by Sandringham College (as described in point 2 above), an
increase of 5% in government education yield would result in approximately 260 additional
enrolments at 2021. This increase would be on top of the general secondary school aged
population increases (i.e. 3.0% within the catchment)
DEMOGRAPHIC STUDY: SANDRINGHAM COLLEGE Spatial Vision
Department of Education and Early Childhood Development
Ref: SV003491 10/10/12 Commercial-in-Confidence Page 7 of 71 Spatial Vision
1. Introduction
1.1 Objectives
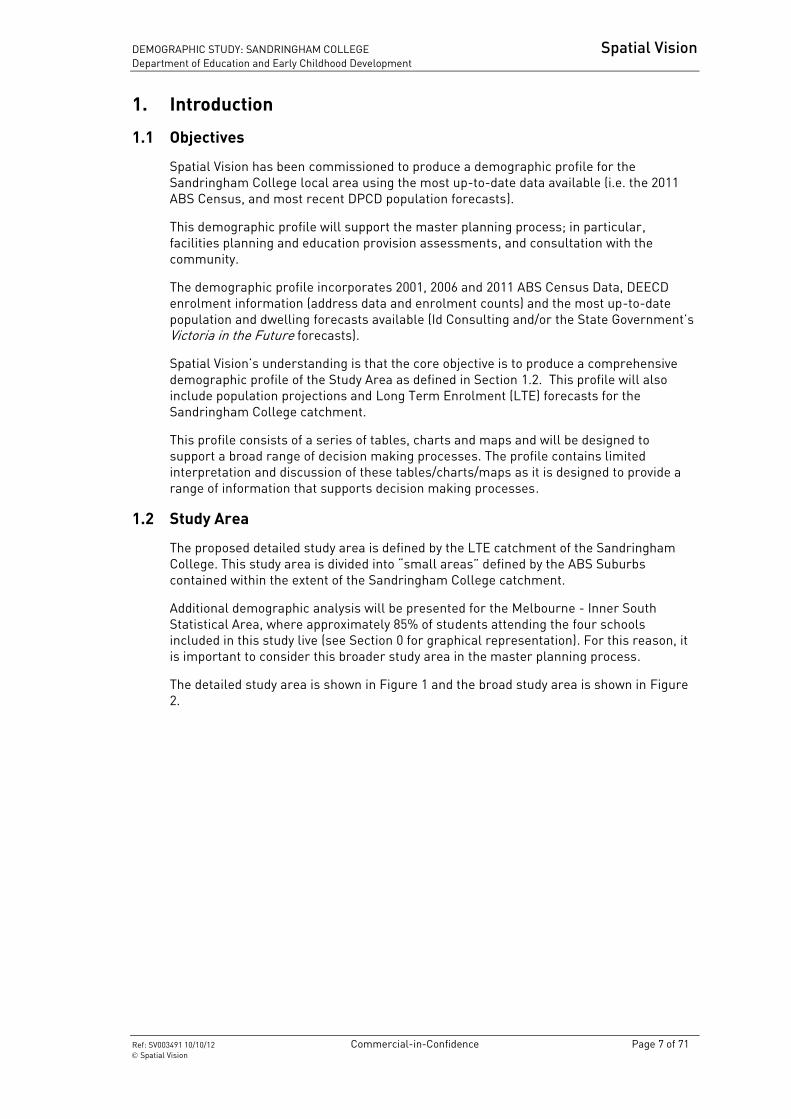
Spatial Vision has been commissioned to produce a demographic profile for the
Sandringham College local area using the most up-to-date data available (i.e. the 2011
ABS Census, and most recent DPCD population forecasts).
This demographic profile will support the master planning process; in particular,
facilities planning and education provision assessments, and consultation with the
community.
The demographic profile incorporates 2001, 2006 and 2011 ABS Census Data, DEECD
enrolment information (address data and enrolment counts) and the most up-to-date
population and dwelling forecasts available (Id Consulting and/or the State Government’s
Victoria in the Future forecasts).
Spatial Vision’s understanding is that the core objective is to produce a comprehensive
demographic profile of the Study Area as defined in Section 1.2. This profile will also
include population projections and Long Term Enrolment (LTE) forecasts for the
Sandringham College catchment.
This profile consists of a series of tables, charts and maps and will be designed to
support a broad range of decision making processes. The profile contains limited
interpretation and discussion of these tables/charts/maps as it is designed to provide a
range of information that supports decision making processes.
1.2 Study Area
The proposed detailed study area is defined by the LTE catchment of the Sandringham
College. This study area is divided into “small areas” defined by the ABS Suburbs
contained within the extent of the Sandringham College catchment.
Additional demographic analysis will be presented for the Melbourne - Inner South
Statistical Area, where approximately 85% of students attending the four schools
included in this study live (see Section 0 for graphical representation). For this reason, it
is important to consider this broader study area in the master planning process.
The detailed study area is shown in Figure 1 and the broad study area is shown in Figure
2.

DEMOGRAPHIC STUDY: SANDRINGHAM COLLEGE Spatial Vision
Department of Education and Early Childhood Development
Ref: SV003491 10/10/12 Commercial-in-Confidence Page 8 of 71 Spatial Vision
Figure 1: Detailed Study Area – Sandringham College Catchment
Figure 2: Broad Study Area

DEMOGRAPHIC STUDY: SANDRINGHAM COLLEGE Spatial Vision
Department of Education and Early Childhood Development
Ref: SV003491 10/10/12 Commercial-in-Confidence Page 9 of 71 Spatial Vision
1.3 Schools Included in Study
The Sandringham Demographic Profile includes Sandringham College, a co-educational
multi-campus Year 7-12 College, and Sandringham East Primary School, a single
campus government primary school. The location of these schools is presented in Figure
1 on page 8.
The Beaumaris and Sandringham campuses of Sandringham College only offer year 7-10
programs and the Senior campus year levels 11-12.
1.4 Methodology
The following data has been used for this project:
From the Australian Bureau of Statistics (ABS):
o Time Series Data Tables for the years 2001,2006 and 2011:
Age by Sex
Dwelling Structure by Household Composition and Family
Composition
Selected Medians and Averages
Dwelling Structure and Number of Bedrooms by Number of
Persons Usually Resident for Family Households
Type of Educational Institution Attending (Full/Part-Time Student
Status by Age) by Sex
Language Spoken at Home by Sex
o Basic Community Profile Data for the year 2011:
Age by Sex
Dwelling Structure by Household Composition and Family
Composition
Selected Medians and Averages
Dwelling Structure and Number of Bedrooms by Number of
Persons Usually Resident for Family Households
Type of Educational Institution Attending (Full/Part-Time Student
Status by Age) by Sex
Language Spoken at Home by Sex
Family Composition
Dwelling Structure
From the Department of Planning and Community Development (DPCD)
(formerly Department of Sustainability and Environment): population and
household projections (SLA level) drawn from the Victoria in Future documents
From local authorities: population and household forecasts by suburbs
From the Department of Education and Early Childhood Development: historic
and current enrolment data including residential address of students as at
February 2011.

DEMOGRAPHIC STUDY: SANDRINGHAM COLLEGE Spatial Vision
Department of Education and Early Childhood Development
Ref: SV003491 10/10/12 Commercial-in-Confidence Page 10 of 71 Spatial Vision
1.5 Geographical Classifications
A range of geographical classifications has been used in this report, including certain
ABS classifications:
Census Collector Districts (CCDs or CDs): areas of approximately 200
households. These areas are the current building block of most geographical
classifications used by the ABS. Virtually all other classifications are made up of
groupings of CCDs.
Local Government Areas (LGAs): municipal boundaries.
Statistical Local Areas (SLAs): sub-units within LGAs.
Statistical Areas Level 1 (SA1s): the smallest region for which a wide range of
Census data is released in the 2011 Census. They have an average population of
about 400. They are built from whole Mesh Blocks and there are approximately
55,000 SA1s covering the whole of Australia
Statistical Areas Level 2 (SA2s): have an average population of about 10,000, with
a minimum population of 3,000 and a maximum of 25,000. The SA2s are the
regions for which the majority of 2011 ABS sub-state inter censal data, for
example Estimated Resident Population and Health and Vital Statistics, will be
released. There are about 2,200 SA2s nationally built from whole SA1s.
Statistical Areas Level 4 (SA4s): Region geography the size of several LGAs
It should be noted that the geographic classification system used by the ABS varies
between census years (i.e. a given CCD may be split, partially divided or amalgamated by
the time of the next census) and therefore geographical units from one census year may
not necessarily be directly comparable with the same unit in subsequent years.
Two additional classifications have been used in the report:
School catchments: that area deemed by the Department of Education and Early
Childhood Development to be served by a local school, (for capital works
planning purposes). A school’s catchment will not overlap with the catchment
areas of other schools (i.e. catchment areas are mutually exclusive) and all of
Victoria is covered by one catchment or another (i.e. catchment areas are
mutually exhaustive).
Suburbs: defined by local authorities for the study regions population and
household forecasts.
1.6 This Report
The report structure is as follows:
Section 2: presents demographic time series data for the broad study area. This
data is presented in the form of maps to give a broad overview of the change
(spatially and quantitatively) of key demographics over the previous decade.
Section 3: presents demographic time series data, and 2011 census data for the
detailed study area. This data is presented in the form of charts and tables to give
a more detailed presentation of the change (spatially and quantitatively) of key
demographics over the previous decade, and the current day (2011 census)
snapshot. Where applicable, demographics are compared to state and
Melbourne- Inner South Statistical Area benchmarks.

DEMOGRAPHIC STUDY: SANDRINGHAM COLLEGE Spatial Vision
Department of Education and Early Childhood Development
Ref: SV003491 10/10/12 Commercial-in-Confidence Page 11 of 71 Spatial Vision
Figures in this section are presented for the small areas defined by the ABS state
suburbs within the extent of the Sandringham College Catchment (see Figure 1).
Where applicable, a short narrative is made in regards to identified trends.
Note: Melbourne - Inner South Statistical Area statistics are exclusive of the
Detailed Study Area.
Section 4: presents yield rate scenario analysis
Section 5: presents student address analysis

DEMOGRAPHIC STUDY: SANDRINGHAM COLLEGE Spatial Vision
Department of Education and Early Childhood Development
Ref: SV003491 10/10/12 Commercial-in-Confidence Page 12 of 71 Spatial Vision
2. Demographic Overview:
Melbourne – Inner South (Broad
Study Area)

DEMOGRAPHIC STUDY: SANDRINGHAM COLLEGE Spatial Vision
Department of Education and Early Childhood Development
Ref: SV003491 10/10/12 Commercial-in-Confidence Page 13 of 71 Spatial Vision
Total Population Change (2001-2011)
Figure 3: Total Population Change (2001-2011)
Source: 2011 ABS Census; Note: Quantile Classification Used

DEMOGRAPHIC STUDY: SANDRINGHAM COLLEGE Spatial Vision
Department of Education and Early Childhood Development
Ref: SV003491 10/10/12 Commercial-in-Confidence Page 14 of 71 Spatial Vision
Population Change of Persons 5-12 years of age (2001-2011)
Figure 4: Population Change of Persons 5-12 years of age – (2001-2011)
Source: 2011 ABS Census; Note: Quantile Classification Used

DEMOGRAPHIC STUDY: SANDRINGHAM COLLEGE Spatial Vision
Department of Education and Early Childhood Development
Ref: SV003491 10/10/12 Commercial-in-Confidence Page 15 of 71 Spatial Vision
Population Change of Persons 12-18 years of age (2001-2011)
Figure 5: Population Change of Persons 12-18 years of age (2001-2011)
Source: 2011 ABS Census; Note: Quantile Classification Used

DEMOGRAPHIC STUDY: SANDRINGHAM COLLEGE Spatial Vision
Department of Education and Early Childhood Development
Ref: SV003491 10/10/12 Commercial-in-Confidence Page 16 of 71 Spatial Vision
Change in the Percentage of Families with a Dependent Child (2001-2011)
Figure 6: Change in the Percentage of Families with a Dependent Child (2001-2011)
Source: 2011 ABS Census; Note: Quantile Classification Used

DEMOGRAPHIC STUDY: SANDRINGHAM COLLEGE Spatial Vision
Department of Education and Early Childhood Development
Ref: SV003491 10/10/12 Commercial-in-Confidence Page 17 of 71 Spatial Vision
Change in Median Family Income (2001-2011)
Figure 7: Change in Median Family Income (2001-2011)
Source: 2011 ABS Census; Note: Quantile Classification Used

DEMOGRAPHIC STUDY: SANDRINGHAM COLLEGE Spatial Vision
Department of Education and Early Childhood Development
Ref: SV003491 10/10/12 Commercial-in-Confidence Page 18 of 71 Spatial Vision
Change in Government Share of Primary School Attendance (2001-2011)
Figure 8: Change in Government Share of Primary School Attendance (2001-2011)
Source: 2011 ABS Census; Note: Quantile Classification Used

DEMOGRAPHIC STUDY: SANDRINGHAM COLLEGE Spatial Vision
Department of Education and Early Childhood Development
Ref: SV003491 10/10/12 Commercial-in-Confidence Page 19 of 71 Spatial Vision
Change in Government Share of Secondary School Attendance (2001-2011)
Figure 9: Change in Government Share of Secondary School Attendance (2001-2011)
Source: 2011 ABS Census; Note: Quantile Classification Used

DEMOGRAPHIC STUDY: SANDRINGHAM COLLEGE Spatial Vision
Department of Education and Early Childhood Development
Ref: SV003491 10/10/12 Commercial-in-Confidence Page 20 of 71 Spatial Vision
Forecast Change in Primary School Aged Children (5-12 years of age) (2011-
2026)
Figure 10: Forecast Change in Primary School Aged Children (5-12 years of age) (2011-2026)
Source: VIF2012 – DPCD; Note: Quantile Classification Used

DEMOGRAPHIC STUDY: SANDRINGHAM COLLEGE Spatial Vision
Department of Education and Early Childhood Development
Ref: SV003491 10/10/12 Commercial-in-Confidence Page 21 of 71 Spatial Vision
Forecast Change in Secondary School Aged Children (12-18 years of age)
(2011-2026)
Figure 11: Forecast Change in Secondary School Aged Children (12-18 years of age) (2011-2026)
Source: VIF2012 – DPCD; Note: Quantile Classification Used
DEMOGRAPHIC STUDY: SANDRINGHAM COLLEGE Spatial Vision
Department of Education and Early Childhood Development
Ref: SV003491 10/10/12 Commercial-in-Confidence Page 22 of 71 Spatial Vision
3. Demographic Overview: Sandringham College Catchment
(Detailed Study Area)

DEMOGRAPHIC STUDY: SANDRINGHAM COLLEGE Spatial Vision
Department of Education and Early Childhood Development
Ref: SV003491 10/10/12 Commercial-in-Confidence Page 23 of 71 Spatial Vision
3.1 Sandringham College Catchment – Population Counts

DEMOGRAPHIC STUDY: SANDRINGHAM COLLEGE Spatial Vision
Department of Education and Early Childhood Development
Ref: SV003491 10/10/12 Commercial-in-Confidence Page 24 of 71 Spatial Vision
Figure 12: Historical Population - Sandringham College Catchment – (2001 - 2011)
Beaumaris Black Rock Cheltenham Hampton Hampton East Highett Mentone Sandringham
2001 12,260 5,599 3,555 8,015 4,389 7,192 5,389 8,295
2006 12,432 5,786 3,662 8,203 4,466 7,235 5,512 8,687
2011 12,790 6,051 3,717 8,537 4,788 7,796 5,700 9,242
0
2,000
4,000
6,000
8,000
10,000
12,000
14,000
Pe
rso
ns
Total Population(2001-2011)
The total population has generally increased across all small areas in the by a relatively consistent rate.
DEMOGRAPHIC STUDY: SANDRINGHAM COLLEGE Spatial Vision
Department of Education and Early Childhood Development
Ref: SV003491 10/10/12 Commercial-in-Confidence Page 25 of 71 Spatial Vision
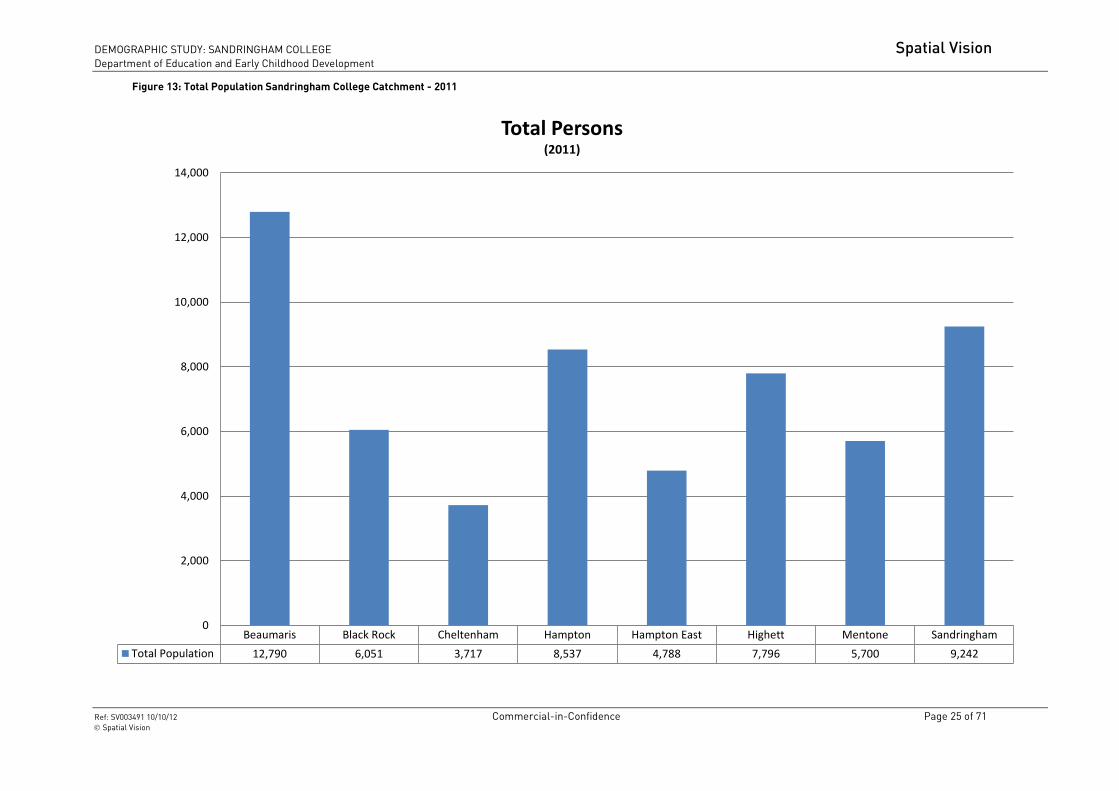
Figure 13: Total Population Sandringham College Catchment - 2011
Beaumaris Black Rock Cheltenham Hampton Hampton East Highett Mentone Sandringham
Total Population 12,790 6,051 3,717 8,537 4,788 7,796 5,700 9,242
0
2,000
4,000
6,000
8,000
10,000
12,000
14,000
Total Persons(2011)

DEMOGRAPHIC STUDY: SANDRINGHAM COLLEGE Spatial Vision
Department of Education and Early Childhood Development
Ref: SV003491 10/10/12 Commercial-in-Confidence Page 26 of 71 Spatial Vision
Figure 14: Population Age Cohorts - Sandringham College Catchment - 2011
Beaumaris Black Rock Cheltenham Hampton Hampton East Highett Mentone Sandringham
0-4 years 676 309 232 556 375 641 239 600
5-14 years 1,834 770 396 1,333 562 969 558 1,245
15-19 years 909 334 221 524 240 384 339 539
20-24 years 678 295 236 450 228 392 335 446
25-34 years 698 432 440 646 642 892 742 660
35-44 years 1,793 798 594 1,356 820 1,469 841 1,441
45-54 years 2,111 963 529 1,401 680 1,061 807 1,398
55-64 years 1,729 890 451 1,012 496 803 700 1,157
65-74 years 1,131 578 293 645 367 511 556 737
75-84 years 862 439 227 415 258 394 358 514
85 years and over 370 238 97 197 121 283 224 502
0
500
1,000
1,500
2,000
2,500
Population CohortsTotal Persons (2011)
The population age cohort distribution appears relatively consistent across each of the small areas in the detailed study area. Hence, there are no significant variations identifiable across the small areas from the general population distribution.
DEMOGRAPHIC STUDY: SANDRINGHAM COLLEGE Spatial Vision
Department of Education and Early Childhood Development
Ref: SV003491 10/10/12 Commercial-in-Confidence Page 27 of 71 Spatial Vision
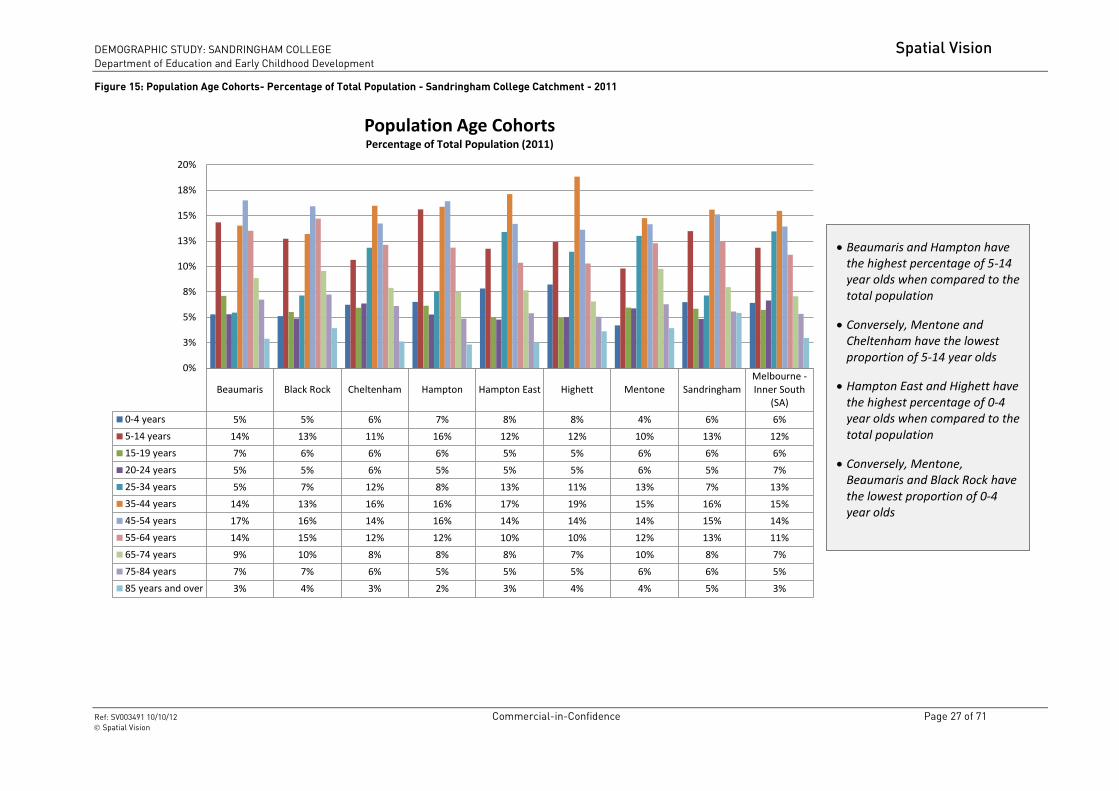
Figure 15: Population Age Cohorts- Percentage of Total Population - Sandringham College Catchment - 2011
Beaumaris Black Rock Cheltenham Hampton Hampton East Highett Mentone SandringhamMelbourne -Inner South
(SA)
0-4 years 5% 5% 6% 7% 8% 8% 4% 6% 6%
5-14 years 14% 13% 11% 16% 12% 12% 10% 13% 12%
15-19 years 7% 6% 6% 6% 5% 5% 6% 6% 6%
20-24 years 5% 5% 6% 5% 5% 5% 6% 5% 7%
25-34 years 5% 7% 12% 8% 13% 11% 13% 7% 13%
35-44 years 14% 13% 16% 16% 17% 19% 15% 16% 15%
45-54 years 17% 16% 14% 16% 14% 14% 14% 15% 14%
55-64 years 14% 15% 12% 12% 10% 10% 12% 13% 11%
65-74 years 9% 10% 8% 8% 8% 7% 10% 8% 7%
75-84 years 7% 7% 6% 5% 5% 5% 6% 6% 5%
85 years and over 3% 4% 3% 2% 3% 4% 4% 5% 3%
0%
3%
5%
8%
10%
13%
15%
18%
20%
Population Age CohortsPercentage of Total Population (2011)
Beaumaris and Hampton have the highest percentage of 5-14 year olds when compared to the total population
Conversely, Mentone and Cheltenham have the lowest proportion of 5-14 year olds
Hampton East and Highett have the highest percentage of 0-4 year olds when compared to the total population
Conversely, Mentone, Beaumaris and Black Rock have the lowest proportion of 0-4 year olds

DEMOGRAPHIC STUDY: SANDRINGHAM COLLEGE Spatial Vision
Department of Education and Early Childhood Development
Ref: SV003491 10/10/12 Commercial-in-Confidence Page 28 of 71 Spatial Vision
Figure 16: School Age Population Cohorts- Percentage of Total Population - Sandringham College Catchment - 2011
0-4 years 5-14 years 15-19 years 20-24 years
Beaumaris 5% 14% 7% 5%
Black Rock 5% 13% 6% 5%
Cheltenham 6% 11% 6% 6%
Hampton 7% 16% 6% 5%
Hampton East 8% 12% 5% 5%
Highett 8% 12% 5% 5%
Mentone 4% 10% 6% 6%
Sandringham 6% 13% 6% 5%
Melbourne - Inner South (SA) 6% 12% 6% 7%
Victoria 6% 12% 7% 7%
0%
3%
5%
8%
10%
13%
15%
18%
20%
School Age Population CohortsPercentage of Total Population (2011)
Compared to the Melbourne – Inner South and the State, Hampton East and Highett have a higher percentage of 0-4 year olds when compared to the total population. Conversely, Beaumaris, Black Rock and Mentone are lower.
Compared to the Melbourne – Inner South and the State, Beaumaris, Hampton and Sandringham have a higher percentage of 5-14 year olds when compared to the total population. Conversely, Cheltenham and Mentone are lower.
DEMOGRAPHIC STUDY: SANDRINGHAM COLLEGE Spatial Vision
Department of Education and Early Childhood Development
Ref: SV003491 10/10/12 Commercial-in-Confidence Page 29 of 71 Spatial Vision
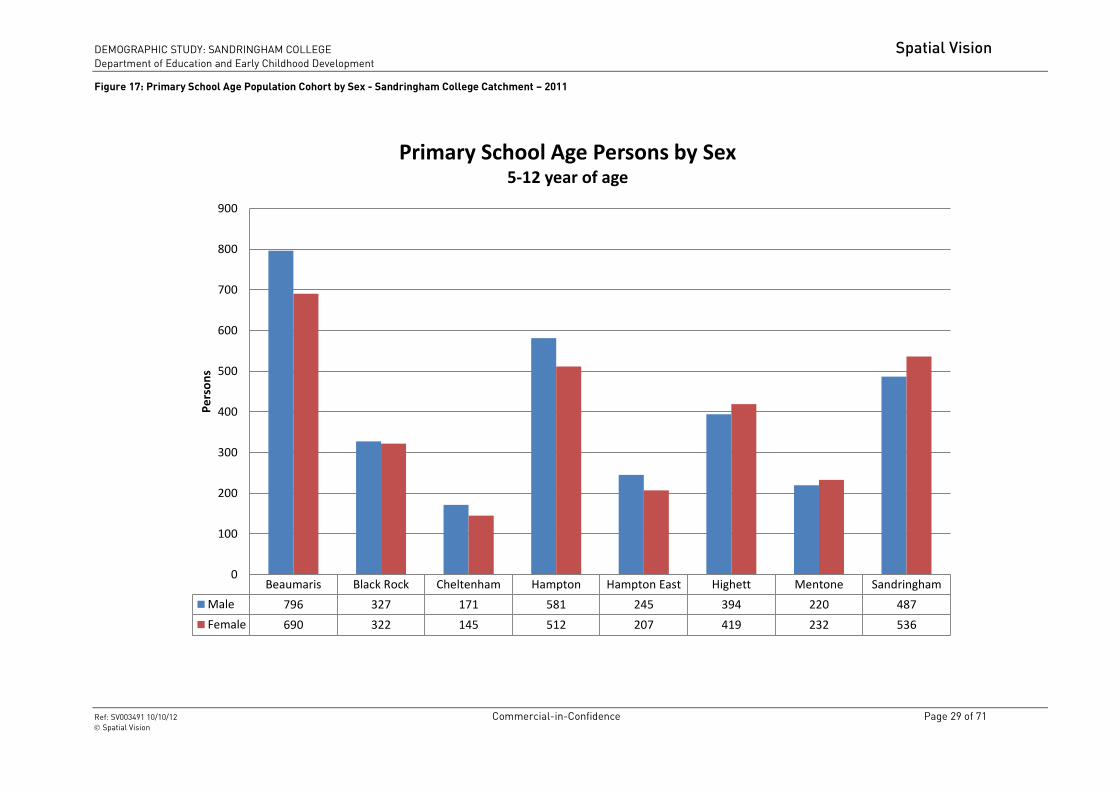
Figure 17: Primary School Age Population Cohort by Sex - Sandringham College Catchment – 2011
Beaumaris Black Rock Cheltenham Hampton Hampton East Highett Mentone Sandringham
Male 796 327 171 581 245 394 220 487
Female 690 322 145 512 207 419 232 536
0
100
200
300
400
500
600
700
800
900P
ers
on
s
Primary School Age Persons by Sex5-12 year of age

DEMOGRAPHIC STUDY: SANDRINGHAM COLLEGE Spatial Vision
Department of Education and Early Childhood Development
Ref: SV003491 10/10/12 Commercial-in-Confidence Page 30 of 71 Spatial Vision
Figure 18: Secondary School Age Population Cohort by Sex - Sandringham College Catchment – 2011
Beaumaris Black Rock Cheltenham Hampton Hampton East Highett Mentone Sandringham
Male 639 245 152 395 188 288 206 395
Female 618 217 148 397 165 287 219 382
0
100
200
300
400
500
600
700P
ers
on
s
Secondary School Age Persons by Sex12-18 year of age

DEMOGRAPHIC STUDY: SANDRINGHAM COLLEGE Spatial Vision
Department of Education and Early Childhood Development
Ref: SV003491 10/10/12 Commercial-in-Confidence Page 31 of 71 Spatial Vision
3.2 Sandringham College Catchment – Household Demographics

DEMOGRAPHIC STUDY: SANDRINGHAM COLLEGE Spatial Vision
Department of Education and Early Childhood Development
Ref: SV003491 10/10/12 Commercial-in-Confidence Page 32 of 71 Spatial Vision
Figure 19: Family Composition - Sandringham College Catchment - 2011
Couple family with nochildren
Couple family with childrenunder 15
One parent family withchildren under 15
Other family Total Families
Beaumaris 1,289 1,218 98 1,008 3,613
Black Rock 712 512 66 394 1,683
Cheltenham 399 299 49 253 1,000
Hampton 717 855 122 550 2,244
Hampton East 403 413 120 336 1,273
Highett 679 754 134 531 2,098
Mentone 634 381 70 412 1,498
Sandringham 823 885 118 562 2,388
0
500
1,000
1,500
2,000
2,500
3,000
3,500
4,000
Family CompositionNumber of Families (2011)

DEMOGRAPHIC STUDY: SANDRINGHAM COLLEGE Spatial Vision
Department of Education and Early Childhood Development
Ref: SV003491 10/10/12 Commercial-in-Confidence Page 33 of 71 Spatial Vision
Figure 20: Family Composition by Percentage of Total Families - Sandringham College Catchment - 2011
0%
5%
10%
15%
20%
25%
30%
35%
40%
45%
Couple family with no children Couple family with children under 15 One parent family with children under15
Other family
Family CompositionPercentage of Total Families (2011)
Beaumaris Black Rock Cheltenham Hampton Hampton East Highett Mentone Sandringham Melbourne - Inner South (SA)
Black Rock, Cheltenham and Mentone have the highest percentage of couple families with no children under 15. Conversely, they have the lowest percentage of couple families with children under 15.
The percentage on single parent families with a child under 15 is significantly higher in Hampton East than the remaining small areas in the detailed study area.

DEMOGRAPHIC STUDY: SANDRINGHAM COLLEGE Spatial Vision
Department of Education and Early Childhood Development
Ref: SV003491 10/10/12 Commercial-in-Confidence Page 34 of 71 Spatial Vision
Figure 21: Language Spoken at Home – English and Non English Speaking - Sandringham College Catchment - 2011
Beaumaris Black Rock Cheltenham HamptonHampton
EastHighett Mentone Sandringham
Melbourne -Inner South
(SA)
Also speaks languageother than English
1,378 894 645 1,478 1,334 1,646 1,034 1,180 88,206
Speaks English only 11,415 5,162 3,070 7,062 3,449 6,146 4,675 8,058 231,433
0%
10%
20%
30%
40%
50%
60%
70%
80%
90%
100%
Axi
s Ti
tle
Language Spoken at HomePercentage of total Population (2011)
Hampton East has the highest percentage of person who speaks another language other than English at home.
Significantly, with the exception of Hampton East, all small areas have a lower percentage of persons who also speak a language other than English at home than Melbourne Inner South Statistical Area.

DEMOGRAPHIC STUDY: SANDRINGHAM COLLEGE Spatial Vision
Department of Education and Early Childhood Development
Ref: SV003491 10/10/12 Commercial-in-Confidence Page 35 of 71 Spatial Vision
Figure 22: Language Spoken at Home - Language Distribution of Non English Speakers - Sandringham College Catchment - 2011
Beaumaris Black Rock Cheltenham Hampton Hampton East Highett Mentone SandringhamMelbourne -Inner South
(SA)
Other 48% 63% 63% 55% 53% 56% 53% 52% 53%
French 3% 4% 2% 5% 2% 3% 2% 5% 2%
German 11% 4% 7% 5% 4% 1% 3% 7% 2%
Russian 4% 4% 4% 6% 12% 6% 5% 6% 8%
Japanese 3% 3% 2% 2% 2% 2% 3% 3% 1%
Greek 14% 11% 9% 10% 14% 18% 13% 12% 15%
Italian 8% 7% 4% 10% 5% 7% 9% 10% 6%
Mandarin 7% 4% 8% 5% 7% 4% 10% 2% 9%
Cantonese 3% 1% 2% 2% 2% 4% 2% 2% 4%
0%
10%
20%
30%
40%
50%
60%
70%
80%
90%
100%
Non English Speakers at HomeLanguage Distribution of Non English Speakers (2011)
Greek is the most widely spoken language at home other than English across all small areas.
Hampton East has a high percentage of Russian language speakers when compared to the other small areas.
Beaumaris has a high percentage of German language speakers when compared to the other small areas.
Mandarin is more widely spoken at home in Mentone compared to the other small areas.
With the exception of Mentone, all small areas have a lower percentage of Mandarin speakers when compared to the Melbourne Inner South Statistical Area

DEMOGRAPHIC STUDY: SANDRINGHAM COLLEGE Spatial Vision
Department of Education and Early Childhood Development
Ref: SV003491 10/10/12 Commercial-in-Confidence Page 36 of 71 Spatial Vision
3.3 Sandringham College Catchment – School Age Population

DEMOGRAPHIC STUDY: SANDRINGHAM COLLEGE Spatial Vision
Department of Education and Early Childhood Development
Ref: SV003491 10/10/12 Commercial-in-Confidence Page 37 of 71 Spatial Vision
Figure 23: Pre-school Age Population (0-4) - Sandringham College Catchment - 2011
Beaumaris Black Rock Cheltenham Hampton Hampton East Highett Mentone Sandringham
0 121 53 42 85 62 127 57 106
1 126 58 57 102 89 131 57 111
2 130 62 48 129 70 124 38 110
3 127 76 48 128 68 134 46 130
4 156 62 42 103 80 128 53 149
0
20
40
60
80
100
120
140
160
180
Pe
rso
sns
Persons 0-4 Years of Age(2011)
DEMOGRAPHIC STUDY: SANDRINGHAM COLLEGE Spatial Vision
Department of Education and Early Childhood Development
Ref: SV003491 10/10/12 Commercial-in-Confidence Page 38 of 71 Spatial Vision
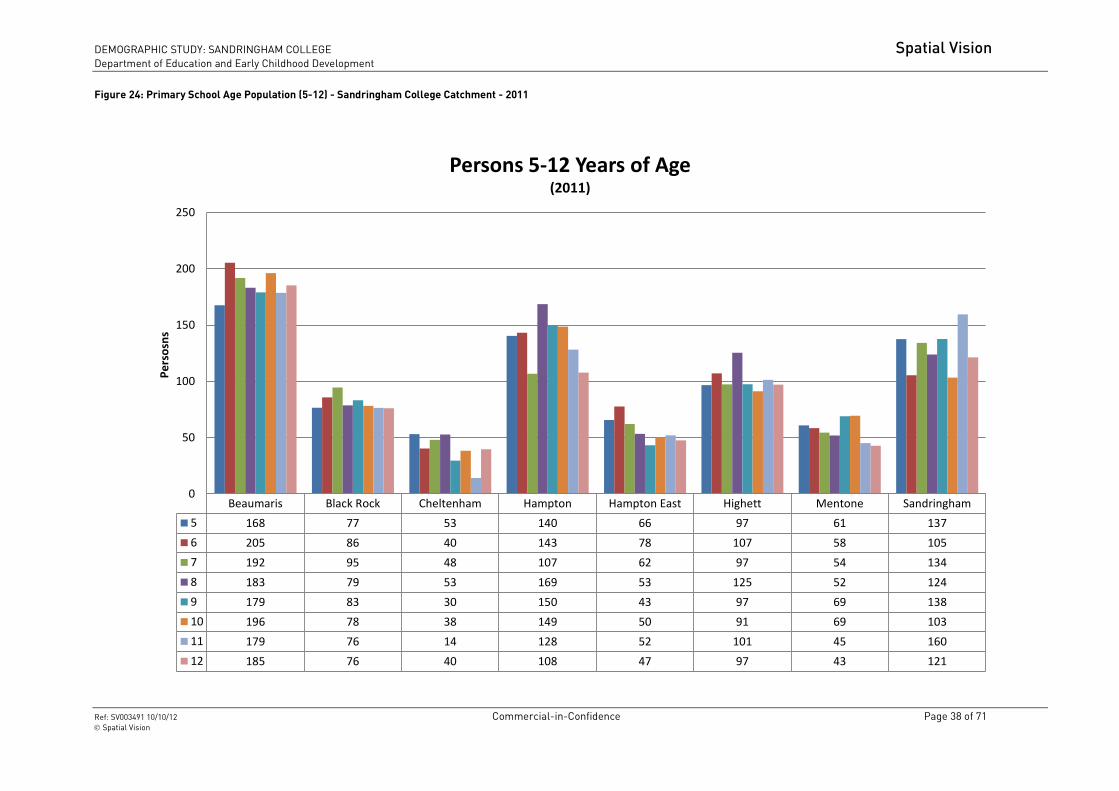
Figure 24: Primary School Age Population (5-12) - Sandringham College Catchment - 2011
Beaumaris Black Rock Cheltenham Hampton Hampton East Highett Mentone Sandringham
5 168 77 53 140 66 97 61 137
6 205 86 40 143 78 107 58 105
7 192 95 48 107 62 97 54 134
8 183 79 53 169 53 125 52 124
9 179 83 30 150 43 97 69 138
10 196 78 38 149 50 91 69 103
11 179 76 14 128 52 101 45 160
12 185 76 40 108 47 97 43 121
0
50
100
150
200
250
Pe
rso
snsPersons 5-12 Years of Age
(2011)

DEMOGRAPHIC STUDY: SANDRINGHAM COLLEGE Spatial Vision
Department of Education and Early Childhood Development
Ref: SV003491 10/10/12 Commercial-in-Confidence Page 39 of 71 Spatial Vision
Figure 25: Secondary School Age Population (12-18) - Sandringham College Catchment - 2011
Beaumaris Black Rock Cheltenham Hampton Hampton East Highett Mentone Sandringham
12 185 76 40 108 47 97 43 121
13 162 55 36 127 46 80 58 117
14 178 71 39 118 67 75 60 123
15 158 50 48 115 47 82 67 104
16 202 73 48 126 54 72 62 88
17 194 78 36 101 48 99 64 120
18 178 60 54 96 43 67 71 104
0
50
100
150
200
250
Pe
rso
snsPersons 12-18 Years of Age
(2011)
DEMOGRAPHIC STUDY: SANDRINGHAM COLLEGE Spatial Vision
Department of Education and Early Childhood Development
Ref: SV003491 10/10/12 Commercial-in-Confidence Page 40 of 71 Spatial Vision
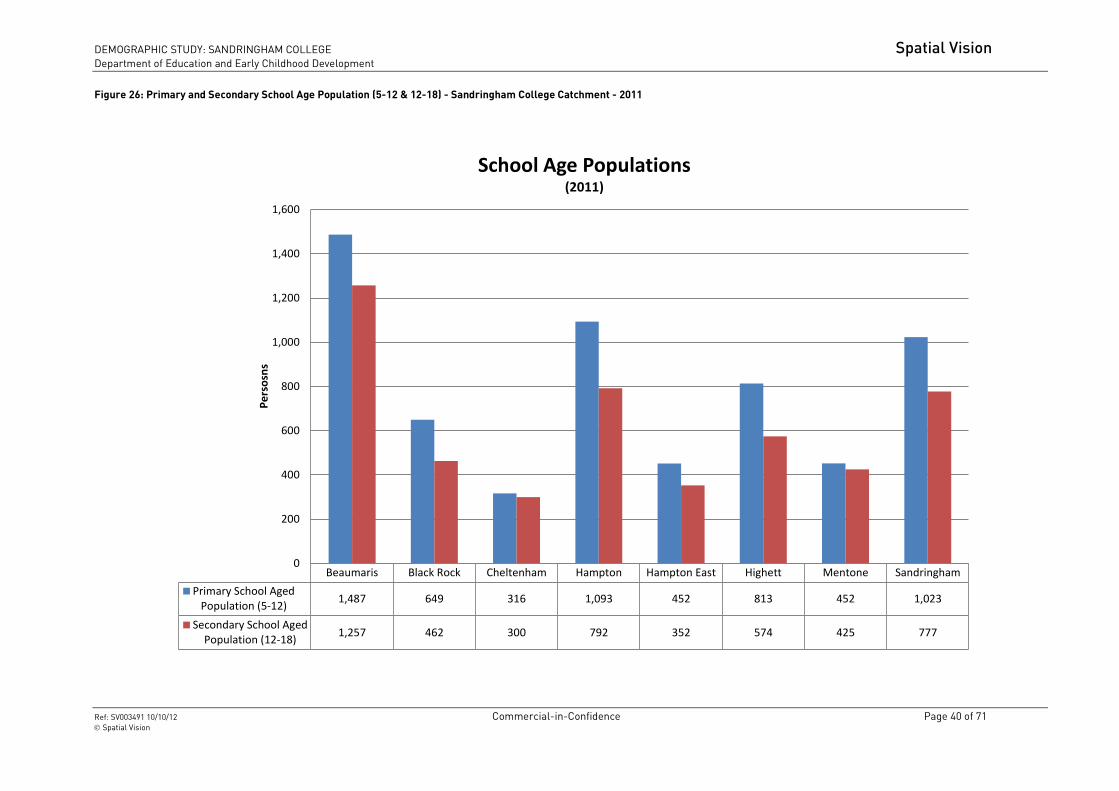
Figure 26: Primary and Secondary School Age Population (5-12 & 12-18) - Sandringham College Catchment - 2011
Beaumaris Black Rock Cheltenham Hampton Hampton East Highett Mentone Sandringham
Primary School AgedPopulation (5-12)
1,487 649 316 1,093 452 813 452 1,023
Secondary School AgedPopulation (12-18)
1,257 462 300 792 352 574 425 777
0
200
400
600
800
1,000
1,200
1,400
1,600
Pe
rso
sns
School Age Populations(2011)

DEMOGRAPHIC STUDY: SANDRINGHAM COLLEGE Spatial Vision
Department of Education and Early Childhood Development
Ref: SV003491 10/10/12 Commercial-in-Confidence Page 41 of 71 Spatial Vision
Figure 27: Historical School Age Population Change - Sandringham College Catchment – (2001-2011)
0 1 2 3 4 5 6 7 8 9 10 11 12 13 14 15 16 17 18
2001 593 633 657 636 688 659 712 696 707 707 696 720 709 711 715 680 714 645 643
2006 725 648 734 702 744 749 688 706 662 744 714 620 733 705 659 732 750 693 722
2011 653 730 712 757 772 798 824 838 789 788 776 755 718 681 731 672 725 741 673
0
100
200
300
400
500
600
700
800
900
Pe
rso
ns
Historical School Age Population
The School Age population has increased across the majority of ages since 2001, with the most significant increases occurring below the age of 11

DEMOGRAPHIC STUDY: SANDRINGHAM COLLEGE Spatial Vision
Department of Education and Early Childhood Development
Ref: SV003491 10/10/12 Commercial-in-Confidence Page 42 of 71 Spatial Vision
Figure 28: Primary and Secondary School Age Population – Percentage of Total Population- Sandringham College Catchment - 2011
Primary School AgedPopulation (5-12)
Secondary School AgedPopulation (12-18)
Beaumaris 11.6% 9.8%
Black Rock 10.7% 7.6%
Cheltenham 8.5% 8.1%
Hampton 12.8% 9.3%
Hampton East 9.4% 7.4%
Highett 10.4% 7.4%
Mentone 7.9% 7.5%
Sandringham 11.1% 8.4%
Melbourne - Inner South (SA) 9.6% 8.0%
Victoria 9.7% 8.9%
0.0%
2.0%
4.0%
6.0%
8.0%
10.0%
12.0%
14.0%
Pe
rce
nta
ge o
f To
tal P
op
ula
tio
n
School Age Population - Percentage of Total Population(2011)
The percentage of the total population 5-12 years of age is more variable than that of the 12-18 year age cohort across the small areas in the detailed study area.
Hampton has the highest percentage of 5-12 year olds when compared to the total population and Mentone the lowest.
Only Beaumaris and Hampton have a higher percentage of 12-18 year olds when to the State figure.
Cheltenham and Mentone are consistently lower when compared to the State figure.

DEMOGRAPHIC STUDY: SANDRINGHAM COLLEGE Spatial Vision
Department of Education and Early Childhood Development
Ref: SV003491 10/10/12 Commercial-in-Confidence Page 43 of 71 Spatial Vision
3.4 Sandringham College Catchment – Education
Attendance and Student Yield Rates

DEMOGRAPHIC STUDY: SANDRINGHAM COLLEGE Spatial Vision
Department of Education and Early Childhood Development
Ref: SV003491 10/10/12 Commercial-in-Confidence Page 44 of 71 Spatial Vision
ABS Census - Education Attendance and Student Yield Rates
In this study, the term student yield rate is presented. Student yield rates represent
the number of school aged persons that attend an education institution type, as a
proportion of the total number of school aged attendees. Institution attendance
data, for the study area of interest, is sourced from historic Census data sets
published by the ABS (e.g. 2001, 2006 and 2011). The student yield rates derived
from this data are used to determine the forecast number of school aged persons
that attend an education institution type.
Prior research has revealed that the published ABS Census education attendance
data for primary and secondary schools include a significant “not stated” response.
This leads to an equally significant understatement of the numbers attending
primary and secondary schools.
To overcome this issue (and allow further analysis of school attendance), it is
necessary to reallocate the “non-stated” components of this data. This has been
achieved via a pro rata apportionment process. In other words, the “non-stated”
persons have been reclassified in accordance with the share of each type of
educational institution.
An analysis of the results of this apportionment process against actual 20061 DEECD
recorded enrolments reveals a very close alignment. This process is therefore
considered an approximate solution to the “not-stated” issue.
The results for the State of Victoria, following this adjustment, are presented in
Figure 29. The following observations have been made regarding ABS Census school
attendance data:
Not all 5 to 12 year olds attend a primary school
At the time of the census, some 5 year olds have yet to enrol at a school
A small number of children commence secondary school before they turn
12 years of age.
Many children remain in primary school during the year they turn 12 years
of age.
A small number of children transition to a secondary school well after they
turn 12 years of age.
1 Due to 2011 data not being available, 2006 adjustment factors are used in this study
Students begin leaving secondary school from about 16 years of age.
A small number of students remain in secondary school well after they
turn 18 years of age.
A small percentage either does not attend school at all or attends
another form of institution, particularly during secondary school years.
This is reflected in the gap between those attending primary/secondary
schools and the total school age population shown in Figure 29
Figure 29: Victoria - Victorian and Primary and Secondary School Attendance by Age (2006)
0
10,000
20,000
30,000
40,000
50,000
60,000
70,000
80,000
4 5 6 7 8 9 10 11 12 13 14 15 16 17 18 19 20
Total Persons
Infants/Primary-Total
Secondary-Total
DEMOGRAPHIC STUDY: SANDRINGHAM COLLEGE Spatial Vision
Department of Education and Early Childhood Development
Ref: SV003491 10/10/12 Commercial-in-Confidence Page 45 of 71 Spatial Vision
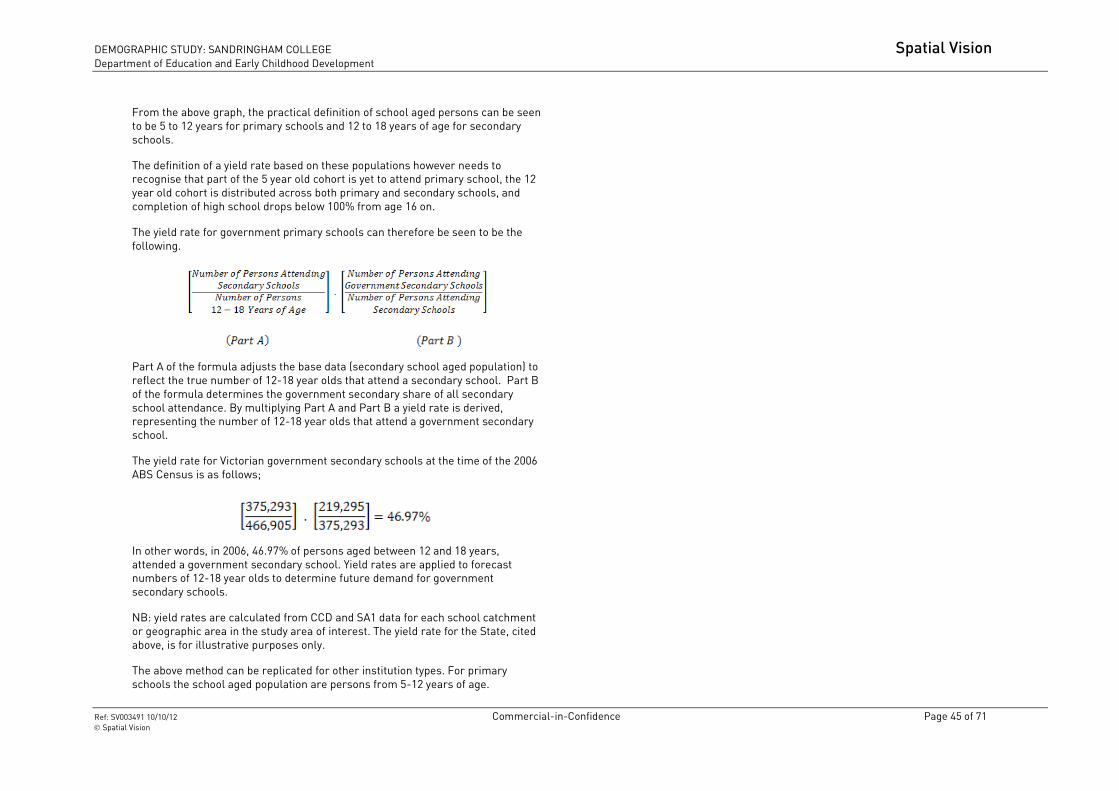
From the above graph, the practical definition of school aged persons can be seen
to be 5 to 12 years for primary schools and 12 to 18 years of age for secondary
schools.
The definition of a yield rate based on these populations however needs to
recognise that part of the 5 year old cohort is yet to attend primary school, the 12
year old cohort is distributed across both primary and secondary schools, and
completion of high school drops below 100% from age 16 on.
The yield rate for government primary schools can therefore be seen to be the
following.
Part A of the formula adjusts the base data (secondary school aged population) to
reflect the true number of 12-18 year olds that attend a secondary school. Part B
of the formula determines the government secondary share of all secondary
school attendance. By multiplying Part A and Part B a yield rate is derived,
representing the number of 12-18 year olds that attend a government secondary
school.
The yield rate for Victorian government secondary schools at the time of the 2006
ABS Census is as follows;
In other words, in 2006, 46.97% of persons aged between 12 and 18 years,
attended a government secondary school. Yield rates are applied to forecast
numbers of 12-18 year olds to determine future demand for government
secondary schools.
NB: yield rates are calculated from CCD and SA1 data for each school catchment
or geographic area in the study area of interest. The yield rate for the State, cited
above, is for illustrative purposes only.
The above method can be replicated for other institution types. For primary
schools the school aged population are persons from 5-12 years of age.

DEMOGRAPHIC STUDY: SANDRINGHAM COLLEGE Spatial Vision
Department of Education and Early Childhood Development
Ref: SV003491 10/10/12 Commercial-in-Confidence Page 46 of 71 Spatial Vision
Figure 30: Pre School and Primary School Attendance - Sandringham College Catchment – 2011
Beaumaris Black Rock Cheltenham Hampton Hampton East Highett Mentone Sandringham
Pre-school 291 128 86 222 122 220 104 240
Primary Government 807 378 217 611 256 495 216 536
Primary Catholic 333 109 64 242 105 173 101 207
Primary OtherNon Government
303 95 23 186 52 66 78 220
Primary Total 1,443 583 304 1,039 412 735 394 964
0
200
400
600
800
1,000
1,200
1,400
1,600
Pe
rso
ns
Pre-School and Primary School Attendance by Institution Type(2011)
DEMOGRAPHIC STUDY: SANDRINGHAM COLLEGE Spatial Vision
Department of Education and Early Childhood Development
Ref: SV003491 10/10/12 Commercial-in-Confidence Page 47 of 71 Spatial Vision
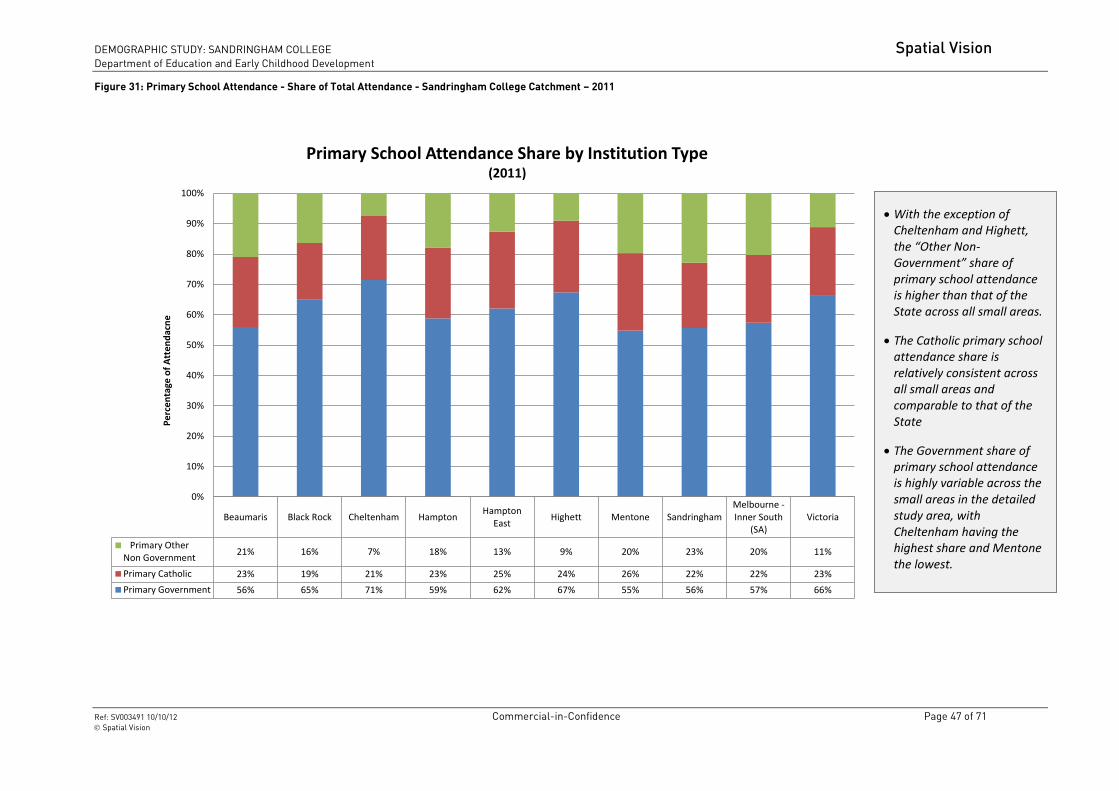
Figure 31: Primary School Attendance - Share of Total Attendance - Sandringham College Catchment – 2011
Beaumaris Black Rock Cheltenham HamptonHampton
EastHighett Mentone Sandringham
Melbourne -Inner South
(SA)Victoria
Primary OtherNon Government
21% 16% 7% 18% 13% 9% 20% 23% 20% 11%
Primary Catholic 23% 19% 21% 23% 25% 24% 26% 22% 22% 23%
Primary Government 56% 65% 71% 59% 62% 67% 55% 56% 57% 66%
0%
10%
20%
30%
40%
50%
60%
70%
80%
90%
100%
Pe
rce
nta
ge o
f A
tte
nd
acn
ePrimary School Attendance Share by Institution Type
(2011)
With the exception of Cheltenham and Highett, the “Other Non-Government” share of primary school attendance is higher than that of the State across all small areas.
The Catholic primary school attendance share is relatively consistent across all small areas and comparable to that of the State
The Government share of primary school attendance is highly variable across the small areas in the detailed study area, with Cheltenham having the highest share and Mentone the lowest.

DEMOGRAPHIC STUDY: SANDRINGHAM COLLEGE Spatial Vision
Department of Education and Early Childhood Development
Ref: SV003491 10/10/12 Commercial-in-Confidence Page 48 of 71 Spatial Vision
Figure 32: Secondary School Attendance - Sandringham College Catchment – 2011
Beaumaris Black Rock Cheltenham Hampton Hampton East Highett Mentone Sandringham
Secondary Government 360 110 110 178 147 288 138 200
Secondary Catholic 183 75 66 134 67 112 85 152
Secondary OtherNon Government
564 220 57 376 84 97 133 349
Secondary Total 1,108 406 234 690 297 497 357 702
0
200
400
600
800
1,000
1,200
Pe
rso
ns
Secondary School Attendance by Institution Type(2011)

DEMOGRAPHIC STUDY: SANDRINGHAM COLLEGE Spatial Vision
Department of Education and Early Childhood Development
Ref: SV003491 10/10/12 Commercial-in-Confidence Page 49 of 71 Spatial Vision
Figure 33: Secondary School Attendance – Share of Total Attendance - Sandringham College Catchment – 2011
Beaumaris Black Rock Cheltenham HamptonHampton
EastHighett Mentone Sandringham
Melbourne -Inner South
(SA)Victoria
Secondary OtherNon Government
51% 54% 24% 55% 28% 19% 37% 50% 39% 20%
Secondary Catholic 16% 18% 28% 19% 22% 23% 24% 22% 24% 24%
Secondary Government 33% 27% 47% 26% 49% 58% 39% 29% 38% 56%
0%
10%
20%
30%
40%
50%
60%
70%
80%
90%
100%P
erc
en
tage
of
Att
en
dac
ne
Secondary School Attendance Share by Institution Type(2011)
With the exception of Cheltenham and Highett, the “Other Non-Government” share of secondary school attendance is significantly higher than that of the State across all small areas.
The Catholic secondary school attendance share is relatively consistent across all small areas and generally lower when compared to the State
The Government share of secondary school attendance is highly variable and general lower than that of the State across the small areas in the detailed study area, with Highett the only region with a share higher than the State.

DEMOGRAPHIC STUDY: SANDRINGHAM COLLEGE Spatial Vision
Department of Education and Early Childhood Development
Ref: SV003491 10/10/12 Commercial-in-Confidence Page 50 of 71 Spatial Vision
Figure 34: Government Primary School Yield Rate - Sandringham College Catchment – 2011
Beaumaris Black Rock Cheltenham Hampton Hampton East Highett Mentone Sandringham
Primary School AgedPopulation (5-12)
1,487 649 316 1,093 452 813 452 1,023
Government PrimaryAttendance
807 378 217 611 256 495 216 536
Government Yield Rate 54.27% 58.27% 68.80% 55.88% 56.64% 60.85% 47.77% 52.37%
0
200
400
600
800
1,000
1,200
1,400
1,600
Pe
rso
sns
Government Primary School Yield Rate(2011)
Cheltenham and Highett have the highest percentage (yield rate) of 5-12 year olds attending government primary school with Mentone having the lowest percentage.
When compared to the yield rate of the State (i.e. 58.62%), only Cheltenham and Highett have a higher yield.

DEMOGRAPHIC STUDY: SANDRINGHAM COLLEGE Spatial Vision
Department of Education and Early Childhood Development
Ref: SV003491 10/10/12 Commercial-in-Confidence Page 51 of 71 Spatial Vision
Figure 35: Government Secondary School Yield Rate - Sandringham College Catchment – 2011
Beaumaris Black Rock Cheltenham Hampton Hampton East Highett Mentone Sandringham
Secondary School AgedPopulation (12-18)
1,257 462 300 792 352 574 425 777
Government SecondaryAttendance
360 110 110 178 147 288 138 200
Government Yield Rate 28.67% 23.89% 36.76% 22.49% 41.69% 50.08% 32.41% 25.77%
0
200
400
600
800
1,000
1,200
1,400
Pe
rso
sns
Government Secondary School Yield Rate(2011)
Cheltenham and Highett and Hampton East have the highest percentage (yield rate) of 12-18 year olds attending Government secondary schools with Hampton having the lowest percentage.
When compared to the yield rate of the State (i.e. 46.19%), only Highett has a higher yield.
With the exception of Highett, all small areas generally have a significantly lower yield than the State.

DEMOGRAPHIC STUDY: SANDRINGHAM COLLEGE Spatial Vision
Department of Education and Early Childhood Development
Ref: SV003491 10/10/12 Commercial-in-Confidence Page 52 of 71 Spatial Vision
Figure 36: Historical Primary School Yield Rate s- Sandringham College Catchment – 2001 - 2011
Beaumaris Black Rock Cheltenham Hampton Hampton East Highett Mentone Sandringham
2001 56.42% 51.61% 62.89% 52.52% 53.72% 61.35% 53.74% 54.51%
2006 54.15% 48.64% 58.92% 52.75% 55.89% 64.07% 49.16% 52.28%
2011 54.27% 58.27% 68.80% 55.88% 56.64% 60.85% 47.77% 52.37%
0.00%
10.00%
20.00%
30.00%
40.00%
50.00%
60.00%
70.00%
80.00%
Yie
ldHistorical Primary School Yield Rates
Government Primary School
With the exception of Mentone and Highett, the student yield rate has increased across all small areas from 2006-2011

DEMOGRAPHIC STUDY: SANDRINGHAM COLLEGE Spatial Vision
Department of Education and Early Childhood Development
Ref: SV003491 10/10/12 Commercial-in-Confidence Page 53 of 71 Spatial Vision
Figure 37: Historical Secondary School Yield Rates - Sandringham College Catchment – 2001 - 2011
Beaumaris Black Rock Cheltenham Hampton Hampton East Highett Mentone Sandringham
2001 31.82% 22.46% 40.12% 26.74% 44.28% 55.24% 34.56% 25.29%
2006 31.02% 27.11% 51.07% 21.59% 53.42% 56.70% 41.38% 24.03%
2011 28.67% 23.89% 36.76% 22.49% 41.69% 50.08% 32.41% 25.77%
0.00%
10.00%
20.00%
30.00%
40.00%
50.00%
60.00%
Yie
ldHistorical Secondary School Yield Rates
Government Secondary Schools
Significant variations are evident in the historical student yield rate for Government secondary schools

DEMOGRAPHIC STUDY: SANDRINGHAM COLLEGE Spatial Vision
Department of Education and Early Childhood Development
Ref: SV003491 10/10/12 Commercial-in-Confidence Page 54 of 71 Spatial Vision
Figure 38: Historical School Yield Rate - Sandringham College Catchment – 2011
Primary Secondary
2001 55.57% 33.28%
2006 54.29% 34.35%
2011 55.94% 31.00%
0.00%
10.00%
20.00%
30.00%
40.00%
50.00%
60.00%
Yie
ld R
ate
Historical Government Student Yield Rates
The Government primary school yield rate slightly increased from 2001-2011
The Government secondary school yield rate decreased from 2001-2011
The Government secondary school yield rate decreased by 3.35% from 2006-2011
DEMOGRAPHIC STUDY: SANDRINGHAM COLLEGE Spatial Vision
Department of Education and Early Childhood Development
Ref: SV003491 10/10/12 Commercial-in-Confidence Page 55 of 71 Spatial Vision
3.1 Sandringham College Catchment – Projections
2011-2026

DEMOGRAPHIC STUDY: SANDRINGHAM COLLEGE Spatial Vision
Department of Education and Early Childhood Development
Ref: SV003491 10/10/12 Commercial-in-Confidence Page 56 of 71 Spatial Vision
Figure 39: Total Population Forecasts - Sandringham College Catchment – 2011-2026
2011 2016 2021 2026
TP 58,620 58,620 61,956 63,086
56,000
57,000
58,000
59,000
60,000
61,000
62,000
63,000
64,000
Pe
rso
ns
Forecast Total Population
From 2011 to 2026 the total population is projected to increase by 7.60% (i.e. 4,467 persons)

DEMOGRAPHIC STUDY: SANDRINGHAM COLLEGE Spatial Vision
Department of Education and Early Childhood Development
Ref: SV003491 10/10/12 Commercial-in-Confidence Page 57 of 71 Spatial Vision
Figure 40: School Age Population Forecasts - Sandringham College Catchment – 2011-2026
0 1 2 3 4 5 6 7 8 9 10 11 12 13 14 15 16 17 18
2011 653 730 712 757 772 798 824 838 789 788 776 755 718 681 731 672 725 741 673
2016 653 730 712 757 772 798 824 838 789 788 776 755 718 681 731 672 725 741 673
2021 689 769 746 793 808 794 817 834 782 785 789 764 730 694 744 702 756 772 702
2026 695 777 753 800 815 808 830 849 795 798 795 769 736 699 750 696 748 765 695
0
100
200
300
400
500
600
700
800
900
Pe
rso
ns
Forecast School Age Population
From 2011 to 2026 the number of persons aged 0-18 years is projected to increase by 3.10% (i.e. 440 persons)

DEMOGRAPHIC STUDY: SANDRINGHAM COLLEGE Spatial Vision
Department of Education and Early Childhood Development
Ref: SV003491 10/10/12 Commercial-in-Confidence Page 58 of 71 Spatial Vision
Figure 41: Primary School Age Population Forecasts - Sandringham College Catchment – 2011-2026
Beaumaris Black Rock Cheltenham HamptonHampton
EastHighett Mentone Sandringham
2011 1,487 649 316 1,093 452 813 452 1,023
2016 1,445 626 320 1,060 442 857 513 1,035
2021 1,425 605 325 1,043 441 904 523 1,030
2026 1,434 604 347 1,052 448 925 534 1,037
0
200
400
600
800
1,000
1,200
1,400
1,600
Pe
rso
ns
Primary School Age Person Forecasts(5-12 years old)
From 2011 to 2026 the number of persons aged 5-12 years is projected to increase by 1.5% (i.e. 95 persons) within the detailed study area

DEMOGRAPHIC STUDY: SANDRINGHAM COLLEGE Spatial Vision
Department of Education and Early Childhood Development
Ref: SV003491 10/10/12 Commercial-in-Confidence Page 59 of 71 Spatial Vision
Figure 42: Secondary School Age Population Forecasts - Sandringham College Catchment – 2011-2026
Beaumaris Black Rock Cheltenham HamptonHampton
EastHighett Mentone Sandringham
2011 1,257 462 300 792 352 574 425 777
2016 1,257 476 312 806 380 599 456 789
2021 1,250 473 336 785 379 617 473 787
2026 1,236 461 333 782 379 619 487 792
0
200
400
600
800
1,000
1,200
1,400
Pe
rso
ns
Secondary School Age Person Forecasts(12-18 years old)
From 2011 to 2026 the number of persons aged 12-18 years is projected to increase by 3.0% (i.e. 149 persons) within the detailed study area
DEMOGRAPHIC STUDY: SANDRINGHAM COLLEGE Spatial Vision
Department of Education and Early Childhood Development
Ref: SV003491 10/10/12 Commercial-in-Confidence Page 60 of 71 Spatial Vision
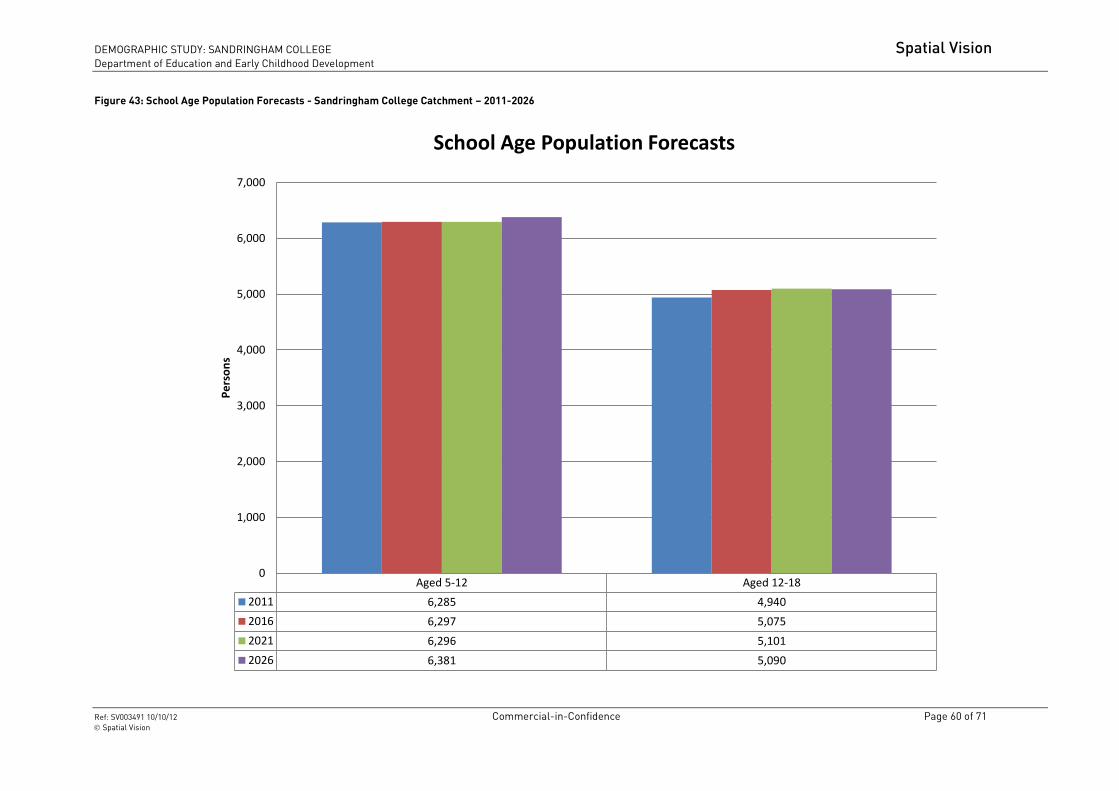
Figure 43: School Age Population Forecasts - Sandringham College Catchment – 2011-2026
Aged 5-12 Aged 12-18
2011 6,285 4,940
2016 6,297 5,075
2021 6,296 5,101
2026 6,381 5,090
0
1,000
2,000
3,000
4,000
5,000
6,000
7,000
Pe
rso
ns
School Age Population Forecasts
DEMOGRAPHIC STUDY: SANDRINGHAM COLLEGE Spatial Vision
Department of Education and Early Childhood Development
Ref: SV003491 10/10/12 Commercial-in-Confidence Page 61 of 71 Spatial Vision
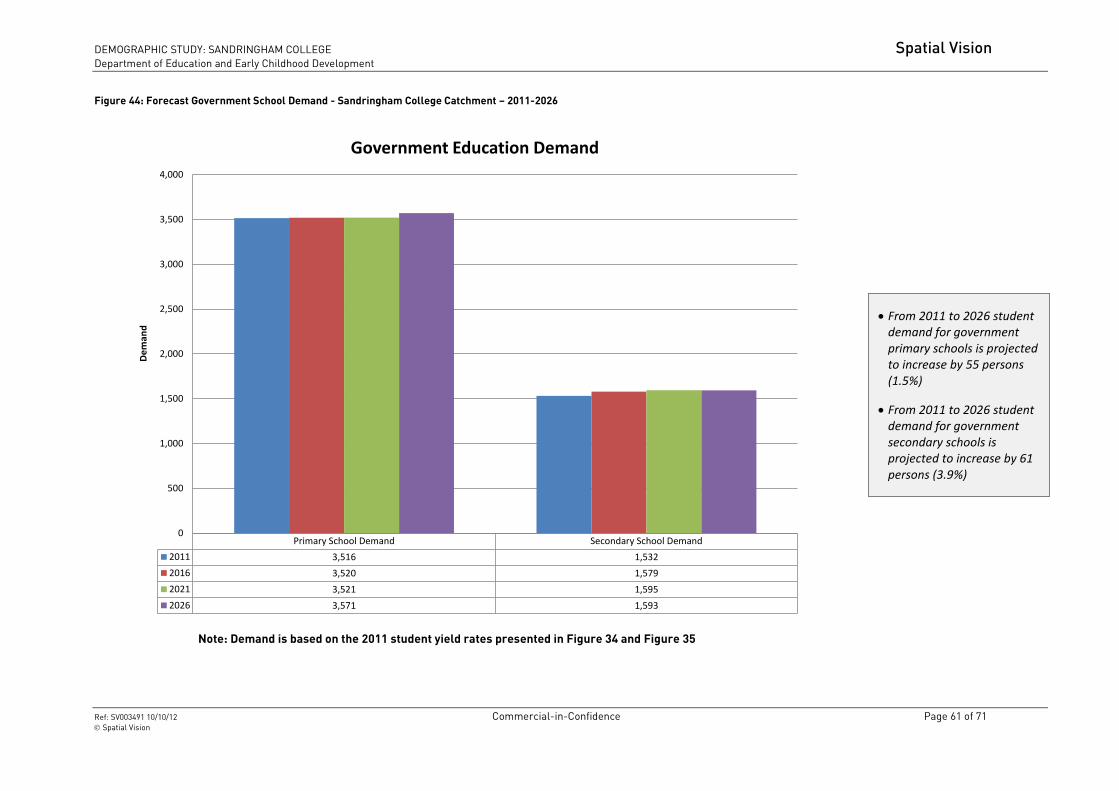
Figure 44: Forecast Government School Demand - Sandringham College Catchment – 2011-2026
Primary School Demand Secondary School Demand
2011 3,516 1,532
2016 3,520 1,579
2021 3,521 1,595
2026 3,571 1,593
0
500
1,000
1,500
2,000
2,500
3,000
3,500
4,000
De
man
dGovernment Education Demand
Note: Demand is based on the 2011 student yield rates presented in Figure 34 and Figure 35
From 2011 to 2026 student demand for government primary schools is projected to increase by 55 persons (1.5%)
From 2011 to 2026 student demand for government secondary schools is projected to increase by 61 persons (3.9%)
DEMOGRAPHIC STUDY: SANDRINGHAM COLLEGE Spatial Vision
Department of Education and Early Childhood Development
Ref: SV003491 10/10/12 Commercial-in-Confidence Page 62 of 71 Spatial Vision
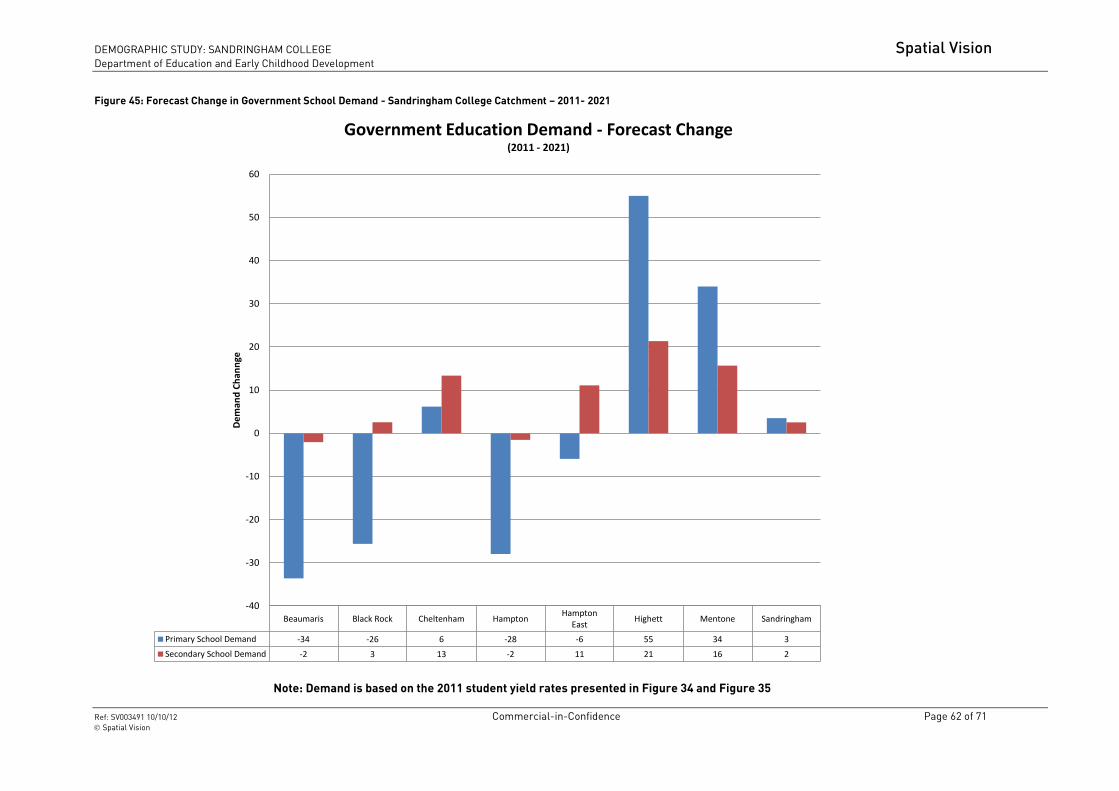
Figure 45: Forecast Change in Government School Demand - Sandringham College Catchment – 2011- 2021
Beaumaris Black Rock Cheltenham HamptonHampton
EastHighett Mentone Sandringham
Primary School Demand -34 -26 6 -28 -6 55 34 3
Secondary School Demand -2 3 13 -2 11 21 16 2
-40
-30
-20
-10
0
10
20
30
40
50
60
De
man
d C
han
nge
Government Education Demand - Forecast Change (2011 - 2021)
Note: Demand is based on the 2011 student yield rates presented in Figure 34 and Figure 35

DEMOGRAPHIC STUDY: SANDRINGHAM COLLEGE Spatial Vision
Department of Education and Early Childhood Development
Ref: SV003491 10/10/12 Commercial-in-Confidence Page 63 of 71 Spatial Vision
4. Yield Rate Scenario Analysis
Section 3.1 presented forecast student demand for the Sandringham College catchment. This forecast
demand was based on yield rates derived from the 2011 ABS Census and are presented in Section 3.4.
This section presents forecast secondary school demand derived using the following three different
yield scenarios:
In the future, student yield rates are 5% higher than that observed at the 2011 ABS
Census
In the future, student yield rates are 10% higher than that observed at the 2011 ABS
Census
In the future, student yield rates will be consistent with the Melbourne Greater Capital
City Statistical Areas2 (e.g. Melbourne Metropolitan Area) as at the 2011 ABS Census
(i.e. 45.21%).
2 As defined by the Australian Bureau of Statistics - Australian Statistical Geography Standard (ASGS)

DEMOGRAPHIC STUDY: SANDRINGHAM COLLEGE Spatial Vision
Department of Education and Early Childhood Development
Ref: SV003491 10/10/12 Commercial-in-Confidence Page 64 of 71 Spatial Vision
Figure 46: Forecast Government School Demand – Yield Scenarios - Sandringham College Catchment – 2011-2026
Yield Remains Unchanged Yield 5% higher Yield 10% higherMelbourne Metro Yield (i.e
45.21%)
2011 1,532 1,779 2,026 2,234
2016 1,579 1,833 2,087 2,294
2021 1,595 1,850 2,105 2,306
2026 1,593 1,847 2,102 2,301
-
500
1,000
1,500
2,000
2,500
De
man
d
Government Education DemandYield Rate Scenarios
If the government education yield increases by 5% (e.g. 35% to 40%) in the Sandringham College catchment forecast government education demand will be 16% higher in 2021.
If the government education yield increases by 10% (e.g. 35% to 45%) in the Sandringham College catchment forecast government education demand will be 27.5% higher in 2021.
If the forecast government education yield is consistent with the yield of the Melbourne Metropolitan area in 2011, demand for the Sandringham College catchment will be significantly higher. It should be noted that the yield for the Melbourne Inner South Statistical Area (see Figure 2, pg.8) in 2011 was 32.63%, slightly higher than the Sandringham College yield of 31.00%. This indicates that although slightly lower, the yield for the Sandringham College catchment is consistent with that of the broader study area.

DEMOGRAPHIC STUDY: SANDRINGHAM COLLEGE Spatial Vision
Department of Education and Early Childhood Development
Ref: SV003491 10/10/12 Commercial-in-Confidence Page 65 of 71 Spatial Vision
Figure 47: Forecast Government School Demand by Suburb for 2021 – Yield Scenarios - Sandringham College Catchment
Beaumaris Black Rock Cheltenham Hampton Hampton East Highett Mentone Sandringham
Unchanged 358 113 124 177 158 309 153 203
5% higher 421 137 140 216 177 340 177 242
10% higher 483 160 157 255 196 371 201 281
Melb Metro (45.21%)
565 214 152 355 171 279 214 356
0
100
200
300
400
500
600
De
man
d
Government Education Demand by Suburb - 2021Yield Rate Scenarios

DEMOGRAPHIC STUDY: SANDRINGHAM COLLEGE Spatial Vision
Department of Education and Early Childhood Development
Ref: SV003491 10/10/12 Commercial-in-Confidence Page 66 of 71 Spatial Vision
Figure 48: Forecast Government School Demand by Suburb for 2026 – Yield Scenarios - Sandringham College Catchment
Beaumaris Black Rock Cheltenham Hampton Hampton East Highett Mentone Sandringham
Unchanged 354 110 122 176 158 310 158 204
5% higher 416 133 139 215 177 341 182 244
10% higher 478 156 156 254 196 372 206 283
Melb Metro(45.21%)
559 209 151 354 171 280 220 358
0
100
200
300
400
500
600
De
man
d
Government Education Demand by Suburb - 2026Yield Rate Scenarios

DEMOGRAPHIC STUDY: SANDRINGHAM COLLEGE Spatial Vision
Department of Education and Early Childhood Development
Ref: SV003491 10/10/12 Commercial-in-Confidence Page 67 of 71 Spatial Vision
5. Student Address Analysis

DEMOGRAPHIC STUDY: SANDRINGHAM COLLEGE Spatial Vision
Department of Education and Early Childhood Development
Ref: SV003491 10/10/12 Commercial-in-Confidence Page 68 of 71 Spatial Vision
Figure 49: 2012 student address mapping
!
!
!
!
!
!!
!!
!! !
!!!
!
!
!
!!
!!
!
!
!!
!!
!
!
!
!
!
!
!
!!!
!!
!
!
!
!!
!
!!!
!
!!!
!!!!!
!!
!
!
!!
!
!!!! !!!!
!!
!!!
!
!!
!!!
!!!!
!
!!!!!
!
!!! !
!!
!!!!
!! !
!!!!
!!
!
!
!!! !!!!
!!
!!
!!!! !
!
!
!
!!!
!
!!
!
!
!!
!
!!!
!!!
!
!
!
! !!!
!!!
!
!
!
!
!! ! !
!!
! !
!!
!!
!!!
!!!
!
!
!! !
!! !
!
!
!!
! !!
!
! !!!!!!
!!
!
!
!!!
!
!!
!
! !!
!!!
!!!!!
! !!
!
!!
!
!
!!
!
! !!
!!
!!
!
!!
!!
!!!
!!
!!
!
!!
!!
!!
!
!!!
!
!!
!
!
!!!!
!!
!
!
!
! !!
!!!!
!!
!
!!
!! !
!!
!!!
!
!
!
!!
!!
!!!! !
!!!
!!
!!!
!!!!
!
!!!
!
!!!
!!
!!!
!
!!
!!
! !
!
!!!!
!!!!
!!
!
!!!!
!
!
!!
!!
!!
!!
!
!
! !
!
!!
!!
!
!
!
!
!
!
!!
!
!
!!
!
!!
!!!!
!!
!
!
!
!
!!
!
!!
!!
! !
! !
!
!
!
!
!
! !!
!
!
!
!
!
!
!
!
!
!!
!!
!
!!
!!!
!!
!
!
!!
!
!!
!
!!
!!
!
!!
!!
!
!
! !
!!!
!!!
!
!
!
!!!!
!
!!
!
!!
!
!
!
!!!
!
!
!
!
!
!
!
!
!
!
!!
!!
!
!!!!
!
!
!
!
!
!
!
!!!
!!!!
!
!
!
!!
!
!!
!!!!
!
!!
!!
!!
!
!!
!!!!!
!
!
!
!
!
!
!
!! !
!
!
!
! !!
!
!!
!
!!
!
! !
!
!
!!
!
!
!
!
!!
!
!
!!
!!
!
!
!
!
!!
!
!
!!
!
!
!!!
!!!
!!
!!!
!
!
!
!
!
!
!
!
!
!! ! ! !!
!!
!!
!
!!!!!
!
!
!! !
!
!
!
!
!
!
!
!
!!
!
!
!!
!!
!!!!
!
!
! !!
!
!
!
!
!!
!!
!
!!
!
!!
!!
!!!
! !
!!
!
!!!
!
!!
!
!!
!
!
!
!
!
!!
!!
!
!
!
!!
!
!
!!
! !!!
! !
! !
!
!
!!! !!
!
!
!!
!
!!! !
!
!!!
!
!
!
!
!
!
! !!!!
!!
!
!!
!!
! !
!
!
!
!
!!
!
!
!
!
!
! !
!
!
!
!!
!!
!
!
!
!
!
!
! !!!
!
!!
!
!
!
!
!
!!
!
!!
!!!
!
!
!
!
!
!!
!
!
!
!!!
!
!
!
!
!
!!
!
!
!
!!
!!
!
!
!
!!
!
!! !!
!
!
!
!!!
!
!
!!
!
!
!
!
! !
!
!
!
!
!
!
!!
!
!!! !!
!
!!
!
!
!!
!
!!
!
!
!!!
!!
! !
!
!
!
!!
!
!!
!!
! !
!! !
!!
!!
!!
!!!
!
!
!
!
!
!
!
!!
!
!
!
!
!
!
!
!
!!
!!
!
!
!!!
!
!!
!
!!
!
!
!!
!!!
!
!
!!!
!!!
!!
!!
!
!!!
!
!
!!!
!
!
!
!
! !!!
!
!
!!
!! !
!!!!
!
!!
!!
!
!
!
!
!!!
!!
!
!!!
!
!!!!
!
!!!!
!
!
!!
!
!
!!!
!!
! !!!!
!!!
!!!! !!! !!
!
!
!!
!
!
!!!!
!
! !!!!! !
!!
!! !
! !
!!!!
!
!!
!!
!!!
!!
!! !
!
!!
! !
!
!!!!
!!!!
!!!
!!
! !!
!
!!
!
!
!
!
!
!
!!!
!
!!!
!
!! !
!!
!!
!
!
!!!
!!
!!!
! !
!!
!
!
!!
!!
!
!
!
!!
!!
!!!
!
!
!
!!
! !
!!
!
!!!!
!!!
!
!!
!
!!
!!!
!
!
!
!
!
!!
!!
!
!
!!
!
!
!
!!
!!!
!
!
!
!!
!!
!!
!!
!
!!
!!
!
! !
!
!
!
!
!!
!
!
!!!
!!!
!
!
!
!!
!
!
!!
!
!
!
!! !
!
!
!
! !
!!
!
!
!
! !
!
!
!
!
!
!!
!!
!
!
! !
!
!
!
!!
!
!
!
!!!
!
!
!!!
!
!! !
!!
!
!
!
!!
!!
!!
!
!!!
!!
!
!!
!!
!
!
!!
!!
!!!
! ! !!
!!
!
!
!
!
!
!
!!
!
!!
! !
!
!
!
! !!
!
!
!
!
!
!
!
!
!
!
!
!
! !!!
!!
!!
!
!
!
!
!
!!
!
!
!
!
!
!
!
!!
!
!
!!
!
!
!
!
!!!
!
!
!!!
!
!
!
!
!
!
!
!
!
!!
!
!
!
! !
!
!
!!!
!
!
!
!
!
!
!
!
!
!!
!
!!!
! !
!
!
!!
!
!!
!
!
! !
!
!
!
!
!
!
!!
!
!
!
!
!
!!
!
!
!!
!!
!
!
!
!
!
!
!!
!
!
!
!
!
!
!!
!!
!
!!
!
!
!
!!!!
!
!
!
#0
#0
#0#0
!
!
!!
!!
!!
!
!
!
!
!
!
!!
!
!
!!
!
!
!
!
!
!
!
!
!
!
!
!
!
!
!
!
!
!
!
!
!!
!
!
!!
!
!!
!
!!
!
!
!
!
!!
!
!
!!! !
!!!
!
!
!!
!
!
!!
!!
!
!
!!
!
!
!
!! !
!
!
!
!! !
!
!
!
!!
!
!
! !
!
!
!!
!
!
!
!
!
!!
!!
!
!
!
!
!
!
!
!!!
!
!
!
!
! !
!
!
!!
!
!
!
!
!
!
!!
!
! !
!
!
!
! ! !!
!
!
!
!
!
!
!
!!!
!
!!
!!
!!
!
!
!
!
!
!!!
!
!
!
! !
!
!
!
!
!
!
!
! !
!
!
!
!
!!
!!
!
!
!
!
!
!
!!
!
!
!
!
! !
!
!
!
!
!
! !
!!
!!
!
!
!
!
!
!
! !
!
! !
!
!!
!!
!
!
!
!
!
!!
!
! !
!
!
!
!!
!
!
!!
!
!!
!
!
!
!
!
!
!
!
!
!
!!
!
!
!
!!
!
!
!
!
!
!
!
!
!
!
!
!!
!
!
!
!!
!
!
!
!
!
!
!
!!
!
! !
!
!!
!
!
!
!!
!
!
!
!
!
!
!
!
!
!
!!
!
!
!!
!
!
! !
!!
! !
!
!
!!!
!!
!!
!
!
!
!!!
!
!
!
!
!
!!
!
!
!
!
!
!
! !
!
!
!
!
!
!
!!
!
!
!
!
!
!
!
!
!!
!
!!
!
!
!
!
!
!
!!
!!
!
!
!
!
!
!
!
!!
!
!
!!
!!
!
!
!
!
!
!!
!!
!
!
!
!
!
!
!
!
!
!
!
!
!
!
!
!
!
!
!!
!!
!!
!
!
!!!
!
!
!
!!
!
!
!
!
!
!
!!
!
!
!!
!
!
!
!!
!
!
!
!
!
!
!
!
!!
!
!
!
!
!
!!
!!
!
!
!
!
!
!
!
!
!
!
!
!!
!!
! !
!
!
!
!
!!!
!
!
!!
!
!!!
!
!
!!
!
!
!
!
!
!
!
! !!!
!
!
!
!
!
!
!
!
!
!
!
!
!
!
!!
!
!
!
!
!
!
!
!
!
!
!!
!
!
!
!
!
!
!
!
! !!
!
!
!
!
!
!
!
!
!
!
!
!
!!
!
!
!
!
!
!
!!
!
!
!
! !
!
!
!
!
!
!
!
!
!
!
!
!
!
!
!
!
!
!!
!
!!!
!
!
!
! !
!
!
!
!
!
!
!
!
!
!!
!
!
!
!
!
!
!!
!
!
! !
!
!
!
!
!
!
!!
!
!
!!
!!
!
!
!
!!
!
!
!
!!
!
!
!
!!
!!
!! !
!!
!
!
!
!
!!
!
!
!
!
!
!
!
!
!
!
!
!
!
!
!
!
!
!
!
!
!!
!
!
!
!!
!
!!
!
!
!
!
!
!
!
!
!!
!
!
!
!
!
!
!!
!
!
!
!
!
!!
!
!
!
! !!
!
!
!
!
!!
!
!
!
!
!
!
!!!
!!
!!
!
! !
!!
!
!
!
!
!!
!
!
!
!
!
! !
!
!!
!!
!
!
!!
!
!
!
!!
!
!
!
!!
!
!
! !!
!!
!
!!
!!
! ! !
!
!!
!
!
!
!
!
!
!
!
!!
!
!
! !!
! !! !
!
!
!
! !
!!
!!!
!
!
!!
!!
! !
!
!!
!
!!
!
!
!
!
!
!
!!
!
!
!!
!
!
! !
!
!
!
!
!
!
!
!!
!
!
!
!
!
!
!
!
!
!
!!
!
!
!
!!
!
!
!
!
!
!
!!
!
!
!
!
!!
! !
!
!
!
!
!!
!
!
!
!
!
!
!
!
!
!
!
!
!
!
!
!
!
!!
!
!
!
!!
!!
!
!
!
!
!
!
!
!
!
!
!
!
!
!
!
!
!
!
!
!
!
!
!
!
!
!
!
!
!
!
!!
!
!
!
!
!
!
!
!
!
!
!
!
!
!!
!
!
!
! !
!
!
!
!
!!
!
!
!
!
!
!!!
!
!
!
!!
!
!
!!
!
!
!
!
!!
!
!
!
! !
!
!
!
!
!
!
!
!
!
!
!
!
!
!
!
!
!
!
!
!
!
!
!
!
!
!
!
!
!
!
!
!
!
!
!!
!
!
! !
!
!
!
!
!
!!
!
!
!
!
!
!!
!
!
!
!
!
!
!
!
!
!
!
!
!!
!
!
!
!!
!
!
! !
!
!
!
!
!
!
!
!!
!
!
!
!
!!
!
!
!
!
!
!
!
!
!
!
!
!
! !
!
!
!
!
!
!
!
#0
#0
#0
#0
Legend
School Locations
#0 Senior Campus
#0 Beaumaris Year 7-10 Campus
#0 Sandringham Year 7-10 Campus
#0 Sandringham East Primary School
Student Addresses
! Senior Campus
! Beaumaris Year 7-10 Campus
! Sandringham Year 7-10 Campus
! Sandringham East Primary School
Legend
Melbourne - Inner South (SA4)
School Locations
#0 Sandringham Primary School
#0 Senior Campus
#0 Beaumaris Year 7-10 Campus
#0 Sandringham Year 7-10 Campus
Student Address
! Sandringham Primary School
! Senior Campus
! Beaumaris Year 7-10 Campus
! Sandringham Year 7-10 Campus

DEMOGRAPHIC STUDY: SANDRINGHAM COLLEGE Spatial Vision
Department of Education and Early Childhood Development
Ref: SV003491 10/10/12 Commercial-in-Confidence Page 69 of 71 Spatial Vision
Figure 50: Historical student address comparison
2008 Student Address
!!
!!
!
!
!
!
!
!!
!!
!
!
!
!!
!!!
!
!
!
!
!
!
!
!
!
!
!
!
!
!
!
!
!
!
!
!
!
!
!
!
!
!
!!
!
!
!
!
!!
!
!
!
!
!
!
!
! !
!!
!
!!
!
!!
!
!
!
!
!!
!!
!
!!
!
!
!
!
!
!
!
!
!!
!
!
! !
!!!
!!!
!
!!
!
!
!
!
!
!
!
!!
!
!!
!!!
!!
!
!!
! !
!!
!
!
!!!
!!
!
!!
!
!
!!
!
!
!
!!
!
!!
!
!!
!!
!
!
!!
!!
!
!
!
!
!!!
!!
!
!!
!
!!!
!!
!!
!
!!
!
!
!!!
!
!
!!
!
!
!!!
!
!!
!
!
!
!!!!! !
!! !
!! !!!
!!
!
!
!
!!
! !!
!
!
!
!
!
!
!
!
!
!
!
!
!!
!!!
!
!!
!
!!!
!
!!
!
!!
!
!!
!
!
!
!!
!!
!
!
!
!!
!!
!!
!!
!!
!!!
!
!
!
!
!
!
!!
!
!
!!
!
!!
!
!
!
!
!
!
!
!
!
!
!
!
!
!
!
!
!
! !!
!!
!
!!
!!
!
!!
!!
!
!
!
!!
!
!!
!
!!
!
!
!!
!
!!
!
!
!
!!!
!!
!
!
!
!
!
!
!
!
!!
!
!
!
!
!
!
!!
!
!
!
!
!!
!
!
!!
!
!!!
!!!!
!!
!
!!
!
!
!
!!
!
!
!
!
!
!
!
!
!
!
!
!
!
!!
!
!
!
!
!
!
!
!
!
!
!
!
!
!
!
!
!
!
!
!
!
!!
!
!
!
!
!
!
!
!
!
!
!
!
!
!
!
!
!
!
!!
!
!
!
!
!
!
!
!
!
!
!
!
!
!
!!
!
!!
!
!
!
!
!
!
!
!
!
!
! !
!
!
!
!
!
!
!
!!
!
!
!
!!
!
!
!!
!
!
!
!
!
!
!
!
!
!
!
!
!
!
!
!
!
!
!
!
!
!
!
!
!
!
!
!
!
!
!
!
!!
!
!
!
!
!
!
!
!
!
!
!
!!
!
!
!
!
!
!!
!
!
!
!
!
!
!
!
!!
!
!
!
!
!
!
!
!
!
!
!
!
!
!
!
!
!
!
!
!
!!
!
!
!
!
!
!
!
!
!
!
!
!
!
!
!
!!
!
!
!
!!
!!
!!
!
!
!
!
!
!
!
!
!
!
!
!
!
!
!
!
!
!
!!
!
!
!
!
!
!
!
!
!
!
!
!
!
!
!
!
!
!
!
!
!
!
!
!
!
!
!
!
!
!
!
!
!
!
!
!
!
!
!
!
!
!
!
!
!
!
!
!
!
!
!
!
!
!
!!
!
!
!
!
!!
!
!
!
!
!
!
!
!!
!
!
!
!
!
!
!
!
!
!
!
! !
!!!
!
!
!
!
!
!!
!
!
!
!
!
!!
!
!
!
!
!
!!!
!
!
!
!
!
!
!
!
!
!
!
!
!
!
!
!
!
!
!
!
!
!
!
!
!
!
!
!
!
!!
!
!
!
!
!
!
!
!
!
!
!
!
!
!
!
!
!
!!
!
!
!
!
!
!!
!
!
!
!
!
!
!
!
!
!
!
!
!
!
!! !
!
!
!
!
!
!
!!
!
!
!
!
!
!
!
!!
!
!
!
!!
!
!
!
!
!
!
!
!
!
!
!
!
!
!!
!
!
!!
!
!
!
!
!
!
!
!!
!
!
!
!
!!
!
!!
!
!
!
!!
!
!
!
!
!
!
!!
!
!
!
!
!
!
!
!!
!
!
!
!
!
!
!
!
!
!
!
!!
!
!
!
!!!
!
!
!
!
!
!
!
!
!
!
!
!
!!!
!
!
!
!
!
!
!
!
!
!
!
!
!
!
!
! !!
!
!
!
!
!!
!
!
!
!
!
!!
!
!
!!
!
!
!
!
!!
!
!
!
!
!
!!
!
!
!
!
!!
!
!!
!
!
!
!
!
!
!
!
!
!
!
!
!
!
!
!!
!
!
!
!
!!
!!
!
!
!
!
!
!
!
!
!
!
!
!
!
!
!
!!
!
!
!
!
!!
!!
!
!
!
!
!
!!
!
!
!
!
!
!
!
!
!
!
!
!
!!
!
!
!
!!
!
!
!
!
!
!!
!
!
!
!
!
!
!!
!!
!
!
!
!
!
!
!
!
!
!
!
!!
!
!
!
!!
!
!
!
!!
!
!
!
!
!
!
!
!!
!
!
!!
!
!
!!!
! !
!!
!
!
!
!
!
!!
!
!
!!
!
!
!!
!
!!
!
!!
!
!!!
!
!
!
!
!!
!!
!
!
!!
!
!
!
!!
!
!
!
!
!!
!
!
!
!
!
!
!
!
!!
!!!
!
! !
!
!
!
!
!
!
!
!
!
!
!
!!
!
!
!
!
!
! !
!
!
!
!
!!
!
!
!
!!
!
!
!!
!!
!
!
!
!
!
!
!
!
!!
!
!
!
!
!
!
!
!
!!
!
!
!
!
!
!
!!
!
!
!
!
!
!
!
!
!
!
!
!!
!
!
!
!
!
!
!
!
!
!
!
!
!!
!
!!
!
!
!!
!
!
!!
!
!
!
!
!
!!
!!
!!
!
!
!
!
!
!
!
!
!
!
!
!
!!
!
!
!!
!
!
!
!
!
!
!
!
!
!
!
!
!
!
!!
!
!
!
!
!
!!
!
!
!
!
!
!
!
!!
!
!
!!
!
!
!
!
!
!
!
!
!
!
!
! !
!
!
!
!
!
!
!
!
#0
#0
#0#0
2012 Student Address
!
!
!
!
!
!!
!! !
!!
!
!
!
!
!
!
!!
!
!
!!
!
!
!
!
!
!
!
!
!
!!
!
!!
!
!
!
!
!
!
!!
!
!
!!
!
!!
!
!!
!
!
!
!
!!
!
!
!!! !!!
!
!
!
!!
!
!
!!
!!
!
!
!!
!
!
!
!! !!
!
!
!! !
!
!
!!!
!
!
! !
!
!!
!
!
!
!
!
!!
! !!
!!
!
!
!
!
!
!!!
!
!
!
!
! !
!
!
!!
!
!
!
!
!
!
!!
!
! !
!
!
!
! ! !!
!
!
!
!
!
!
!
!!! !
!!
! !
!!
!
!
!
!
!
!!!
!
!
!
! !
!
!!
!
!
!
!
! !
!
!
!!
!!!!
!
!!
!
!
!
!!
!
!
!
!
! !
!
!
!!
!! !
!!
! !!
!
!!
!
!
!!
!
! !
!
!!
!!
!
!
!
!
!!
!
!
! !
!
!
!
!!
!
!
!!
!
!!
!
!
!
!
!
!
!
!!
!
!!
!
!
!
!!
!
!!
!
!
!
!
!
!
!
!
!!
!
!
!
!!
!
!
!
!
!
!
!
!!
!
! !
!!!
!
!
!!!
!!
!
!
!
!
!
!
!
!
!!
!
!
!!
!
!
! !
!!
! !
!
!
!!!
!!
!!
!
!
!
!!!!
!
!
!
!
!!
!
!
!
!
!
!
! !
!
!
!
!
!
!
!!!
!
!
!
!
!
!
!!
!!
!
!
!
!
!
!!
!
!
!
!
!
!
!!
!!
!
!!
!
!
!
!
!
!
!
!!! !
!
!
!
!
!
!
!
!
!
!!
!
!
!
! !
!
!
!
!
!
!
!
!
! !
!
!
!!
!
!
!
!!
!
!
!
!
!
!!
!
!!
!
!
!
!
!
!
!
!
!
!
!
!
!
!
!
!! ! !
!!
!!
!
!
!
!!
!!
!
!
!
!
!!
!
!
!
!
!
!
!
!
!
!
!
!
!
!
!!
!!!!
!
!
!!!
!
!
!
!
!!
!
!
!
!
!
!
!!
!
!
!!
!
!!
!!
!
!
!!
!
!
!
!
!!
!
!
!
!
!
!!
!!
!
!
!
!
!
!
!
!
!
!!
!!
! !
! !
!
!
!
!
!!!
!
!
!!
!
!!! !
!
!!
!
!
!
!
!
!
!
! !!!
!
!
!
!
!
!
!!
!!
!
!
!
!
!!
!
!
!
!
!
!!
!
!
!
!!
!
!
!
!
!
!
!
!
! !!!
!
!
!
!
!
!
!
!
!!
!
!!
!!
!
!
!
!
!
!
!!
!
!
!
! !
!
!
!
!
!
!
!
!
!
!
!
!
!
!!
!
!
!
!!
!
!
!!!
!
!
!
! !
!
!
!
!!
!
!
!
!
! !
!
!
!
!
!
!
!!
!
!!! !
!
!
!
!
!
!
!!
!
!!
!
!
!!
!
!
!
!!
!
!
!
!!
!
!
!
!!
!!
!! !
!!
!
!
!
!
!!
!
!
!
!
!
!
!
!
!
!
!
!
!
!
!
!
!
!
!!
!!
!
!
!!!
!
!!
!
!!
!
!
!
!
!
!!
!
!
!
!
!
!
!!
!
!
!!
!
!!
!
!
!
! !!
!
!
!
!
!!
!
!
!
!
!
!
!!!
!!!!
!
! !
!!
!
!
!
!
!!
!
!
!
!
!
! !
!
!!
!!
!
!!!
!
!
!
!!
!
!
!
!!
!
!
! !!
!!
!
!!
!!
!! !!
!!
!
!
!
!
!
!
!
!!
!!
!
! !!
! !! !
!
!
!
! !
!!
!!!
!
!
!!
!!
! !
!
!!
!
!!
!
!
!
!!
!
!!
!!
!!
!!
!!
!
!
!
!!
!
!
!!
!
!
!
!
!
!
!!
!
!
!!
!
!
!
!!
!
!
!
!
!
!
!!
!
!
!
!
!!
! !
!!
!
!
!!
!
!
!
!
!
!!
!
!
!
!!
!
!
!
!
!
!!
!
!
!
!!
!!
!!
!
!
!
!
!
!
!
!!
!
!
!
!
!
!
!
!
!
!
!
!
!
!
!
!
!
!
!
!!
!
!
!
!
!
!
!
!
!
!
!
!
!
!!
!!
!
! !
!
!
!
!
!!
!
!
!
!
!
!!!
!
!
!
!!
!
!
!!
!
!
!
!!
!
!
!
!
! !
!
!
!
!
!
!!
!
!
!
!
!
!
!
!
!
!
!
!!
!
!
!
!
!
!
!
!
!
!
!
!
!
!
!!
!
!
! !
!
!
!
!
!
!!
!
!
!
!
!
!!
!
!
!
!
!
!
!
!
!
!
!
!
!!
!
!
!
! ! !
!
! !
!
!
!
!
!
!
!
!!
!
!
!!!
!
!
!
!!!
!
!
!
!
! !
!
!
!
!!
!
!
!
!
!
!
!
!
!
!
!
!
!
! !
!
!
!
!
!
!
#0
#0
#0#0
Legend
School Locations
#0 Senior Campus
#0 Beaumaris Year 7-10 Campus
#0 Sandringham Year 7-10 Campus
#0 Sandringham East Primary School
Student Addresses
! Senior Campus
! Beaumaris Year 7-10 Campus
! Sandringham Year 7-10 Campus
! Sandringham East Primary School
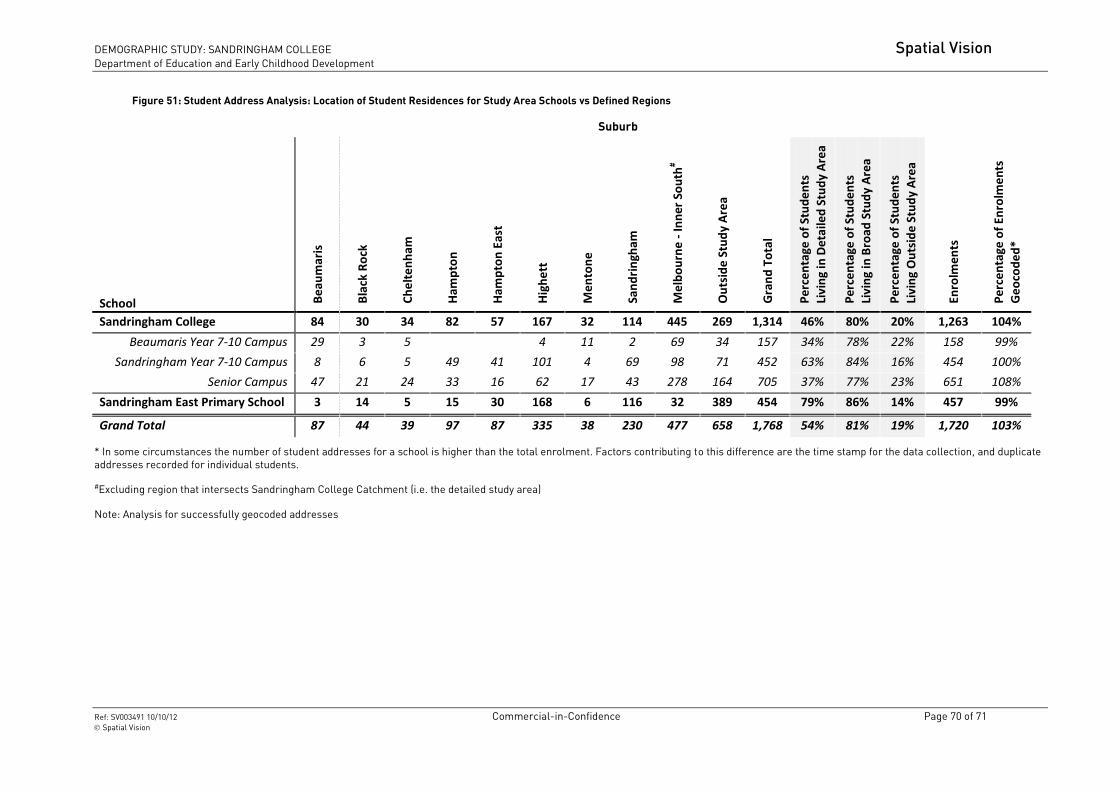
DEMOGRAPHIC STUDY: SANDRINGHAM COLLEGE Spatial Vision
Department of Education and Early Childhood Development
Ref: SV003491 10/10/12 Commercial-in-Confidence Page 70 of 71 Spatial Vision
Figure 51: Student Address Analysis: Location of Student Residences for Study Area Schools vs Defined Regions
Suburb
School Be
aum
aris
Bla
ck R
ock
Ch
elt
en
ham
Ham
pto
n
Ham
pto
n E
ast
Hig
he
tt
Me
nto
ne
San
dri
ngh
am
Me
lbo
urn
e -
Inn
er S
ou
th#
Ou
tsid
e S
tud
y A
rea
Gra
nd
To
tal
Pe
rce
nta
ge o
f St
ud
en
ts
Livi
ng
in D
eta
iled
Stu
dy
Are
a
Pe
rce
nta
ge o
f St
ud
en
ts
Livi
ng
in B
road
Stu
dy
Are
a
Pe
rce
nta
ge o
f St
ud
en
ts
Livi
ng
Ou
tsid
e S
tud
y A
rea
Enro
lme
nts
Pe
rce
nta
ge o
f En
rolm
en
ts
Ge
oco
de
d*
Sandringham College 84 30 34 82 57 167 32 114 445 269 1,314 46% 80% 20% 1,263 104%
Beaumaris Year 7-10 Campus 29 3 5 4 11 2 69 34 157 34% 78% 22% 158 99%
Sandringham Year 7-10 Campus 8 6 5 49 41 101 4 69 98 71 452 63% 84% 16% 454 100%
Senior Campus 47 21 24 33 16 62 17 43 278 164 705 37% 77% 23% 651 108%
Sandringham East Primary School 3 14 5 15 30 168 6 116 32 389 454 79% 86% 14% 457 99%
Grand Total 87 44 39 97 87 335 38 230 477 658 1,768 54% 81% 19% 1,720 103%
* In some circumstances the number of student addresses for a school is higher than the total enrolment. Factors contributing to this difference are the time stamp for the data collection, and duplicate
addresses recorded for individual students.
#Excluding region that intersects Sandringham College Catchment (i.e. the detailed study area)
Note: Analysis for successfully geocoded addresses
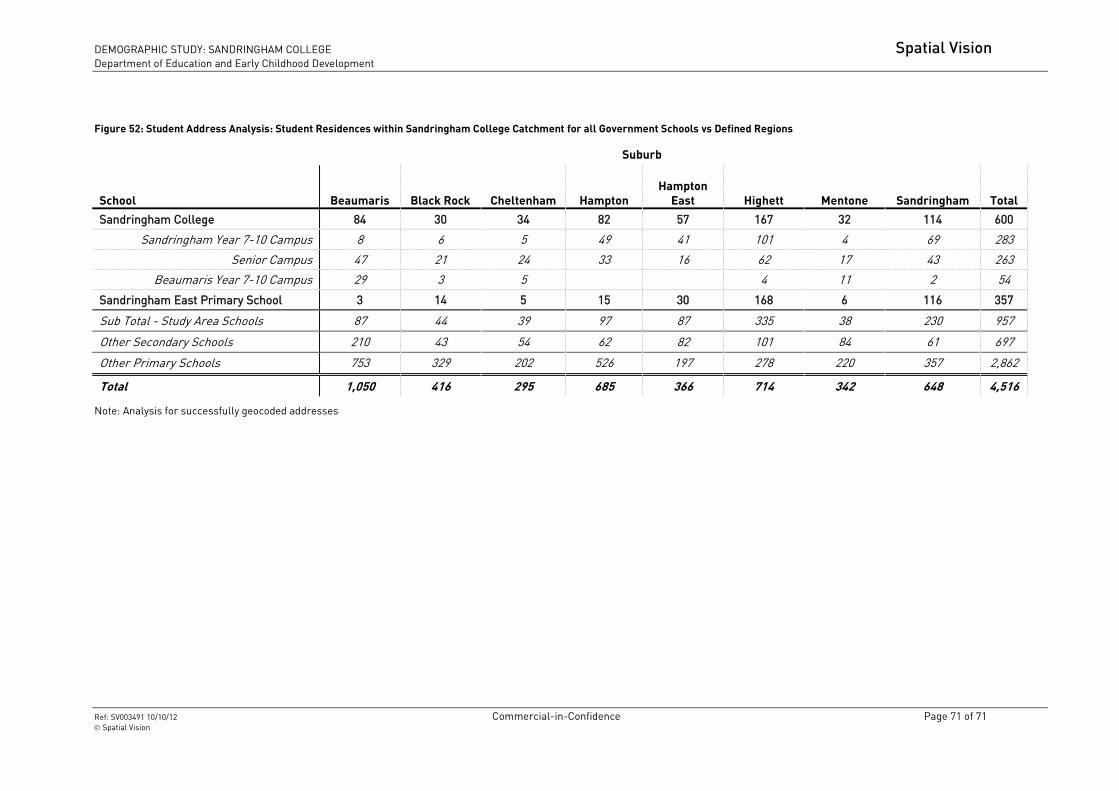
DEMOGRAPHIC STUDY: SANDRINGHAM COLLEGE Spatial Vision
Department of Education and Early Childhood Development
Ref: SV003491 10/10/12 Commercial-in-Confidence Page 71 of 71 Spatial Vision
Figure 52: Student Address Analysis: Student Residences within Sandringham College Catchment for all Government Schools vs Defined Regions
Suburb
School Beaumaris Black Rock Cheltenham Hampton
Hampton
East Highett Mentone Sandringham Total
Sandringham College 84 30 34 82 57 167 32 114 600
Sandringham Year 7-10 Campus 8 6 5 49 41 101 4 69 283
Senior Campus 47 21 24 33 16 62 17 43 263
Beaumaris Year 7-10 Campus 29 3 5 4 11 2 54
Sandringham East Primary School 3 14 5 15 30 168 6 116 357
Sub Total - Study Area Schools 87 44 39 97 87 335 38 230 957
Other Secondary Schools 210 43 54 62 82 101 84 61 697
Other Primary Schools 753 329 202 526 197 278 220 357 2,862
Total 1,050 416 295 685 366 714 342 648 4,516
Note: Analysis for successfully geocoded addresses