portland water district the operating expense section for information on how money is spent across...
TRANSCRIPT

1 Preface
Portland Water District
Administrative Office
225 Douglass Street
Portland, ME 04101
Board of Trustees
Guy H. Cote Jr.
President
Representing Westbrook
Kenneth L. LevinskyVice President
Representing Portland
John E. Brady Bradford S. Cleaves Louise G. DouglasCape Elizabeth/South Portland Portland Raymond/Windham
Duane H. Dreger Seth Garrison Gary W. LibbyGorham Scarborough Portland
William M. Lunt III Wayne H. Ross Nisha P. SwintonCumberland/Falmouth Cape Elizabeth/South Portland Portland
Ronald Miller
General Manager
David M. KaneTreasurer

2 Preface
Portland Water District Budget – Reader’s Guide
The budget document is intended to provide practical and pertinent information about the PortlandWater District’s financial planning and policies. The budget holds a wealth of information including howwater and wastewater revenues are used to support infrastructure and fund future year’s development.Some questions we answer include:
How does the budget impact my water bill?
For information on how changes in the budget impact customers’ water bills, please see the Revenue
Section.
How does it affect my municipalities’ sewer budget?
The Budget by Fund section includes a summary of each of the communities we provide wastewater
services (Cape Elizabeth, Cumberland, Gorham, Portland, Westbrook and Windham) and billing services
(Falmouth, Scarborough, and South Portland).
How does the District spend its money?
See the Operating Expense Section for information on how money is spent across the Water,
Wastewater, Environmental, Engineering, and Administrative departments.
How can I participate in the process?
PWD members and the public at large are encouraged to join any of the Board meetings held on the 2nd
and 4th Monday of every month. The Board will review the proposed budget at the November 24th
meeting at 6pm. Meetings can also be seen on your local public access channel and on our website.
What water mains will be replaced in 2015?
For a complete list of proposed water main renewal projects please go the Capital Improvement section.
A complete list of the budget’s contents can be found in the Table of Contents.
The Portland Water District prides itself on serving Portland and the surrounding communities. We
encourage members and the community to engage in discussions regarding water main renewal, water
and wastewater treatment, and how best to protect Sebago Lake and its watershed. To stay up to date
please visit www.pwd.org regularly or follow us on Facebook and Twitter.

3 Preface
Table of Contents
PrefacePortland Water District Budget Reader’s Guide…………………………………………………… 2Overview of the Water and Wastewater System …................................................ 6Letter from the General Manager………………………………………………………………………… 7
IntroductionIntroduction and Service Territory……………………………………………………………………….. 11History…………………………………………………………………………………………………………………. 12Top Reasons to Choose Portland, Maine Now…………………………………………………….. 13Portland Economic Scorecard………………………………………………………………………………. 14The Regulatory Environment in Which We Function……………………………………………. 15Water Rate Change Process…………………………………………………………………………………. 16Organization Structure……………………………………………………………………………………….… 18Annual Planning and Budget Process…………………………………………………………………… 19Planning/Budget Process Calendar………………………………………………………………………. 20Mission Statement……………………………………………………………….……………………………… 21Strategic Goals………………………………………………………….…………………………….…………… 22Board Established Guidelines…………………………………………………………………….………… 28External Factors Impacting the 2015 Budget………………………………………….……………. 30Significant Budget Uncertainties…………………………………..………………………….…………. 31Major Policy and Resource Allocation Decisions………………………..…………….…………. 32Operating Budget Summary…………………………………………………………………….………….. 34Capital Budget Summary……………………………………………………………………….…………….. 35Combined Water and Wastewater Operating Funds…………………………..….…………… 36Combined Operating, Capital and Grant Funds…………………………………….……………… 37GFOA Budget Presentation Award……………………………………………………….……………… 38
Budget by FundIntroduction……………………………………………………………………………………………..…………. 39Water Fund………………………………………………………………………………………………………….. 40Cape Elizabeth Wastewater Fund………………………………………………………………………… 50Cumberland Wastewater Fund……………………………………………………………………………. 58Gorham Wastewater Fund…………………………………………………………………………………... 66Portland Wastewater Fund………………………………………………………………………………….. 74Wastewater System Disposal Wipe Issue……………………………………………………………… 83Westbrook Wastewater Fund……………………………………………………………………………... 84Windham Wastewater Fund………………………………………………………………………………… 92Contracted Billing Services – Falmouth, Scarborough, and South Portland………….. 100Operating Budget by Fund Summary……………………………………………………………………. 102

4 Preface
RevenueIntroduction…………………………………………………………………………………………………………. 103Water Sales…….……………………………………………………………………………………………………. 104Water Sales Metered Revenue……………………...…………………………………………………….. 106Water Sales Metered Revenue, Consumption..……………………………………………………. 107Water Sales Metered Revenue, Rates.…………………………………………………………………. 114Water Sales Non-Metered Revenue…….………………………………………………………………. 116Water Sales Long-Term Considerations……………………………………………………………….. 117Wastewater Assessment and Contracted Billing Income.…………………………………….. 118Wastewater Assessments Revenue Trend…..……………………………………………………….. 119Current Municipal Wastewater Rates………………………………………………………………….. 120Interest Income…..………………………………………………………………………………………………. 121Other Income…..………………………………………………………………………………………………….. 122Projections for Rate-Making Purposes…………………………………………………………………. 123Fund Balance……………………………………………………………………………………………………….. 124
Operating ExpensesIntroduction and Financial Summary by Category and Department…………………….. 125Operating Expense by Category…………………………………………………………………………… 126
Salaries/Wages……………………………………………………………………………………….. 126Employee Benefits and Biosolids Disposal……………………………………………….. 127Chemicals………………………………………………………………………………………………… 128Contracted Services………………………………………………………………………………… 129Deferred Cost Write-off………………………………………………………………………….. 130Heat/Fuel Oil and Insurance……………………………………………………………………. 131Materials & Supplies………………………………………………………………………………… 132Other Expense…………………………………………………………………………………………. 133Purchased Power…………………………………………………………………………………….. 134Regulatory/Taxes and Telephone/Other Utilities and Transportation……… 135
Operating Expense by Department………………………………………………………………………. 136Water Services….…………………………………………………………………………………….. 136Wastewater Services….…………………………………………………………………………… 153Environmental Services……………………………………………………………………………. 169Engineering Services………………………………………………………………………………… 187Administrative Services……………………………………………………………………………. 200Non-Departmental…………………………………………………………………………………… 216
Human ResourcesIntroduction………………………………………………………………………………………………………….. 217Salary Costs…………………………………………………………………………………………………………… 218Labor Hours/Average Pay Rates……………………………………………………………………………. 219Employee Benefits……………………………………………………………………………………………….. 220Authorized Head Count………………………………………………………………………………………… 223Non-Union Positions…………………………………………………………………………………………….. 224Union Positions……………………………………………………………………………………………………… 225Temporary and Non-Benefit Employees……………………………………………………………….. 226Work Force Management……………………………………………………………………………………… 228

5 Preface
Capital FinanceIntroduction and Annual Fund Operating Budget………………………………………………… 231Bond Financing…………………………………………………………………………………………………….. 232Water and Wastewater Funds Debt Service…………………………………………………………. 235Debt Service Summary…………………………………………………………………………………………. 238Water and Wastewater Debt….……………………………………………………………………………. 239Capital Reserve……………...……………………………………………………………………………………. 244Renewal & Replacement..……………………………………………………………………………………. 245Water Fund – Renewal and Replacement Fund……………………………………………………. 246Wastewater Fund – Renewal and Replacement Fund………………………………………….. 247Bond Issued for Water Treatment Plant Upgrade………………………………………………… 248
Capital ExpendituresIntroduction…………………………………………………………………………………………………………. 249Capital Improvement Program Process………………………………………………………………… 250Infrastructure and Operational Evaluation Plans………………………………………………….. 251Program Summary and Board of Trustee Orders………………………………………………….. 261Program Summary ………………………………………………………………………………………………. 262Fund Summary…………………………………………………………………………………………………….. 264Financing Summary……………………………………………………………………………………………… 266Priority Summary Report – Non-Routine..……………………………………………………………. 268Priority Summary Report – Routine……………………………………………………………………… 269Operating Fund Impact of Non-Routine Capital Projects……………………………………… 270Subprograms with Pending Unscheduled Work…………………………………………………… 271Capital Improvement Program – Five Year Plan……………………………………………………. 272Current Year CIP Progress Report………………………………………………………………………… 275Subprogram Details……………………………………………………………………………………………… 277
Financial PoliciesIntroduction…………………………………………………………………………………………………………. 325Significant Financial Policies…………………………………………………………………………………. 325Cost Allocation Policy Detail…………………………………………………………………………………. 331Defined Pension Plan’s Funding Policy…………………………………………………………………. 344
AppendixEmployee Recognition………….……………………………………………………………………………… 346Community Connections…………….……………………………………………………………………….. 347Portland Economic Scorecard………………………………………………………………………………. 348Water Benchmark Data………………………………………………………………………………………... 355Customer Satisfaction Survey Results…………………………………………………………….……. 357Board of Trustees Orders and Resolutions…………………………………………………….…….. 358Glossary/Acronyms……………………………………………………………………………………………… 366
6 Preface
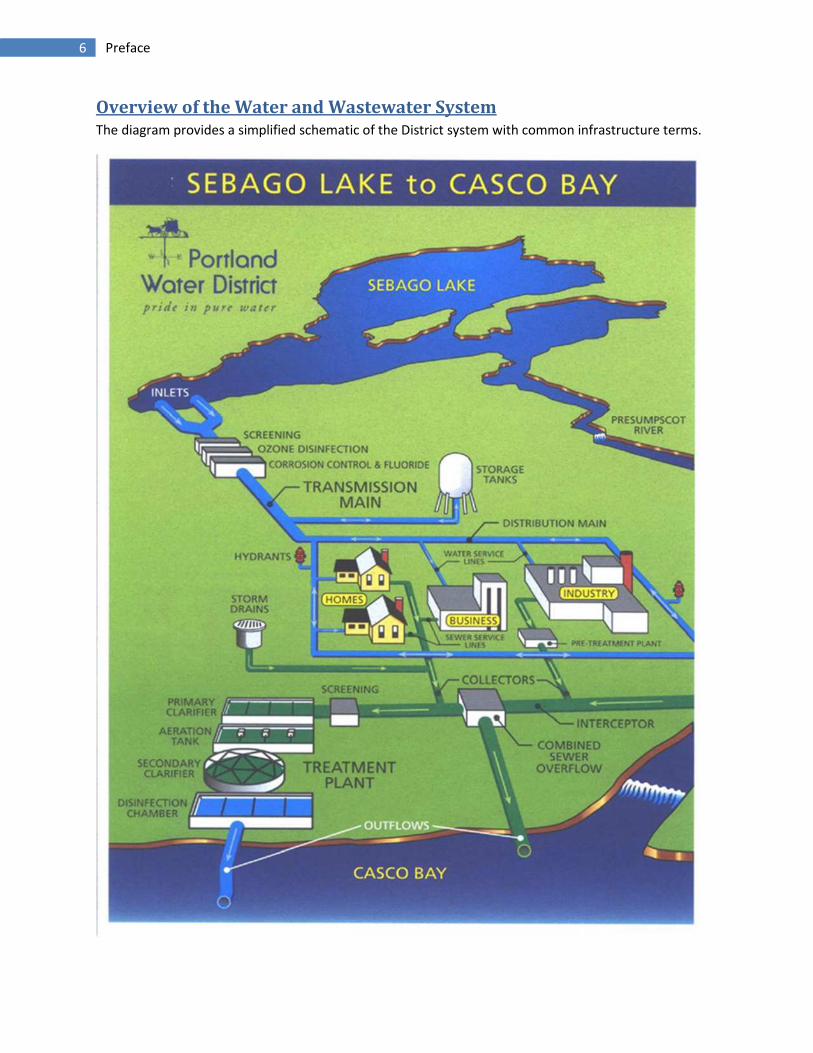
Overview of the Water and Wastewater SystemThe diagram provides a simplified schematic of the District system with common infrastructure terms.

7 Preface
Ronald Miller
General Manager
Portland Water DistrictF r o m S e b a g o L a k e T o C a s c o B a y
October 27, 2014
To the members of the Board of Trustees,
On behalf of the entire Management Team, I’m pleased to submit for your consideration the Portland
Water District’s Comprehensive Annual Budget Proposal for 2015. The document is designed to present
the comprehensive financial framework for all District activities for the budget year. As you consider the
budget for our upcoming 107th year, please reflect on our past accomplishments, present challenges
and opportunities, and future aspirations. Our dedicated full-time staff of 178 employees works every
day to ensure tap water is delivered to the 200,000 inhabitants of Greater Portland, to provide adequate
water for fire protection, and to treat wastewater before returning it to the environment.
Watershed ProtectionSince the early 1900’s, the District has spent significant resources to protect the water source by
purchasing 2,500 acres of land surrounding Sebago Lake’s lower bay and creating a robust watershed
protection program. The 2015 budget includes an Environmental Services staff of eight with an
operating budget of more than $1,050,000 to maintain the excellent water source. Since Sebago is a
multi-use lake and water quality is affected by activities in remote parts of the watershed, staff will
continue to focus in 2015 on collaborative efforts to encourage lake stewardship. Efforts will continue to
seek partners within the Sebago Lake watershed to limit development and preserve the forested land.
Water TreatmentIn 1993, the Environmental Protection Agency granted the District a waiver to its rule that generally
requires filtration of surface water supplies. The waiver was granted because of our excellent raw water
quality and our strong watershed protection program. Although not filtered, our raw water is
disinfected by an ozone treatment process and, during 2014, the District completed construction of the
ultraviolet/ozone treatment system at a total cost of $12,000,000 to comply with Environmental
Protection Agency’s enhanced rules. The 2015 budget includes debt service payments of $931,000 for
this new system.
8 Preface
Water OperationWater is distributed through a system of 1,000 miles of water mains, three major pump stations, and ten
storage facilities. Infrastructure age, cold winter temperatures and the underground location of many of
our assets challenge staff to operate and maintain the system with minimal disruption. A 2003 master
plan identified $175 million of distribution system needs over 20 years, and we are on track to meet that
goal. The proposed budget commits an additional $6.5 million to replace aging water main
infrastructure. That commitment has reduced mains breaks to about 100 per year or 45% from its peak
in 1987, and has begun to address the miles of mains reaching the end of their useful life.
Wastewater Operations
The District’s wastewater staff manages a collection system consisting of 90 miles of pipe and 64 pump
stations to deliver a combined average of 21 million gallons of wastewater daily to our four treatment
facilities. Three of the facilities were constructed in the mid-1970s and have undergone significant
renovations. Continued efforts to renovate aging infrastructure in 2015 will include beginning work on
the aeration systems at the Westbrook Regional and Portland Wastewater Treatment Plants.
In addition to addressing aging infrastructure, wastewater staff will support Cape Elizabeth, Portland
and Westbrook in reducing combined sewer overflows in their communities. The District may be
impacted by additional storm water flows delivered to treatment facilities.
Support ServicesSupporting the Environmental, Water and Wastewater Service departments are the Engineering and
Administrative Service departments. Those departments provide engineering, computer system,
financial, employee relations and customer services. Current challenges these departments are
addressing include:
Infrastructure Assets: PWD has adopted an asset management philosophy and has developedthe data systems to support it. In 2015, the data focus will be on digitizing the location ofcustomer associated assets such as water service lines and meters.
Customer Service Options: The District will continue to expand customers “on demand” accessto a variety of common transactions through telephonic and on-line tools.
Public Relations: Customers having an understanding of the benefits of well-maintained systemthat delivers quality water to customers’ homes and treats their wastewater 24/7 is important.Continued efforts will be made in 2015 expanding the ‘value of water’ campaign and waterbottle water filling station grant program.
Document Management: The challenge to manage the electronic and paper documents will beaddressed in 2015.

9 Preface
Financial Overview
These activities are constrained by the financial resources that are available and affordable to our rate
payers.
The proposed budget for 2015 recommends $39.0 million for operations and $25.0 million for the first
year of a five year Capital Improvement Plan. The operating budget consists of three major expense
categories – salaries/ benefits (39%), capital finance (29%) and all other materials and services (32%).
Salaries/benefits reflect a wage adjustment of 2.0% and increased pension costs ($92,000; 7% higher).
Health insurance costs are only slightly higher partially due to increased employee’ contributions.
Capital financing cost are flat as debt service to finance water main renewal work and water treatment
upgrades was offset by retiring debt. Total other expenses are $396,000, or 3.3%, higher than the prior
year.
The significant changes in specific line-itemsinclude:
Higher contractor construction costs:additional costs to complete valvebox work and paving costs($158,000) and maintenance on therecently installed ultraviolettreatment equipment ($60,000.)
Higher biosolids disposal costs:annual cost unit escalation of 2.5%and slightly more material projectedto be produced ($89,000)
Lower electricity costs: the newwater treatment process requiresless electricity and lower per unitcosts from our local electricitydistributor will be lower ($39,000).
The capital budget includes $10.4 million
for water systems with $6.5 million of that
targeted to replace aging water mains.
Also, investment of $2.0 million will be
made to improve supply in the 407 Zone.
The $13.7 million wastewater system
capital budget includes $11.0 million to
replace the aeration system at the East
End treatment plants. A budget of $1.0
million is targeted to address combined
sewer overflows in Westbrook.
$14.9 $15.3
$11.4 $11.3
$12.0 $12.4
$0
$5
$10
$15
$20
$25
$30
$35
$40
$45
2014 2015
Operating Budget(millions)
Salaries/Benefits Capital Finance Other
$10.4
$13.7
$0.9
Capital Budget(millions)
Water Systems
WastewaterSystems
General Assets

10 Preface
Customer ImpactThe proposed budget assumes a 3.8% rate adjustment effective May 1, 2015. The increase is consistent
with the Board’s intent to adopt small water rate adjustments annually. For a typical customer, the
impact is $8.40 a year or $0.70 a month. Of the 3.8% rate adjustment, 2.8% will be used for general
operation and 1% will be dedicated to fund a new capital reserve account that will support $2 million
debt bond to pay for main renewal replacements.
Assessments to wastewater communities meet or are lower than municipal expectations. Assessments
for Cumberland, Gorham, Westbrook and Windham remain the same as last year. Cape Elizabeth’s and
Portland’s assessments increase by 2.5% and 1.0%, respectively. .
The 2015 budget guidelines established by the Board of Trustees are met in this budget proposal.
Operating fund expenses are not increasing greater than inflation,
Wastewater assessments meet the municipal expectations,
Full-time positions do not exceed the target, and
Investment in our infrastructure continues as planned.
Ronald Miller David M. Kane
General Manager Treasurer
Budget Highlights
NEW INITIATIVES
Renovation of the East EndWa stewater Treatment
Plant's aeration system, withthe $12 million project
completed by April 2017.
Investing an additional $6.5million in water main renewal;including $2.0 million through
new capital reserve fund.
Public Relations programscontinued - water bottle
fountain grant program and'value of water' campaign.
CHALLENGES AND ISSUES
Higher regulatory standardsdemanded a level of effort to
monitor drinking water qualityand treat additional volume of
wastewater.
Aging infrastructure requiresasset replacement.
Aging workforce
Improving but relatively weakeconomic growth limits
revenue growth from newcustomers.
BUDGET SUMMARY
The Operating Budget is proposed to be $39.0million, an increase of $743,910 or 1.9%.
Total Revenues are projected at $39.6 million,which assumes a 3.8% water rate increase
and wastewater assessments that meet themunicipalities’ expectations.
The Capital Budget is proposed at $25 million.It continues commitment to invest in water
mains and wastewater facilities renovations.
Full-time Positions remain at 178.
The proposed budget continues funding toimplement technology solutions for
knowledge management, continues to investin staff training, and provides incentives for
multi-skill development.

11 Introduction
Introduction
The Portland Water District (PWD) is a quasi-municipal utility authorized by state charter to providewater service to eleven Greater Portland communities and wastewater treatment and interceptionservices to six of those communities. Water service is provided to 51,800 customers. Sebago Lakeprovides virtually all the water delivered. A network of 1,000 miles of water mains delivers water fromSebago Lake to customers. The system provides fire protection through 5,000 fire hydrants and 2,000sprinkler systems. PWD provides additional wastewater-related services through contracts with thecommunities. Additional services include sewer billing and collector/storm drain system operations.
Summary of Wastewater Services Provided:
By Charter: By Contract:
Community Customers Treatment Interceptors Collectors Storm Drains Billing
Cape Elizabeth 2,279 Yes Yes No No Yes
Cumberland 1,107 No Yes Yes No Yes
Falmouth 1,914 No No No No Yes
Gorham 1,665 Yes Yes Yes No Yes
Portland 16,960 Yes Yes Peaks Island (only) Peaks Island (only) Yes
Scarborough 405 No No No No Yes
South Portland 7,789 No No No No Yes
Westbrook 4,433 Yes Yes No No Yes
Windham 52 Yes Yes Yes No Yes
Service Territory

12 Introduction
History
In 1862, a group of citizens foresaw the necessity of improving the Greater Portland water supply tosupport continued growth. Private wells were no longer sufficient for domestic and fire protection use.This group formed the Portland Water Company. In 1869, the first water flowed from Sebago Lake toPortland, and the first water service was turned on in Portland on Thanksgiving Day.
In 1908, the Portland Water District bought the Portland Water Company and the Standish Water andConstruction Company and began serving water to Portland and South Portland. PWD later acquired theGorham Water Company and the Falmouth Water Company. In the years that followed, Cumberland,Falmouth, Westbrook, Cape Elizabeth, Scarborough, Gorham, and the islands of Casco Bay also beganreceiving public water from the Portland Water District.
During the next 45 years, Greater Portland grew to be the industrial and financial hub of the state.Growth in the Portland area required several upgrades of the Portland Water District’s system, includingthe construction of water supply systems to serve North Windham, Steep Falls, and Standish. The NorthWindham system was later decommissioned, partly due to the threat of MtBE contamination.
As a logical extension of its role as the regional water supplier, in the 1960s, the Portland Water Districtoffered to handle and treat the region’s wastewater. Since then, PWD constructed treatment plants inPortland (1979), Westbrook (1978), Little Falls (1987), Cape Elizabeth (1987), and Peaks Island (1993). Inaddition, PWD began providing wastewater maintenance and operating services to the town ofCumberland (1984) and now accepts septage from several Sebago Lake region communities.
During the 1990s water utilities around the country faced tighter regulatory requirements, moreinformed customers expecting a better product, and the emergence of newly detected contaminantsand pathogens which did not exist or were unidentified years ago. The Portland Water District rose tomeet these challenges with a state-of-the-art ozonation facility (built in 1994), a technologicallyadvanced staff with expanded skills, more sampling and monitoring, and an emphasis on honest andample communication.
The decade starting in 2000 also witnessed the aging of PWD’s wastewater treatment facilities and anincreased emphasis on odor control. The East End Wastewater Treatment Facility started undergoingrenovations to upgrade the facility and control odors, while a complete evaluation of theWestbrook/Gorham Wastewater Treatment Facility was conducted and upgrades began. Both facilitiesthrough the 2010’s continue to address aging equipment with the focus in the next couple years beingthe aerations systems.
In 2001 the Town of Raymond became the tenth member of the District; water service in the Townbegan in 2002.
A focus on aging water mains began in 2011 with the Board committing to double the main renewalbudget by 2016. In 2014, the Board established a capital reserve fund that will provide an additional $2million available for main renewal. A $6.5 million investment in water main replacement is budgeted for2015. Also, new regulation required a second water treatment process be installed. An ultraviolettreatment process was implemented in 2014 with the full operating budget impacting 2015.

13 Introduction
Top Reasons to Choose Portland, Maine Now
Portland is Maine's business, financial and retail capital and the largest city in the state. Seascapes andcityscapes blend harmoniously in Portland, perched on a peninsula, jutting out into island-studded CascoBay. The metropolitan hub of Maine's south coast region, Portland is a progressive, lively cityincorporating the character of yesteryear into a modern urban environment. Historic architectureblends gracefully with the new as you stroll along her working waterfront or the cobblestone streets ofthe restored Old Port section of the city. With a metro population of 230,000, the Greater Portland areais home to almost one quarter of Maine's total population.
High quality water delivered to homeowners/businesses and cleaned wastewater delivered back to theenvironment is a key expectation of our customers. Being a desirable place to visit during the summercontributes to variance in customer’s water consumption by almost 40% between winter and summermonths. With a relatively high concern for the environment, customers support our efforts to protectour watershed and realize the importance of wastewater treatment in protecting our coastal waters.
Good Place To LivePortland was named 2014's 19th Most Educated Metro Area in a
recent study from the personal finance outlet WalletHub.com.
Portland Named One of America’s Most Learned Cities Back-to-School Report gives high ranks for Portland’s educated residents
This month, CardHub released its Back-to-School Report, whichidentifies cities and states with the best learning environmentsfor children. The report listed Portland, Maine as one of twentycities in the country that had the most highly educated citizens.
9/4/2013
Parenting Magazine named the City of Portland the 3rd Best Cityin the U.S. for Families. Citing the city’s low crime, quality
education, and active family living, the magazine describedPortland as a “tranquil, kid-friendly city to call home.” 7/17/
2012
Concerned About theEnvironment
Portland Ranked Seventh “GreenestCity” in the United States, according
to the readers of Travel & LeisureMagazine. 4/4/2012
Women’s Health Magazine ranksPortland #10 - reflecting efforts tomake it easy to live healthy active
lives in Maine’s largest city01/18/2013
Good place to VisitIn total, the City’s port will host a 15% increase in
passengers this year with 74 cruise ship visits and morethan 82,000 passengers between June and November
Portland Metro Region one of the Best Restaurant Areasin the Country
Online magazine ranks the Portland-Lewiston area eighthbest restaurant city with the most eateries per capita
1/25/2013
Portland Receives Top Marks from National GeographicTraveler 11-2008
Economic Hub of MaineForbes Ranks Portland Area in Top 10 for Job
Prospects. 3/3/2012
Techie.com Lists Portland, Maine as One ofits 10 Most Unexpected Cities for High-Tech
Innovation Techie.com asked innovators,entrepreneurs, and city leaders this
question: "What are the most unexpectedcities that are leading the high-tech
revolution?" 4/8/2013

14 Introduction
Portland Economic Scorecard 2014-2015
The Portland Community Chamber issued ‘Portland’s Economic Scorecard 2014’ to help understand howPortland is performing economically. Summary table below and selected charts are included in theAppendix. The scorecard indicates a relatively healthy economy with low unemployment and householdincome keeping up. Long-term employment and population growth is a concern. The tourist businesscontinues to be strong.

15 Introduction
The Regulatory Environment in Which We Function
The Portland Water District functions in a highly regulated environment. Its operations are regulated byfederal, state and local government, and by a variety of government agencies. The laws and regulationscreated and implemented by these layers of government affect not only the District’s direct operationsin a regulatory sense, but its budget as it complies with various government directives.
The District’s water operations are governed at the federal level by the Safe Drinking Water Act (SDWA).Originally enacted in 1974, the SDWA allows the Environmental Protection Agency (EPA) to promulgatenational primary drinking water regulations to regulate contaminants that may pose health risks andthat are likely to be in the public water supply. Under the SDWA, EPA establishes a maximumcontaminant level standard that regulates physical, chemical, biological and radiological substances inthe drinking water supply. The best available technology and treatment techniques that areeconomically and technically feasible must then be used to meet this standard.
The SDWA allows the EPA to delegate to the states the primary oversight and enforcement of the law(primacy) to the state if the state meets certain requirements. The state of Maine has received primacyand its oversight and enforcement program is administered by the Department of Health and HumanServices Drinking Water Program.
Wastewater regulation falls under the provisions of the federal Clean Water Act (CWA). Passed in 1972,with significant amendments in 1977 when it became known as the CWA, it is implemented andenforced by the EPA and the Army Corp. of Engineers. The CWA establishes the basic structure forregulating pollutants discharging into the waters of the United States. It gives the EPA authority toimplement pollution control programs, such as setting wastewater standards for industry. The CWAmakes it unlawful to discharge a pollutant into navigable waters without a permit (National PollutantDischarge Elimination System Permit (NPDES)).
As with the SDWA, the CWA provides that the EPA will create rules to implement the law, and willdelegate to the state the administration and enforcement of the law on a day-to-day basis. In Maine,the Department of Environmental Protection (DEP) has been delegated this function, with EPA retainingconcurrent authority to take enforcement action. The DEP has more stringent monitoring requirementfor biosolids, whole effluent toxicity and mercury than the requirements established by EPA. TheDistrict’s treatment plants must obtain a discharge permit issued by the DEP utilizing those stricterrequirements.
In addition to the environmental regulations which govern the District’s operations, the District’s waterbusiness is also regulated by the state Public Utilities Commission and a system of Maine law found intitle 35-A of the Maine Revised Statutes, designed to regulate the District’s standards of service andwater rates. The Public Utilities Commission regulates the District’s water business operations throughreview and approval of the District’s Terms and Conditions of Service, and establishes the rates theDistrict charges for its water services. State law and regulations enacted by the Commission alsoregulate service standards for water utilities, as well as standards for construction, water mainextensions and service lines.

16 Introduction
The Regulatory Environment in Which We Function (continued)
Local government regulations affect the District’s construction activities, as the District must complywith street opening requirements in the municipalities where it conducts construction or repairoperations.
The annual costs for the District’s wastewater operations are determined pursuant to the terms of itscharter, enacted by the Maine Legislature (Ch. 84, P. & S.L. 1975 as amended through Ch. 18, P. & S.L.2009). The District’s charter provides that prior to January 15 of each year, the District shall determinethe total anticipated amount to be raised from the participating municipalities based on the trustees’best estimate of the cost of providing for the operation of the wastewater and sewage systems for thefiscal year. The amount assessed to the municipalities includes: regional costs, financing costs andoperation and maintenance costs. Municipalities are advised of their yearly assessments by the Districtand establish their respective sewer user rates considering the District’s assessment and the costs ofmaintaining their respective sewer collection systems. The District’s charter governs the manner ofassessing participating municipalities and the treatment of any surplus funds existing at the end of acalendar year.
Water Rate Change Process
In 2015, the District intends to file for a request a 3.8% rateadjustment. State law (Title 35-A, Chapter 6104) outlines theprocess. The chart on next page outlines the regulatory process.
A new Public Utilities Commission rule (chapter675) allows forthe creation of a capital reserve fund starting in 2014. The fundcan be used to pay costs related to water infrastructure. Forutilities our size, an additional 10% over other costs may beincluded in justifying proposed water rates. A systeminfrastructure assessment (SIA) must be submitted prior togetting approval to fund the reserve. The SIA would include thelist of infrastructure projects that will be funded from thereserve. Annual updates of the status of the projects andreserve fund balances are required. The District filed the SIA inOctober 2013 and has incorporated funding the reserve bydesignating 1% of the proposed 3.8% rate adjustment for thereserve.
Act to Reform Regulation ofConsumer-Owned Water Utilities
In 2014, a state law was enacted(chapter 6114) allowing the StatePublic Utilities Commission to exemptcertain individual utilities from stateregulation, if requested by the utility,or classes of utilities. The Commissionbegan a rule-making process outlininghow the law would be implemented.
It is expected the proposed rule willgo into effect in 2015. The Districtintends to file for exemption forcertain state regulations andimplement local rules.
The changes may include allowingwater rate changes and bondissuance authorization be approvedsolely by the District’s publiclyelected officials without statecommission review.

17 Introduction
The Regulatory Environment in Which We Function (continued)
Consumer-Owned Water Utility – Rate Case Process

18 Introduction
Organization Structure
The Portland Water District is overseen by an 11-person Board that is publically elected. The Boardappoints a General Manager, who oversees the daily operation of the District. Operation is comprised offive departments – Water Services, Wastewater Services, Environmental Services, Engineering Servicesand Administrative Services.
53
39
15
30
41
53
39
15
30
41
0
10
20
30
40
50
60
Water Wastewater Environmental Engineering Administrative
Authorized Numberof Employees
2015 2014
Water Services provides water treatment and distribution system operation and maintenance.
Wastewater Services provides wastewater treatment and interception/collector systemoperation and maintenance services.
Environmental Services provides watershed protection and laboratory services.
Engineering Services provides general engineering, facilities and vehicles maintenance services.
Administrative Services provides customer, computer, finance and general managementservices.
A more detail organization chart and description of services provided are provided in the OperatingExpense section.
Board ofTrustees
GeneralManager
Water ServicesWastewater
Services
AssetManagement &
Planning
EnvironmentalServices
EngineeringServices
AdministrativeServices

19 Introduction
Annual Planning/Budget Process
An outcome of the annual planning/budget process is a document that outlines the financial andoperational plan for the upcoming fiscal year. The resulting annual operating and capital plan providesan overview of the resources expected to be available and how those resources will be used. Decisionsmade in developing the annual plan incorporate information from other planning processes and sourcesincluding the following:
Other Planning Processes and Information Sources: Budget Document Location:
Mission Statement and Strategic Goals. At the beginning of theannual budget process, management reviews and updates ourmission statement and strategic goals. One focus of the review wasto identify how resources allocation decisions should be different.
Introduction Section,Mission Statement and StrategicGoals
Annual Budget Guidelines by Board. Broad guidelines wereestablished providing important budget parameters.
Introduction Section,Board Established Annual BudgetGuidelines
External Factors. A review of the industry, economic, andstakeholders’ trends provided information to make better planningdecisions.
Introduction Section,External Factors Impacting theBudget
Multi-Year Ratemaking Revenue Projections. Water revenues andwastewater assessments projections are made for three years toassist in rate making. The proposed budget is consistent with theprojections.
Individual Fund Projection in theBudget by Fund Section.Summary is included in theRevenue Section.
Capital Master Plans and Asset Evaluations Studies. Proposedbudget incorporates recommendations from the variousinfrastructure plans/studies.
Capital Expenditures Section,Infrastructure and OperationalEvaluation Plans
Customer Satisfaction Survey. A review of the customer satisfactionsurvey’s results provided guidance on how best to allocate resourcesin the upcoming year.
Appendix Section,Customer Satisfaction Survey
Workforce Management. As part of the review of current employeedemographics and future employees’ needs, action steps wereidentified. The budget incorporates those action steps.
Human Resource Section,Workforce Management
Financial Policies. Financial policies were reviewed to assure budgetdecisions were made consistent with good financial standards.
Financial Policies Section

20 Introduction
Planning/Budget Process CalendarThe outline below illustrates the process used to arrive at an adopted budget. The only legalrequirement is that wastewater communities must be assessed the budgeted operating budget byJanuary 15th.
May8 Senior Management Team reviews budget process and timeline; stakeholders input;
and external factors impact impacting budget, major policy and resource allocation issues;significant budget uncertainties; and long-term and short-term goals.
26-30 Senior Managers host meetings with Department Managers to review budget parameters andprocess
June20 Department Managers submit first draft Operating Budget and conceptual-level Capital & Non-
capital projects and initiatives
July8 Board review Staff’s recommended guidelines and provides policy and high-level direction for
the Budget.17 Senior Management Team provides feedback on first draft submittal and Board feedback25 Department Managers submit second draft Operating Budget and preliminary-level Capital &
Non-capital projects and initiatives.
Aug18-22 Department Managers present second draft Operating and Capital budget to the Senior
Management Team.
Sep12 Department Managers submit third draft Operating Budget and Capital &Non-capital projects
and initiatives.
Oct27 Budget is presented to the Board of
Trustees.
Nov10 Department presents Operating Budget
and Capital & Non-Capital projects andinitiatives to their respective BoardCommittee. Full Board reviews the Five-Year Capital Improvement Plan.
24 Board considers adopting budget.
Board Committees’ Department ReviewResponsibility
Administration and Finance – Executive Office,Customer Services, Information Services,Financial Services and Employees Services.Operations – Water Services and WastewaterServicesPlanning – Environmental Services andEngineering Services
Wastewater Communities: The proposed Wastewater Assessment to each municipality is presented
and reviewed with each municipality at meetings scheduled between October 27 and November 10. By
January 15, 2015, the District notifies the municipality of certified assessment amount.

21 Introduction
Mission Statement
The District’s mission is to protect public health, safety, and the environment by providing ourcustomers with reliable and affordable water, wastewater and related services. In order to fulfill themission, the following six strategic goals have been established.
Goal 1 - Public Health:
The District will provide products and services that meet all federal, state and local qualitystandards.
Goal 2 - Public Safety:
The District will design and maintain its water system to meet modern firefighting needs.
Goal 3 - Environment:
The District will promote the sustainability of natural resources within Casco Bay watershed.
Goal 4 - Reliability:
The District can be trusted to provide its products and services in a manner that meets allreasonable customer expectations.
Goal 5 - Affordability:
The District will balance the delivery of products and services with customers’ ability to paywater and wastewater rates and charges.
Goal 6 - Employees and Work Environment:
The District will have well trained and satisfied employees who will work in a safe and workenvironment conducive to productive work.
Strategic benchmarks have been created to indicate the District’s performance over the long-term. Theimpact of variations in benchmarks performance is best understood looking at the long-term trend.Additional background explanation of the strategic goals and benchmarks with the impact to the budgetare provided on the next six pages.
Annual objectives and tactical benchmarks are established to guide and monitor annual performancetowards meeting our strategic goals - see individual departments’ objectives and benchmarks in theOperating Expenses section.

22 Introduction
Strategic Goals
Strategic Goal 1: Public HealthThe District will provide products and services that meet all federal, state and local quality standards.
Background
The District’s water operations are governed at the federal level by the Safe Drinking Water Act (SDWA).Ensuring compliance with the SDWA requires short- and long-term initiatives aimed at protecting,monitoring, and treating for water quality from the source to the tap. Protecting the source begins withprotecting the watershed, and protecting the watershed begins with protecting the forest’s naturalability to produce clean water. Therefore the District’s approach to protecting public health includesprograms aimed at promoting forest conservation, monitoring and inspecting development in thewatershed, monitoring the water quality of the lake and its tributaries, providing security of the areaaround the intakes, and performing education/outreach to keep the public involved in the process.
Strategic Benchmarks (updated periodically):
The District is in compliance with all regulatory standards. Two key measures are the quality of thesource water in Sebago Lake and the ability to maintain an adequate level of disinfectant throughout thedistribution system. The state of the lake is indicated by the Trophic State Index - an index that trackswater clarity along with the amounts of phosphorus and algae in the water. The current trophic statefor Sebago Lake is good for drinking water quality. Chloramines are added to maintain a level ofdisinfectant throughout the distribution system. The level of chloramines are measured weekly at forty-three locations throughout the service area, and the treatment process is adjusted continuously tomaintain desired levels.
Benchmarks: 1998 2003 2008 2013
Percent of Days in Compliance with Water Regulations 100% 100% 100% 100%
Water Quality: Sebago Lake Trophic State Index (goal – 24 to 32) 31 27 30 32
10th Percentile Chloramine Residual (goal 0.4 mg/L) N/A N/A 0.2 mg/L 0.3 mg/L
Land in Conservation in the Watershed N/A 0 350 1100
Service Area Communities served by Education/Outreach Programs N/A N/A 10 11
Security (violations per 1000 visitors) N/A N/A 12 7
Current Status, Challenges and Impact to Current Budget:
The District is working in partnership with the Cumberland County Soil and Water Conservation Districtand the Department of Environmental Protection to develop a watershed-based management plan toprioritize future conservation and erosion control work.
An allocation of $2,000,000 has been made for the design process of the 407 pressure zone upgrade,which will eventually include the replacement of Windham Center tank and the installation of a newpump station in the area of Ward’s Hill to replace both Gorham and Prides Corner Pump Stations.
23 Introduction
Strategic Goal 2: SafetyThe District will design and maintain its water system to meet modern firefighting needs.
Background
One of the original reasons the District was created was to provide adequate water volume and pressureto combat fires.
A common benchmark measuring the fire-fighting capability is the community’s public protectionclassification, a numerical grade given by the Insurance Service Office (ISO). The classification isdeveloped based on grades given the community’s fire department (60%) and water supply (40%)systems. The District is mainly responsible for the water supply system within our service territory. Theclassification is developed by the ISO, an international firm that provides information regarding propertyand liability risk.
Strategic Benchmarks (periodically by ISO):
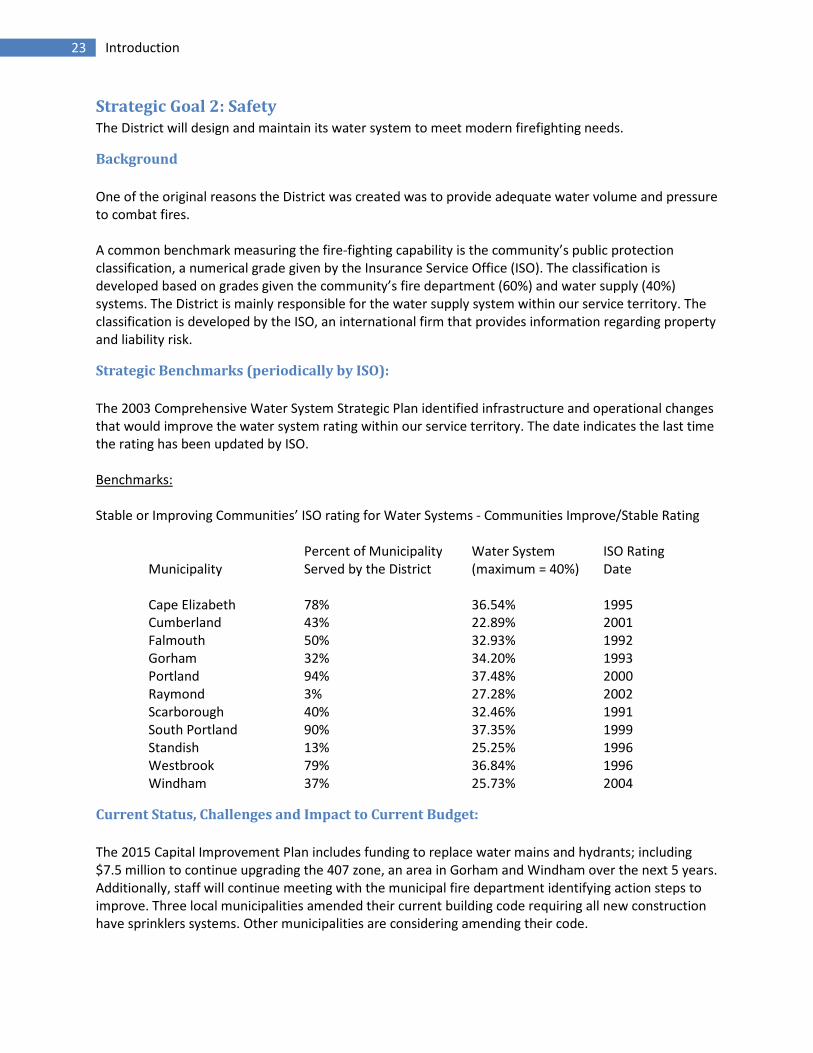
The 2003 Comprehensive Water System Strategic Plan identified infrastructure and operational changesthat would improve the water system rating within our service territory. The date indicates the last timethe rating has been updated by ISO.
Benchmarks:
Stable or Improving Communities’ ISO rating for Water Systems - Communities Improve/Stable Rating
MunicipalityPercent of MunicipalityServed by the District
Water System(maximum = 40%)
ISO RatingDate
Cape Elizabeth 78% 36.54% 1995Cumberland 43% 22.89% 2001Falmouth 50% 32.93% 1992Gorham 32% 34.20% 1993Portland 94% 37.48% 2000Raymond 3% 27.28% 2002Scarborough 40% 32.46% 1991South Portland 90% 37.35% 1999Standish 13% 25.25% 1996Westbrook 79% 36.84% 1996Windham 37% 25.73% 2004
Current Status, Challenges and Impact to Current Budget:
The 2015 Capital Improvement Plan includes funding to replace water mains and hydrants; including$7.5 million to continue upgrading the 407 zone, an area in Gorham and Windham over the next 5 years.Additionally, staff will continue meeting with the municipal fire department identifying action steps toimprove. Three local municipalities amended their current building code requiring all new constructionhave sprinklers systems. Other municipalities are considering amending their code.
24 Introduction
Strategic Goal 3: EnvironmentThe District will promote the sustainability of natural resources within the Casco Bay watershed.
Background
The District treats and returns to Casco Bay watershed 23 million gallons of wastewater each day. Thedischarged wastewater must meet certain wastewater regulations. Wastewater regulations fall underthe provisions of the federal Clean Water Act (CWA). Passed in 1972, with significant amendments in1977 when it became known as the CWA, it is implemented and enforced by the EPA and the ArmyCorp. of Engineers. The CWA establishes the basic structure for regulating pollutants discharging into thewaters of the United States. It gives the EPA authority to implement pollution control programs, such assetting wastewater standards for industry. The CWA makes it unlawful to discharge a pollutant intonavigable waters without a permit (National Pollutant Discharge Elimination System Permit (NPDES)).
The CWA provides that the EPA will create rules to implement the law, and will delegate to the state theadministration and enforcement of the law on a day-to-day basis. In Maine, the Department ofEnvironmental Protection (DEP) has been delegated this function, with EPA retaining concurrentauthority to take enforcement action. The DEP has more stringent monitoring requirement for biosolids,whole effluent toxicity and mercury than the requirements established by EPA. The District’s treatmentplants must obtain a discharge permit issued by the DEP utilizing those stricter requirements.
Strategic Benchmarks (updated every 5 years):
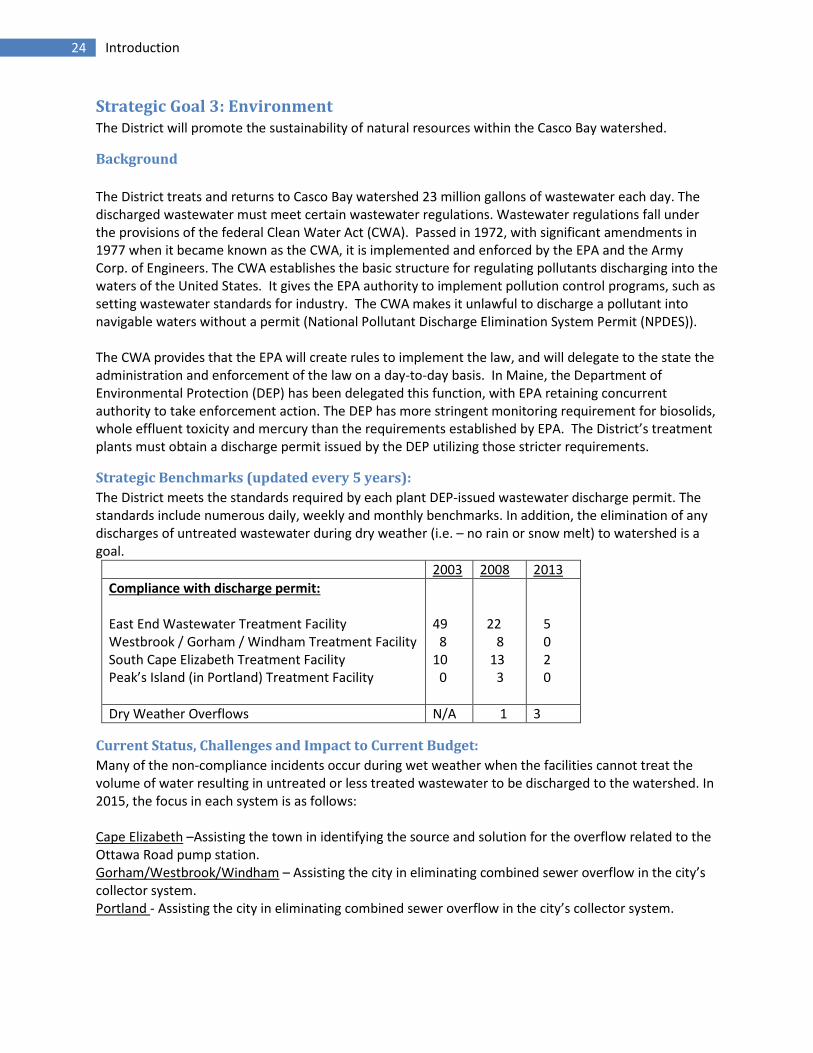
The District meets the standards required by each plant DEP-issued wastewater discharge permit. Thestandards include numerous daily, weekly and monthly benchmarks. In addition, the elimination of anydischarges of untreated wastewater during dry weather (i.e. – no rain or snow melt) to watershed is agoal.
2003 2008 2013
Compliance with discharge permit:
East End Wastewater Treatment FacilityWestbrook / Gorham / Windham Treatment FacilitySouth Cape Elizabeth Treatment FacilityPeak’s Island (in Portland) Treatment Facility
498
100
228
133
5020
Dry Weather Overflows N/A 1 3
Current Status, Challenges and Impact to Current Budget:
Many of the non-compliance incidents occur during wet weather when the facilities cannot treat thevolume of water resulting in untreated or less treated wastewater to be discharged to the watershed. In2015, the focus in each system is as follows:
Cape Elizabeth –Assisting the town in identifying the source and solution for the overflow related to theOttawa Road pump station.Gorham/Westbrook/Windham – Assisting the city in eliminating combined sewer overflow in the city’scollector system.Portland - Assisting the city in eliminating combined sewer overflow in the city’s collector system.

25 Introduction
Strategic Goal 4: ReliabilityThe District can be trusted to provide its products and services in a manner that meets all reasonablecustomer expectations.
Background
The state has granted the District the exclusive authority to provide public drinking water service andwastewater treatment/interceptor service to customers in our service territory. Customers andregulators assume we will provide appropriate service 24/7. Water service standards are established bythe Maine Public Utilities Commission and Department of Human Services; including standards relatedto customer and billing service. Wastewater service standards are established by the Maine Departmentof Environmental Protection.
Strategic Benchmarks (updated every 5 years):
The District conducts a formal customer satisfaction survey periodically. Customers expect us to providetwo basic services reliably – to provide water to customers’ homes and to treat wastewater delivered toDistrict’s system.
Current Status, Challenges and Impact to Current Budget:
The last formal customer satisfaction survey was received early 2012. The survey indicated thatcustomers are generally pleased with the level, quality and reliability of the water and wastewaterservices provided. Items identified to improve upon include creating an internal customer servicerecognition program, reviewing our new customer process for ways to improve the process, expandingcustomer service on-line services, promoting the District through a community outreach program andpromoting the value of water. The 2015 budget includes conducting a new survey
In 2015, several significant water system projects/programs that will increase reliability are the $6.5million investment in aging water mains, which will reduce main failures and the focus on addressing firehydrants that are out-of-service. Significant wastewater system projects/programs that will increasereliability include the purchase of additional backup generators for pump stations to provide reliablesource of electricity during bad weather events and continue implementation of monitoring devicesthroughout the system that allows the remote monitoring of facilities and prompt response to systemproblems.
2003 2008 2013
Water Service failure per million hours of available service -Total Customer Outage Hrs. / ((51,296 X 365 X 24) / 1,000,000)
15.8 15.7 9.4
Wastewater Reliability Index – WW Systems infrastructurethat is In Service Full (ability to deliver design flow)
WW Systems and Pumping Stations convey flow to treatmentplants
WW Treatment Plants available to treat flow
Notavailable
Notavailable
98.6%
100%
99.6%
100%
Customer Satisfaction Survey Results 89% 85% 87%

26 Introduction
Strategic Goal 5: AffordabilityThe District will balance the delivery of products and services with customers’ ability to pay water andwastewater rates and charges.
Background
An industry affordability benchmark is to compare the typical household bill as a percent of medianhousehold income. The national standard is the utility bill is considered affordable if the annual bill isless than 2% of median income. The District water rates are well below the affordability standard withthe typical household paying only 0.46% of median income. The Board established target is not toincrease water rates greater than the rate of inflation. Since 1998, water rates are significantly belowthat target.
The Board’s policy is to increase assessment to municipalities for wastewater service at or below therate of inflation. Costs related to municipal requests for additional/expanded service and federalunfunded regulations may result in higher assessment.
1998 2003 2008 2013
Water Rates for a Typica l 3-person household
as a percent of Median Income0.52% 0.42% 0.41% 0.46%
Water Revenue per Typica l Customer Actua l $ 228.12 $ 210.72 $ 221.64 $ 254.16
Inflation Adjusted $275.16 $309.67 $336.05
Wastewater As sessments : 2013 vs 1998
Cape El i zabeth 944,000$ 863,052$ 1,049,052$ 1,365,084$ 45%
Cumberland 315,800$ 498,144$ 764,236$ 713,940$ 126%
Gorham 428,200$ 490,608$ 924,732$ 1,084,464$ 153%
Portland 6,972,900$ 8,753,220$ 9,951,852$ 10,540,044$ 51%
Westbrook 1,588,300$ 1,599,100$ 1,800,540$ 2,533,176$ 59%
Windham 46,000$ 45,996$ 214,320$ 351,756$ 665%
Current Status, Challenges and Impact to Current Budget:
Water rates are assumed to increase by 3.8% effective May 1, 2015. Since 1998, water rates aresignificantly below the long-term inflation rate. The proposed increase is consistent with the Board ofTrustees’ direction to have small incremental water rate increases annually. Increases are needed tomeet the increasing capital costs to replace aging water mains, upgrading the disinfection facilities withultraviolet protection, funding a new capital reserve fund and funding an adequate contingency fund.
Wastewater assessments remain the same between 2015 and 2014 for all municipalities except for CapeElizabeth and Portland. Assessment increase in Portland (1%) is below the rate of inflation. CapeElizabeth’s assessment increase (2.5%) is slightly higher due to municipal requested project – GardenLand pump station upgrade.
Wastewater assessments have increased near or slightly above the rate of inflation (47%) since 1998except in Cumberland, Gorham and Windham. Gorham’s and Windham’s higher increase reflects theirrequest to expand the sewer system by connecting the Little Falls area to the Westbrook regionaltreatment facility. Cumberland’s increase is attributed to higher assessment from the town of Falmouth.The District’s share of the assessment has increased 51%. To mitigate the upward pressure ofassessments, the wastewater services area have reorganized its staff and continue to review processesand procedures to become more efficient.

27 Introduction
Strategic Goal 6: Employees and Work EnvironmentThe District will have well trained and satisfied employees who work in a safe and productive workenvironment.
Background
Since 1995, a periodic survey of all employees is conducted. The survey provides employee feedback onthe work environment including questions related to compensation, management and policies.
The premium paid on workers compensation is partially based on a modification factor (MOD). Thefactor compares the District injury rate with other organizations with similar risk exposure. The Districtseeks workers’ compensation injury rate that is no higher than industry average (i.e. – a rating of 1 orless).
Finding time for training is an important goal. The goal that has been established is an average of 80training hours per employee.
Strategic Benchmarks (updated every 5 years):
1998 2003 2008 2013
District’s biennial Employee Satisfaction Average Score -Range 1 (lowest) to 6 (highest)
3.52 4.02 4.42 4.48
Workers’ Compensation Modification Factor – 1.00 =Industry average (goal is less than 1)
1.62 0.99 1.06 1.06
Average Training Hours Per Employee – current goal is 80hours
22 55 83 105
Current Status, Challenges and Impact to Current Budget:
In 2013, a survey of employees was conducted. The average score improved to 4.48.The survey wasconducted using a web-based survey tool that provides confidentiality with minimal costs. Based on thesurvey results, three areas that will be focused on in the upcoming year are: inconsistent application ofpolicies, fairness of decisions regarding promotion and value of the employee evaluation process. Assurveys have traditionally been conducted every other year, another employee survey will be done in2015.
The current workers’ compensation modification factor indicates that our injury rate is slightly aboveaverage for our industry (last 10 years average is 1.07; 2014 factor increased to 1.15).
Efforts continue to build a stronger foundation for our safety efforts. Performance appraisals for 2013will incorporate expanded expectations for our non-union staff. Labor contract negotiations at the endof 2012 addressed expanded expectations for forepersons. In 2014, we will also strengthen our incidentinvestigation process to ensure improved data collection to aid job hazard prevention.
Management development and consistency of practice efforts continue through “Lunch and Learns”.This effort impacts both our training and employee satisfaction goals.

28 Introduction
Board Established Annual Budget Guidelines
To help guide staff, the Board of Trustees set four guidelines for the budget process.
The Guideline is established to limit growth of the budget to a reasonable growth level not exceedingthe inflation rate. The limit can be exceeded if a municipality requests expansion of service or servicelevel. Proposed budget is $39 million, almost $0.6 better than Board guideline.
Guideline Capital expenditures will be consistent with the levels recommended in the Waterand Wastewater system plans.
A guideline was established to assure capital projects are consistent with various plans including theWater Master Plan, Comprehensive Plant and System plans, and Combined Sewer Overflow plans. Theproposed capital expenditures meet the guidelines – see Infrastructure and Operational EvaluationPlans in the Capital Expenditures section for details.
Guideline The Operating Funds' Budget will not increase more than the rate of inflation overthe long-term. The annual target is rate of inflation plus any unfundedfederal/state/local mandates and funding for water main renewal of up to 1% ofwater revenues. Assuming a 2.2% inflation rate plus 0.5% increase due to the watertreatment plant upgrade required by EPA and Portland’s Peak Island sewer extensionrequest, the 2015 operating budget target increase was established to not to exceed3.4%. The resulting budget target of $39.58 would be almost $3.0 M less than thebudget would be if it increased at the rate of inflation.

29 Introduction
Board Established Annual Budget Guidelines (continued)
Guideline Water Revenue Requirement and Wastewater Assessments increases will not exceedthe rate of inflation excluding the impact of mutually agreed upon changes inservices, capital investments, surplus fund utilization or Board’s request to increasesurplus balance.
All Wastewater assessments and Water Rates Increases meet or are below the Board of Trusteestarget. Cape Elizabeth’s target is slightly above the inflation rate primarily due to additional televisioninspection work. The significant change between the Cumberland’s target and proposed assessment isdue to a delay of the Mill Creek Capital project. Water rates are scheduled to increase 3.8% in 2015equal to the Board’s target (2.2% inflation + 06% Ultraviolet treatment plant upgrade mandated byFederal Law + 1% for water main capital reserve fund contribution).
Salary and benefits are one of the District’s most significant costs. To control costs, a targetedheadcount is established. The proposed budget contains 178 employees and 196 full-time equivalentemployees – meeting the Goal.
221216
203
196190 189 189 190 190 190 191 190 188
180 178 178 178 178 178 178
212 211 209 209 209 210 210 209
196 196 197 197 196 196 196
160
170
180
190
200
210
220
230
1996 1999 2002 2005 2008 2011 2014
Head Count
Full Time Equivalent
Guideline The number of employees will not exceed 178 and the -time equivalency (FTE) willnot exceed 196.

30 Introduction
External Factors Impacting the Budget
EconomyThe local economy continues to make slow improvement from the national recession. Stateunemployment remains elevated at 5.6%, which is better the prior year’s rate of 6.7% (as of July 2014).The rate for most of the past 18 years the rate has been below 5.5%. However, the unemployment rateis better than national unemployment rate of 6.1%. Greater Portland’s unemployment rate is 4.4%,which is 1.1% better than last year.
Greater Portland’s real estate market continues to rebound. In 2013, the number sales returned to thelevel prior to recession and year-to-date 2014 sales are 5% higher than 2013. In the 2015 budget, thewater consumption projection includes the number of households as of July 31, 2014 and assumes nocustomer growth. A typical year’s growth in new customers is 1.5% (750 accounts).
The recession impacted the financial markets, resulting in continued lower interest earning oninvestments and interest expense on debt. The 2015 budget includes a $9,509, or 14% reduction, inearnings from operating funds investments as older investment mature and reinvested in investmentswith lower interest rates.
The strong equity market increase partially mitigated the impact of negotiated union pension increase.Also, a more modest investment policy was adopted - expected future returns reduced to 7% from 7.5%.The 2015 annual required contribution to our pension plans is $1,000,000, which is $74,000 or 8%higher than the prior year.
The chemical, metal and fuel commodity market prices are impacted by the economy’s health and havebeen volatile in the past couple of years. With the slower economic growth, the lower demand forchemicals has resulted in lower per unit prices for chemicals purchased by the District. Approximately10% of the District’s expenses are related to chemical, metal and fuel markets. The 2015 budget reflectsthe commodity prices available in mid-2014.
Regulatory MandatesThe water and wastewater industry must comply with various federal and state regulations with two ofthe most important regulations being the Safe Drinking Water Act (SDWA) and Clean Water Act (CWA).The current regulatory focus is compliance with the long-term surface water disinfection rule under theSDWA and the combined sewer overflow requirements under the CWA. The 2015 Budget includes theimpact of debt service of $12 million in capital expenditures and approximately $200,000 in operatingexpenses addressing these two focus areas.
Water ConsumptionThough the District has ample supply ofwater, consumers have reduced their waterconsumption. Since 2000, the averageresidential household usage (HCF) hasdeclined by more than 15%. Some of thereasons are rising wastewater feesencouraging conservation and the availabilityof more water efficient household appliances.
5
7
9
11
2000 2002 2004 2006 2008 2010 2012
Average Residential Usage PerMonth(in Hundred of CubicFeet)

31 Introduction
Significant Budget Uncertainties
During the budget development, certain assumptions are made. Several budget areas have significantuncertainties including the following:Salaries and Wages ($10.18 million or 26.1% of total budget). The latest three-year union contract iseffective from November 2012 to October 2015. The union wage rates, which include a 2.0% increase inNovember 2014, are known for most of budget year.
We assumed a similar increase for the final two months of the year not covered by this contract. Thenon-union pay rates were assumed to increase by 2.0% and will be in place all of 2015 although the finalfigure will not be decided until January 2015. A 1.0% variance would be approximately $40,000.
In addition, the budget assumes 14,623 hours of overtime and double time pay. The amount of overtimeand double time is directly related to amount of emergency repair work that is needed. For everyadditional 1,000 hours of overtime/double time pay, costs increase by approximately $35,000.
Purchased Power ($1.79 million or 4.6% of total budget). The District’s contracts for electricity currentlyextend through the end of 2016 on large and medium accounts. The unit price will be stable for allaccounts except the Water Treatment facility. Approximately one third of the Water Treatment facility’suse will pay the current day’s market rate, which historically ranges from 3 to 11 cents. The actualamount of electricity varies primarily based on weather conditions which impacts the amount of waterproduced and wastewater processed. Since 2007, the variance between the highest and lowest kilowattamount of electricity for individual accounts in total is 12%, which would impact the budget byapproximately $250,000.
Chemicals ($1.07 million or 2.7% of total budget). The chemical contract is put out to bid eachDecember. Prices used for the budget were estimates using the June market prices. Chemical priceshave been volatile and have reacted to the global/national economy.
Heat & Vehicle Fuels ($0.80 million or 2.1% of total budget). The prices assumed for heating oil andvehicle fuel in the budget are the actual rates through September 2015. The prices for the final quarterof 2015 are estimated. In addition the price for natural gas, which is used for heat at the East EndWWTF and is budgeted for $130,158 in budget, is still under negotiation as of the publication of thisbudget. Also, the quantities budgeted are based on past historical usage and may vary.
Combined Sewer Overflow Plans The District and Cities of Westbrook and Portland and Town of CapeElizabeth have or are in the process of developing plans to address combined sewer overflows. TheDepartment of Environmental Protection will review the plans and could require changes to the plansthat may require significant unplanned operating expenses and capital expenditures in 2015. The 2015plan contains the costs to comply with the proposed plans.
Weather The weather is a noteworthy determinant of operating expenses. The timing and duration ofbelow freezing weather impacts the number of water main and service leaks. The amount of snowfalland timing of snow melt and rainfall impacts the amount of storm water that must be pumped to andtreated by wastewater plants. The duration of hot summer days impacts the amount of water to beproduced by the water treatment facility. For the 2015 budget, the past three-year average of waterproduced and wastewater treated was assumed for operating expenses projections.

32 Introduction
Major Policy and Resource Allocation Decisions
Operating Budget
Overall Budget As noted above, the Board established an overall operating budget cap of 2.2% greaterthan the 2014 budget and authorized head count to be no more than the current level of 178. Withessentially the same level of resources, the major decisions related on how best to provide current levelof service with the existing resources.
Personnel Continued focus on reducing the amount of premium (i.e. overtime, double time, etc.)compensation was made while planning for 2015, including the $3,033 reduction in the 2015 budget.Over the past three budgets premium time has been reduced from $551,043 in the 2012 Budget to$514,502 in the 2015 Budget without reducing service levels.
In 2015, Water and Wastewater Services continues to make staff changes that are consistent with thegoal of creating positions whose job responsibilities are defined more broadly. This long-term goalcreates a more versatile, responsive work force and requires improved information sharing systems andprocesses. The 2015 budget includes 13 entry level positions (nine in Water and four in Wastewater)that begin their career by rotating through different areas of the company. Also, six seasonal positionsincluded in the budget to promote the District and industry to young students.
Overall, the 2015 budget continues our emphasis on training employees with the continued goal ofproviding an average of 80 hours training.
Employee Benefits The most costly employee benefits are health insurance and pension benefits. In2015, the employees’ co-pay percent was increased to 5.0% from 4.0%, resulting in a savings of almost$16,000. The defined benefit plan contributions in the 2015 Budget increased $74,000 (8.0%) to$1,000,000. The contribution is consistent with Board adopted long-term funding policy and estimatedby the District’s actuary. The actual actuarially determined contribution will be calculated early2015. The plan is solely funded by the District without any employee contribution.
Wastewater Sewer Lines Inspection In 2008, a commitment was made to inspect all sewer lines at leastonce every 10 years. Almost $65,250 was allocated in 2015 to meet that commitment.
Water System Flushing Starting in 2012, a renewed effort was made to flush the whole distribution overa 3-year cycle. Flushing the system improves the water quality in the distribution system. The2015budget continues this effort by allocating close to $125,000.
Renewal and Replacement The annual commitment for water mains is an increase in $200,000 or from$4,602,950 to $4,866,342.
33 Introduction
Major Policy and Resource Allocation Decisions (continued)
Capital Projects
The 2003 water strategic master plan noted that a considerable amount of water mains will be reachingthe end of their useful life in the next 20 years. In 2015, the amount dedicated to replace aging watermains will increase by $0.5 million to a total of $6.5 million. Water Services and Engineering Servicesstaff will allocate significant resources to manage these projects. Water Services has included additionalmoney to outsource tasks to the private sector, enabling staff to allocate additional time for water maininspection.
Significant capital projects include the following:
Water Treatment plant upgrade: New regulations are requiring the District construct a secondtreatment process to provide extra assurance that safe water is delivered to customers. A studyconcluded in early 2010 that an ultraviolet treatment process should be added. In 2011, thedesign of the new facility was completed. Construction was completed in 2014 and wasoperational by the planned date of April 1, 2014.
Portland Wastewater pump station upgrade: The Fore River pump station will be upgraded afterover 30 years of service ($1,600,000).
Portland and Westbrook Regional Wastewater Treatment Plant: Preliminary engineering on theaeration systems at both plants was completed during 2014. Actual construction is scheduled tobegin in 2015 ($11,000,000).
Windham/Gorham 407 Zone upgrade: The 2003 water master plan noted that, within the next20 years, customer’s water demand growth in Windham and Gorham will exceed currentcapacity. Since 2003, incremental improvements have been made to address the futureshortfall. Preliminary engineering of the next phase was completed in 2014 with constructionscheduled for 2015 ($2,000,000).
Revenues
To balance the desire to provide funding for infrastructure improvement and operational needs withkeeping water rates affordable, the Board adopted a policy of small modest annual increases close tothe rate of inflation. The 2015 budget assumes a 3.8% increase in rates.
The 3.8% increase includes allocating 1.0% to the proposed Capital Reserve fund. The Maine PublicUtilities Commission adopted a rule in 2013 allowing the District to increase it water rates up to 10% ofwater revenues and dedicate revenues for capital improvement. The proposed budget assumes theadditional reserve will be used to pay the debt service of $2 million bond to finance replacing agingwater mains.

34 Introduction
Operating Budget Summary
The proposed budget includes $38.83 million in revenues and $38.28 million expenses.
Revenues
The two major revenue sources are water sales($21.69 million or 54.7% of total revenue) andwastewater assessment revenues ($17.12million or 43.2% of total revenue). Wastewaterrevenues have increased from $13.80 million, or43.6% of total revenue, since 2005 principallydue to addressing capital needs requested bymunicipalities or aging plant.
Water revenues are generated from potablewater and sprinkler charges to individualcustomers, and public fire protection charges tomunicipalities. The 2015 Budget assumes anincrease of 3.8% over current rates on May 1,2015.
Wastewater assessments are the amountsbilled individual municipalities to providecollection, sewer treatment, interception, utility
billing services and, by request, collection andbilling services. Assessments in 2015 increased0.8% overall ($143,964).
$0.0
$10.0
$20.0
$30.0
$40.0
2006 2007 2008 2009 2010 2011 2012 2013 2014 2015
Water Revenue Wastewater Assessment
Water Sales & WW Assessments(millions)
43.6%43.2%
Expenses
Operating Expenses increased to $39.02 million,an increase of 1.9%.
Personnel Costs, (Salaries/Wages and employeeBenefits) which are 39.5% of the total budget,increased 2.8% due to labor/benefit rateincreases (2.0% & 3.3%). Debt Service (17.8% ofexpense) dropped 4.6% due to debtretirements. Contracted Services rose 7.5%($284,315) due to increases in third partycontractor work. Renewal and Replacecontributions increased $263,412 (6.2%) whileOther Expense increased $51,118 (6.8%).
Salaries/Wages26.1%
EE Benefits13.4%
ContractedSrvs
10.6%
Other19.9%
DebtService17.8%
Renew &Replace11.7%
2015 Expenditures

35 Introduction
Capital Budget Summary
The proposed Capital Budget is $25 million dollars with projects for the water and wastewater funds of
$11.3 and $13.7 million, respectively.
Water
Of the $11.3 million in water capital projects, thelargest component (73.5%) involved the renewal ofwater distribution assets such as mains, servicesand hydrants. The other categories include the407 zone (18%), facilities & security (2%), vehicles& equipment (2.4%), technology & SCADA (2.4%)and meters (1.7%).
The projects will be funded by issuing $8.5 millionin bonds and utilizing $2.8 million in renewal andreplacement proceeds.
Wastewater
The Wastewater projects include the $12 millionupgrades to the aeration systems at Portland’sEast End and the Westbrook Regional treatmentfacilities.
The projects will be funded by issuing $12 millionin bonds and by utilizing $1.6 million in renewal &replacement fund proceeds and $150,000 fromDeferred Operating Expense, which will beexpensed in future years.
Bonds -WW, 50%Bonds -
Water,32%
DeferredOperatingExpense,
1%
R & R -Wastewat
er, 4%
R & R -Water,
13%
Financing Summary
CombinedSewer
Overflow,7%
TreatmentFacilities,
3%
PumpStations,
3%
OtherTreatmentPlant , 5%
Aeration ,81%
SCADA, 1%
Wastewater Funds

36 Introduction
Combined Water and Wastewater Operating Funds
Total revenues are $39.63 million, $0.79 million or 2.0% higher than last year’s budget. The 2015Budget proposes a 3.8% water rate increase (effective May 1, 2015). Wastewater Assessmentsincreases for the full year are budgeted in Cape Elizabeth (2.5%), and Portland (1.0%).
Operating Expenses are $39.02 million, an increase of 1.9%. The following pages provide additionaldetails.
2013
Actual
2014
Jan-Jun
2014
Budget
2015
Budget
Budget
Diff $
Budget
Diff %
Beginning Fund Balance 9,013,934 9,509,031 9,665,091 10,462,598
Water Revenue 20,301,648 9,897,472 21,130,183 21,690,890 560,707 2.7%
WW Assessments 16,588,464 8,485,800 16,972,320 17,116,284 143,964 0.8%
Contracted Billing Income 218,016 109,008 218,016 218,016 - 0.0%
Interest Income 73,394 46,983 66,727 76,236 9,509 14.3%
Other Income 533,435 192,471 446,180 526,280 80,100 18.0%
Total Revenue 37,714,957 18,731,734 38,833,426 39,627,706 794,280 2.0%
Salaries/Wages 9,645,534 4,774,189 10,003,869 10,178,032 174,163 1.7%
Employee Benefits 4,618,007 2,358,994 4,869,224 5,118,429 249,205 5.1%
Biosolids Disposal 1,351,703 753,733 1,298,503 1,387,398 88,895 6.8%
Chemicals 967,733 529,908 1,139,119 1,070,838 (68,281) -6.0%
Contracted Srvs 3,266,940 1,534,116 3,799,691 4,084,006 284,315 7.5%
Deferred Cost W/O 38,156 10,944 21,888 29,488 7,600 34.7%
Heat/Fuel Oil 456,842 316,575 515,008 499,058 (15,950) -3.1%
Insurance 186,312 90,054 188,736 204,560 15,824 8.4%
Materials/Supplies 1,587,849 972,251 1,586,165 1,611,952 25,787 1.6%
Other Expense 744,540 341,878 755,149 806,267 51,118 6.8%
Purchased Pow er 1,879,630 836,056 1,829,293 1,790,652 (38,641) -2.1%
Regulatory/Taxes 221,701 115,978 221,017 226,586 5,569 2.5%
Tele/Oth Utilities 269,698 143,873 313,657 317,429 3,772 1.2%
Transportation 1,130,939 553,929 1,264,935 1,297,239 32,304 2.6%
(less) Transport Offset (780,140) (397,598) (893,707) (898,062) (4,355) 0.5%
Departmental Expense 25,585,444 12,934,880 26,912,547 27,723,872 811,325 3.0%
Debt Service 6,428,634 3,555,866 7,141,485 6,810,659 (330,826) -4.6%
Renew al & Replacement (Direct) 3,803,850 1,866,474 3,732,950 3,996,362 263,412 7.1%
Renew al & Replacement (Indirect) 490,000 245,003 490,000 490,000 - 0.0%
Operating Expense 36,307,928 18,602,223 38,276,982 39,020,893 743,911 1.9%
Current Year Surplus (Deficit) 1,407,029 129,511 556,444 606,813
Transfer to Water Capital Reserve - - - (66,831)
Transfer to Water Land Fund (250,000) - - -
Write-off Bond Issuance Expense* (164,421) - - -
Return of WW Accumulated Surplus (215,000) - - -
Transfer to R&R Reserve (282,511) - - -
Ending Fund Balance 9,509,031 9,638,542 10,221,535 11,002,580
*Due to new GASB rules, bond issuance expenses incurred in prior years w as expensed

37 Introduction
Combined Operating, Capital and Grant Funds
The total combined revenue and funding for 2015 is $64.59 million, total combined expenditures are$63.98 million. The budgeted surplus for 2015 is $606,813.
Operating funds details are included in Operating Revenues, Operating Expenses and Human ResourcesSections. Capital funds details are included in included in Capital Finance and Capital ExpendituresSections. The Budget by Fund Section provides a summary of the Operating and Capital budget byindividual enterprise fund – water fund and 6 wastewater funds for each community provided withwastewater service.
Operating Capital Total
Water Revenue 21,690,890 - 21,690,890
WW Assessments 17,116,284 - 17,116,284
Water Bond - 8,000,000 8,000,000
Water R&R - 3,170,000 3,170,000
WW Bond (Future) - 11,000,000 11,000,000
WW Bond - 1,337,500 1,337,500
WW R&R - 1,396,362 1,396,362
Deferred Operating Expense - 150,000 150,000
Contracted Billing Income 218,016 - 218,016
Interest Income 76,236 - 76,236
Other Income 526,280 - 526,280
Total Revenue 39,627,706 25,053,862 64,681,568
Salaries/Wages 10,178,032 355,836 10,533,868
Employee Benefits 5,118,429 92,612 5,211,041
Biosolids Disposal 1,387,398 - 1,387,398
Chemicals 1,070,838 - 1,070,838
Contracted Srvs 4,084,006 24,410,029 28,494,035
Deferred Cost W/O 29,488 - 29,488
Heat/Fuel Oil 499,058 - 499,058
Insurance 204,560 - 204,560
Materials/Supplies 1,611,952 111,940 1,723,892
Other Expense 806,267 - 806,267
Purchased Power 1,790,652 - 1,790,652
Regulatory/Taxes 226,586 - 226,586
Tele/Oth Utilities 317,429 - 317,429
Transportation 1,297,239 83,445 1,380,684
(less) Transport Offset (898,062) - (898,062)
Operating Expense 27,723,872 25,053,862 52,777,734
Debt Service 6,810,659 - 6,810,659
Renewal & Replace - Direct 3,996,362 - 3,996,362
Renewal & Replace - Indirect 490,000 - 490,000
Total Expense 39,020,893 25,053,862 64,074,755
Surplus (Deficit) 606,813 - 606,813

38 Introduction
GFOA Budget Presentation Award
The Government Finance Officers Association of the United States and Canada (GFOA) presented aDistinguished Budget Presentation Award to Portland Water District, Maine for its annual budget for theyear beginning January 1, 2014. In order to receive the award, a government unit must publish a budgetdocument that meets program criteria as a policy document, as an operations guide, as a financial plan,and as a communication device.
This award is valid for a period of one year only. We believe our current budget continues to conform toprogram requirements, and are submitting it to GFOA to determine its eligibility for another award.
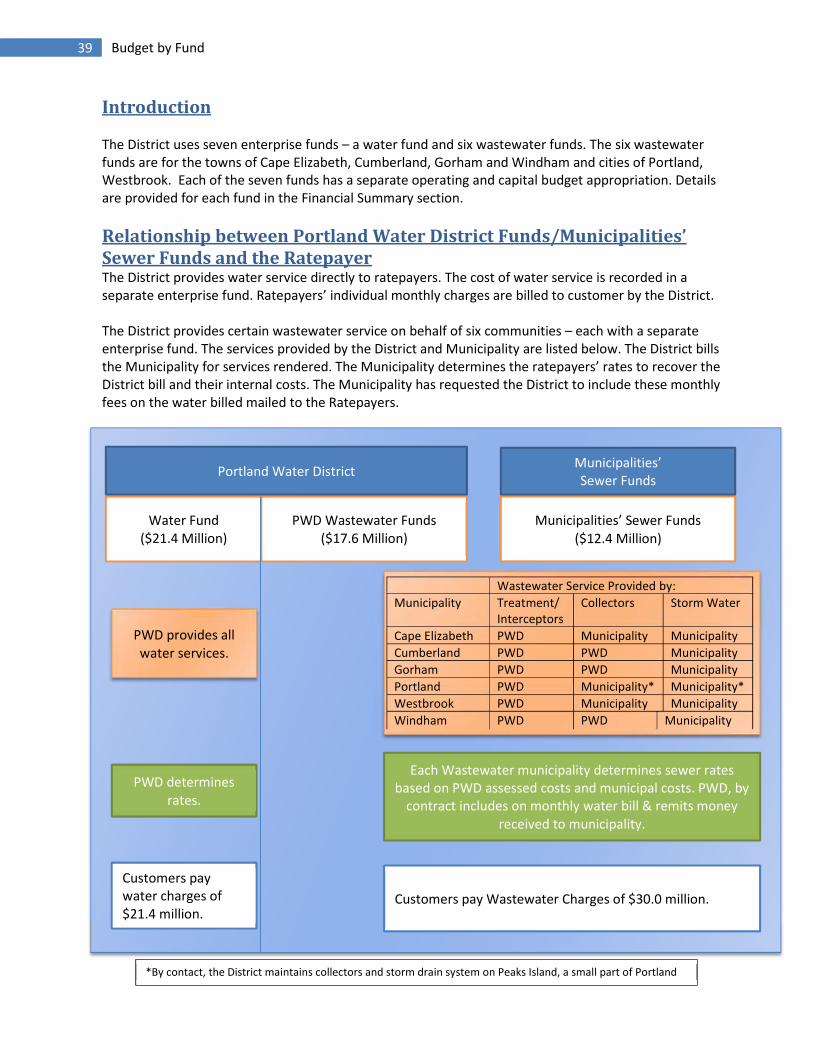
39 Budget by Fund
Introduction
The District uses seven enterprise funds – a water fund and six wastewater funds. The six wastewaterfunds are for the towns of Cape Elizabeth, Cumberland, Gorham and Windham and cities of Portland,Westbrook. Each of the seven funds has a separate operating and capital budget appropriation. Detailsare provided for each fund in the Financial Summary section.
Relationship between Portland Water District Funds/Municipalities’Sewer Funds and the RatepayerThe District provides water service directly to ratepayers. The cost of water service is recorded in aseparate enterprise fund. Ratepayers’ individual monthly charges are billed to customer by the District.
The District provides certain wastewater service on behalf of six communities – each with a separateenterprise fund. The services provided by the District and Municipality are listed below. The District billsthe Municipality for services rendered. The Municipality determines the ratepayers’ rates to recover theDistrict bill and their internal costs. The Municipality has requested the District to include these monthlyfees on the water billed mailed to the Ratepayers.
PWD provides allwater services.
Wastewater Service Provided by:
Municipality Treatment/Interceptors
Collectors Storm Water
Cape Elizabeth PWD Municipality Municipality
Cumberland PWD PWD Municipality
Gorham PWD PWD Municipality
Portland PWD Municipality* Municipality*
Westbrook PWD Municipality Municipality
Windham PWD PWD Municipality
PWD determinesrates.
Each Wastewater municipality determines sewer ratesbased on PWD assessed costs and municipal costs. PWD, by
contract includes on monthly water bill & remits moneyreceived to municipality.
Customers paywater charges of$21.4 million.
Customers pay Wastewater Charges of $30.0 million.
Water Fund($21.4 Million)
PWD Wastewater Funds($17.6 Million)
Municipalities’ Sewer Funds($12.4 Million)
Municipalities’Sewer Funds
Portland Water District
*By contact, the District maintains collectors and storm drain system on Peaks Island, a small part of Portland

40 Budget by Fund - Water
Fund: Water
Background
The Portland Water District’s charter authorizes the District to provide service to the inhabitants of 11cities and towns. Approximately 200,000 inhabitants are served portable drinking water. In addition,water for public and private fire protection is provided. The District’s water operation is regulated by theMaine Public Utilities Commission, including the determination of water rates to be charged tocustomers.

41 Budget by Fund - Water
Fund: Water
The Portland Water District operates two very different water systems; the Greater Portland Systemdelivers 22 million gallons of water per day from Sebago Lake and the Steep Falls System which delivers30,000 gallons per day from a single well in Standish. The quality of the water from Sebago Lake isexemplary, and the District was fortunate to receive a waiver from the filtration requirement that isnormal for most surface water supplies. In order to maintain this waiver, the District must have aneffective source protection program and meet stringent requirements for disinfecting the water.
2015 Financial Summary
The proposed 2015 operating expense andcapital budgets are $21,385,652 and$11,245,000, respectively.
Operating Expense was $568,342, or 2.7%,higher than the previous year. DepartmentalExpense was up 3.9% ($554,581) and Renewal& Replacement (direct & indirect) was up$200,455. Debt Service moved downward witha decrease of $186,694 (4.9%) due to debtretirements outpacing newer issues.
The capital budget includes $6.5 million fordistribution main renewals. Additionally, $4.8million in capital work involving various otherassets will be funded from the renewal andreplacement fund.
Debt Service16.8%
Renewal &Replacement
13.5%
Salaries/Wages20.1%
EmployeeBenefits
9.4%
ContractedServices
7.3%
All Other33.4%
2015 Operating Expense

42 Budget by Fund - Water
2015 Operating Expense Highlights
Salaries/Wages – Wage rates increased an average for 2.0%. The smaller overall increase of 0.5%($19,346) was the result of a reduction in overtime hours and a shift of Water Operations labor tocapital for increased efforts for water main construction inspection.
Employee Benefits – Benefits, which are charged as a percentage of regular wages, increased 4.1%. Thebenefit rate increased 3.3% due to increases in health insurance and pension costs.
Chemicals – Costs are budgeted to decrease 22.7% ($118,275), the majority ($90,242) involved liquidoxygen. Liquid oxygen was added to the updated treatment process in early 2014. The 2014 Budget wasbased on engineering estimates; the 2015 Budget was based on actual usage at the plant which resultedin a large decrease in both projected usage and price. All other chemical costs have small declines due toeither projected reductions in per unit cost or usage.
Contracted Services – The budget is up 18.3% ($241,735) due a rise in Water Operation’s contractorconstruction budget to the expected levels of value box, maintenance and other outsourced work.
Other Expense – Other Expense increased $53,666 (37.5%). This increase is mostly attributable to costsput into the 2015 Budget to deal with deregulation issues.
Purchased Power – Delivery charges for the water treatment plant are expected to decrease 28.2%,charges to other water facilities are expect to decline 2.5%. Energy rates will rise 16.7% for thetreatment plant and medium sized accounts will remain the same. These rate shifts contributed to a5.2% ($21,062) increase. A larger increase was mitigated by a decrease in energy use at the OzoneFacility due to energy savings from upgraded equipment.
Tele/Other Utilities – This is expense is up $16,457 (32.0%) due to the outsourcing of holding tankpumping at the water treatment facility and higher costs for cell phones.
Transmission/Distribution
26%
Util ity Services17%
Treatment16%
EnvironmentalServices
15%
EngineeringServices
16%
Other10%
Labor Hours Distribution

43 Budget by Fund - Water
Transportation – The budget is up ($35,219 or 4.5%) due to an increase in estimated vehicle use ofabout 800 hours by Water Operations.
Support Services – These costs are related to general work done that cannot be directly charged to afund as noted above (such as administrative time or training) or work done on behalf of severalmunicipalities at the same time (engineering or laboratory services) that is allocated based on the valueto each fund. The combined Support Services costs increased 4.6% ($182,350) due increased efforts inthe water fund by facilities group and the laboratory.
Debt Service - The annual principal and interest payments on bonds issued to finance capital projects.This expense will decrease 4.9% ($186,694) in 2015 due to the retirement of older debt.
Renewal & Replacement – These are dollars put aside to fund capital projects. They will increase$200,455 to support continued capital work including the renewal of older water mains.
2013
Actual
2014
Jan-Jun
2014
Budget
2015
Budget
Budget
Diff $
Budget
Diff %
Water Sales 20,301,648 9,897,472 21,130,183 21,690,890 560,707 2.7%
Interest Income 29,265 19,178 26,630 34,391 7,761 29.1%
Other Income 271,722 112,153 240,780 265,370 24,590 10.2%
Total Revenue 20,602,635 10,028,803 21,397,593 21,990,651 593,058 2.8%
Salaries & Wages 3,931,556 2,016,377 4,173,946 4,193,292 19,346 0.5%
Employee Benefits 1,780,150 943,942 1,924,036 2,002,068 78,032 4.1%
Chemicals 346,472 147,356 521,250 402,975 (118,275) -22.7%
Contracted Services 1,081,759 396,418 1,318,037 1,559,772 241,735 18.3%
Deferred Cost W/O 5,600 600 1,200 800 (400) -33.3%
Facilities 88,817 54,173 109,233 112,850 3,617 3.3%
Heat/Fuel Oil 147,203 93,752 154,901 159,341 4,440 2.9%
Insurance 22,423 11,699 34,985 36,667 1,682 4.8%
Materials & Supplies 610,171 377,785 557,531 567,612 10,081 1.8%
Other Expense 203,584 128,062 142,936 196,602 53,666 37.5%
Purchased Power 453,575 176,981 401,736 422,798 21,062 5.2%
Regulatory/Taxes 221,702 115,977 221,017 226,586 5,569 2.5%
Tele/Other Utilties 51,383 31,164 51,365 67,822 16,457 32.0%
Transportation 762,264 361,377 791,213 826,432 35,219 4.5%
SS - Administration 2,979,324 1,484,914 3,095,701 3,185,851 90,150 2.9%
SS - Engineering Services 796,655 378,348 671,131 739,689 68,558 10.2%
SS - Environmental Services 85,363 40,677 87,299 109,197 21,898 25.1%
SS - Water Services 65,325 132,889 90,842 92,586 1,744 1.9%
Departmental Expense 13,633,326 6,892,491 14,348,359 14,902,940 554,581 3.9%
Debt Service 3,244,932 1,875,274 3,773,527 3,586,833 (186,694) -4.9%
Renewal & Replace - Direct 2,400,000 1,200,000 2,400,000 2,600,000 200,000 8.3%
Renewal & Replace - Indirect 297,414 147,712 295,424 295,879 455 0.2%
Operating Expense 19,575,672 10,115,477 20,817,310 21,385,652 568,342 2.7%7
Surplus (Deficit) 1,026,963 (86,674) 580,283 604,999
Write-off Bond Issuance Exp (110,346) - - -
Transfer to Capital Reserve - - - (66,831)
Transfer to Land Fund (250,000) - - -
Prior Surplus 2,834,170 3,500,787 3,503,515 4,097,689
Accumulated Surplus 3,500,787 3,414,113 4,083,798 4,635,857

44 Budget by Fund - Water
Operation Summary
The current treatment processes at the Sebago Lake Water Treatment Facility (SLWTF) include ozone,ultra-violet energy (U V) and chloramines for disinfection, fluoridation for dental benefit, and theaddition of a corrosion control inhibitor. In order to meet the requirements of the new Long-Term IITreatment Rule in early 2014, the District installed a UV treatment system. The construction projectalso included the replacement of the 20 year old ozone production system.
The District maintains approximately 1,000 miles of water mains that carry the water from Sebago Laketo the customer’s homes. During the past few years, more efforts are being focused on the renewal ofthe older water mains in our system. In 2015, the District plans to spend approximately $6.5 milliondollars to replace and upgrade these mains, and intends to increase the amount by $500,000 in 2016 inorder to achieve our renewal objectives. In addition, the Transmission/ Distribution group performsoperation and maintenance procedures to ensure that our customers experience minimal disruptions inwater service.
Water quality in the distribution system is constantly monitored by routine sampling and throughtracking of water quality inquiries. This information is reviewed and shared monthly with office andfield employees to help make water quality everyone’s responsibility.

45 Budget by Fund - Water
Operation Summary (continued)
In an effort to improve the water quality in the distribution system, the District performs multi-directional flushing to remove any sediment that deposits on the bottom of these mains. This sedimentcan cause a reduction in the area’s chlorine residual and increase customer’s water quality inquiries.The program’s resources had been stretched thin over the past few years, with the amount of thesystem flushed falling to 9% during 2009. A renewed emphasis was placed on the program and during2012 and 2013 our annual objective of flushing 33% of the system was met. The goal is to flush theentire distribution system in a 3-year cycle.
2012 Actual 2013 Actual 2014 Projected 2015 Goal
% of Distribution System Flushed 33% 33% 37% 33%
The hydrant inspection program was revised over the past 3 years and the new procedures wereimplemented during the winter of 2012. One expanded area of this program is to exercise and confirmthat each hydrant is fully functional. The long-term objective is to test each hydrant annually. Manyhydrants had not been tested against this higher standard, and this created more maintenance workduring the first few years of the revised program.
2012 Actual 2013 Actual 2014 Projected 2015 Goal
Annual Hydrant Inspections 2971 (60%) 1992 (40%) 4963 (100%) 4,963 (100%)
The District continues to be innovative in its use of technology. One significant project under way is theGPS locating, confirming addresses, and updating the utility account information of all water servicelines. This multi-year project will improve the efficiency of employees by clarifying 100 year old recordsand thus reduce time spent determining the exact location of buried assets. The Town of Gorham wascompleted in 2013, staff expects to complete the Town of Falmouth by the end of 2014, and will moveinto another community in 2015. Depending on the size of the community selected, it may take morethan a year to complete.

46 Budget by Fund - Water
Capital Summary
A five-year capital plan is updated each year. The projects are prioritized based on operational needsand financing availability.
Capital project expenditures are financed by issuance of bonds or renewal and replacement fundscollected. Water bonds are usually issued through the Maine Municipal Bond Bank though the Districtdid issue a $4.5 million bond in 2014 directly to the bond market. The 2015 planned projects are listedbelow. A detailed description of the projects is listed in the capital improvement plan section of thebudget book. In 2015, the district plans to issue $8.5 million in bonds and fund renewal andreplacement at $3.27 million to fund the remaining capital projects.
2013 Actual 2014 Projected 2015 Budget
Beginning of Year Fund Balance $2,374,784 $2,882,788 $2,383,788
Funding Sources:
Bond Proceeds - current year - - -
Bond Proceeds - Main Renewal 2,500,000 5,000,000 5,500,000
Bond Proceeds - 407 Zone - - 2,000,000
Bond Proceeds - Ozone Plant 11,000,000 - 500,000
Renewal & Replacement Contribution 3,270,000 3,270,000 3,470,000
19,144,784 11,152,788 13,853,788
Expenditures:
Scada & Technology 69,183 147,000 265,000
Vehicle/Equipment Replacement 318,490 320,000 275,000
Water Operations - Mains/Valves 147,625 200,000 275,000
Water Operations - Services/Meters 318,965 400,000 790,000
Water Operations - Hydrants 146,521 150,000 200,000
Main Renewal Projects 4,113,412 7,300,000 6,500,000
Main Renew related (Hydrant/Service) n/a - 50,000
Ozone Plant/UV Project 11,000,000 - 500,000
407 Zone Work - - 2,000,000
Water Facilities 147,800 227,000 365,000
Water Supply Security - 25,000 25,000
16,261,996 8,769,000 11,245,000
End of Year Fund Balance 2,882,788 2,383,788 2,608,788

47 Budget by Fund - Water
Projections for Rate-Making Purposes
Multi-year projections are made for the water fund to provide an understanding of the future impact on
water rates.
Summary
Major Assumptions:The assumptions incorporated in the projections are as follows:
Salary increases of 2% each year. Maintain same number of employees.
Benefit increases of 5% each year. Assumed pension contribution increased to $1 million a yearin 2015 and health insurance increases 7 % per year.
Other expenses increase by 2.5% in 2015-2016 and 3.5% in subsequent years.
New debt service and renewal/replacement fund expenditures consistent with the 2015 5-yearcapital plan (new debt assumed a 20 year life at 5%). Significant projects include an annualinvestment of $7 million of water mains and combined investment in the 407 zone upgrade of$7.5 million.
Summary
Water is projected to increase to $26,365,413, a 21% increase, with the most significant cost change
related to debt service issued to finance capital projects. Operating Reserve balance is expected to be
below target balance. Renewal and Replacemen t fund and debt ratio are expected to meet target.
Reserve Fund Balances
$0
$2,000
$4,000
$6,000
$8,000
$10,000
$12,000
2010 2011 2012 2013 2014 2015 2016 2017 2018 2019
Water($,000)
Main Capital
Land
R&R Capital
Operating
Percent of Budget Dedicated to Debt Service – Target: Not to Exceed 35%Funds 2014 2015 2016 2017 2018 2019
Water 17% 17% 20% 22% 25% 26%
Debt Service Ratio – Target: Greater or Equal to 1.25Funds 2014 2015 2016 2017 2018 2019
Water 1.87 1.98 1.73 1.57 1.45 1.44

48 Budget by Fund - Water
Projections for Rate-Making Purposes (continued)
Water FundOperating Fund:
2015 2016 2017 2018 2019
Revenue: Budget Projected Projected Projected Projected
Water Revenue $21,690,890 $22,775,435 $23,914,207 $25,109,917 $26,365,413
Other Income 265,370 265,370 265,370 265,370 265,370
Interest Income 34,391 34,391 34,391 34,391 34,391
Total Revenue 21,990,651 23,075,196 24,213,968 25,409,678 26,665,174
Expense:
Salaries/Wages 4,193,292 4,277,158 4,362,701 4,449,955 4,538,954
Employee Benefits 2,002,068 2,102,171 2,207,280 2,317,644 2,433,526
Contracted Srvs 1,559,772 1,598,766 1,654,723 1,712,638 1,772,580
Transportation 826,432 847,093 876,741 907,427 939,187
Materials/Supplies 567,612 581,802 602,165 623,241 645,054
Purchased Power 422,798 433,368 448,536 464,235 480,483
Chemicals 402,975 413,049 427,506 442,469 457,955
Regulatory/Taxes 226,586 232,251 240,380 248,793 257,501
Heat/Fuel Oil 159,341 163,325 169,041 174,957 181,080
Facilities 112,850 115,671 119,719 123,909 128,246
Other Expense 196,602 201,517 208,570 215,870 223,425
Tele/Oth Utilities 67,822 69,518 71,951 74,469 77,075
Insurance 36,667 37,584 38,899 40,260 41,669
Deferred Cost W/O 800 820 849 879 910
Support Services:
Administration 3,185,851 3,265,497 3,379,789 3,498,082 3,620,515
Engineering Services 739,689 758,181 784,717 812,182 840,608
Water Services 92,586 94,901 98,223 101,661 105,219
Environmental Services 109,197 111,927 115,844 119,899 124,095
Capital:
Debt Service 3,586,833 4,485,820 5,359,486 6,251,297 6,791,177
Renewal & Replacement 2,895,879 2,895,879 2,895,879 2,895,879 2,895,879
Total Expense 21,385,652 22,686,298 24,062,999 25,475,746 26,555,138
Annual Surplus (Deficit) 604,999 388,898 150,969 -66,068 110,037
Transfer to Cap Reserve -66,831 -30,254 4,358 4,748 -30,863
Carryforward Surplus 4,097,689 4,635,857 5,024,755 5,175,724 5,109,656
Period End Surplus 4,635,857 5,024,755 5,175,724 5,109,656 5,219,693
Target 5,346,413 5,671,575 6,015,750 6,368,937 6,638,784
Below Target -$710,556 -$646,820 -$840,026 -$1,259,281 -$1,419,091
Capital Expenditures: (See details in the Capital Expenditure section) Target Balance: $2,687,840
Year Beg Balance R&R Contribution Bond Land Reserve Expenditures End Balance
2015 2,383,788 3,470,000 8,000,000 0 11,245,000 2,608,788
2016 2,608,788 3,470,000 8,000,000 0 11,688,000 2,390,788
2017 2,390,788 3,470,000 10,025,000 0 13,225,000 2,660,788
2018 2,660,788 3,470,000 6,000,000 0 9,375,000 2,755,788
2019 2,755,788 3,470,000 7,000,000 0 10,375,000 2,850,788

49 Budget by Fund - Water
Water Main Renewals
Our commitment to maintain aging water infrastructure includes replacing water mains.The 2015 budget continues this commitment with planned projects totaling $6.5 million dollars. Theprojects will be funded with current year’s revenue ($1 million) and bond proceeds ($5.5 million).

50 Budget by Fund – Wastewater, Cape Elizabeth
Fund: Wastewater - Cape Elizabeth
Background
The Portland Water District’s charter authorizes the District to provide wastewater treatment andcollection system-interceptors service to the town. The town maintains most of the collection system-collectors system but has contracted with the District to maintain several pump stations with thatsystem. The District operates a treatment facility that treats wastewater from the southern section ofthe town and contracts with the City of South Portland to provide treatment services for the northernsection of the town. Additionally, by contract, the District provides utility billing services.
Summary of Services
Provided:
Treatment:
0.623 million gallons/
day
Collection System:
23 Pump Stations with
13.5 miles of pipe
Utility Billing Services:
Annual Billings of
$1,881,114 on 2,279
Customers (avg.
$67.15/month)
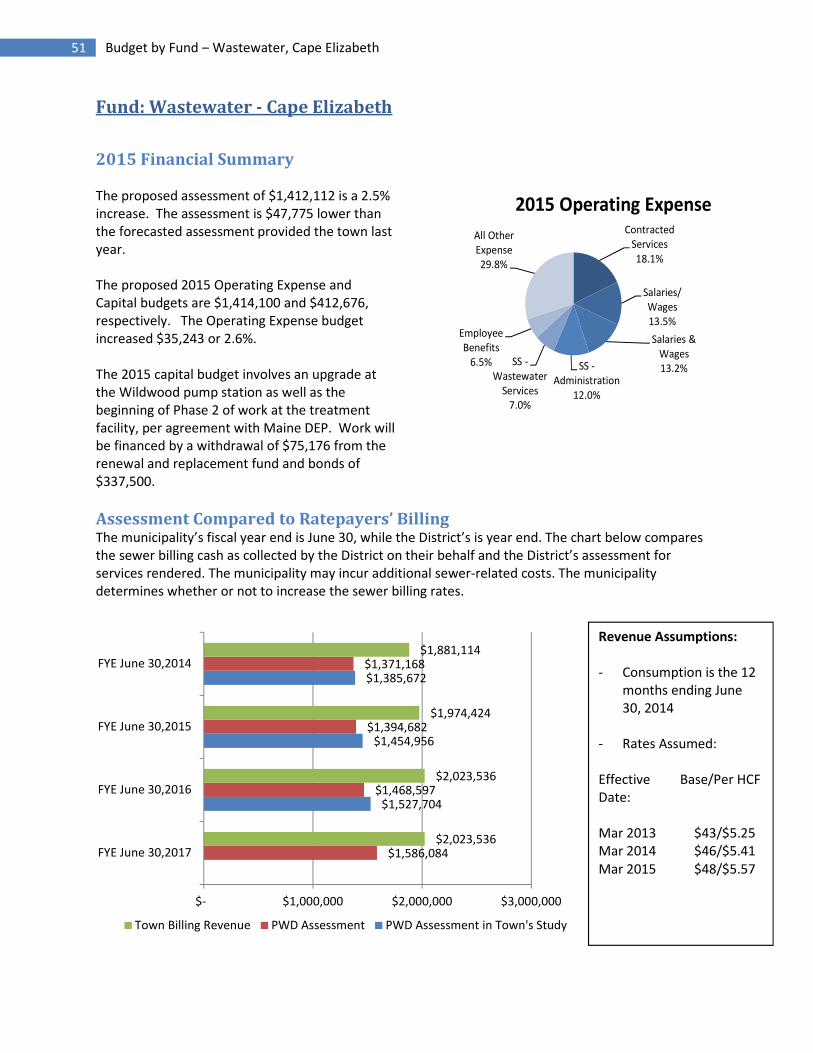
51 Budget by Fund – Wastewater, Cape Elizabeth
Fund: Wastewater - Cape Elizabeth
2015 Financial Summary
The proposed assessment of $1,412,112 is a 2.5%increase. The assessment is $47,775 lower thanthe forecasted assessment provided the town lastyear.
The proposed 2015 Operating Expense andCapital budgets are $1,414,100 and $412,676,respectively. The Operating Expense budgetincreased $35,243 or 2.6%.
The 2015 capital budget involves an upgrade atthe Wildwood pump station as well as thebeginning of Phase 2 of work at the treatmentfacility, per agreement with Maine DEP. Work willbe financed by a withdrawal of $75,176 from therenewal and replacement fund and bonds of$337,500.
Assessment Compared to Ratepayers’ BillingThe municipality’s fiscal year end is June 30, while the District’s is year end. The chart below comparesthe sewer billing cash as collected by the District on their behalf and the District’s assessment forservices rendered. The municipality may incur additional sewer-related costs. The municipalitydetermines whether or not to increase the sewer billing rates.
$1,527,704
$1,454,956
$1,385,672
$1,586,084
$1,468,597
$1,394,682
$1,371,168
$2,023,536
$2,023,536
$1,974,424
$1,881,114
$- $1,000,000 $2,000,000 $3,000,000
FYE June 30,2017
FYE June 30,2016
FYE June 30,2015
FYE June 30,2014
Town Billing Revenue PWD Assessment PWD Assessment in Town's Study
ContractedServices18.1%
Salaries/Wages13.5%
Salaries &Wages13.2%SS -
Administration12.0%
SS -Wastewater
Services7.0%
EmployeeBenefits
6.5%
All OtherExpense29.8%
2015 Operating Expense
Revenue Assumptions:
- Consumption is the 12months ending June30, 2014
- Rates Assumed:
Effective Base/Per HCFDate:
Mar 2013 $43/$5.25Mar 2014 $46/$5.41Mar 2015 $48/$5.57

52 Budget by Fund – Wastewater, Cape Elizabeth
2015 Operating Expense Highlights
Salaries/Wages – The budget of$187,062 increased 0.4% ($769).District labor rates increased an averageof 2.0% and hours for this fund declined1.8%. The hourly reduction was manydue to the outsourcing of sludge haulingbetween the Cape Elizabeth WWTF andthe East End WWTF. A total of 7,945hours (3.8 full time equivalents) werebudgeted for 2015.
Employee Benefits – Benefits, which arecharged as a percentage of regularwages, increased 3.1% ($2,706) to a totalof $91,232. The benefit rate increased3.3% due to increases in health insurance and pension costs.
Contracted Services – The budget for this item increased $47,301 (22.7%). The increase included$17,300 for the outsourcing of sludge hauling, $14,000 for CCTV (inspection by video) of sewer lines and$8,800 for snow plowing.
Transportation – Transportation decreased $22,178 (34.6%) mostly due to the outsourcing of sludgehauling to an outside contractor.
Support Services – These costs are related to general work done that cannot be directly charged to afund as noted above (such as customer service, billing or information technology) or work done onbehalf of several municipalities at the same time (engineering or laboratory services) that is allocatedbased on the value to each fund.
The combined Support Services costs increased 1.0% ($3,809). The changes to each line varied from the3.3% increase in Administration (due in large part to wage and benefits increases) to a 5.1% decrease inEnvironmental Services due to a reduction in work for the Cape Elizabeth WWTF in relation to the totalwork done in the laboratory.
Debt Service - The annual principal and interest payments on bonds issued to finance capital projects.This cost increased $1,219 (0.6%) from the prior year budget to $191,534. The plan calls for new bondissues of $337,500 and $250,000 in November 2015 for work at the Garden Lane and Wildwood PumpStations as well as several Cape Elizabeth WWTF projects.
Renewal & Replacement - Dollars put aside to fund capital projects. A contribution of $94,678 will bemade in 2015; a decrease of $50 or 0.3%.
Treatment40%
Systems53%
Other Depts7%
Labor Hours Distribution

53 Budget by Fund – Wastewater, Cape Elizabeth
2013
Actual
2014
Jan-Jun
2014
Budget
2015
Budget
Budget
Diff $
Budget
Diff %
Assessment Income $1,365,084 $688,626 $1,377,252 $1,412,112 $34,860 2.5%
Interest Income 1,915 1,022 1,605 1,988 383 23.9%
Total Revenue 1,366,999 689,648 1,378,857 1,414,100 35,243 2.6%
Salaries & Wages 172,478 81,019 186,293 187,062 769 0.4%
Employee Benefits 80,445 39,477 88,526 91,232 2,706 3.1%
Biosolids Disposal 13,409 7,274 14,005 14,622 617 4.4%
Chemicals 8,307 5,020 11,882 12,767 885 7.4%
Contracted Services 206,245 100,259 207,955 255,256 47,301 22.7%
Heat/Fuel Oil 14,237 9,678 16,798 16,457 (341) -2.0%
Insurance 4,929 2,631 5,261 5,631 370 7.0%
Materials & Supplies 36,369 8,360 33,300 34,225 925 2.8%
Other Expense 6,341 2,371 3,902 3,900 (2) -0.1%
Purchased Power 71,272 40,677 77,514 76,657 (857) -1.1%
Tele/Other Utilties 14,509 4,564 13,590 13,660 70 0.5%
Transportation 69,905 28,121 64,138 41,960 (22,178) -34.6%
SS - Administration 143,876 78,522 164,161 169,507 5,346 3.3%
SS - Engineering Services 50,325 24,413 66,727 67,570 843 1.3%
SS - Environmental Services 34,955 17,792 36,147 34,293 (1,854) -5.1%
SS - Wastewater Services 84,980 52,622 100,972 98,569 (2,403) -2.4%
SS - Water Services 1,790 3,588 2,643 4,520 1,877 71.0%
Departmental Expense 1,014,372 506,388 1,093,814 1,127,888 34,074 3.1%
Debt Service 199,941 94,611 190,315 191,534 1,219 0.6%
Renewal & Replace - Direct 80,000 40,000 80,000 80,000 - 0.0%
Renewal & Replace - Indirect 13,708 7,364 14,728 14,678 (50) -0.3%
Operating Expense 1,308,021 648,363 1,378,857 1,414,100 35,243 2.6%
Surplus (Deficit) 58,978 41,285 - -
Write-off Bond Issuance Exp (4,059) - - -
Return of Surplus - - - -
Transfer to R&R - - - -
Prior Surplus 202,812 257,731 203,033 322,118
Accumulated Surplus 257,731 299,016 203,033 322,118

54 Budget by Fund – Wastewater, Cape Elizabeth
Operation Summary
Wastewater Treatment: The Cape Elizabeth Wastewater System is divided into two sectors, North andSouth. Flow generated in the Northern sector is pumped to South Portland for treatment while flowgenerated in South Cape is treated at the Cape South WWTF. The Cape South facility is designed totreat 520,000 gallons per day. Cape North has 715,400 gallons per day capacity at South Portland’sWWTF. The wet weather capacity was increased in 2011 to manage high flows during wet weather. Thissystem performed as designed during several “record” rain event and has continued to perform verywell. The table below illustrates 2013 actual flows and the percent of capacity being used.
Area 2013 Actual Flow Design Capacity % of Capacity
North Cape 367,907 gal/day 715,400 gal/day 51.40 %
South Cape 254,700 gal/day 520,000 gal/day 49.0 %
2014 YTD - The South Cape WWTF has operated well through the first three quarters. The plant isaveraging 91% removal of BOD and 96% of total suspended solids, which exceeds the minimum 85%removal required in the permit for both parameters.
Parameter (lbs/day) DEP Limit Facility Avg
Biological Oxygen Demand (BOD) 208 lbs/day 28 lbs/day Measure of organic material
Total Suspended Solids (TSS) 208 lbs/day 11 lbs/day Measure of suspended material
Wastewater Conveyance – interceptors and pumping stations: The Draft Ottawa Road CSO Long TermControl Plan was submitted to MEDEP in December 2011 and was approved in September 2013. The 5year plan began in 2014. The project will mitigate the frequency and volume of overflow duringextreme wet weather events by addressing private sources of infiltration and inflow in the collectionsystem of Cape Elizabeth and South Portland. Staff continues to respond and maintain service duringvarious storm events and power failures, while installing emergency generators to assist in managingelevated flows during power losses. Additional work performed by the Systems crew is shown in thetable below.
Parameter 2014 Actual to Oct. 2013 Projected
Preventative Work Orders 287 300
Corrective 47 50
Wet wells cleaned 44 40
Debris removed 37.22 40
DWO 0 0
2014 Other Highlights• Asset Management Software will continue to drive the preventive maintenance program,
generating both monthly and annual preventive maintenance tasks for all pump stations,continuing our emphasis on pump station preventive maintenance program.
• The Garden Circle Pump Station design was completed it 2013. The will be completed in2014.
• The roof of the metering station will be replaced.
2015 Work Plan• The Town will begin implementing the findings of the I/I assessment. PWD will continue to
assist the Town as needed.• The Wildwood Pump Station will be upgraded in 2015.

55 Budget by Fund – Wastewater, Cape Elizabeth
Capital Summary
A five-year capital plan is updated each year. The projects are prioritized based on operational needsand financing availability.
Capital project expenditures are financed by issuance of bonds or distribution from the renewal andreplacement (R&R) fund. Wastewater bonds are usually issued through the Maine Municipal Bond Bankand utilize the state revolving loan fund (SRF) for eligible projects, which provides a 2% below marketinterest rate. The renewal and replacement fund is appropriated $80,000 from the annual assessment in2015. The planned projects are listed below:
Pump Stations – 52: Routine and equipment renewal and replacements ($30,000) will be financedthrough the renewal and replacement fund.
SCADA/Process Control Program – 177: East End Treatment Plant SCADA upgrades and various processand management systems ($20,176), financed from the renewal and replacement fund.
Pump Stations – 407: Wildwood Pump Station replacement ($95,000) projects totaling $345,000. Theseprojects will be financed by bonds in November 2015.
Treatment Plant – 418: This project ($242,500) is Phase 2 of the treatment plant improvements as partof an agreement with Maine DEP. This project will be financed by a bond in November 2015.
Treatment Plant – 424: Routine and equipment renewal and replacements ($25,000). These projectswill be financed through the renewal and replacement fund.
2013 Actual 2014 Projected 2015 Budget
Capital Fund:
Beginning of Year Fund Balance $128,499 $143,754 $170,767
Source of Funds:
Bond Proceeds - prior year(s) 153,920 - -
Bond Proceeds - current year - - 337,500
Bond Proceeds - future years - 250,000
Renewal and Replacement Contribution 80,000 80,000 80,000
Transfer from Operating Fund - - -
Capital Funding 233,920 330,000 417,500
Capital Expenditures:
Pump Station R&R – 52 39,458 28,872 30,000
SCADA System Controls (prorated) - 177 - - 20,176
Cape CSO / Pump Station Capital Program - 407 154,599 250,000 95,000
Treatment Plant Captial Program – 418 - - 242,500
Treatment Plant R&R – 424 24,608 24,115 25,000
Capital Expenditures 218,665 302,987 412,676
End of Year Fund Balance 143,754 170,767 175,591

56 Budget by Fund – Wastewater, Cape Elizabeth
Projections for Rate-Making Purposes
Multi-year projections are made for each of the wastewater funds’ assessment. The projections provideguidance to the wastewater municipalities to assist them in determining their wastewater sewer rates. Asummary of the projection is provided on next page.
Summary
Major Assumptions:The assumptions incorporated in the projections are as follows:
Salary increases of 2% each year. Maintain same number of employees.
Benefit increases of 5% each year. Assumed pension contribution increased to $1 million a yearin 2015 and health insurance increases 7 % per year.
Other expenses increase by 2.5% in 2015-2016 and 3.5% in subsequent years. Biosolids costs areassumed to increase by an additional 5% when the current contract expires in 2016.
New debt service and renewal/replacement fund expenditures consistent with the 2015 5-yearcapital plan (new debt assumed a 20 year life at 5%). Significant projects include $1 millionupgrade at the treatment facility in 2016 and upgrades to the Wildwood, Maiden Cove, FamilyField and Peabbles Cove pump station.
Summary
Assessment is projected to increase to $1,832,220 with the most significant cost change related to debtservice issued to finance capital projects. Reserves balances are expected to below target balances.
Reserve Fund Balances
0
100
200
300
400
500
600
2010 2011 2012 2013 2014 2015 2016 2017 2018 2019
Cape Elizabeth($,000)
Capital
Operating
Percent of Budget Dedicated to Debt Service – Target: Not to Exceed 35%Funds 2014 2015 2016 2017 2018 2019
Cape Elizabeth 14% 14% 19% 26% 25% 25%
Debt Service Ratio – Target: Greater or Equal to 1.25Funds 2014 2015 2016 2017 2018 2019
Cape Elizabeth 1.50 1.49 1.21 0.97 1.20 1.23
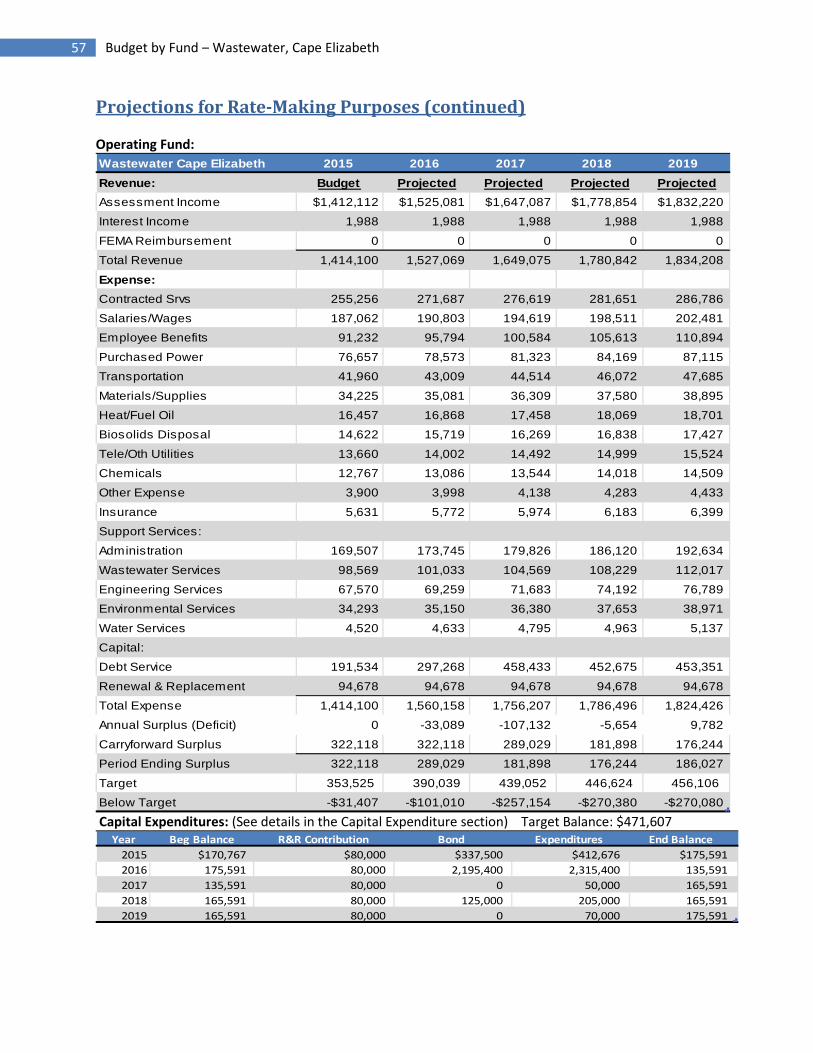
57 Budget by Fund – Wastewater, Cape Elizabeth
Projections for Rate-Making Purposes (continued)
Operating Fund:
Wastewater Cape Elizabeth 2015 2016 2017 2018 2019
Revenue: Budget Projected Projected Projected Projected
Assessment Income $1,412,112 $1,525,081 $1,647,087 $1,778,854 $1,832,220
Interest Income 1,988 1,988 1,988 1,988 1,988
FEMA Reimbursement 0 0 0 0 0
Total Revenue 1,414,100 1,527,069 1,649,075 1,780,842 1,834,208
Expense:
Contracted Srvs 255,256 271,687 276,619 281,651 286,786
Salaries/Wages 187,062 190,803 194,619 198,511 202,481
Employee Benefits 91,232 95,794 100,584 105,613 110,894
Purchased Power 76,657 78,573 81,323 84,169 87,115
Transportation 41,960 43,009 44,514 46,072 47,685
Materials/Supplies 34,225 35,081 36,309 37,580 38,895
Heat/Fuel Oil 16,457 16,868 17,458 18,069 18,701
Biosolids Disposal 14,622 15,719 16,269 16,838 17,427
Tele/Oth Utilities 13,660 14,002 14,492 14,999 15,524
Chemicals 12,767 13,086 13,544 14,018 14,509
Other Expense 3,900 3,998 4,138 4,283 4,433
Insurance 5,631 5,772 5,974 6,183 6,399
Support Services:
Administration 169,507 173,745 179,826 186,120 192,634
Wastewater Services 98,569 101,033 104,569 108,229 112,017
Engineering Services 67,570 69,259 71,683 74,192 76,789
Environmental Services 34,293 35,150 36,380 37,653 38,971
Water Services 4,520 4,633 4,795 4,963 5,137
Capital:
Debt Service 191,534 297,268 458,433 452,675 453,351
Renewal & Replacement 94,678 94,678 94,678 94,678 94,678
Total Expense 1,414,100 1,560,158 1,756,207 1,786,496 1,824,426
Annual Surplus (Deficit) 0 -33,089 -107,132 -5,654 9,782
Carryforward Surplus 322,118 322,118 289,029 181,898 176,244
Period Ending Surplus 322,118 289,029 181,898 176,244 186,027
Target 353,525 390,039 439,052 446,624 456,106
Below Target -$31,407 -$101,010 -$257,154 -$270,380 -$270,080
Capital Expenditures: (See details in the Capital Expenditure section) Target Balance: $471,607Year Beg Balance R&R Contribution Bond Expenditures End Balance
2015 $170,767 $80,000 $337,500 $412,676 $175,591
2016 175,591 80,000 2,195,400 2,315,400 135,591
2017 135,591 80,000 0 50,000 165,591
2018 165,591 80,000 125,000 205,000 165,591
2019 165,591 80,000 0 70,000 175,591

58 Budget by Fund – Wastewater, Cumberland
Fund: Wastewater - Cumberland
Background
The Portland Water District’s charter authorizes the District to provide wastewater treatment andcollection system- interceptors service to the town. By contract with the town, the District additionallyoperates and maintains the collectors in the sewer collection system. The District contracts with theTown of Falmouth to provide treatment services. Additionally, by contract, the District provides utilitybilling services.
Summary of Services
Provided:
Treatment
0.227 million
gallons/day
Collection System:
13 Pump Stations with
25.0 miles of pipe
Utility Billing Services:
Annual Billings of
$885,617 on 1,107
Customers (avg.
$67.25/month)

59 Budget by Fund – Wastewater, Cumberland
Fund: Wastewater - Cumberland
2015 Financial Summary
The proposed assessment of $731,784 is the sameas the previous year. This assessment is lowerthan the forecasted assessment provided thetown last year.
The proposed 2015 Operating Expense andCapital budgets are $733,695 and $48,740,respectively. The Operating Expense budgetdecreased $37,936 or 4.9%. The major factor inthis decrease is the reduction in the fee projectedto be paid annually to the Town of Falmouth forwastewater treatment services by $45,269.
Capital work in 2015 will include installation of acontrol panel in the Brookside Pump Station androutine small equipment repairs. The work will befunded by a withdrawal of $48,740 from therenewal and replacement fund.
ContractedServices53.5%
Salaries/Wages7.0%
EmployeeBenefits
4.1%
PurchasedPower3.5%
Transportation
3.4%
OtherExpense27.5%
2015 Operating Expense
Assessment Compared to Ratepayers’ BillingThe municipality’s fiscal year end is June 30, while the District’s is year end. The chart below comparesthe sewer billing cash as collected by the District on their behalf and the District’s assessment forservices rendered. The municipality may incur additional sewer-related costs. The municipalitydetermines whether or not to increase the sewer billing rates.
$923,878
$823,257
$731,784
$722,862
$889,577
$889,577
$889,577
$885,617
$- $200,000 $400,000 $600,000 $800,000 $1,000,000
FYE June 30,2017
FYE June 30,2016
FYE June 30,2015
FYE June 30,2014
Town Billing Revenue PWD Assessment
Revenue Assumptions:
- Consumption is the 12months ending June30, 2014
- Rates Assumed:
Effective Base/Per HCFDate:
Jul 2013 $34.25/$4.96Sep 2013 $34.25/$5.29

60 Budget by Fund – Wastewater, Cumberland
2015 Operating Expense Highlights
Salaries/Wages – This expense isbudgeted to increase 8.8% or $4,744 to$58,804. District labor rates increased anaverage of 2.0% and hours for this fundincreased 7.0% (162 hours). The majorityof the change was the 100 hour increasefor dig safe locates related to gas lineinstallations. A total of 2,472 hours (1.2full time equivalents) were budgeted for2015 and were distributed as follows:
Employee Benefits – Benefits, which are charged as a percentage of regular wages, increased 10.8%($2,908) to a total of $29,760. The benefit rate increased 3.3% due to increases in health insurance andpension costs.
Contracted Services – This category involves payments to the Town of Falmouth for wastewatertreatment services which decreased $45,269 or 11.3% to a budgeted amount $355,531. This amount isconsistent with projections provided by the Town of Falmouth in 2014, except it does not include theproposed Mill Creek project as it is deemed unlikely to be constructed in time to impact the 2015budget. Last year Falmouth included $45,000 of one-time capital projects.
Materials & Supplies – The budget for this item declined $4,650 or 37.3% because of generator partsthat were needed in the 2014 Budget not being needed in 2015.
Purchased Power – The budget for purchased power remained nearly flat with an increase of $98 to abudget of $25,857. This represents an increase of 0.4%.
Transportation – Transportation costs had a small decline. The budget requested is a decrease of $875(3.3%) to an annual budget of $25,258.
Support Services – These costs are related to general work done that cannot be directly charged to afund as noted above (such as customer service, billing or computer support) or work done on behalf ofseveral municipalities at the same time (engineering or laboratory services) that is allocated based onthe value to each fund.
The combined Support Services costs increased 7.4% ($10,163); most of the increase ($7,492) was in theAdministrative area. This allocation is done via a three year average of overall costs relative to the otherfunds; Cumberland’s costs have risen over the past few years due to increasing charges from the Townof Falmouth for wastewater treatment.
Debt Service - The annual principal and interest payments on bonds issued to finance capital projects.No new debt is expected to be issued in 2015 and the expense will decline 1.4% ($216).
Renewal and Replacement – This is the annual contribution to a fund to finance smaller capital projects.A contribution of $27,380 will be made in 2015.
Systems87%
Digsafes8%
Other Depts5%
Labor Hours Distribution

61 Budget by Fund – Wastewater, Cumberland
2013
Actual
2014
Jan-Jun
2014
Budget
2015
Budget
Budget
Diff $
Budget
Diff %
Assessment Income $713,940 $365,532 $731,784 $731,784 $0 0.0%
Interest Income 2,002 1,100 1,762 1,911 149 8.5%
Total Revenue 715,942 366,632 733,546 733,695 149 0.0%
Salaries & Wages 50,695 31,649 54,060 58,804 4,744 8.8%
Employee Benefits 25,112 16,436 26,852 29,760 2,908 10.8%
Contracted Services 357,783 229,609 444,205 392,371 (51,834) -11.7%
Heat/Fuel Oil - - 170 170 - 0.0%
Insurance 2,214 1,962 1,063 2,544 1,481 139.3%
Materials & Supplies 13,836 1,774 12,450 7,800 (4,650) -37.3%
Purchased Power 23,035 13,617 25,859 25,957 98 0.4%
Tele/Other Utilties 385 398 425 425 - 0.0%
Transportation 24,041 11,513 26,133 25,258 (875) -3.3%
SS - Administration 79,570 41,533 86,871 94,363 7,492 8.6%
SS - Engineering Services 23,173 11,352 30,785 30,903 118 0.4%
SS - Wastewater Services 19,475 9,566 19,170 21,133 1,963 10.2%
SS - Water Services 885 1,784 1,271 1,861 590 46.4%
Departmental Expense 620,204 371,193 729,314 691,349 (37,965) -5.2%
Debt Service 15,420 7,562 15,182 14,966 (216) -1.4%
Renewal & Replace - Direct 35,000 9,814 19,628 19,628 - 0.0%
Renewal & Replace - Indirect 7,252 3,754 7,507 7,752 245 3.3%
Operating Expense 677,876 392,323 771,631 733,695 (37,936) -4.9%
Surplus (Deficit) 38,066 (25,691) (38,085) -
Write-off Bond Issuance Expense (460) - - -
Return of Surplus - - - -
Transfer to R&R - - - -
Prior Surplus 270,947 308,553 268,962 261,481
Accumulated Surplus 308,553 282,862 230,877 261,481
Contracted Services – Treatment Services from Town of Falmouth
Almost half of the annual budget relates to the costs assessed by the town of Falmouth for the use of
the treatment facility in Falmouth.
$364,201 $370,831 $378,164
$313,675$400,800 $355,531
$-
$100,000
$200,000
$300,000
$400,000
$500,000
$600,000
$700,000
$800,000
$900,000
2013 2014 2015
Falmouth Treatment
PWD

62 Budget by Fund – Wastewater, Cumberland
Operation Summary
Wastewater Treatment: The wastewater generated in the Town of Cumberland is collected andpumped to the Falmouth Wastewater Treatment Facility (FWWTF). Currently, the Town owns 30% ofdesign treatment plant capacity, or the ability to pump 468,000 gallons each day. The town is billedbased on the ratio of Cumberland flow to the total flow processed at the Falmouth facility. The tablebelow illustrates Cumberland’s flow contribution to the Falmouth plant in 2013.
Year Cumberland Flow Falmouth WWTF Flow % Cumberland Share
2013 227,041 gal/day 904,551 gal/day 25.1 %
FWWTF Cap. Cumberland Cap (30%) % Cap. Used Capacity Remaining
1,560,000 gal/day 468,000 gal/day 48.5 % 241,000 gal/day
Wastewater Conveyance – collectors, interceptors and pumping stations:
Parameter 2014 Actual to Oct 2015 Projected
Preventative Work Orders 167 180
Corrective 17 15
Wet wells cleaned 27 30
Debris removed 60.24 30
DWO 1 0
2014 Other Highlights• In preparation for pending upgrades to joint use pump stations in Falmouth, an I/I
investigation to determine peak flows from the area began in 2012. CCTV work will becompleted along with the repair of several issues that were previously identified. Furtherwork, including smoke testing, will continue through 2015. The Town and PWD begannegotiations for capacity in the upgraded pump station and force main.
• All pump stations are monitored 24/7 with our SCADA system and dispatch service.Operations staff will continue to visit each station on a weekly basis.
• The Asset Management Program will continue to drive the preventive maintenanceprogram, generating both monthly and annual preventive maintenance work orders foreach of the pump stations.
• Wet wells will continue to be scheduled for cleaning on a quarterly basis unless experiencedictates otherwise.
• A flow meter was installed on Route 1. Along with the Route 88 meter, this meters all flowsto the Falmouth system.
• A historic rain event in August 2013 flooded the area of the Powell Rd. Pump Station. Crewshad the pump station operating within hours and restored the pump station to fulloperation within a few days.
2015 Work Plan
• The Town and PWD will continue to work with Falmouth during the design of the upgrade tothe Mill Creek Pump Station in Falmouth. The I/I work, alongside the design of peak

63 Budget by Fund – Wastewater, Cumberland
capacity in the station, will be used to manage wet weather flows from the Cumberlandsystem.
• A generator will be installed at the Ledge Road Pump Station.• The Asset Management Program will continue to drive the preventive maintenance
program, generating both monthly and annual preventive maintenance work orders foreach of the pump stations.
• Wet wells will continue to be scheduled for cleaning on a quarterly basis unless experiencedictates otherwise.
Capital Summary
A five-year capital plan is updated each year. The projects are prioritized based on operational needsand financing availability.
Capital project expenditures are financed by issuance of bonds or distribution from the renewal andreplacement (R&R) fund. Wastewater bonds are usually issued through the Maine Municipal Bond Bankand utilize the state revolving loan fund (SRF) for eligible projects, which provides a 2% below marketinterest rate. The renewal and replacement fund is appropriated $19,628 from the annual assessment in2015. For certain projects within the town’s tax increment finance (TIF) area, the town may contributefunds to pay for capital projects.
The planned projects are listed below:
Cumberland Pump Stations – 41: Brookside Pump Station generator ($20,000) and routine andequipment renewal and replacements ($20,000) for a total of $40,000. These projects will be financedthrough the renewal and replacement fund.
SCADA/Process Control Program – 177: East End Treatment Plant SCADA upgrades and various processand management systems ($8,740), financed from the renewal and replacement fund.
2013 Actual 2014 Projected 2015 Budget
Capital Fund:
Beginning of Year Fund Balance $264,675 $284,076 $227,204
Source of Funds:
Bond Proceeds - prior year(s) - - -
Bond Proceeds - current year - - -
Bond Proceeds - future year(s) - - -
Outside Contribution 53,975 - -
Renewal and Replacement Contribution 35,000 19,628 19,628
Operating Surplus Transfer - - -
Capital Funding 88,975 19,628 19,628
Capital Expenditures:
Pump Station - Contributed 53,975 -
Pump Station R&R – 41 15,599 76,500 40,000
SCADA Systems Controls (prorated) - 177 - - 8,740
Capital Expenditures 69,574 76,500 48,740
End of Year Fund Balance 284,076 227,204 198,092

64 Budget by Fund – Wastewater, Cumberland
Projections for Rate-Making Purposes
Multi-year projections are made for each of the wastewater funds’ assessment. The projections provideguidance to the wastewater municipalities to assist them in determining their wastewater sewer rates. Asummary of the projection is provided on next page.
Major Assumptions:The assumptions incorporated in the projections are as follows:
Salary increases of 2% each year. Maintain same number of employees.
Benefit increases of 5% each year. Assumed pension contribution increased to $1 million a yearin 2015 and health insurance increases 7 % per year.
Other expenses increase by 2.5% in 2015-2016 and 3.5% in subsequent years.
The $5.9 million Mill Creek Pump Station upgrade impact is assumed to begin in 2016.
Summary
Assessment is projected to increase to $970,720 by 2019 with the most significant cost change relatedto Town of Falmouth’s assessment increase due to the Mill Creek pump station upgrade. OperatingReserve balance and debt ratios are expected to better than target.
Reserve Fund Balance
$0
$200
$400
$600
$800
2010 2011 2012 2013 2014 2015 2016 2017 2018 2019
Cumberland($,000)
Capital
Operating
Percent of Budget Dedicated to Debt Service – Target: Not to Exceed 35%Funds 2014 2015 2016 2017 2018 2019
Cumberland 2% 2% 2% 2% 2% 2%
Debt Service Ratio – Target: Greater or Equal to 1.25Funds 2014 2015 2016 2017 2018 2019
Cumberland 0.28 2.81 2.05 3.30 4.58 5.89
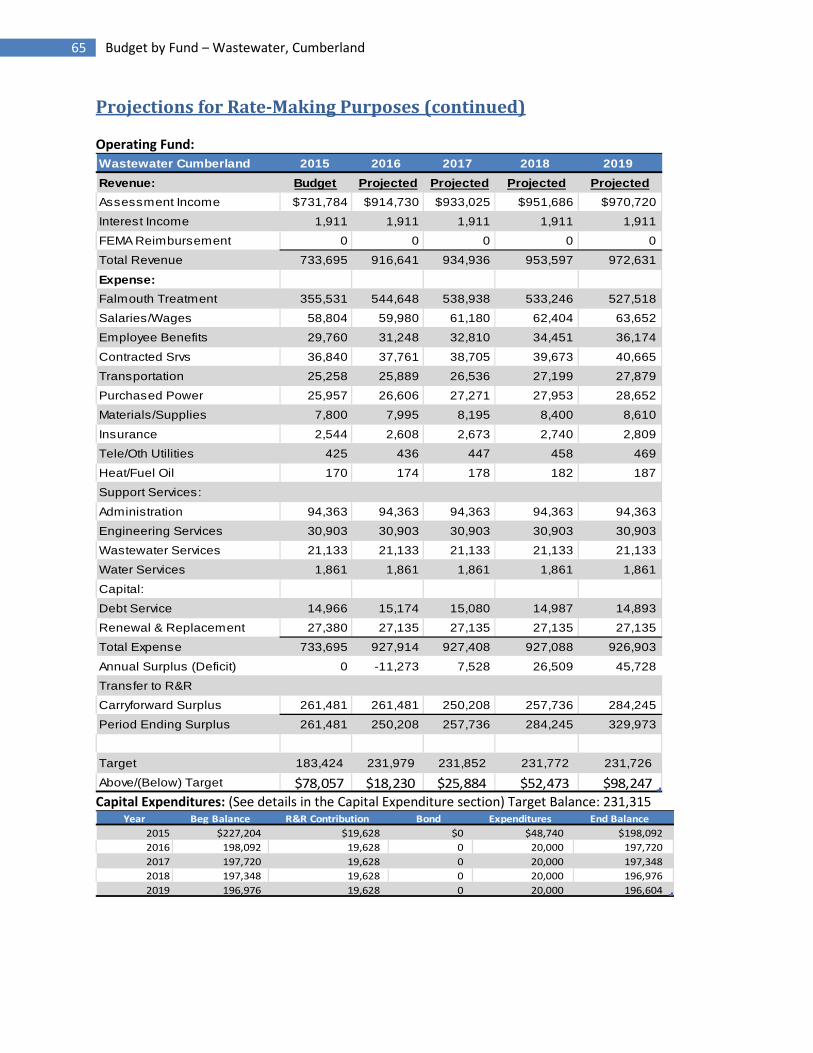
65 Budget by Fund – Wastewater, Cumberland
Projections for Rate-Making Purposes (continued)
Operating Fund:
Wastewater Cumberland 2015 2016 2017 2018 2019
Revenue: Budget Projected Projected Projected Projected
Assessment Income $731,784 $914,730 $933,025 $951,686 $970,720
Interest Income 1,911 1,911 1,911 1,911 1,911
FEMA Reimbursement 0 0 0 0 0
Total Revenue 733,695 916,641 934,936 953,597 972,631
Expense:
Falmouth Treatment 355,531 544,648 538,938 533,246 527,518
Salaries/Wages 58,804 59,980 61,180 62,404 63,652
Employee Benefits 29,760 31,248 32,810 34,451 36,174
Contracted Srvs 36,840 37,761 38,705 39,673 40,665
Transportation 25,258 25,889 26,536 27,199 27,879
Purchased Power 25,957 26,606 27,271 27,953 28,652
Materials/Supplies 7,800 7,995 8,195 8,400 8,610
Insurance 2,544 2,608 2,673 2,740 2,809
Tele/Oth Utilities 425 436 447 458 469
Heat/Fuel Oil 170 174 178 182 187
Support Services:
Administration 94,363 94,363 94,363 94,363 94,363
Engineering Services 30,903 30,903 30,903 30,903 30,903
Wastewater Services 21,133 21,133 21,133 21,133 21,133
Water Services 1,861 1,861 1,861 1,861 1,861
Capital:
Debt Service 14,966 15,174 15,080 14,987 14,893
Renewal & Replacement 27,380 27,135 27,135 27,135 27,135
Total Expense 733,695 927,914 927,408 927,088 926,903
Annual Surplus (Deficit) 0 -11,273 7,528 26,509 45,728
Transfer to R&R
Carryforward Surplus 261,481 261,481 250,208 257,736 284,245
Period Ending Surplus 261,481 250,208 257,736 284,245 329,973
Target 183,424 231,979 231,852 231,772 231,726
Above/(Below) Target $78,057 $18,230 $25,884 $52,473 $98,247
Capital Expenditures: (See details in the Capital Expenditure section) Target Balance: 231,315Year Beg Balance R&R Contribution Bond Expenditures End Balance
2015 $227,204 $19,628 $0 $48,740 $198,092
2016 198,092 19,628 0 20,000 197,720
2017 197,720 19,628 0 20,000 197,348
2018 197,348 19,628 0 20,000 196,976
2019 196,976 19,628 0 20,000 196,604

66 Budget by Fund – Wastewater, Gorham
Fund: Wastewater - Gorham
Background
The Portland Water District’s charter authorizes the District to provide wastewater treatment andcollection system-interceptors service to the town. By contract with the town, the District additionallyoperates and maintains the collectors in the sewer collection system. Gorham’s wastewater is treated atthe treatment facility located in Westbrook and jointly used by the Town of Windham and City ofWestbrook. Additionally, by contract, the District provides utility billing services.
Summary of Services
Provided:
Treatment
0.53 million
gallons/day
Collection System
9 Gorham only & 3
Joint use Pump
Stations with 28 miles
of pipe
Utility Billing
Annual Billings of
$1,065,140 on 1,655
Customers (avg.
$53.35/month)

67 Budget by Fund – Wastewater, Gorham
Fund: Wastewater - Gorham
2015 Financial SummaryThe proposed assessment is $1,106,148; this isthe same assessment as the prior year. Theassessment is $33,184 less than the forecastedassessment provided the town last year.
The proposed 2015 Operating Expense andCapital budgets are $1,128,383 and $58,249,respectively.
The Operating Expense budget increase is $6,712or 0.6%. The small increase was related to thereductions in salaries/wages, employee benefitsand contracted services.
The capital projects in 2015 include upgrades atthe regional wastewater treatment plant. Thecapital work will be funded by renewal andreplacement funds.
Debt Service36.7%
Salaries/Wages
9.0%Renewal &
Replacement7.1%
Contracted
Services6.1%
Employee
Benefits
4.5%
Al l Other
Expenses
36.5%
2015 Operating Expense
Assessment Compared to Ratepayers’ BillingThe municipality’s fiscal year end is June 30, while the District’s is year end. The chart below comparesthe sewer billing cash as collected by the District on their behalf and the District’s assessment forservices rendered. The municipality may incur additional sewer-related costs. The municipalitydetermines whether or not to increase the sewer billing rates.
$1,106,148
$1,106,148
$1,095,306
$1,065,104
$1,065,104
$1,065,140
$1,040,000 $1,060,000 $1,080,000 $1,100,000
FYE June 30,2016
FYE June 30,2015
FYE June 30,2014
Town Billing Revenue PWD Assessment
Revenue Assumptions:
- Consumption is the 12months ending June30, 2014
- Rates Assumed:
Effective Base/Per HCFDate:
Nov 2006 $13.74/6.29
No change in rates since11/1/2006.

68 Budget by Fund – Wastewater, Gorham
2015 Operating Expense Highlights
Salaries/Wages – The budget for salariesand wages is related to the labor required todeliver wastewater services. Treatmentplant costs are allocated based on flows.The budget decreased $16,139 (15.9%) to$85,329 which is in line with the prior yearactual ($82,197) and the projected full costfor 2014 (approximately $86,000). A totalof 3,571 hours (1.4 full time equivalents)were budgeted for 2015 and weredistributed as follows:
Employee Benefits – This cost is charged asa percentage of regular wages. With the decrease in salaries/wages, this line decreased to $7,055(14.0%). The benefit rate increased 3.3% due to increases in health insurance and pension costs.
Biosolids Disposal – The budget assumed the volume of wet tons disposed would increase by 6.2%along with an estimated 2.5% increase in the disposal rate. Those items increased costs of disposal atthe Westbrook Regional WWTF by 8.6%. However, due to a reduction in flows, Gorham’s share oftreatment costs decreased from 14.0% in 2014 to 13.0% in 2015. The result was only a 0.9% ($370)increase in expense.
Contracted Services – The budget for this item decreased $17,805 (25.9%) mostly due to a reduction inthe amount of CCTV (inspection by video) of sewer lines being done.
Purchased Power – The budget for power is expected to decrease by 3.9% or $1,600 to $39,370. Thedecrease is due mainly to the smaller percentage of joint flows attributable to Gorham noted above.
Transportation – Transportation costs decreased $1,819 or 5.9% to a total of $29,189. This change isrelated to the decrease in labor costs noted above.
Support Services – These costs are related to general work done that cannot be directly charged to afund as noted above (such as customer billing or information technology) or work done on behalf ofseveral municipalities at the same time (engineering or laboratory services) that is allocated based onthe value to each fund. The combined Support Services costs decreased 2.1% ($5,548). The decreasein the Wastewater ($6,260) is attributed to the labor decrease as costs in this area are allocated on thatbasis.
Debt Service - The annual principal and interest payments on bonds issued to finance capital projects.This item decreased 1.5% ($5,973) as older bond issues were retired.
Renewal & Replacement - Dollars put aside to fund smaller capital projects. A contribution of $139,646will be made in 2015.
Treatment32%
Systems55%
Facilities/Digsafe/Pretreat/Col
lections13%
Labor Hours Distribution
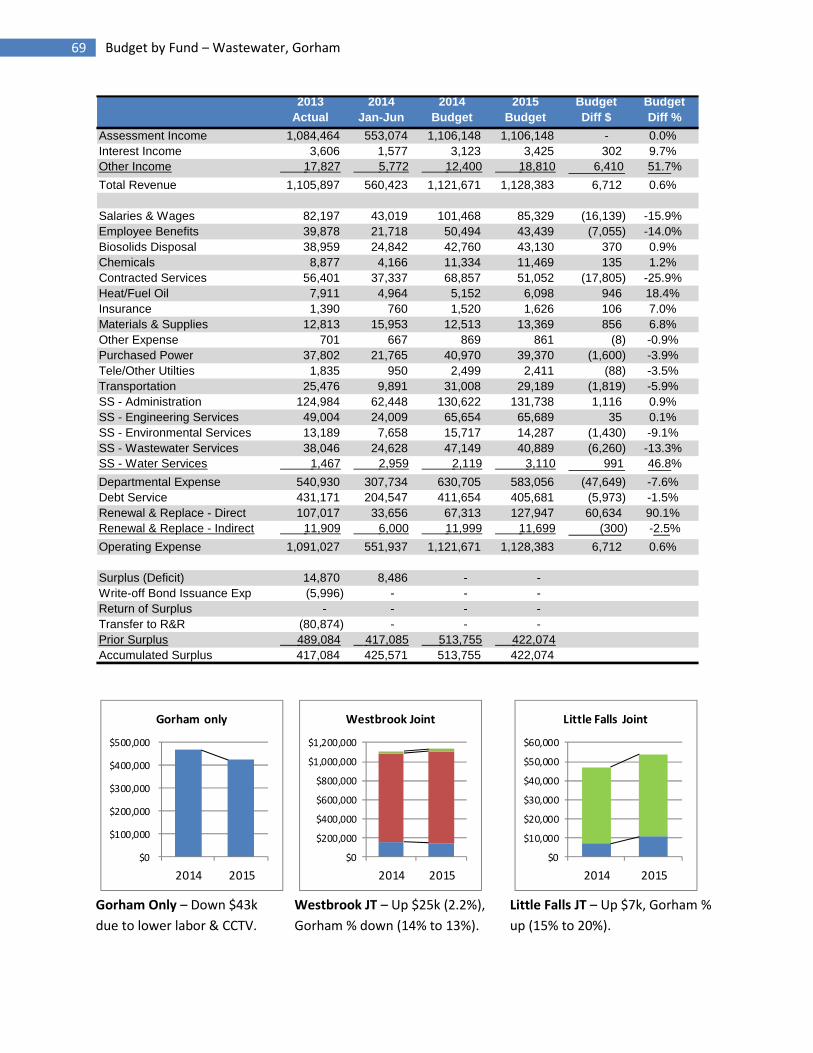
69 Budget by Fund – Wastewater, Gorham
2013
Actual
2014
Jan-Jun
2014
Budget
2015
Budget
Budget
Diff $
Budget
Diff %
Assessment Income 1,084,464 553,074 1,106,148 1,106,148 - 0.0%
Interest Income 3,606 1,577 3,123 3,425 302 9.7%
Other Income 17,827 5,772 12,400 18,810 6,410 51.7%
Total Revenue 1,105,897 560,423 1,121,671 1,128,383 6,712 0.6%
Salaries & Wages 82,197 43,019 101,468 85,329 (16,139) -15.9%
Employee Benefits 39,878 21,718 50,494 43,439 (7,055) -14.0%
Biosolids Disposal 38,959 24,842 42,760 43,130 370 0.9%
Chemicals 8,877 4,166 11,334 11,469 135 1.2%
Contracted Services 56,401 37,337 68,857 51,052 (17,805) -25.9%
Heat/Fuel Oil 7,911 4,964 5,152 6,098 946 18.4%
Insurance 1,390 760 1,520 1,626 106 7.0%
Materials & Supplies 12,813 15,953 12,513 13,369 856 6.8%
Other Expense 701 667 869 861 (8) -0.9%
Purchased Power 37,802 21,765 40,970 39,370 (1,600) -3.9%
Tele/Other Utilties 1,835 950 2,499 2,411 (88) -3.5%
Transportation 25,476 9,891 31,008 29,189 (1,819) -5.9%
SS - Administration 124,984 62,448 130,622 131,738 1,116 0.9%
SS - Engineering Services 49,004 24,009 65,654 65,689 35 0.1%
SS - Environmental Services 13,189 7,658 15,717 14,287 (1,430) -9.1%
SS - Wastewater Services 38,046 24,628 47,149 40,889 (6,260) -13.3%
SS - Water Services 1,467 2,959 2,119 3,110 991 46.8%
Departmental Expense 540,930 307,734 630,705 583,056 (47,649) -7.6%
Debt Service 431,171 204,547 411,654 405,681 (5,973) -1.5%
Renewal & Replace - Direct 107,017 33,656 67,313 127,947 60,634 90.1%
Renewal & Replace - Indirect 11,909 6,000 11,999 11,699 (300) -2.5%
Operating Expense 1,091,027 551,937 1,121,671 1,128,383 6,712 0.6%
Surplus (Deficit) 14,870 8,486 - -
Write-off Bond Issuance Exp (5,996) - - -
Return of Surplus - - - -
Transfer to R&R (80,874) - - -
Prior Surplus 489,084 417,085 513,755 422,074
Accumulated Surplus 417,084 425,571 513,755 422,074
$0
$100,000
$200,000
$300,000
$400,000
$500,000
2014 2015
Gorham only
Gorham Only – Down $43k
due to lower labor & CCTV.
$0
$200,000
$400,000
$600,000
$800,000
$1,000,000
$1,200,000
2014 2015
Westbrook Joint
Westbrook JT – Up $25k (2.2%),
Gorham % down (14% to 13%).
$0
$10,000
$20,000
$30,000
$40,000
$50,000
$60,000
2014 2015
Little Falls Joint
Little Falls JT – Up $7k, Gorham %
up (15% to 20%).

70 Budget by Fund – Wastewater, Gorham
Operation Summary
Wastewater Treatment: All wastewater generated in Gorham is being treated at the Westbrook/Gorham/Windham Regional WWTF. The table below depicts flow from Gorham to the regional facilityand from the Little Falls section of Gorham to the regional facility. The Town of Gorham sharesoperational costs at the treatment facility in Westbrook based on the amount of flow the towncontributes to the total flow through the treatment facility. Gorham has 30.8 % of the treatment facilitycapacity, or 1,398,320 gallons per day.
Area 2013 GorhamFlow
Westbrook WWTF Flow % Gorham Share
Total Gorham Flow 531,387 gal/day 2,953,200 gal/day 18.0 %
WGWWTFCapacity
Gorham Capacity(30.8%)
2013 - % Capacity Used Capacity Remaining
4,540,000 gal/day 1,398,320 gal/day 38.0 % 866,933 gal/day
Wastewater Conveyance – interceptors and pumping stations
Parameter 2014 Actual to Oct 2015 Projected
Preventative Work Orders 188 190
Corrective 19 20
Wet wells cleaned 25 30
Debris removed 35.66 35
DWO 1 0
2014 Other Highlights
• The Asset Management Program will continue to drive the preventive maintenanceprogram, generating both monthly and annual preventive maintenance work orders foreach of the pump stations.
• Wet wells will continue to be scheduled for cleaning on a quarterly basis.• Ownership of the Heartwood Pump Station will be transferred to the District in 2014.• Emergency generators installed at existing pump stations, and the installation of generators
as part of new installations has reduced the need to respond to these critical stations duringsystem power failures, improving the level of service to customers.
• The odor control system at the Mallison Falls Pump Station has worked well since it wasinstalled in the summer of 2012. We have received no odor complaints since its installation.
2015 Work Plan
• The Asset Management Program will continue to drive the preventive maintenanceprogram, generating both monthly and annual preventive maintenance work orders foreach of the pump stations.
• Wet wells will continue to be scheduled for cleaning on a quarterly basis.

71 Budget by Fund – Wastewater, Gorham
Capital Summary
A five-year capital plan is updated each year. The projects are prioritized based on operational needsand financing availability.
Capital project expenditures are financed by issuance of bonds or distribution from the renewal andreplacement (R&R) fund. Wastewater bonds are usually issued through the Maine Municipal Bond Bankand utilize the state revolving loan fund (SRF) for eligible projects, which provides a 2% below marketinterest rate. The renewal and replacement fund is appropriated $127,947 from the annual assessmentin 2015.
The planned projects are listed below:
Regional Treatment Plant Capital – 167: A Secondary Clarifier Evaluation ($30,000) for the WestbrookTreatment Facility will be a deferred operating expense. Gorham will pay a prorated share of the costs($9,240 or 30.8%).
SCADA/Process Control Program – 177: East End Treatment Plant SCADA upgrades and various processand management systems ($11,289), financed from the renewal and replacement fund.
Regional Treatment Plant R&R – 416: Routine and equipment renewal and replacements ($50,000) aswell as Security Upgrades ($30,000) and Sludge Dewatering Pilot Testing ($10,000) will be financedthrough the renewal and replacement fund. Gorham will pay a prorated share of the costs ($27,720).
Gorham Pump Station Repair – 60: Routine and equipment renewal and replacements ($10,000). Theseprojects will be financed through the renewal and replacement fund. These stations are Gorham only;therefore Gorham pays 100% of the costs to repair.
Capital Fund: 2013 Actual 2014 Projected 2015 Budget
Beginning of Year Fund Balance $456,089 $518,731 $408,703
Source of Funds:
Bond Proceeds - prior year(s) - - -
Bond Proceeds - current year - - -
Bond Proceeds - future year(s) - - -
Outside Contribution 721,563 - -
Renewal and Replacement Contribution 107,017 67,313 127,947
Operating Surplus Transfer 80,874 - -
Capital Funding 909,454 67,313 127,947
Capital Expenditures:
Gorham Pump Station R&R – 60 60,103 51,831 10,000WWTF Flow Splitting (prorated) – 167 721,563 80,850 9,240WWTF Aeration Evaluation (prorated) – 167 - 29,260 -
SCADA System Controls @ WWTF(prorated) -177 65,146 11,289
Treatment Plant R&R (prorated) – 416 - 15,400 27,720
Capital Expenditures 846,812 177,341 58,249
End of Year Fund Balance 518,731 408,703 478,401

72 Budget by Fund – Wastewater, Gorham
Projections for Rate-Making Purposes
Multi-year projections are made for each of the wastewater funds’ assessment. The projections provideguidance to the wastewater municipalities to assist them in determining their wastewater sewer rates. Asummary of the projection is provided on next page.
Summary
Major Assumptions:
The assumptions incorporated in the projections are as follows:
Salary increases of 2% each year. Maintain same number of employees.
Benefit increases of 5% each year. Assumed pension contribution increased to $1 million a yearin 2015 and health insurance increases 7 % per year.
Other expenses increase by 2.5% in 2015-2016 and 3.5% in subsequent years. Biosolids costs areassumed to increase by an additional 5% when the current contract expires in 2016.
New debt service and renewal/replacement fund expenditures consistent with the 2015 5-yearcapital plan (new debt assumed a 20 year life at 5%). The most significant project is the $1.2million aeration system upgrade at the Westbrook Regional Treatment Facility. The estimatedcost is preliminary and may be higher.
Summary
Assessment is projected to increase to $1,196,782 by 2019, an 8% increase. Reserves balance and debtratios are expected to better than target.
Reserve Fund Balances
$0
$200
$400
$600
$800
$1,000
$1,200
$1,400
2010 2011 2012 2013 2014 2015 2016 2017 2018 2019
Gorham($,000)
Capital
Operating
Percent of Budget Dedicated to Debt Service – Target: Not to Exceed 35%Funds 2014 2015 2016 2017 2018 2019
Gorham 37% 36% 35% 34% 35% 33%
Debt Service Ratio – Target: Greater or Equal to 1.25Funds 2014 2015 2016 2017 2018 2019
Gorham 1.19 1.34 1.32 1.35 1.33 1.41

73 Budget by Fund – Wastewater, Gorham
Projections for Rate-Making Purposes (continued)Operating Fund:
Wastewater Gorham 2015 2016 2017 2018 2019
Revenue: Budget Projected Projected Projected Projected
Assessment Income $1,106,148 $1,106,148 $1,117,209 $1,156,311 $1,196,782
Other Income 18,810 18,810 18,810 18,810 18,810
Interest Income 3,425 3,425 3,425 3,425 3,425
Total Revenue 1,128,383 1,128,383 1,139,444 1,178,546 1,219,017
Expense:
Contracted Srvs 51,052 52,328 54,159 56,055 58,017
Salaries/Wages 85,329 87,036 88,777 90,553 92,364
Employee Benefits 43,439 45,611 47,892 50,287 52,801
Purchased Power 39,370 39,370 40,748 42,174 43,650
Biosolids Disposal 43,130 46,429 48,054 49,736 51,477
Transportation 29,189 29,919 30,966 32,050 33,172
Chemicals 11,469 11,756 12,167 12,593 13,034
Materials/Supplies 13,369 13,703 14,183 14,679 15,193
Heat/Fuel Oil 6,098 6,250 6,469 6,695 6,929
Tele/Oth Utilities 2,411 2,471 2,557 2,646 2,739
Insurance 1,626 1,667 1,725 1,785 1,847
Other Expense 861 883 914 946 979
Support Services:
Administration 131,738 135,031 138,407 141,867 145,414
Engineering Services 65,689 67,331 69,014 70,739 72,507
Environmental Services 14,287 14,644 15,010 15,385 15,770
Wastewater Services 40,889 41,911 42,959 44,033 45,134
Water Services 3,110 3,188 3,268 3,350 3,434
Capital:
Debt Service 405,681 399,772 387,295 408,512 401,761
Renewal & Replacement 139,646 129,083 134,880 134,461 162,795
Total Expense 1,128,383 1,128,383 1,139,444 1,178,546 1,219,017
Annual Surplus (Deficit) 0 0 0 0 0
Transfer to R&R
Carryforward Surplus 422,074 422,074 422,074 422,074 422,074
Period Ending Surplus 422,074 422,074 422,074 422,074 422,074
Target 282,096 282,096 284,861 294,637 304,754
Above Target $139,978 $139,978 $137,213 $127,438 $117,320
Capital Expenditures: (See details in the Capital Expenditure section) Target Balance: $524,756Year Beg Balance R&R Contribution Bond Expenditures End Balance
2015 $408,703 $127,947 $0 $58,249 $478,401
2016 478,401 117,384 0 $84,440 511,345
2017 511,345 123,181 355,658 $386,910 603,274
2018 603,274 122,762 0 $25,400 700,636
2019 700,636 151,096 0 $25,400 826,332

74 Budget by Fund – Wastewater, Portland
Fund: Wastewater - Portland
Background
The Portland Water District’s charter authorizes the District to provide wastewater treatment andcollection system-interception services to the city. By contract with the city, the District provides PeaksIsland’s collection system-collector and storm water system services. The city maintains the mainland’scollection system- collectors that transport wastewater from user’s property to the District’sinterceptors. Additionally, by contract, the District provides utility billing services.
Summary of Services
Provided:
Treatment
Mainland: 17.22 million
gallons/day
Peaks Island: 0.088
million gallons/day
Collection System
13 Pump Stations with
23.1 miles of pipe
Storm Water system
Peaks Island with 1.7
miles of pipe
Utility Billing
Annual Billings of
$21,587,047on 16,960
Customers (avg.
$105.45/month)

75 Budget by Fund – Wastewater, Portland
Fund: Wastewater - Portland
2015 Financial Summary
The city’s assessment will increase 1.0% or$109,104 to $10,981,308. The assessment is$271,423 less than the forecastedassessment provided the city last year.
The proposed 2015 Operating Expense andCapital budgets are $11,095,444 and$11,906,477, respectively.
The Operating Expense budget is $113,047,or 1.0%, higher than the previous year.Departmental expense increased by 3.1% or$250,725. Debt service decreased $137,848and renewal & replacement (direct andindirect) of $846,427 remained at essentially thesame level as 2017 with an increase of $ 170.
Assessment Compared to Ratepayers’ BillingThe municipality’s fiscal year end is June 30, while the District’s is year end. The chart below comparesthe sewer billing cash as collected by the District on their behalf and the District’s assessment forservices rendered. The municipality may incur additional sewer-related costs. The municipalitydetermines whether or not to increase the sewer billing rates.
$11,651,466
$11,651,466
$11,062,470
$11,255,841
$11,255,841
$10,926,756
$10,706,124
$23,834,599
$26,152,664
$24,189,023
$21,587,047
$- $10,000,000 $20,000,000 $30,000,000
FYE June 30,2016 storm waterimplemented
FYE June 30,2016
FYE June 30,2015
FYE June 30,2014
Town Billing Revenue PWD Assessment PWD Assessment in City's Study
Debt Service17.7%
Salaries &Wages10.5%
BiosolidsDisposal
9.4%
PurchasedPower8.6%
Renewal &Replacement -
Direct6.6%
OtherExpenses
47.2%
2015 Operating Expense
Revenue Assumptions:- Consumption is the 12
months ending June30, 2014
- Rates Assumed:
Effective Base/Per HCFDate:Jul 1 2013 $8.35Jul 1 2014 $8.81Jul 1 2015 $9.70
If stormwater feeimplemented, sewer feereduction:Jan 1, 2016 $8.20

76 Budget by Fund – Wastewater, Portland
2015 Operating Expense Highlights
Salaries/Wages – Budgeted expensesincreased 3.8% or $43,019 to $1,168,388.The increase was due to the average2.0% increase in wage rates and a smallincrease (1.2%) in budgeted hours due toreassignment of personnel due to a staffretirement. A total of 48,394 hours (23.3full time equivalents) were budgeted for2015.
Employee Benefits – This cost is chargedas a percentage of regular wages and theincrease in this category was 7.3% or$39,171 to a total of $573,812. Thebenefit rate increased 3.3% due to increases in health insurance and pension costs.
Biosolids Disposal – The budget for this item was increased 6.3% ($61,935). The budget assumes cost ofdisposal will increase by 2.5% per ton and that the wet tons disposed will increase by 3.7%. The Budgetalso assumes that the percent solids of the waste will stay the same at 23.5%.
Chemicals – The budget for this area was increased by $41,874 (8.0%). The increase was due to the 30%increase in the budgeted usage of sodium hypochlorite at the East End WWTF. The 2015 Budgetedusage matches the norm for the past two years, the higher usage improves the disinfection process atthe facility and has improved compliance with the effluent permit requirement.
Contracted Services – This budget item includes engineering services, control system programming, andmaintenance services. This budget was increased 8.9% or $46,407. The majority of that increase wasthe $32,100 added to the budget for contracted treatment services. This expense, paid to the City ofWestbrook for treatment of waste from the Riverside Street area. Though it has been paid in prior yearit was not budgeted.
Purchased Power – Purchased power use has been reduced by $46,816 (4.7%) to a total of $952,977.Energy rates remained the same while transmission and distribution rates have dropped at both the EastEnd WWTF and the India Street Pump Station.
Support Services – These costs are related to general work done that cannot be directly charged to afund as noted above (such as customer billing or information technology) or work done on behalf ofseveral municipalities at the same time (engineering or laboratory services) that is allocated based onthe value to each fund. The combined Support Services costs increased 3.9% ($102,296). The largestpercentage increase was from Wastewater (5.7%) due to a shift in budgeted labor hours (the basis forthe allocation) towards Portland. This shift better aligns the budget with past actual labor hours.
Debt Service - The annual principal and interest payments on bonds issued to finance capital projects.The expense will decrease $137,848 (6.5%) in the 2015 budget.
Treatment74%
Systems17%
Other Depts9%
Labor Hours Distribution

77 Budget by Fund – Wastewater, Portland
Renewal and Replacement – This is the fund’s annual contribution to a fund to finance smaller capitalprojects. A contribution of $844,427 will be made in 2015.
2013
Actual
2014
Jan-Jun
2014
Budget
2015
Budget
Budget
Diff $
Budget
Diff %
Assessment Income 10,540,044 5,436,102 10,872,204 10,981,308 109,104 1.0%
Interest Income 17,597 10,630 16,793 17,186 393 2.3%
Other Income 96,950 39,197 93,400 96,950 3,550 3.8%
Total Revenue 10,654,591 5,485,929 10,982,397 11,095,444 113,047 1.0%
Salaries & Wages 1,111,732 549,250 1,125,369 1,168,388 43,019 3.8%
Employee Benefits 513,253 267,793 534,641 573,812 39,171 7.3%
Biosolids Disposal 1,038,609 569,016 979,072 1,041,007 61,935 6.3%
Chemicals 544,221 347,537 524,708 566,582 41,874 8.0%
Contracted Services 443,195 141,706 523,144 569,551 46,407 8.9%
Heat/Fuel Oil 136,633 101,611 168,628 156,027 (12,601) -7.5%
Insurance 24,884 13,097 26,112 28,058 1,946 7.5%
Materials & Supplies 263,961 96,133 271,288 273,000 1,712 0.6%
Other Expense 48,704 (9,265) 15,507 15,772 265 1.7%
Purchased Power 1,023,377 445,704 999,793 952,977 (46,816) -4.7%
Tele/Other Utilties 83,656 43,600 107,807 97,948 (9,859) -9.1%
Transportation 134,009 35,783 116,260 97,636 (18,624) -16.0%
SS - Administration 1,169,486 599,889 1,254,504 1,303,461 48,957 3.9%
SS - Engineering Services 313,098 158,924 422,785 428,393 5,608 1.3%
SS - Environmental Services 258,708 129,145 263,206 266,260 3,054 1.2%
SS - Wastewater Services 715,367 337,551 673,094 711,173 38,079 5.7%
SS - Water Services 17,447 35,148 25,117 31,715 6,598 26.3%
Departmental Expense 7,840,138 3,862,622 8,031,035 8,281,760 250,725 3.1%
Debt Service 1,887,315 1,050,099 2,107,105 1,969,257 (137,848) -6.5%
Renewal & Replacement - Direct 728,196 364,098 728,196 728,196 - 0.0%
Renewal & Replace - Indirect 114,966 58,031 116,061 116,231 170 0.1%
Operating Expense 10,570,615 5,334,850 10,982,397 11,095,444 113,047 1.0%
Surplus (Deficit) 83,976 151,079 - -
Write-off Bond Issuance Expense (31,590) - - -
Return of Surplus - - - -
Transfer to R&R (52,386) - - -
Prior Surplus 3,324,976 3,324,976 3,378,578 3,584,761
Accumulated Surplus 3,324,976 3,476,055 3,378,578 3,584,761

78 Budget by Fund – Wastewater, Portland
Operation Summary
Wastewater Treatment: The Portland Water District operates and maintains the treatment facilities forthe City of Portland. The largest facility, East End WWTF located off of the Eastern Promenadeexperienced a year of excellent compliance with the effluent permit in 2013. Below is a chart depictingthe average results of four key parameters for 2013.
EEWTF Parameter DEP Limit 2013 Facility Avg 2013 -%Capacity Used
Flow (million gal per day) 19.8 mgd 17.22 mgd 87.0 %
Biological Oxygen Demand (BOD) (lbs/day) * 7,431 lbs/day 2,233 lbs/day
Total Suspended Solids (TSS) (lbs/day) ** 7,431 lbs/day 1,530 lbs/day
Biosolids Removed (wet tons/month) N/A 1,374 wt/month
* Measure of organic material ** Measure of suspended material
The treatment facility on Peaks Island provides wastewater treatment to the residents and business onPeaks Island. Waste solids generated on the island are shipped to the mainland and generally processedat the EEWTF.
Wastewater Conveyance – interceptors and pumping stations
Parameter 2013 Actual to Oct 2014 Projected
Preventative Work Orders 144 150
Corrective 53 50
Wet wells cleaned 7 15
Debris removed 5.8 15
DWO 1 0

79 Budget by Fund – Wastewater, Portland
Operation Summary (continued)
2014 Other Highlights
• Monthly CSO activities continue to be monitored and reported by PWD for regulardistribution to stakeholders. Sites are continuously monitored by web base software.
• In response to concerns regarding odors from the facility, an odor management plan andnotification system was implemented. The intensity and volume of odor complaints hasbeen reduced through these efforts.
• The Peaks Island Facility continued to operate well through the summer due to operationalchanges implemented by staff to accommodate the high seasonal loadings. Controlsimprovements in 2013 have enhanced the plant’s performance and the ability for the plantto be operated remotely.
• District Staff has worked with the City of Portland on the expansion of the Peaks Islandcollection system. The project was completed in 2013. The City has completed inspectionsof residential systems to identify sources of I/I that will be removed to allow for theadditional flow associated with the expansion. Several of these have been addressed by theCity.
• Design of an aeration system began in 2014. Construction on this much needed project isexpected to begin in 2015.
2015 Work Plan
• The Asset Management Program will continue to drive the preventive maintenanceprogram, generating both monthly and annual preventive maintenance work orders foreach of the pump stations in Portland.
• Plant operations will continue to focus on improving plant performance through processcontrol efforts.
• Construction of the aeration system will begin in 2015.• Construction of the Fore River Pump Station upgrade will begin in 2015.

80 Budget by Fund – Wastewater, Portland
Capital Summary
A five-year capital plan is updated each year. The projects are prioritized based on operational needsand financing availability. Projects are financed by issuance of bonds or distribution from the renewaland replacement (R&R) fund. The planned projects are listed below:
East End Treatment Capital Program – 21: Aeration Construction ($11,000,000), financed by a future2016 bond.
Pump Stations R&R –70: Fore River PS roof repair ($80,000), Northeast PS shaft and cranereplacements, and routine and equipment renewal and replacements ($75,000), financed from therenewal and replacement fund.
East End Treatment Plant R&R – 409: Five small plant upgrades ($455,000) including a dewatering odorcontrol upgrade, financed from the renewal and replacement fund.
Peaks Island R&R – 423 / 177: Peaks Island Headworks ventilation, alkalinity feeding system, influentvalve and security upgrades, and unplanned equipment renewal and replacements, financed from therenewal and replacement fund ($155,000).
SCADA/Process Control Program – 177: East End Treatment Plant SCADA upgrades and various processand management systems ($90,077), financed from the renewal and replacement fund.
Capital Fund: 2013 Actual 2014 Projected 2015 Budget
Beginning of Year Fund Balance $2,185,372 $2,551,065 $1,313,390
Source of Funds:
Bond Proceeds - prior year(s) 198,518 1,925,968
Bond Proceeds - current year 1,074,032 - -
Bond Proceeds - future year - 1,600,000 11,000,000
Renewal and Replacement Contribution 728,196 728,196 728,196
Operating Surplus Transfer 52,386 - -
Other Sources 736 - -
Capital Funding 2,053,868 4,254,164 11,728,196
Capital Expenditures:
Pump Station R&R – 70 20,281 134,000 206,400
Pump Station Capital Program – 420 289,271 1,600,000 -
CSO Program R&R – 131 212,809 -
East End Treatment Facility R&R – 409 304,591 592,525 455,000
East End Treatment Facility Capital Program – 21 563,520 11,000,000
Peaks Island R&R – 423 / 177 - 389,017 155,000
Peaks Island Capital Program – 118 1,074,032 1,925,968 -
SCADA / Process Control Program – 177 - 74,000 90,077
Capital Expenditures 1,688,175 5,491,839 11,906,477
End of Year Fund Balance 2,551,065 1,313,390 1,135,109

81 Budget by Fund – Wastewater, Portland
Projections for Rate-Making Purposes
Multi-year projections are made for each of the wastewater funds’ assessment. The projections provideguidance to the wastewater municipalities to assist them in determining their wastewater sewer rates. Asummary of the projection is provided on next page.
Summary
Major Assumptions:
The assumptions incorporated in the projections are as follows:
Salary increases of 2% each year. Maintain same number of employees.
Benefit increases of 5% each year. Assumed pension contribution increased to $1 million a yearin 2015 and health insurance increases 7 % per year.
Other expenses increase by 2.5% in 2015-2016 and 3.5% in subsequent years. Biosolids costs areassumed to increase by an additional 5% when the current contract expires in 2016.
New debt service and renewal/replacement fund expenditures consistent with the 2015 5-yearcapital plan (new debt assumed a 20 year life at 5%). The most significant project is the $12million aeration system upgrade at the East End Treatment Facility. The estimated cost ispreliminary and may be higher.
Summary
Assessment is projected to increase to $13,218,304 by 2019. Operating Reserves balance and debtratios are expected to be better than target. Capital Reserve balance is expected to be below target.
Reserve Fund Balances
$0
$1,000
$2,000
$3,000
$4,000
$5,000
$6,000
$7,000
2010 2011 2012 2013 2014 2015 2016 2017 2018 2019
Portland($,000)
Capital
Operating
Percent of Budget Dedicated to Debt Service – Target: Not to Exceed 35%Funds 2014 2015 2016 2017 2018 2019
Portland 20% 18% 19% 23% 25% 24%
Debt Service Ratio – Target: Greater or Equal to 1.25Funds 2014 2015 2016 2017 2018 2019
Portland 1.40 1.43 1.42 1.32 1.27 1.33

82 Budget by Fund – Wastewater, Portland
Projections for Rate-Making Purposes (continued)Operating Fund:
Wastewater Portland 2015 2016 2017 2018 2019
Revenue: Budget Projected Projected Projected Projected
Assessment Income $10,981,308 $11,530,373 $12,222,195 $12,833,305 $13,218,304
Other Income 96,950 96,950 96,950 96,950 96,950
Interest Income 17,186 17,186 17,186 17,186 17,186
Total Revenue 11,095,444 11,644,509 12,336,331 12,947,441 13,332,440
Expense:
Biosolids Disposal 1,041,007 1,114,918 1,153,940 1,194,328 1,236,129
Salaries/Wages 1,168,388 1,191,756 1,215,591 1,239,903 1,264,701
Employee Benefits 573,812 602,503 632,628 664,259 697,472
Purchased Power 952,977 972,037 981,058 1,015,395 1,050,934
Chemicals 566,582 577,914 523,141 541,451 560,402
Contracted Srvs 569,551 580,942 601,275 622,320 644,101
Heat/Fuel Oil 156,027 159,148 164,718 170,483 176,450
Materials/Supplies 273,000 278,460 288,206 298,293 308,733
Transportation 97,636 99,589 103,075 106,683 110,417
Tele/Oth Utilities 97,948 99,907 103,404 107,023 110,769
Insurance 28,058 28,619 29,621 30,658 31,731
Other Expense 15,772 16,087 16,650 17,233 17,836
Support Services:
Administration 1,303,461 1,329,530 1,356,121 1,383,243 1,410,908
Wastewater Services 711,173 725,396 739,904 754,702 769,796
Engineering Services 428,393 436,961 445,700 454,614 463,706
Environmental Services 266,260 271,585 277,017 282,557 288,208
Water Services 31,715 32,349 32,996 33,656 34,329
Capital:
Debt Service 1,967,257 2,208,325 2,790,394 3,180,625 3,118,947
Renewal & Replacement 846,427 844,257 844,257 844,257 844,257
Total Expense 11,095,444 11,570,283 12,299,696 12,941,683 13,139,826
Annual Surplus (Deficit) 0 74,226 36,635 5,758 192,614
Carryforward Surplus 3,584,761 3,584,761 3,658,987 3,695,622 3,701,380
Period Ending Surplus 3,584,761 3,658,987 3,695,622 3,701,380 3,893,994
Target 2,773,861 2,892,571 3,074,924 3,235,421 3,284,957
Above/(Below) Target $810,900 $766,416 $620,698 $465,959 $609,038
Capital Expenditures: (See details in the Capital Expenditure section) Target Balance: $ 2,926,039Year Beg Balance R&R Contribution Bond Expenditures End Balance
2015 $1,313,390 $728,196 $11,000,000 $11,906,477 $1,135,109
2016 1,135,109 728,196 2,900,000 3,893,000 870,305
2017 870,305 728,196 500,000 1,020,000 1,078,501
2018 1,078,501 728,196 0 730,000 1,076,697
2019 1,076,697 728,196 0 670,000 1,134,893

83 Budget by Fund – Wastewater, Portland
Wastewater System Disposal Wipe Issue
Maine’s Don't Flush Baby Wipes Campaign Receives National Recognition
The Don’t Flush Baby Wipes Campaign was recognized with two prestigious awards, the US EPAEnvironmental Merit Award and the Governor’s Award for Environmental Excellence. The outreachcampaign was developed by Maine Water Environment Association, the Portland Water District, andnational partners to raise consumer awareness about the problems that occur when baby wipes areflushed down the toilet. With the theme, “Save Your Pipes: Don’t Flush Baby Wipes,” the campaign ranJanuary - April with television commercials featuring a game show titled, “What the Flush?!?,” and otheroutreach efforts.
"This campaign appears to have been successful, but this message is one that needs to reach consumersaround the country," says 2014 Maine Water Environment Association President Aubrey Strause."Consumers need to be consistently reminded that baby wipes are never flushable, so our next step issharing the campaign materials with everyone else fighting this problem."
EPA Award: (from left) Maine DEP Commissioner PatriciaAho, INDA Director of Marketing Joan Izzo, Maine WaterEnvironment Association President Aubrey Strause,Portland Water District Director of Wastewater ServicesScott Firmin, EPA New England’s Deputy RegionalAdministrator Deb Szaro.
Gov Award: (from left) Yarmouth Water Pollution ControlDept. Superintendent Tom Connolly, Governor PaulLePage, Casella Director of Sales and Marketing JenniferMcDonnell, Portland Water District Public RelationsManager Michelle Clements, Maine DEP CommissionerPatricia Aho.

84 Budget by Fund – Wastewater, Westbrook
Fund: Wastewater - Westbrook
Background
The Portland Water District’s charter authorizes the District to provide wastewater treatment andcollection system-interceptor service to the city. Westbrook’s wastewater is treated at the treatmentfacility located in Westbrook and jointly used by the towns of Windham and Gorham. The city maintainsthe collection system-collectors that transport wastewater from user’s property to the District’sinterceptor system. Additionally, by contract, the District provides utility billing services.
Summary of Services
Provided:
Treatment
2.39 million gallons/day
Collection System
3 Westbrook only & 1
Joint use Pump Stations
with 8.0 miles of pipe
Utility Billing
Annual Billings of
$4,151,758 on 4,433
Customers (avg.
$82.08/month)

85 Budget by Fund – Wastewater, Westbrook
Fund: Wastewater - Westbrook
2015 Financial Summary
No increase in the city’s assessment isproposed ($2,533,176).
The proposed 2015 Operating Expense andCapital budgets are $2,691,105 and $1,117,366respectively.
The Operating Expense budget is $45,413higher (1.7%) than the previous year.Departmental Expense increased by $42,720 or2.4%, Debt Service rose 0.3% to $431,558while Renewal & Replacement (direct andindirect) funding increased by $1,556 to$434,972.
The major capital projects in 2015 includeupgrades at the Dana Court Pump Station and theBrown Street CSO.
Assessment Compared to Ratepayers’ BillingThe municipality’s fiscal year end is Dec 31, while the District’s is year end. The chart below comparesthe sewer billing cash as collected by the District on their behalf and the District’s assessment forservices rendered. The municipality may incur additional sewer-related costs. The municipalitydetermines whether or not to increase the sewer billing rates.
$2,571,174
$2,533,176
$2,533,176
$2,742,233
$2,742,233
$2,742,233
$2,400,000 $2,500,000 $2,600,000 $2,700,000 $2,800,000
FYE Dec 31,2016 est
FYE Dec 31,2015 est
FYE Dec 31,2014 est
Town Billing Revenue PWD Assessment
Renewal &Replacement
16.2%
Debt Service16.0%
BiosolidsDisposal
10.4%Salaries &Wages9.5%
PurchasedPower6.9%
Other Expense41.0%
2015 Operating Expense
Revenue Assumptions:
- Consumption is the 12months ending Sep 30,2014
- Rates Assumed:Effective Base/Per HCFDate:
Jan 2013 $11.13/$6.13

86 Budget by Fund – Wastewater, Westbrook
2015 Operating Expense Highlights
Salaries/Wages – The expense increase of 0.7%($1,791) has resulted in a budget amount of$254,555. District labor rates increased an averageof 2.0% while hours for this fund declined 0.2%. Atotal of 10,508 hours (5.1 full time equivalents)were budgeted for 2015.
Employee Benefits – Benefits, which are charged asa percentage of regular wages, increased 5.8%($7,227) to a total of $130,982. The benefit rateincreased 3.3% due to increases in health insuranceand pension costs.
Biosolids Disposal – The budget assumed the volume of wet tons disposed would increase by 6.2%along with an estimated 2.5% increase in the disposal rate. Those items increased costs of disposal atthe Westbrook Regional WWTF by 8.6%. However, due to an increase in flows, Westbrook’s share oftreatment costs increased from 83.7% in 2014 to 84.3% in 2015 resulting in 9.9% ($25,366) increase.
Chemicals – The 2015 Budget assumed a larger volume of polymer and a higher price for sodiumbisulfite. The result was a 10.2% ($6,933) increase in expense.
Purchased Power – Usage is based on past year averages. Overall, the budget is 4.3% ($8,439) lowerthan last year’s budget. The budgeted amount for 2015 is $185,777.
Deferred Cost Write-off (W/O) – The Deferred Cost Write-Off contains the annual amortization ofstudies or other items that have multi-year impacts. The increase in 2015 is related to new costs for theWestbrook Combined Storm Overflow (CSO) study.
Transportation – Transportation costs decreased by $5,248 (31.7%), largely due to elimination ofsludge/grit/screenings hauling by District vehicles. The total budget for transportation is $11,325.
Support Services – These costs are related to general work done that cannot be directly charged to afund as noted above (such as customer service or information technology) or work done on behalf ofseveral municipalities at the same time (engineering or laboratory services) that is allocated based onthe value to each fund. The combined Support Services costs increased 0.5% ($3,435).
Debt Service – The annual principal and interest payments on bonds issued to finance capital projects.This item increased 0.3% ($1,137).
Renewal & Replacement – Dollars put aside to fund capital projects. A contribution of $434,972 will bemade in 2014.
Treatment71%
Systems20%
OtherDepts
9%
Labor Hours Distribution

87 Budget by Fund – Wastewater, Westbrook
2013
Actual
2014
Jan-Jun
2014
Budget
2015
Budget
Budget
Diff $
Budget
Diff %
Assessment Income 2,533,176 1,266,588 2,533,176 2,533,176 - 0.0%
Interest Income 17,413 12,651 15,517 15,870 353 2.3%
Other Income 143,824 34,407 97,000 142,060 45,060 46.5%
Total Revenue 2,694,413 1,313,646 2,645,693 2,691,106 45,412 1.7%
Salaries & Wages 249,707 117,136 252,764 254,555 1,791 0.7%
Employee Benefits 119,730 58,424 123,755 130,982 7,227 5.8%
Biosolids Disposal 253,833 148,520 255,642 281,008 25,366 9.9%
Chemicals 58,285 25,144 68,082 75,015 6,933 10.2%
Contracted Services 89,137 28,249 119,339 122,365 3,026 2.5%
Deferred Cost W/O 10,602 5,301 10,602 18,602 8,000 75.5%
Heat/Fuel Oil 25,417 20,086 24,396 25,010 614 2.5%
Insurance 5,804 3,011 6,022 6,493 471 7.8%
Materials & Supplies 43,710 13,800 40,659 41,222 563 1.4%
Other Expense 5,026 3,391 4,973 5,085 112 2.3%
Purchased Power 186,217 95,815 194,216 185,777 (8,439) -4.3%
Tele/Other Utilties 10,259 5,233 15,275 14,144 (1,131) -7.4%
Transportation 26,293 8,013 16,573 11,325 (5,248) -31.7%
SS - Administration 297,318 146,663 306,622 307,669 1,047 0.3%
SS - Engineering Services 67,399 34,501 90,986 89,442 (1,544) -1.7%
SS - Environmental Services 84,022 42,197 86,277 86,869 592 0.7%
SS - Wastewater Services 145,407 86,275 159,719 161,210 1,491 0.9%
SS - Water Services 4,141 8,351 5,954 7,803 1,849 31.1%
Departmental Expense 1,682,307 850,110 1,781,856 1,824,576 42,720 2.4%
Debt Service 434,274 214,632 430,421 431,558 1,137 0.3%
Renewal & Replace - Direct 409,910 202,899 405,798 407,904 2,106 0.5%
Renewal & Replace - Indirect 28,038 13,809 27,618 27,068 (550) -2.0%
Operating Expense 2,554,529 1,281,450 2,645,693 2,691,106 45,413 1.7%
Surplus (Deficit) 139,884 32,196 - -
Write-off Bond Issuance Exp (6,304) - - -
Return of Surplus (215,000) - - -
Transfer to R&R (133,580) - - -
Prior Surplus 1,619,156 1,404,156 1,492,608 1,439,317
Accumulated Surplus 1,404,156 1,436,352 1,492,608 1,439,317
$-
$200,000
$400,000
$600,000
$800,000
$1,000,000
2014 2015
Westbrook Only
Westbrook Only – Up $10.5k (1.2%), higher
CCTV offset by lower wages/benefits.
$0
$200,000
$400,000
$600,000
$800,000
$1,000,000
$1,200,000
2014 2015
Westbrook Joint
Westbrook JT – Up $32.1k (3.5%), Westbrook % up
(83.7% to 84.7%). Pooled costs are up 2.2%.
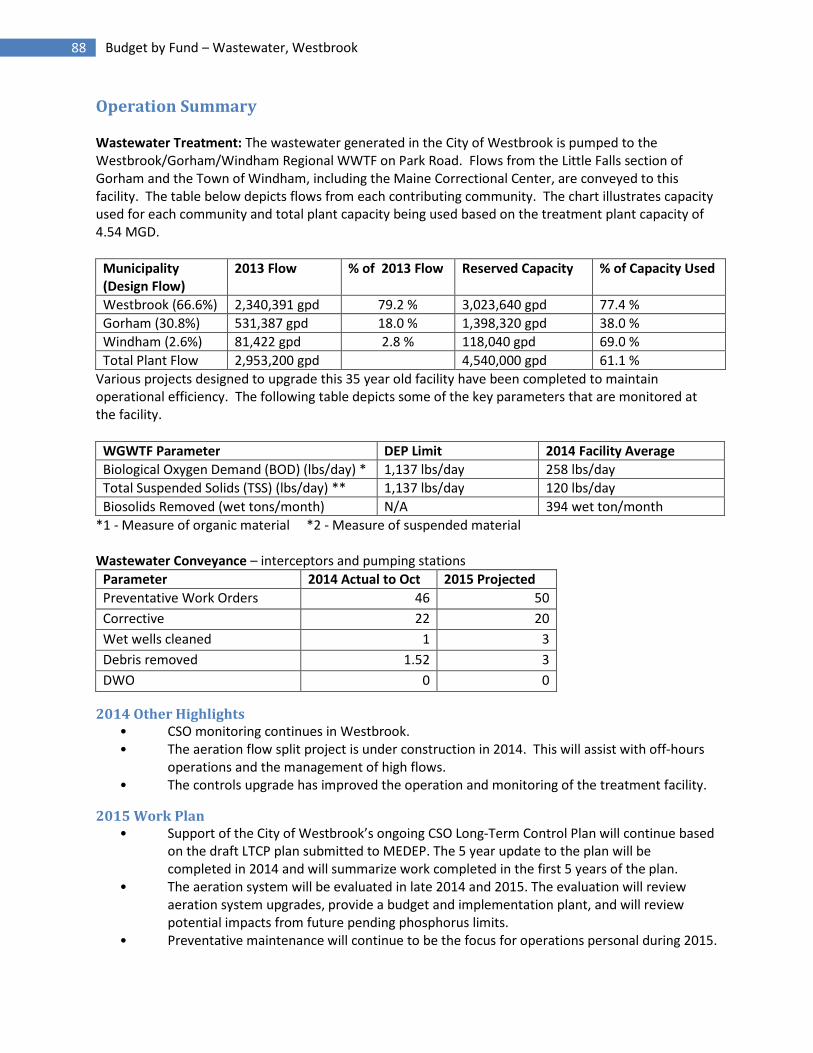
88 Budget by Fund – Wastewater, Westbrook
Operation Summary
Wastewater Treatment: The wastewater generated in the City of Westbrook is pumped to theWestbrook/Gorham/Windham Regional WWTF on Park Road. Flows from the Little Falls section ofGorham and the Town of Windham, including the Maine Correctional Center, are conveyed to thisfacility. The table below depicts flows from each contributing community. The chart illustrates capacityused for each community and total plant capacity being used based on the treatment plant capacity of4.54 MGD.
Municipality(Design Flow)
2013 Flow % of 2013 Flow Reserved Capacity % of Capacity Used
Westbrook (66.6%) 2,340,391 gpd 79.2 % 3,023,640 gpd 77.4 %
Gorham (30.8%) 531,387 gpd 18.0 % 1,398,320 gpd 38.0 %
Windham (2.6%) 81,422 gpd 2.8 % 118,040 gpd 69.0 %
Total Plant Flow 2,953,200 gpd 4,540,000 gpd 61.1 %
Various projects designed to upgrade this 35 year old facility have been completed to maintainoperational efficiency. The following table depicts some of the key parameters that are monitored atthe facility.
WGWTF Parameter DEP Limit 2014 Facility Average
Biological Oxygen Demand (BOD) (lbs/day) * 1,137 lbs/day 258 lbs/day
Total Suspended Solids (TSS) (lbs/day) ** 1,137 lbs/day 120 lbs/day
Biosolids Removed (wet tons/month) N/A 394 wet ton/month
*1 - Measure of organic material *2 - Measure of suspended material
Wastewater Conveyance – interceptors and pumping stations
Parameter 2014 Actual to Oct 2015 Projected
Preventative Work Orders 46 50
Corrective 22 20
Wet wells cleaned 1 3
Debris removed 1.52 3
DWO 0 0
2014 Other Highlights• CSO monitoring continues in Westbrook.• The aeration flow split project is under construction in 2014. This will assist with off-hours
operations and the management of high flows.• The controls upgrade has improved the operation and monitoring of the treatment facility.
2015 Work Plan• Support of the City of Westbrook’s ongoing CSO Long-Term Control Plan will continue based
on the draft LTCP plan submitted to MEDEP. The 5 year update to the plan will becompleted in 2014 and will summarize work completed in the first 5 years of the plan.
• The aeration system will be evaluated in late 2014 and 2015. The evaluation will reviewaeration system upgrades, provide a budget and implementation plant, and will reviewpotential impacts from future pending phosphorus limits.
• Preventative maintenance will continue to be the focus for operations personal during 2015.
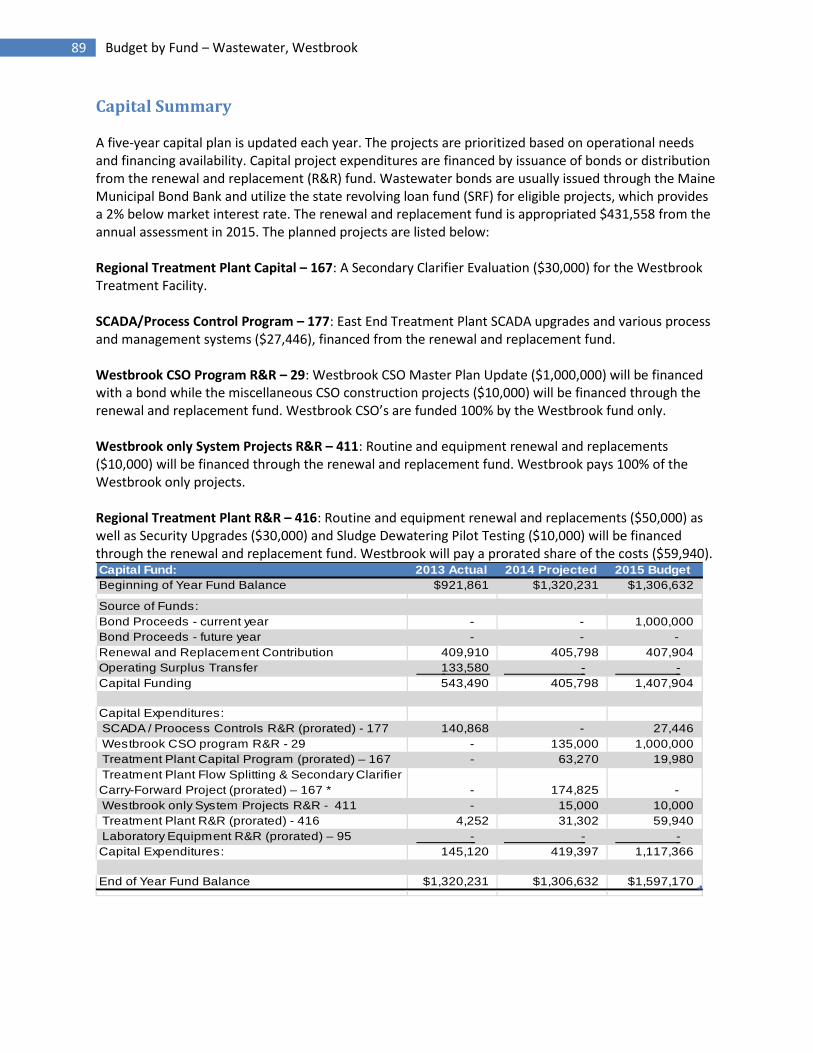
89 Budget by Fund – Wastewater, Westbrook
Capital Summary
A five-year capital plan is updated each year. The projects are prioritized based on operational needsand financing availability. Capital project expenditures are financed by issuance of bonds or distributionfrom the renewal and replacement (R&R) fund. Wastewater bonds are usually issued through the MaineMunicipal Bond Bank and utilize the state revolving loan fund (SRF) for eligible projects, which providesa 2% below market interest rate. The renewal and replacement fund is appropriated $431,558 from theannual assessment in 2015. The planned projects are listed below:
Regional Treatment Plant Capital – 167: A Secondary Clarifier Evaluation ($30,000) for the WestbrookTreatment Facility.
SCADA/Process Control Program – 177: East End Treatment Plant SCADA upgrades and various processand management systems ($27,446), financed from the renewal and replacement fund.
Westbrook CSO Program R&R – 29: Westbrook CSO Master Plan Update ($1,000,000) will be financedwith a bond while the miscellaneous CSO construction projects ($10,000) will be financed through therenewal and replacement fund. Westbrook CSO’s are funded 100% by the Westbrook fund only.
Westbrook only System Projects R&R – 411: Routine and equipment renewal and replacements($10,000) will be financed through the renewal and replacement fund. Westbrook pays 100% of theWestbrook only projects.
Regional Treatment Plant R&R – 416: Routine and equipment renewal and replacements ($50,000) aswell as Security Upgrades ($30,000) and Sludge Dewatering Pilot Testing ($10,000) will be financedthrough the renewal and replacement fund. Westbrook will pay a prorated share of the costs ($59,940).Capital Fund: 2013 Actual 2014 Projected 2015 Budget
Beginning of Year Fund Balance $921,861 $1,320,231 $1,306,632
Source of Funds:
Bond Proceeds - current year - - 1,000,000
Bond Proceeds - future year - - -
Renewal and Replacement Contribution 409,910 405,798 407,904
Operating Surplus Transfer 133,580 - -
Capital Funding 543,490 405,798 1,407,904
Capital Expenditures:
SCADA / Proocess Controls R&R (prorated) - 177 140,868 - 27,446
Westbrook CSO program R&R - 29 - 135,000 1,000,000
Treatment Plant Capital Program (prorated) – 167 - 63,270 19,980
Treatment Plant Flow Splitting & Secondary Clarifier
Carry-Forward Project (prorated) – 167 * - 174,825 -
Westbrook only System Projects R&R - 411 - 15,000 10,000
Treatment Plant R&R (prorated) - 416 4,252 31,302 59,940
Laboratory Equipment R&R (prorated) – 95 - - -
Capital Expenditures: 145,120 419,397 1,117,366
End of Year Fund Balance $1,320,231 $1,306,632 $1,597,170

90 Budget by Fund – Wastewater, Westbrook
Projections for Rate-Making Purposes
Multi-year projections are made for each of the wastewater funds’ assessment. The projections provideguidance to the wastewater municipalities to assist them in determining their wastewater sewer rates. Asummary of the projection is provided on next page.
Summary
Major Assumptions:
The assumptions incorporated in the projections are as follows:
Salary increases of 2% each year. Maintain same number of employees.
Benefit increases of 5% each year. Assumed pension contribution increased to $1 million a yearin 2015 and health insurance increases 7 % per year.
Other expenses increase by 2.5% in 2015-2016 and 3.5% in subsequent years. Biosolids costs areassumed to increase by an additional 5% when the current contract expires in 2016.
New debt service and renewal/replacement fund expenditures consistent with the 2015 5-yearcapital plan (new debt assumed a 20 year life at 5%). One significant project is the $1.2 millionaeration system upgrade at the Westbrook Regional Treatment Facility. The estimated cost ispreliminary and may be higher. Also, other significant projects relate to the combined seweroverflow abatement with total $6.3 million expected to be spent in the next 5 years.
Summary
Assessment is projected to increase to $2,768,873 by 2019. Reserve balances and debt ratios areexpected to be better than target.
Reserve Fund Balances
$0
$1,000
$2,000
$3,000
$4,000
$5,000
2010 2011 2012 2013 2014 2015 2016 2017 2018 2019
Westbrook($,000)
Capital
Operating
Percent of Budget Dedicated to Debt Service – Target: Not to Exceed 35%Funds 2014 2015 2016 2017 2018 2019
Westbrook 16% 16% 18% 15% 16% 16%
Debt Service Ratio – Target: Greater or Equal to 1.25Funds 2014 2015 2016 2017 2018 2019
Westbrook 2.01 2.01 1.76 2.13 1.90 1.92

91 Budget by Fund – Wastewater, Westbrook
Projections for Rate-Making Purposes (continued)
Operating Fund:
Wastewater Westbrook 2015 2016 2017 2018 2019
Revenue: Budget Projected Projected Projected Projected
Assessment Income $2,533,176 $2,609,171 $2,661,354 $2,714,581 $2,768,873
Other Income 142,060 142,060 142,060 142,060 142,060
Interest Income 15,870 15,870 15,870 15,870 15,870
Total Revenue 2,691,106 2,767,101 2,819,284 2,872,511 2,926,803
Expense:
Contracted Srvs 122,365 125,424 129,814 134,357 139,059
Salaries/Wages 254,555 259,646 264,839 270,136 275,539
Employee Benefits 130,982 137,531 144,408 151,628 159,209
Purchased Power 185,777 185,777 192,279 199,009 205,974
Biosolids Disposal 281,008 290,254 300,413 310,927 321,809
Transportation 11,325 11,608 12,014 12,434 12,869
Chemicals 75,015 76,890 79,581 82,366 85,249
Materials/Supplies 41,222 42,253 43,732 45,263 46,847
Heat/Fuel Oil 25,010 25,635 26,532 27,461 28,422
Tele/Oth Utilities 14,144 14,498 15,005 15,530 16,074
Insurance 6,493 6,655 6,888 7,129 7,379
Other Expense 23,687 23,814 23,996 24,185 24,380
Administration 307,669 315,361 323,245 331,326 339,609
Engineering Services 89,442 91,678 93,970 96,319 98,727
Environmental Services 86,869 89,041 91,267 93,549 95,888
Wastewater Services 161,210 165,240 169,371 173,605 177,945
Water Services 7,803 7,998 8,198 8,403 8,613
Capital:
Debt Service 431,558 509,989 419,885 468,915 461,030
Renewal & Replacement 434,972 434,972 434,972 434,972 434,972
Total Expense 2,691,106 2,814,264 2,780,409 2,887,514 2,939,594
Annual Surplus (Deficit) 0 -47,163 38,875 -15,003 -12,791
Transfer to R&R
Carryforward Surplus 1,439,317 1,439,317 1,392,154 1,431,029 1,416,026
Period Ending Surplus 1,439,317 1,392,154 1,431,029 1,416,026 1,403,235
Target 672,777 703,566 695,102 721,879 734,899
Above Target $766,541 $688,588 $735,927 $694,148 $668,337
Capital Expenditures: (See details in the Capital Expenditure section) Target Balance: $605,745Year Beg Balance R&R Contribution Bond Expenditures End Balance
2015 $1,306,632 $407,904 $1,000,000 1,117,366 $1,597,170
2016 1,597,170 $407,904 382,000 511,880 1,875,194
2017 1,875,194 $407,904 2,054,052 2,100,006 2,237,144
2018 2,237,144 $407,904 400,000 443,300 2,601,748
2019 2,601,748 $407,904 3,200,000 3,243,300 2,966,352

92 Budget by Fund – Wastewater, Windham
Fund: Wastewater – Windham
Background
The Portland Water District’s charter authorizes the District to provide wastewater treatment andcollection system-interceptors service to the town. By contract with the town, the District additionallyoperates and maintains the collectors in the sewer collection system. Windham’s wastewater is treatedat the treatment facility located in Westbrook and jointly used by Windham, the Town of Gorham andCity of Westbrook. Additionally, by contract, the District provides utility billing services.
Summary of Services
Provided:
Treatment
0.081 Million
gallons/day
Collection System
2 Windham only & 3
Joint use Pump Stations
with 8.2 miles of pipe
Utility Billing
Annual Billings of
$330,097 on 52
Customers

93 Budget by Fund – Wastewater, Windham
Fund: Wastewater - Windham
2015 Financial Summary
No increase in the town’s assessment is proposed($351,756).
The proposed 2015 Operated Expense and Capitalbudgets are $355,971 and $24,089, respectively.
The expenses remained nearly flat, with a slightincrease of $718 (0.2%)
The capital projects in 2015 include thecontinuation of upgrades at the regionalwastewater treatment plant of the SludgeDewatering Pilot Testing and small equipmentreplacements. This work will be funded byrenewal and replacement funds.
Debt Service42.9%
Renewal &Replacement
10.0%
Salaries &Wages8.2%
ContractedServices
5.1%
EmployeeBenefits
4.2%
OtherExpense29.6%
2015 Operating Expense
Assessment Compared to Ratepayers’ BillingThe municipality’s fiscal year end is June 30, while the District’s is year end. The chart below comparesthe sewer billing cash as collected by the District on their behalf and the District’s assessment forservices rendered. The municipality may incur additional sewer-related costs. The municipalitydetermines whether or not to increase the sewer billing rates.
$351,756
$351,756
$351,756
$330,097
$330,097
$330,097
$- $100,000 $200,000 $300,000 $400,000
FYE June 30,2016
FYE June 30,2015
FYE June 30,2014
Town Billing Revenue PWD Assessment
Revenue Assumptions:
- Consumption is the 12months ending June30, 2014
- Rates Assumed:
Effective Base/Per HCFDate:
April 2009 $48.84/$3.24
No change since 4/1/2009

94 Budget by Fund – Wastewater, Windham
2015 Operating Expense Highlights
Salaries/Wages – Wage rates were budgetedto decrease 6.4% ($2,019). District labor ratesincreased an average of 2.0% but this wasmore than offset by the 8.9% (150 hour)decrease hours budgeted. A total of 1,531hours (0.74 full time equivalents) werebudgeted for 2015.
Employee Benefits – Benefits, which arecharged as a percentage of regular wages,increased 2.2% ($321) to a total of $14,996.The benefit rate increased 3.3% due toincreases in health insurance and pensioncosts.
Biosolids Disposal – The budget assumed the volume of wet tons disposed would increase by 6.2%along with an estimated 2.5% increase in the disposal rate. Those items increased costs of disposal atthe Westbrook Regional WWTF by 8.6%.
Chemicals – The 2015 Budget assumed a larger volume of polymer and a higher price for sodiumbisulfite. The result was a 9.0% ($167) increase in expense.
Contracted Services – The budget for this item increased $4,838 (33.6%). The figure included a $7,735increase for CCTV (inspection by video) of sewer lines somewhat offset by a $2,266 decrease inmaintenance services.
Purchased Power – The budget for power costs is expected to remain nearly flat. A 0.1% decrease of$12 for the year resulted in a budgeted amount of $13,755.
Transportation – Transportation costs decreased $841 or 6.6% to a total of $11,829. This change isrelated to the decrease in labor costs noted above.
Support Services – These costs are related to general work done that cannot be directly charged to afund as noted above (such as customer billing or information technology) or work done on behalf ofseveral municipalities at the same time (engineering or laboratory services) that is allocated based onthe value to each fund. The combined Support Services costs decreased 2.1% ($1,350). The decrease inthe Wastewater ($783) is attributed to the labor decrease as costs in this area are allocated on thatbasis.
Debt Service - The annual principal and interest payments on bonds issued to finance capital projects.This item decreased 1.5% ($2,283) as older bond issues were retired.
Renewal & Replacement - Dollars put aside to fund capital projects. A contribution of $35,634 will bemade in 2015.
Treatment13%
Systems57%
Other Depts30%
Labor Hours Distribution

95 Budget by Fund – Wastewater, Windham
2013
Actual
2014
Jan-Jun
2014
Budget
2015
Budget
Budget
Diff $
Budget
Diff %
Assessment Income 351,756 175,878 351,756 351,756 - 0.0%
Interest Income 1,083 557 897 1,125 228 25.4%
Other Income 3,111 942 2,600 3,090 490 18.8%
Total Revenue 355,950 177,377 355,253 355,971 718 0.2%
Salaries & Wages 20,678 11,224 31,362 29,343 (2,019) -6.4%
Employee Benefits 10,221 5,751 14,675 14,996 321 2.2%
Biosolids Disposal 6,893 4,081 7,025 7,631 606 8.6%
Chemicals 1,571 684 1,862 2,029 167 9.0%
Contracted Services 12,738 3,249 13,354 18,192 4,838 36.2%
Heat/Fuel Oil 937 1,161 1,764 1,710 (54) -3.1%
Insurance 803 419 841 846 5 0.6%
Materials & Supplies 2,394 847 4,428 5,221 793 17.9%
Other Expense 120 89 136 136 - 0.0%
Purchased Power 13,359 7,542 13,767 13,755 (12) -0.1%
Tele/Other Utilties 239 122 366 331 (35) -9.6%
Transportation 8,473 3,921 12,670 11,829 (841) -6.6%
SS - Administration 35,332 16,962 35,588 35,170 (418) -1.2%
SS - Engineering Services 9,204 4,542 12,342 12,051 (291) -2.4%
SS - Environmental Services 2,136 959 1,949 2,087 138 7.1%
SS - Wastewater Services 9,473 6,710 13,084 12,301 (783) -6.0%
SS - Water Services 83 162 141 145 4 2.8%
Departmental Expense 134,654 68,425 165,354 167,773 2,419 1.5%
Debt Service 156,966 76,952 154,847 152,564 (2,283) -1.5%
Renewal & Replace - Direct 43,727 16,007 32,015 32,687 672 2.1%
Renewal & Replace - Indirect 3,087 1,519 3,037 2,947 (90) -3.0%
Operating Expense 338,434 162,903 355,253 355,971 718 0.2%
Surplus (Deficit) 17,516 14,474 - -
Write-off Bond Issuance Exp (1,845) - - -
Return of Surplus - - - -
Transfer to R&R (15,671) - - -
Prior Surplus 171,168 171,168 182,000 191,335
Accumulated Surplus 171,168 185,642 182,000 191,335
$0
$25,000
$50,000
$75,000
$100,000
$125,000
2014 2015
Windham only
Windham Only – Costs flat,
(down $1.1k)
$0
$200,000
$400,000
$600,000
$800,000
$1,000,000
$1,200,000
2014 2015
Westbrook Joint
Westbrook JT – Up $25k (2.2%),
Windham % unchanged (2.3%).
$0
$10,000
$20,000
$30,000
$40,000
$50,000
$60,000
2014 2015
Little Falls Joint
Little Falls JT – Up $7k, Windham
% down (85% to 80%).

96 Budget by Fund – Wastewater, Windham
Operation Summary
Wastewater Treatment
Wastewater generated within the Town of Windham, including the Maine Correctional Center and theLittle Falls area of Gorham, was conveyed to the Westbrook/Gorham/Windham Regional WWTF. TheTown of Windham has reserved 2.6% of a design capacity of 4.54 million gallons a day or, 118,040gallons. The table below shows the volume of flows to the Westbrook/Gorham/Windham RegionalWastewater Treatment Facility.
Area 2013 Windham Flow Westbrook WWTF Flow % Windham Share
Windham 81,422 gal/day 2,953,200 gal/day 2.8 %
WGWWTF Capacity Windham Capacity(2.6%)
2013 % Capacity Used Capacity Remaining
4,540,000 gal/day 118,040 gal/day 69.0 % 36,618 gal/day
Wastewater Conveyance – collectors, interceptors and pumping stations
Parameter 2014 Actual to Oct. 2015 Projected
Preventative Work Orders 15 25
Corrective 2 5
Wet wells cleaned 13 15
Debris removed 7.37 10
DWO 1 0
2014 Other Highlights• Preventative type work continues to be the main focus of system staff.• Wet well and siphon cleaning were performed on a regular schedule using our Hansen unit
scheduled maintenance program. This effort is in response to odor concerns in the area andthe need to regularly clean the siphon to ensure the system operates properly.
• In response to odor concerns at the Mallison St. Pump Station, an odor control system wasinstalled. There have been no complaints of odor since the system was installed in thesummer of 2012.
• The Route 202 Pump Station flow meter failed and its replacement is planned for 2015 (thelocation makes replacement difficult).
2015 Work Plan• All pump stations will be continuously monitored with our SCADA system and dispatch
service. Operations staff will visit each station on a weekly basis.• Asset Management Software will drive the preventive maintenance program, generating
both monthly and annual preventive maintenance work orders.• Wet wells scheduled for cleaning on a quarterly basis unless experience dictates otherwise.• The siphon will be inspected and cleaned as needed.• The Routine Renewal and Replacement capital account will be used to address any
unanticipated equipment issues.

97 Budget by Fund – Wastewater, Windham
Capital Summary
A five-year capital plan is updated each year. The projects are prioritized based on operational needsand financing availability. Capital project expenditures are financed by issuance of bonds or distributionfrom the renewal and replacement (R&R) fund. Wastewater bonds are usually issued through the MaineMunicipal Bond Bank and utilize the state revolving loan fund (SRF) for eligible projects, which providesa 2% below market interest rate. The renewal and replacement fund is appropriated $32,687 from theannual assessment in 2015.
The planned projects are listed below:
Regional Treatment Plant Capital – 167: A Secondary Clarifier Evaluation ($30,000) for the WestbrookTreatment Facility. Windham will pay a prorated share of the costs ($780).
SCADA/Process Control Program – 177: East End Treatment Plant SCADA upgrades and various processand management systems ($969), financed from the renewal and replacement fund.
Regional Treatment Plant R&R – 416: Routine and equipment renewal and replacements ($50,000) aswell as Security Upgrades ($30,000) and Sludge Dewatering Pilot Testing ($10,000) will be financedthrough the renewal and replacement fund. Windham will pay a prorated share of the costs ($2,340).
Windham System Pumping R&R – 180: Routine and equipment renewal and replacements ($20,000)will be financed through the renewal and replacement fund. Windham pays 100% of Windham onlyprojects.
Capital Fund: 2013 Actual 2014 Projected 2015 Budget
Beginning of Year Fund Balance $140,756 $188,220 $199,848
Source of Funds:
Bond Proceeds - current year 0 0 0
Bond Proceeds - future year 0 0 0
Renewal and Replacement Contribution 43,727 32,015 32,687
Operating Surplus Transfer 15,671 0 0
Capital Funding 59,398 32,015 32,687
Capital Expenditures:
SCADA / Process Controls R&R (prorated) - 177 5,499 0 969
Treatment Plant Aeration Evaluation (prorated) – 167 0 2,340 780
Treatment Plant Flow Splitting Project (prorated) – 167 *1 0 6,825 0
Treatment Plant R&R (prorated) – 416 0 1,222 2,340
Windham Systems Pumping R&R - 180 6,435 10,000 20,000
Laboratory Equipment R&R (prorated) – 95 0 0 0
Capital Expenditures 11,934 20,387 24,089
End of Year Fund Balance 188,220 199,848 208,446
*1 - A carry-forward project is a project that was budgeted for completion in the current year but will not become
operational until a futrue budget year.

98 Budget by Fund – Wastewater, Windham
Projections for Rate-Making Purposes
Multi-year projections are made for each of the wastewater funds’ assessment. The projections provideguidance to the wastewater municipalities to assist them in determining their wastewater sewer rates. Asummary of the projection is provided on next page.
Summary
Major Assumptions:
The assumptions incorporated in the projections are as follows:
Salary increases of 2% each year. Maintain same number of employees.
Benefit increases of 5% each year. Assumed pension contribution increased to $1 million a yearin 2015 and health insurance increases 7 % per year.
Other expenses increase by 2.5% in 2015-2016 and 3.5% in subsequent years. Biosolids costs areassumed to increase by an additional 5% when the current contract expires in 2016.
New debt service and renewal/replacement fund expenditures consistent with the 2015 5-yearcapital plan (new debt assumed a 20 year life at 5%). The most significant project is the $1.2million aeration system upgrade at the Westbrook Regional Treatment Facility. The estimatedcost is preliminary and may be higher.
Summary
Assessment is projected to increase to $365,967 by 2019, a 4% increase. Reserve balances and debtratios are expected to be better or close to target.
Reserve Fund Balances
$0
$100
$200
$300
$400
$500
2010 2011 2012 2013 2014 2015 2016 2017 2018 2019
Windham($,000)
Capital
Operating
Percent of Budget Dedicated to Debt Service – Target: Not to Exceed 35%Funds 2014 2015 2016 2017 2018 2019
Windham 44% 43% 42% 41% 41% 40%
Debt Service Ratio – Target: Greater or Equal to 1.25Funds 2014 2015 2016 2017 2018 2019
Windham 1.23 1.23 1.20 1.19 1.20 1.24

99 Budget by Fund – Wastewater, Windham
Projections for Rate-Making Purposes (continued)Operating Fund:
Wastewater Windham 2015 2016 2017 2018 2019
Revenue: Budget Projected Projected Projected Projected
Assessment Income $351,756 $351,756 $351,756 $358,791 $365,967
Other Income 3,090 3,090 3,090 3,090 3,090
Interest Income 1,125 1,125 1,125 1,125 1,125
Total Revenue 355,971 355,971 355,971 363,006 370,182
Expense:
Contracted Srvs 18,192 18,647 19,300 19,976 20,675
Salaries/Wages 29,343 29,930 30,529 31,140 31,763
Employee Benefits 14,996 15,746 16,533 17,360 18,228
Purchased Power 13,755 13,755 14,236 14,734 15,250
Biosolids Disposal 7,631 8,022 8,303 8,594 8,895
Transportation 11,829 12,125 12,549 12,988 13,443
Chemicals 2,029 2,080 2,153 2,228 2,306
Materials/Supplies 5,221 5,352 5,539 5,733 5,934
Heat/Fuel Oil 1,710 1,753 1,814 1,877 1,943
Tele/Oth Utilities 331 339 351 363 376
Insurance 846 867 897 928 960
Other Expense 136 139 144 149 154
Administration 35,170 36,049 36,950 37,874 38,821
Engineering Services 12,051 12,352 12,661 12,978 13,302
Environmental Services 2,087 2,139 2,192 2,247 2,303
Wastewater Services 12,301 12,609 12,924 13,247 13,578
Water Services 145 149 153 157 161
Capital:
Debt Service 152,564 152,772 150,576 149,968 147,200
Renewal & Replacement 35,634 35,634 35,634 35,634 35,634
Total Expense 355,971 360,459 363,438 368,175 370,926
Annual Surplus (Deficit) 0 -4,488 -7,467 -5,169 -744
Transfer to R&R
Carryforward Surplus 191,335 191,335 186,847 179,380 174,211
Period Ending Surplus 191,335 186,847 179,380 174,211 173,467
Target 88,993 90,115 90,860 92,044 92,732
Above Target $102,342 $96,732 $88,521 $82,167 $80,736
Capital Expenditures: (See details in the Capital Expenditure section) Target Balance: $88,828Year Beg Balance R&R Contribution Bond Expenditures End Balance
2015 $199,848 $32,687 $0 $24,089 $208,446
2016 208,446 32,015 0 24,680 215,781
2017 215,781 32,015 30,023 31,817 246,002
2018 246,002 32,015 0 21,300 256,717
2019 256,717 32,015 0 21,300 267,432

100 Budget by Fund
Contracted Services: Falmouth, Scarborough and South Portland
Background
Falmouth
The Portland Water District’s charter authorizes the district to provide wastewater treatment andinterception service to the town of Falmouth. However by mutual agreement, the town of Falmouthoperates their own wastewater treatment system. By contract with the town, the district provides utilitybilling and collection services.
Scarborough and South Portland
By contract, the district provides utility billing and collection services for Scarborough and SouthPortland. Wastewater services are provided in the town of Scarborough by the Scarborough SanitaryDistrict, an independent wastewater utility, and in the city of South Portland by Water ResourceProtection, a department of the city of South Portland.
For all three municipalities, the district estimates the cost to provide the billing and payment collectionservice as documented in the annual budget and bills the municipalities the estimated cost. The amountis billed to the municipality in equal monthly payments.
The municipality determines the system user fees to pay the district bill and any municipal costs relatedto the sewer system. The district includes the sewer user fees on the monthly water utility bill sent tocustomers. Sewer user fees collected from users are remitted to the municipality on a weekly basis.
Sewer user fees are based on water consumption in South Portland and Scarborough, with a 1 HCF(hundred cubic feet) minimum fee plus an additional fee for each HCF used above the minimum.Falmouth user fees are based on a flat rate per month for residential homeowners and commercialcustomers billed at a flat rate plus a fee based on the number of fixtures and number of units at thelocation.
2015 Summary
The District is proposing the same assessment as last year for Falmouth, Scarborough and SouthPortland.
The changes to Operating Expense were: Falmouth increasing $392 (3.3%), Scarborough decreasing$106 (1.0%) and South Portland increasing $12,086 (6.6%).

101 Budget by Fund
Contracted Services: Falmouth, Scarborough and South Portland
Falmouth:
2013
Actual
2014
Jan-Jun
2014
Budget
2015
Budget
Budget
Diff $
Budget
Diff %
Contracted Billing Income $15,012 $7,506 $15,012 $15,012 $0 0.0%
Interest Income 146 73 123 114 (9) -7.3%
Total Revenue 15,158 7,579 15,135 15,126 (9) -0.1%
Dept/Operating Expense 11,395 5,946 11,896 12,288 392 3.3%
Surplus (Deficit) 3,763 1,633 3,239 2,838
Prior Surplus 28,003 31,766 32,219 35,513
Accumulated Surplus 31,766 33,399 35,458 38,351
Scarborough:
2013
Actual
2014
Jan-Jun
2014
Budget
2015
Budget
Budget
Diff $
Budget
Diff %
Contracted Billing Income $10,620 $5,310 $10,620 $10,620 $0 0.0%
Interest Income 8 3 9 7 (2) -22.2%
Total Revenue 10,628 5,313 10,629 10,627 (2) 0.0%
Departmental Expense 1,473 2,458 1,914 1,865 (49) -2.6%
Debt Service 6,577 3,677 6,577 6,520 (57) -0.9%
Renewal & Replace - Indirect 1,625 813 1,625 1,625 - 0.0%
Operating Expense 9,675 6,948 10,116 10,010 (106) -1.0%
Surplus (Deficit) 953 (1,635) 513 617
Write-off Bond Issuance Exp (415) - - -
Prior Surplus 2,656 3,194 2,424 3,705
Accumulated Surplus 3,194 1,559 2,937 4,322
South Portland:2013
Actual
2014
Jan-Jun
2014
Budget
2015
Budget
Budget
Diff $
Budget
Diff %
Contracted Billing Income $192,384 $96,192 $192,384 $192,384 $0 0.0%
Interest Income 359 192 268 220 (48) -17.9%
Grand Total 192,743 96,384 192,652 192,604 (48) 0.0%
Departmenal Expense 106,645 67,513 118,300 130,378 12,078 10.2%
Debt Service 52,038 28,512 51,858 51,746 (112) -0.2%
Renewal & Replace - Indirect 12,001 6,001 12,001 12,121 120 1.0%
Operating Expense 170,684 102,026 182,159 194,245 12,086 6.6%
Surplus (Deficit) 22,059 (5,642) 10,493 (1,641)
Write-off Bond Issuance Exp (3,406) - - -
Prior Surplus 70,963 89,616 87,998 104,605
Accumulated Surplus 89,616 83,974 98,491 102,964

102 Budget by Fund
2015 Operating Budget by Fund Summary
The table provides a summary of all funds and contract billing cost centers with a grand total. Theindividual fund information is on the previous pages.
Water, 55.5%
Cape El izabeth, 3.6%
Cumberland, 1.9%
Gorham, 2.8%
Portland, 28.0%
Westbrook, 6.8%
Windham, 0.9%
Contracted Billing 0.6%
Other, 9.7%
Revenues by Fund 2015
Total Water Cape Eliz Cumber Gorham Portland Westbk Windham Contract
Beg Balance $10,462,598 $4,097,689 $322,118 $261,481 $422,074 $3,584,761 $1,439,317 $191,335 $143,823
Water Revenue 21,690,890 21,690,890 - - - - - - -
WW Assess 17,116,284 - 1,412,112 731,784 1,106,148 10,981,308 2,533,176 351,756 -
Contract Billing 218,016 - - - - - - - 218,016
Interest Income 76,236 34,391 1,988 1,911 3,425 17,186 15,870 1,125 340Other Income 526,280 265,370 - - 18,810 96,950 142,060 3,090 -
39,627,706 21,990,651 1,414,100 733,695 1,128,383 11,095,444 2,691,106 355,971 218,356
-
Depart Expense 27,723,872 14,902,940 1,127,888 691,349 583,056 8,281,760 1,824,576 167,773 144,530
Debt Service 6,810,659 3,586,833 191,534 14,966 405,681 1,969,257 431,558 152,564 58,266
Renew l & Repl 4,486,362 2,895,879 94,678 27,380 139,646 844,427 434,972 35,634 13,746
39,020,893 21,385,652 1,414,100 733,695 1,128,383 11,095,444 2,691,106 355,971 216,542
Surplus (Deficit) 606,813 604,999 - - - - - - 1,814
Transfer-Cap Resrv (66,831) (66,831) - - - - - - -
Ending Surplus $11,002,580 $4,635,857 $322,118 $261,481 $422,074 $3,584,761 $1,439,317 $191,335 $145,637

103 Revenues
Introduction
Revenue is obtained from two major sources: payments by individual customers for water services(Water Revenue, 54.7%) and payments from municipalities for wastewater services (WastewaterAssessments, 43.2%). Water revenues in 2015 are expected to increase 2.7% over last year’s budget asa result of a proposed 3.8% rate increase to take effect in May. Wastewater Assessments increased forthe Towns of Cape Elizabeth and Portland to cover estimated 2015 costs.
Contracted Billing Income (0.6% of budgeted revenue) is revenue paid by the City of South Portland andTowns of Falmouth and Scarborough for wastewater billing services.
Other Water and Wastewater revenue (1.3% of budgeted revenue) is derived from other activities, suchas interest income, cross connection fees, customer connection and activation fees, jobbing surchargeand septage haulers fees, which are further detailed in this section.
2013 Actual
2014 Actual
Jan-Jun 2014 Budget 2015 Budget $-Diff. %-Diff.
Water Sales $20,301,648 $9,897,472 $21,130,183 $21,690,890 $560,707 2.7%
Assessment Income 16,588,464 8,485,800 16,972,320 17,116,284 143,964 0.8%
Contracted Billing Income 218,016 109,008 218,016 218,016 - 0.0%
Interest Income 73,394 46,983 66,727 76,236 9,509 14.3%
Other Income 533,435 192,471 446,180 526,280 80,100 18.0%
Total Revenues $37,714,957 $18,731,734 $38,833,426 $39,627,706 $794,280 2.0%
0
5,000
10,000
15,000
20,000
25,000
30,000
35,000
40,000
45,000
2013 Actual 2014 Budget 2015 Budget
Total District Revenue($,000)
Water Sales Assessment Income Other Revenue

104 Revenues
Water Sales
Water sales consist of:
Metered Revenue from residential, governmental, industrial and commercial customers.Customers are billed a monthly minimum based on meter size, which includes 1 hundred cubicfeet (HCF) of water (748 gallons). For amounts greater than 1 HCF, customers pay based on afour-tier declining block. Current member rates are :
Monthly Water Usage:
From To Rate
1 HCF 30 HCF $2.12
31 HCF 100 HCF $1.72
101 HCF 500 HCF $1.52
Greater than 500 HCF $0.86
Public Fire Protection revenue from charges to municipalities for hydrants. Eleven communitiespay a monthly fee based on the number of the hydrants in the community and proportionateshare of water system costs to assure water is available to fight fires.
Private Fire Protection revenue from charges to private users for hydrants and sprinklers.Customers are assessed a monthly fee based on the service line to the hydrant/sprinkler. Thefee based on proportionate share of water system costs to assure water is available to fightfires.
Other Water Revenue such as interest on delinquent customer balance and customer penalties.
The 2015 Budget of $21,690,890 reflects an assumed rate adjustment averaging 3.8% effective May 1,2015 and estimated number of customers and usage. Details on the how the estimated number ofestimated number of customer and usage was determined are on subsequent pages.
Water Sales rates have been adjusted annually. Average rate adjustments of 2.9% and 1.3% were madeon May 1, 2014 and 2013, respectively. In addition to the Board’s approval, all water rate adjustmentsare subject to review and approval by the Maine Public Utilities Commission.
2013 Actual
2014 Actual
Jan-Jun 2014 Budget 2015 Budget $-Diff. %-Diff.
Metered Revenue $18,150,642 $8,807,251 $18,920,028 $19,405,220 $485,192 2.6%
Public Fire Protection 1,198,678 607,286 1,229,348 1,272,849 43,501 3.5%
Private Fire Protection 843,912 432,816 865,980 909,500 43,520 5.0%
Other Water Revenue 108,416 50,119 114,827 103,321 (11,506) -10.0%
Total Water Sales $20,301,648 $9,897,472 $21,130,183 $21,690,890 $560,707 2.7%

105 Revenues
Water Sales - Cost of Service Study
Every 10 years, a cost of service study is done to compare the revenue generated by each meter
revenue customer class – residential, commercial, industrial and government - and fire protection
categories to the costs of providing services those customers. The most common and widely used cost
of service or cost allocation process is presented in the American Water Works Association’s manual of
practice M1 – Principles of Water Rates, Fees, and Charges. The process consists of several steps to
determine the cost of providing service to various classes of customers.
1. Costs are first assigned to various functions such as supply, treatment, pumping anddistribution. The District’s accounting system readily provides this functional breakdown.
2. The functional costs are then allocated to various types of service provided by the waterutility or cost components. The most common method is termed the “base-extra capacitymethod”. Under this method, the functional costs are allocated to the categories:
Base: costs that vary with the amount of water use, independent of peak demands
Extra Capacity: costs that are associated with meeting peak demand requirements
Customer: costs that are related to customer service and independent of wateruse. These are often subdivided into:
a. General or billing costs (meter reading, collection, etc.)
b. Meter and service costs (cost of meter or service line repair, maintenanceand testing)
Direct Fire Protection: cost associated with public fire hydrants.
3. Lastly, the costs that have been allocated to cost components are distributed to customerclasses or groups based on the relative amount of use that each class has of the variouscost components.
In general, we have followed the guidance in the AWWA’s M1 Manual to develop the cost of service
analysis for the District.
The last study was conducted in 2006. The study indicated industrial and commercial customers were
not paying the full cost of service. Because the rate change needed to those customer would create rate
shock and impact economic development, a policy was established to gradually increase the rates
impacting those customers over subsequent rate adjustments. Since 2007, those rates have been
increased at a rate of 150% of the rate change for residential customers.
The next study is scheduled to be conducted in 2016.

106 Revenues
Water Sales – Metered Revenue
Metered water revenue has risen from $18.1 million in 2010 to the budgeted amount of $19.4 million(7.2%). The rise in revenue was the result in rate increases offset by lower metered water usage. TheDistrict measures metered consumption by four customer classes, Residential, Commercial, Industrialand Governmental/Public. The consumption patterns of each of these customer classes vary from oneanother and these variations have been taken into consideration in estimating the consumption used forthe budget – see detail discussion on subsequent pages.
4,581 4,399 4,374 4,321 4,325 4,319
2,006 1,912 1,913 1,884 1,861 1,860
614556 540 540 541 534
1,9001,776 1,838 1,835 1,846 1,901
-
2,000
4,000
6,000
8,000
10,000
2010 Actual 2011 Actual 2012 Actual 2013 Actual 2014 Projection 2015 Budget
Historical Consumption vs. 2015 Budget(,000 HCF)
Residential Commerical Governmental Industrial
The ratio of each customer class as a percentage of all sales (shown below) has been fairly stable.
67.1% 67.1% 66.8% 67.2% 66.6% 66.6%
19.0% 18.9% 19.1% 19.1% 19.0% 19.0%
9.1% 9.1% 9.5% 9.2% 9.6% 9.7%
4.9% 4.9% 4.6% 4.5% 4.8% 4.7%
0%
20%
40%
60%
80%
100%
2010 Actual 2011 Actual 2012 Actual 2013 Actual 2014 Budget 2015 Budget
Metered WaterRevenue
Residential Commercial Industrial Public/Gov
$18,128,705 $18,126,404 $18,200,465 $18,920,028$18,150,642 $19,405,220

107 Revenues
Water Sales – Metered Revenue - Consumption
Residential
Residential consumption makes up about 50% of total metered consumption and generates roughly 67%of the District’s total metered water revenue. The two segments of residential consumption aremonthly billed and seasonal customers. Monthly billed customers receive bills year round on a monthlybasis. Seasonal customers receive a bill in the spring for a minimum consumption level and are billedagain in the fall for any excess usage above the minimum.
For monthly customers, consumption has been calculated by determining the core level of consumption,then estimating the amount of additional usage that largely occurs during the summer months. Themonthly core level was reached by taking the average of the lowest three months of each year in thesample data and annualizing that value.
80%
85%
90%
95%
100%
105%
110%
2005 2006 2007 2008 2009 2010 2011 2012 2013
Residential Customer& Consumption Trends2005-2013 (Indexed)
No. of Customers Consumption - HCF HCF per Cust.
Linear (No. of Customers) Linear (Consumption - HCF) Linear (HCF per Cust.)
As shown above, overall consumption (red line) has declined by approximately 4% despite a 5% increasein the number of customers (blue). This is due to roughly a 7% decrease in consumption per customer(green). To incorporate the slow decline in residential consumption year over year this percentage ofdecline was factored into the core.
The additional usage was then determined by averaging the percentage of additional consumption overthe core in the sample years. For the 2015 budget the core consumption was approximately 3.7 millionhcf (hundred cubic feet) and the additional was 15% of the core. This falls in line with historical data.

108 Revenues
Water Sales – Metered Revenue - Consumption
Residential (continued)
20
10
Act
ual
20
11
Act
ual
20
12
Act
ual
20
13
Act
ual
20
14
Pro
ject
ion
20
15
Bu
dge
t
0
1,000,000
2,000,000
3,000,000
4,000,000
5,000,000
Residential Consumption - Monthly Customers2010 - Present
Core Additional
The monthly additional consumption was determined based on average monthly consumption from arolling 36 month period ending July 2014 (the most current month available at the time). Two-thirds ofthe additional consumption is used between the months of June through September.
Jan
uar
y
Feb
ruar
y
Mar
ch
Ap
ril
May
Jun
e
July
Au
gust
Sep
tem
be
r
Oct
ob
er
No
vem
be
r
De
cem
be
r
-
100,000
200,000
300,000
400,000
500,000
Residential Consumption - Monthly Customers2015 Budget (HCF)
Core Additional
Consumption by seasonal customers makes up only 1.4% of total residential consumption. Residentialseasonal consumption for the budget was based the historical average from 2010 to 2013 and isapproximately 62,000 hcf for the year.

109 Revenues
Water Sales – Metered Revenue - Consumption
Commercial
In estimating commercial usage, consumption was also split between monthly billed and seasonalcustomers, similar to the residential class.
In the same manner as previously stated, monthly customer consumption has been calculated bydetermining the core level of consumption, then estimating the amount of additional usage. Themonthly core level was reached by taking the average of the lowest three months of each year in thesample data and annualizing that value. The rate of increase in customers is greater for this class thanresidential but the decrease in consumption per customer is also larger, producing a very similar rate ofdecline in overall consumption as is present on the residential side. To incorporate this decline incommercial consumption year over year, this percentage of decline was also factored into the core.
80%
85%
90%
95%
100%
105%
110%
2005 2006 2007 2008 2009 2010 2011 2012 2013
Commercial Customer& Consumption Trends2005-2013 (Indexed)
No. of Customers Consumption - HCF HCF per Cust.
Linear (No. of Customers) Linear (Consumption - HCF) Linear (HCF per Cust.)
The additional usage was then determined by averaging the percentage of additional consumption overthe core in the sample years. For the 2015 budget the core consumption was approximately 1.5 millionhcf and the additional was 18% of the core. The variation of additional consumption (over core) hasranged between 16% and 22% in the sample years.

110 Revenues
Water Sales – Metered Revenue - Consumption
Commercial (continued)
20
10
Act
ual
20
11
Act
ual
20
12
Act
ual
20
13
Act
ual
20
14
Pro
ject
ion
20
15
Bu
dge
t
0
500,000
1,000,000
1,500,000
2,000,000
2,500,000
Commercial Consumption - Monthly Customers2010 - Present
Core Additional
The monthly additional consumption was determined based on average monthly consumption from arolling 36 month period ending July 2014. Roughly 62% of additional consumption is used between themonths of June through September.
Jan
uar
y
Feb
ruar
y
Mar
ch
Ap
ril
May
Jun
e
July
Au
gust
Sep
tem
be
r
Oct
ob
er
No
vem
be
r
De
cem
be
r
-
50,000
100,000
150,000
200,000
Commerical Consumption - Monthly Customers2015 Budget (HCF)
Core Additional
Consumption by seasonal customers makes up only 2.4% of total commercial consumption. Commercialseasonal consumption for the budget was determined based on monthly consumption from a rolling 12month period ending July 2014.

111 Revenues
Water Sales – Metered Revenue - Consumption
Industrial
Historically, approximately 90% of industrial usage has come from just five customers, Calpine, TexasInstruments (formerly National Semiconductor), Sappi Fine Paper, Fairchild Semiconductor, and B&GFoods. In forecasting Industrial consumption, an estimate was made for each of these five customers.
Calpine
The Calpine power plant is the District’s largest customer. Located in Westbrook, Calpine uses twocombustion turbines routed to two heat recovery steam generators, which provide steam to one steamturbine. This facility produces enough electric power to meet the needs of more than 500,000 homesthroughout New England. Usage for 2015 should be more in line with the 2013 figure and has beenestimated at 750,000 hcf. Lower 2014 usage was the result of a few unplanned shutdowns formaintenance reasons.
Texas Instruments (formerly National Semiconductor)
Texas Instruments is a company that designs and makes semiconductors which it sells to electronicsdesigners and manufacturers globally. In 2011, the company bought National Semiconductor, asemiconductor manufacturer which specializes in analog devices and subsystems that operates a waferfabrication plant in South Portland. Water usage for 2015 is not expected to differ from current levelsand has been estimated at roughly 340,000 hcf, the same as the 12 month period ending July 2014.
Sappi Fine Paper
Sappi Fine Paper North America is the leading producer and supplier of coated fine paper, pulp andrelease paper in the United States. The company has two facilities in Westbrook, a mill and a technologycenter. The mill is primarily a production facility for specialty release papers and films. The technologycenter is equipped with two state-of-the-art pilot coaters that enable prototype development for bothcoated fine papers and specialty release paper. Based on a review of their current usage pattern anestimated consumption of 370,000 hcf was assumed.
Fairchild Semiconductor
Fairchild Semiconductor is an electronics component manufacturer. The company makes tiny siliconchips used in a variety of industries, including cellular technology, home goods and automotiveapplications. Fairchild operates a manufacturing facility in Portland and a business office in SouthPortland. The consumption estimate for 2015 was based on a historical average of approximately168,000 hcf.

112 Revenues
Water Sales – Metered Revenue - Consumption
Industrial (continued)
B&G Foods
B&G Foods and its subsidiaries manufacture, sell and distribute a diversified portfolio of high-quality,branded shelf-stable foods across the United States, Canada and Puerto Rico. They own B&M Beans,which operates a bean cannery in Portland. A representative from B&G stated that consumption in2015 should not vary from current usage and has been estimated at 90,000 hcf.
All Other Industrial Customers
-
50,000
100,000
150,000
200,000
250,000
2005 2006 2007 2008 2009 2010 2011 2012 2013
H
C
F
Historical Industrial Consumption2005-2013 (Excluding Top 5)
The remaining industrial usage makes up roughly 10% of the consumption for this customer class. Asshown in the graph above, there has been no clear pattern in consumption for these users. Therefore,consumption for this group has been estimating using the historical average for 2010-2013 of about183,000 hcf. This value is also consistent with the historical average for all data currently available(2005-2013).

113 Revenues
Water Sales – Metered Revenue - Consumption
Public/Governmental
Yarmouth Water District
Approximately 30% of public/governmental consumption comes from usage by the Yarmouth WaterDistrict which provides this water almost entirely to the Wyman Power Plant on Cousins Island. WymanPower Plant is a spot producer of power for the northeast and is only used during peak energy demandbecause, as an oil-fired generator, it has become obsolete.
Wyman rarely ran in recent years because it competes with natural gas fired units in New England. Theygenerate roughly half the region’s power and are much cheaper to operate. Due to a colder ’13-’14winter the Wyman Power Plant was needed more often than past years and may be called upon againthis winter due to periodic planned shutdowns at other northeast power plants. Also to be consideredis the high probability of a milder winter due to El Nino. Assessing these factors, the assumedconsumption for Yarmouth Water District has been set at 157,000 hcf, approximately 5% lower than theprior 12 month period.
Other Public/Governmental Customers
Public/Governmental consumption has been in decline since the economic downturn. Governmententities have sought out ways to decrease expenditures including their water and sewer bill. As a result,we do not anticipate this decrease in consumption to return and have predicted usage to be similar tothe most recent 12 month period.
-
100,000
200,000
300,000
400,000
500,000
600,000
2005 2006 2007 2008 2009 2010 2011 2012 2013
H
C
F
Public/Governmental Consumption2005-2013 (excluding Yarmouth)

114 Revenues
Water Sales – Metered Revenue - Rates
Water Rate Schedule
A 3.8% increase is proposed to be implemented effective 5/1/2015. Board of Trustees will review andapprove any rate adjustment in first quarter of 2015.
Current Rates: Effective 05/01/2014
Meter or Service Line Size Member Rate Non-member Rate
Private Fire Monthly Fee
2 $3.32 $3.81
3 7.45 8.53
4 13.24 15.23
6 31.65 36.39
8 52.99 60.92
10 82.78 95.25
12 119.20 137.09
16 211.91 243.70
Minimum Monthly Charges
5/8 $8.46 $9.73
3/4 9.97 11.45
1 12.93 14.90
1 1/2 21.14 24.31
2 30.45 35.00
3 55.25 63.52
4 83.15 95.63
6 160.67 184.75
8 253.67 291.73
10 367.30 422.40
12 486.21 559.13
Low income 2.12 2.45
Monthly Volume Charge
First 100 Cf minimum minimum
Next 2,900 Cf $2.12 $2.45
Next 7,000 Cf 1.72 1.98
Next 40,000 Cf 1.52 1.75
Over 50,000 Cf 0.86 1.00

115 Revenues
Water Sales – Metered Revenue - Rates
Water Rate Schedule (continue)
Water rates were unchanged from 2002 through 2006, rate changes since that time were:Effective Date Metered Rates Fire Projection Rates01/01/07 3.5% increase 11.0% increase01/01/08 3.8% increase unchanged01/01/09 7.0% increase 3.0% increase05/01/10 3.6% increase 3.5% increase05/01/11 2.0% increase 2.0% increase05/01/13 1.3% increase 1.5% increase05/01/1405/01/15*
2.9% increase3.8% increase
3.0% increase3.8% increase
* = Proposed increase, subject to Board of Trustees and Maine Public Utility Commission approval.(seeIntroduction: Overview of the Regulatory Environment in Which We Operate – Consumer-Owned WaterUtility Rate Case Process for a description of the rate approval process).
Changes in metered revenue are strongly correlated to changes in rates. There is also a relationshipbetween metered revenue growth and changes in consumption. The graph below reflects thiscorrelation. The revenue line runs closely to rates, while changes in its slope correspond to changes inconsumption. The 4.4% increase in water revenue (2014 Projection vs. 2015 Budget) was the result ofthe 3.8% increase in rates and a 0.5% increase in forecasted consumption.
-5.0%
0.0%
5.0%
10.0%
15.0%
20.0%
25.0%
2009 Actual 2010 Actual 2011 Actual 2012 Actual 2013 Actual 2014 Projection 2015 Budget
Cumulative Change in Metered RevenueMetered Revenue vs. Revenue Drivers
Consumption Revenue Rates
Typical Customer Increases Current Proposed 3.8% $ %
Residential (per month) .62" meter, 7 HCF $21.18 $21.88 $0.70 3.3%
Commercial (per month) .75" meter, 80 HCF 157.45 164.31 6.86 4.4%
Small Industrial (per month)2" meter, 1,300HCF
1,508.33 1,582.17 73.84 4.9%
Large Industrial (per month)8" meter, 56,000HCF
48,773.55 51,046.44 2,272.89 4.7%
Sprinkler (per year) 6" meter 379.80 394.23 14.43 3.8%
Public Fire (per year) 1,241,400.00 1,288,572.00 47,172.00 3.8%
Seasonal (per year) .62" meter 211.65 219.69 8.04 3.8%
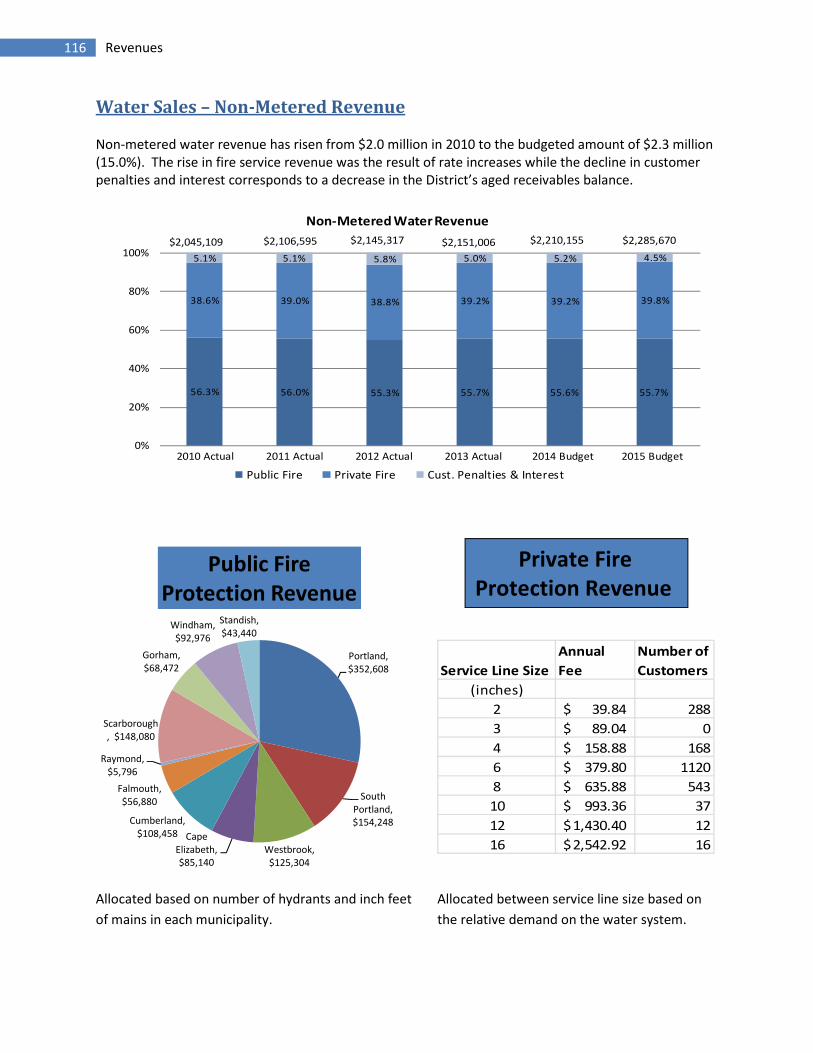
116 Revenues
Water Sales – Non-Metered Revenue
Non-metered water revenue has risen from $2.0 million in 2010 to the budgeted amount of $2.3 million(15.0%). The rise in fire service revenue was the result of rate increases while the decline in customerpenalties and interest corresponds to a decrease in the District’s aged receivables balance.
56.3% 56.0% 55.3% 55.7% 55.6% 55.7%
38.6% 39.0% 38.8% 39.2% 39.2% 39.8%
5.1% 5.1% 5.8% 5.0% 5.2% 4.5%
0%
20%
40%
60%
80%
100%
2010 Actual 2011 Actual 2012 Actual 2013 Actual 2014 Budget 2015 Budget
Non-Metered WaterRevenue
Public Fire Private Fire Cust. Penalties & Interest
$2,045,109 $2,106,595 $2,145,317 $2,210,155$2,151,006 $2,285,670
Service Line Size
Annual
Fee
Number of
Customers
(inches)
2 39.84$ 288
3 89.04$ 0
4 158.88$ 168
6 379.80$ 1120
8 635.88$ 543
10 993.36$ 37
12 1,430.40$ 12
16 2,542.92$ 16
Allocated based on number of hydrants and inch feet
of mains in each municipality.
Allocated between service line size based on
the relative demand on the water system.
Portland,$352,608
SouthPortland,$154,248
Westbrook,$125,304
CapeElizabeth,$85,140
Cumberland,$108,458
Falmouth,$56,880
Raymond,$5,796
Scarborough, $148,080
Gorham,$68,472
Windham,$92,976
Standish,$43,440
Public FireProtection Revenue
Private FireProtection Revenue

117 Revenues
Water Sales - Long-Term Considerations
Revenue & Expense: Fixed vs. Variable
As shown below, approximately 38% of the District’s water revenue is fixed, generated from minimumcharges on metered accounts and fire protection charges. The remaining 62% varies depending onconsumption levels. In comparison, 95% of the District’s expenses are fixed, largely infrastructure costs.
Fixed,38%
Variable,62%
Revenue
Fixed,95%
Variable, 5%
Expenses
Decline in Consumption
There has been a nationwide trend in recent years toward lower consumption levels. This trend alsoappears in the District’s consumption data. Some factors contributing to this decline are more efficientappliances and fixtures, increasing water/ sewer rates and a decrease in average household size.
Slow Customer Growth
Population growth in the District’s service area is lower than in other parts of the country and is notexpected to increase. In recent years, customer growth has been less than 1% per year.
Cost of Service Gap
The last Cost of Service Study was completed in 2006. The study indicated that industrial/commercialcustomers generate less revenue than the costs to serve them. The Board requested that the gap beclosed over future rate adjustments by increasing revenue generated by industrial/commercialcustomers at higher increments. The proposed rate schedule will continue to have greater impact onlarger customers by a factor 150% compared to smaller ones.

118 Revenues
Wastewater Assessment & Contracted Billing Income
Wastewater Assessments are amounts payable by each municipality for wastewater services providedby the District. The assessments cover the operating and debt service costs of operating wastewaterfacilities maintained by the District. The assessments are billed in monthly installments. In 2015,assessments for Cape Elizabeth and Portland were increased (see table below).
Contracted Billing Income is revenue paid by municipalities for wastewater billing services provided.Falmouth, Scarborough and South Portland operate and maintain their own wastewater collection andtreatment systems. The District only provides billing-related services for those communities.
Contracted Billing Income
2013 Actual
2014 Actual
Jan-Jun 2014 Budget 2015 Budget $-Diff. %-Diff.
Falmouth $15,012 $7,506 $15,012 $15,012 -$ 0.0%
Scarborough 10,620 5,310 10,620 10,620 - 0.0%
South Portland 192,384 96,192 192,384 192,384 - 0.0%
$218,016 $109,008 $218,016 $218,016 -$ 0.0%
Cape Elizabeth1,412,112
Cumberland731,784
Gorham1,106,148
Portland10,981,308
Westbrook2,533,176
Windham351,756
Other2,189,688
Wastewater Assessments(Dollars)
Wastewater Assessments
2014 Actual
2014 Actual
Jan-Jun 2014 Budget 2015 Budget $-Diff. %-Diff.
Cape Elizabeth $1,365,084 $688,626 $1,377,252 $1,412,112 $34,860 2.5%
Cumberland 713,940 365,532 731,784 731,784 - 0.0%
Gorham 1,084,464 553,074 1,106,148 1,106,148 - 0.0%
Portland 10,540,044 5,436,102 10,872,204 10,981,308 109,104 1.0%
Westbrook 2,533,176 1,266,588 2,533,176 2,533,176 - 0.0%
Windham 351,756 175,878 351,756 351,756 - 0.0%
$16,588,464 $8,485,800 $16,972,320 $17,116,284 $143,964 0.8%

119 Revenues
Wastewater Assessments Revenue Trend
Wastewater assessments rose from $16.3 million in 2010 to a budgeted $17.1 million in 2015 (anincrease of 5.0%). While operating costs have increased over this time period, the majority of theincreases were due to capital projects done to upgrade existing wastewater facilities.
Wastewater Assessments by Fund:
Cape Elizabeth Cumberland Gorham Portland Westbrook Windham Total
2010 Actual 1,089,984 702,264 1,068,444 10,540,044 2,533,176 351,756 16,285,668
2011 Actual 1,089,984 702,264 1,068,444 10,340,044 2,533,176 351,756 16,085,668
2012 Actual 1,293,540 712,800 1,084,464 10,540,044 2,533,176 351,756 16,515,780
2013 Actual 1,365,084 713,940 1,084,464 10,540,044 2,533,176 351,756 16,588,464
2014 Budget 1,377,252 731,784 1,106,148 10,872,204 2,533,176 351,756 16,972,320
2015 Budget 1,412,112 731,784 1,106,148 10,981,308 2,533,176 351,756 17,116,284
-
2,000
4,000
6,000
8,000
10,000
12,000
14,000
16,000
18,000
2009 Actual 2010 Actual 2011 Actual 2013 Actual 2014 Budget 2015 Budget
Assessments by Fund (2010-Present)($,000)
Cape Elizabeth Cumberland Gorham Portland Westbrook Windham
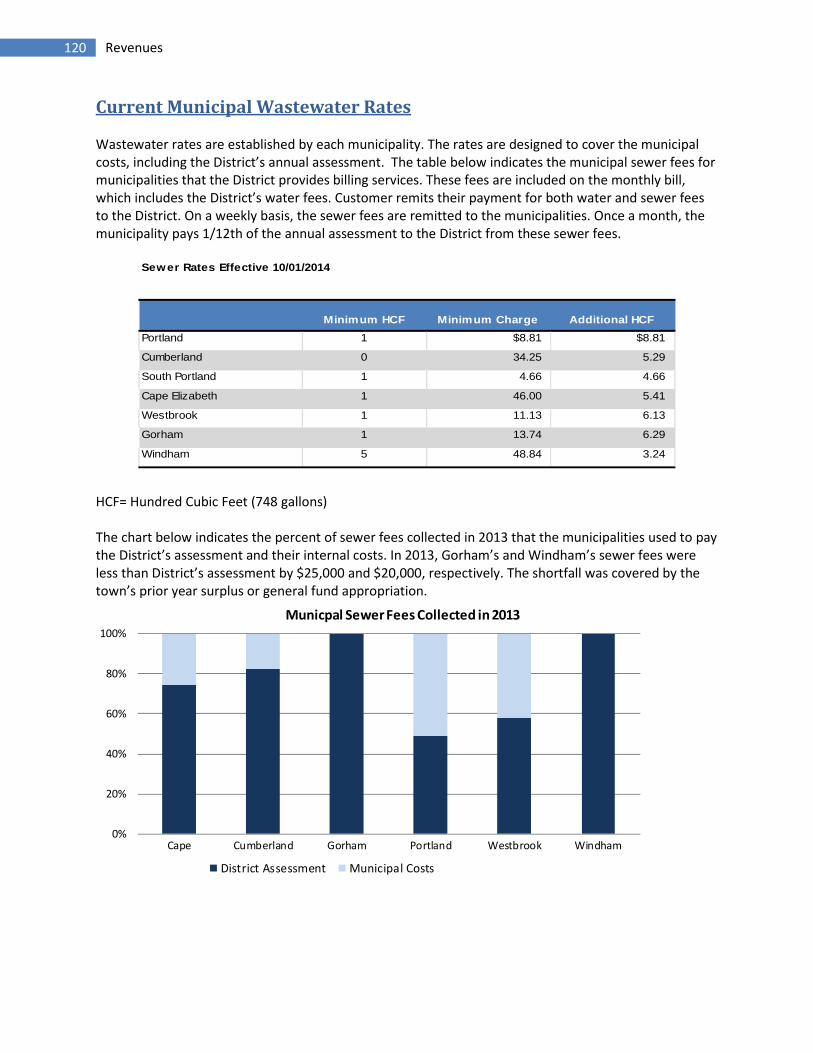
120 Revenues
Current Municipal Wastewater Rates
Wastewater rates are established by each municipality. The rates are designed to cover the municipalcosts, including the District’s annual assessment. The table below indicates the municipal sewer fees formunicipalities that the District provides billing services. These fees are included on the monthly bill,which includes the District’s water fees. Customer remits their payment for both water and sewer feesto the District. On a weekly basis, the sewer fees are remitted to the municipalities. Once a month, themunicipality pays 1/12th of the annual assessment to the District from these sewer fees.
Sewer Rates Effective 10/01/2014
Minimum HCF Minimum Charge Additional HCF
Portland 1 $8.81 $8.81
Cumberland 0 34.25 5.29
South Portland 1 4.66 4.66
Cape Elizabeth 1 46.00 5.41
Westbrook 1 11.13 6.13
Gorham 1 13.74 6.29
Windham 5 48.84 3.24
HCF= Hundred Cubic Feet (748 gallons)
The chart below indicates the percent of sewer fees collected in 2013 that the municipalities used to paythe District’s assessment and their internal costs. In 2013, Gorham’s and Windham’s sewer fees wereless than District’s assessment by $25,000 and $20,000, respectively. The shortfall was covered by thetown’s prior year surplus or general fund appropriation.
0%
20%
40%
60%
80%
100%
Cape Cumberland Gorham Portland Westbrook Windham
Municpal Sewer Fees Collected in 2013
District Assessment Municipal Costs

121 Revenues
Interest Income
The District’s investment policy limits investments to US Government obligations, certificates of depositthat are fully insured or collateralized and other similar issues with the goal of protecting the District’sprincipal balances. The rate of return on investments is assumed to be 0.26% and is based on a cash andinvestment balance of $26.4 million. The rate of return for the 2015 Budget is a decrease from the prioryear budgeted rate as well as the actual rate from 2013.
In 2008, the Windham fund purchased assets from the Westbrook fund. This purchase was funded by aloan between funds of $264,733 and has an average interest rate of 4.395%. Westbrook will receive$7,710 from that loan in 2015.
2013 Actual
2014 Actual
Jan-Jun 2014 Budget 2015 Budget $-Diff. %-Diff.
Water Fund $29,265 $19,178 $26,630 $34,391 $7,761 29.1%
Wastew ater Operating Funds:
Cape Elizabeth 1,915 1,022 1,605 1,988 383 23.9%
Cumberland 2,002 1,100 1,762 1,911 149 8.5%
Gorham 3,606 1,577 3,123 3,425 302 9.7%
Portland 17,597 10,630 16,793 17,186 393 2.3%
Westbrook 17,413 12,651 15,517 15,870 353 2.3%
Windham 1,083 557 897 1,125 228 25.4%
43,616 27,537 39,697 41,504 1,807 4.6%
Contracted Billing:
Falmouth 146 73 123 114 (9) -7.3%
Scarborough 8 3 9 7 (2) -22.2%
South Portland 359 192 268 220 (48) -17.9%
513 268 400 341 (59) -14.8%
Total 73,394$ 46,983$ 66,727$ 76,236$ 9,509$ 14.3%
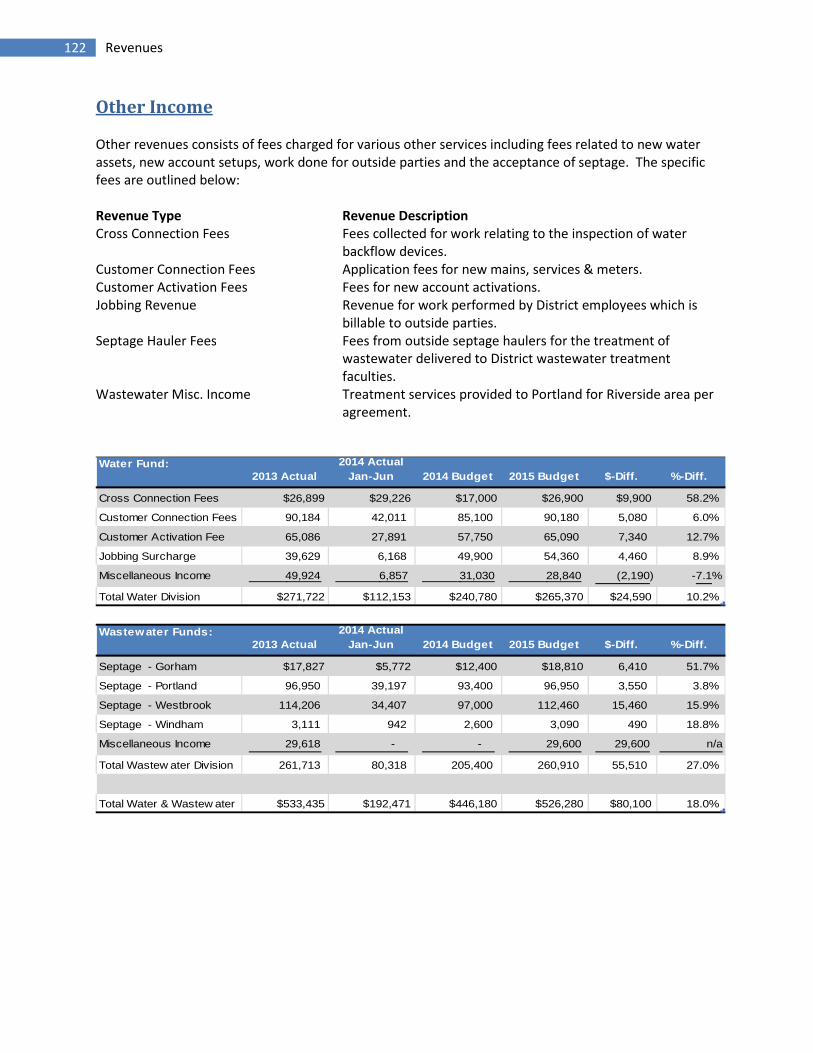
122 Revenues
Other Income
Other revenues consists of fees charged for various other services including fees related to new waterassets, new account setups, work done for outside parties and the acceptance of septage. The specificfees are outlined below:
Revenue Type Revenue DescriptionCross Connection Fees Fees collected for work relating to the inspection of water
backflow devices.Customer Connection Fees Application fees for new mains, services & meters.Customer Activation Fees Fees for new account activations.Jobbing Revenue Revenue for work performed by District employees which is
billable to outside parties.Septage Hauler Fees
Wastewater Misc. Income
Fees from outside septage haulers for the treatment ofwastewater delivered to District wastewater treatmentfaculties.Treatment services provided to Portland for Riverside area peragreement.
Water Fund:2013 Actual
2014 Actual
Jan-Jun 2014 Budget 2015 Budget $-Diff. %-Diff.
Cross Connection Fees $26,899 $29,226 $17,000 $26,900 $9,900 58.2%
Customer Connection Fees 90,184 42,011 85,100 90,180 5,080 6.0%
Customer Activation Fee 65,086 27,891 57,750 65,090 7,340 12.7%
Jobbing Surcharge 39,629 6,168 49,900 54,360 4,460 8.9%
Miscellaneous Income 49,924 6,857 31,030 28,840 (2,190) -7.1%
Total Water Division $271,722 $112,153 $240,780 $265,370 $24,590 10.2%
Wastewater Funds:2013 Actual
2014 Actual
Jan-Jun 2014 Budget 2015 Budget $-Diff. %-Diff.
Septage - Gorham $17,827 $5,772 $12,400 $18,810 6,410 51.7%
Septage - Portland 96,950 39,197 93,400 96,950 3,550 3.8%
Septage - Westbrook 114,206 34,407 97,000 112,460 15,460 15.9%
Septage - Windham 3,111 942 2,600 3,090 490 18.8%
Miscellaneous Income 29,618 - - 29,600 29,600 n/a
Total Wastew ater Division 261,713 80,318 205,400 260,910 55,510 27.0%
Total Water & Wastew ater $533,435 $192,471 $446,180 $526,280 $80,100 18.0%
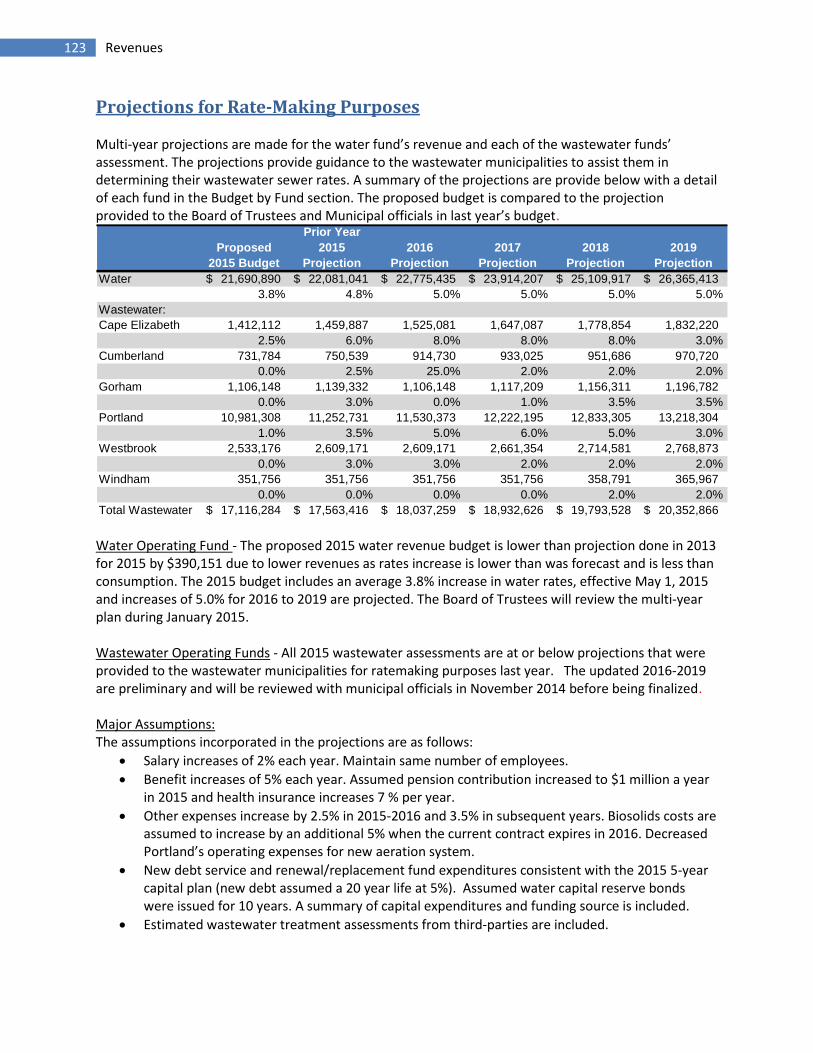
123 Revenues
Projections for Rate-Making Purposes
Multi-year projections are made for the water fund’s revenue and each of the wastewater funds’assessment. The projections provide guidance to the wastewater municipalities to assist them indetermining their wastewater sewer rates. A summary of the projections are provide below with a detailof each fund in the Budget by Fund section. The proposed budget is compared to the projectionprovided to the Board of Trustees and Municipal officials in last year’s budget.
Proposed
2015 Budget
Prior Year
2015
Projection
2016
Projection
2017
Projection
2018
Projection
2019
Projection
Water 21,690,890$ 22,081,041$ 22,775,435$ 23,914,207$ 25,109,917$ 26,365,413$
3.8% 4.8% 5.0% 5.0% 5.0% 5.0%
Wastewater:
Cape Elizabeth 1,412,112 1,459,887 1,525,081 1,647,087 1,778,854 1,832,220
2.5% 6.0% 8.0% 8.0% 8.0% 3.0%
Cumberland 731,784 750,539 914,730 933,025 951,686 970,720
0.0% 2.5% 25.0% 2.0% 2.0% 2.0%
Gorham 1,106,148 1,139,332 1,106,148 1,117,209 1,156,311 1,196,782
0.0% 3.0% 0.0% 1.0% 3.5% 3.5%
Portland 10,981,308 11,252,731 11,530,373 12,222,195 12,833,305 13,218,304
1.0% 3.5% 5.0% 6.0% 5.0% 3.0%
Westbrook 2,533,176 2,609,171 2,609,171 2,661,354 2,714,581 2,768,873
0.0% 3.0% 3.0% 2.0% 2.0% 2.0%
Windham 351,756 351,756 351,756 351,756 358,791 365,967
0.0% 0.0% 0.0% 0.0% 2.0% 2.0%
Total Wastewater 17,116,284$ 17,563,416$ 18,037,259$ 18,932,626$ 19,793,528$ 20,352,866$
Water Operating Fund - The proposed 2015 water revenue budget is lower than projection done in 2013for 2015 by $390,151 due to lower revenues as rates increase is lower than was forecast and is less thanconsumption. The 2015 budget includes an average 3.8% increase in water rates, effective May 1, 2015and increases of 5.0% for 2016 to 2019 are projected. The Board of Trustees will review the multi-yearplan during January 2015.
Wastewater Operating Funds - All 2015 wastewater assessments are at or below projections that wereprovided to the wastewater municipalities for ratemaking purposes last year. The updated 2016-2019are preliminary and will be reviewed with municipal officials in November 2014 before being finalized.
Major Assumptions:The assumptions incorporated in the projections are as follows:
Salary increases of 2% each year. Maintain same number of employees.
Benefit increases of 5% each year. Assumed pension contribution increased to $1 million a yearin 2015 and health insurance increases 7 % per year.
Other expenses increase by 2.5% in 2015-2016 and 3.5% in subsequent years. Biosolids costs areassumed to increase by an additional 5% when the current contract expires in 2016. DecreasedPortland’s operating expenses for new aeration system.
New debt service and renewal/replacement fund expenditures consistent with the 2015 5-yearcapital plan (new debt assumed a 20 year life at 5%). Assumed water capital reserve bondswere issued for 10 years. A summary of capital expenditures and funding source is included.
Estimated wastewater treatment assessments from third-parties are included.

124 Revenues
Fund Balance
Fund Balance, or Surplus, is the excess of revenues over expenses on a budgetary basis (see financialpolicy section for description of differences between budgetary and generally accepted accountprinciples). In addition to the surplus fund balance, a portion of water net income is reserved in awatershed protection land fund. In 2009, the District’s Board of Trustees (BOT) adopted a policy settingtargets for operating fund balance (25% of net budget) and watershed protection reserve (15% of waterrevenues). These policies do not apply to the Contracted Billing municipalities.
It is projected that most funds will be above the operating fund target at the end of 2015. The Waterand Cape Elizabeth fund, which were below the target when the policy was put in place, are projected tocontinue positive movement towards the goal by the end of 2015.
The Board ordered that the proceeds from the sales of certain surplus properties be added to the LandCash Reserve. Those sales, when added to the carry forward total, are expected to yield a reservebalance of $586,517.
In the Capital Finance section, the balances of the renewal and replacement funds and water maincapital reserve fund are listed.
Water & Wastewater Fund Operating Surpluses (Goal 25.0%)
Balance Projected Budget Balance Target Projection
1/1/2014 2014 2015 12/31/2015 Balance %
Water $3,500,787 $596,902 $538,168 $4,635,857 $5,271,473 22.0%
Cape Elizabeth 257,731 64,387 - 322,118 $353,028 22.8%
Cumberland 308,553 (47,072) - 261,481 $182,946 35.7%
Gorham 417,084 4,990 - 422,074 $276,537 38.2%
Portland 3,324,976 259,785 - 3,584,761 $2,745,327 32.6%
Westbrook 1,404,156 35,161 - 1,439,317 $633,294 56.8%
Windham 171,168 20,167 - 191,335 87,939 54.4%
$9,384,455 $934,320 $538,168 $10,856,943 $9,550,544 28.4%
Contracted Billing Operating Surpluses:
Balance Projected Budget Balance
1/1/2014 2014 2015 12/31/2015
Falmouth $31,766 $3,747 $2,838 $38,351
Scarborough 3,194 511 617 4,322
So. Portland 89,616 14,989 (1,641) 102,964
$124,576 $19,247 $1,814 $145,637
Combined Surpluses $9,509,031 $953,567 $539,982 $11,002,580
Watershed Protection Land Funds (Goal 15.0%)
Balance Projected Budget Balance Target Projection
1/1/2014 2014 2015 12/31/2015 Balance %
Watershed Reserve $1,219,782 - - $1,219,782 $3,253,634 5.6%
Land Cash Reserve 944,960 (358,443) - 586,517
$2,164,742 ($358,443) - $1,806,299 $3,253,634 8.3%

125 Operating Expenses
Introduction
Operating Expenses are recorded to each department by expense category by fund and program. Asummary of all expense categories is provided with an explanation of major assumption and changes.Additionally, operating expenses for each department is provided. The District has five departments –Water Operations, Wastewater Operations, Environmental Services, Engineering Services andAdministrative Services. For each department, the following information is provided:
Description of Core Services
Key Statistics
Performance Benchmarks
Past Accomplishments
Current Year Projects and Initiatives
Financial Summary in total and by sub-departments with a summary of each sub-departmentfund and program expenses
2015 Financial Summary by Category
2014 Budget 2015 Budget Diff $ Diff %
Salaries & Wages 10,003,869 10,178,032 $174,163 1.7%
Employee Benefits 4,869,224 5,118,429 249,205 5.1%
Biosolids Disposal 1,298,503 1,387,398 88,895 6.8%
Chemicals 1,139,119 1,070,838 (68,281) -6.0%
Contracted Services 3,799,691 4,084,006 284,315 7.5%
Deferred Cost W/O 21,888 29,488 7,600 34.7%
Heat/Fuel Oil 515,008 499,058 (15,950) -3.1%
Insurance 188,736 204,560 15,824 8.4%
Materials & Supplies 1,586,165 1,611,952 25,787 1.6%
Other Expense 755,149 806,267 51,118 6.8%
Purchased Power 1,829,293 1,790,652 (38,641) -2.1%
Regulatory/Taxes 221,017 226,586 5,569 2.5%
Tele/Other Utilties 313,657 317,429 3,772 1.2%
Transportation 1,264,935 1,297,239 32,304 2.6%
Grand Total 27,806,254 28,621,934 815,680 2.9%
Transport Offset (893,707) (898,062) (4,355) 0.5%
Operating Expense 26,912,547 27,723,872 811,325 3.0%
2015 Financial Summary by Department
Number of
Employees
2014
Budget
Number of
Employees
2015
Budget
Budget
Diff $
Budget
Diff %
Water Operations 53 $7,704,198 53 $8,008,811 $304,613 4.0%
Wastewater Services 39 8,930,589 39 9,091,655 161,066 1.8%
Environmental Services 15 1,854,185 15 1,899,441 45,256 2.4%
Engineering Services 30 3,878,479 30 4,011,001 132,522 3.4%
Administration 40 5,071,114 40 5,249,828 178,714 3.5%
Non-Departmental 1 367,689 1 361,198 (6,491) -1.8%
Total 178 $27,806,254 178 $28,621,934 $815,680 2.9%

126 Operating Expenses
Operating Expense by Category
Salaries/Wages:
2013
Actual
2014
Jan-Jun
2014
Budget
2015
Budget
Budget
Diff $
Budget
Diff %
660111 - SALARIES/WAGES NON-UNION $3,620,754 $1,756,693 $3,739,022 $3,854,002 $114,980 3.1%
660121 - WAGES/REGULAR UNION 5,198,892 2,613,963 5,380,563 5,465,803 85,240 1.6%
660122 - WAGES/OVERTIME UNION 395,914 214,030 412,659 389,560 (23,099) -5.6%
660123 - WAGES/DOUBLETIME UNION 47,949 29,677 55,951 47,048 (8,903) -15.9%
660124 - WAGES/STANDBY TIME UNION 130,237 63,976 118,616 121,234 2,618 2.2%
660131 - WAGES - REGULAR - TEMPS 152,411 62,308 182,349 183,393 1,044 0.6%
660132 - WAGES - OVERTIME- TEMPS 213 71 0 0 0 n/a
660133 - WAGES - DOUBLETIME - TEMP 77 0 0 0 0 n/a
660136 - CONTRACTED - TEMPS 0 0 0 89,992 89,992 n/a
66014 - VACATION ACCRUAL (7,756) 0 0 0 0 n/a
660141 - TRUSTEES COMPENSATION 23,150 11,950 27,000 27,000 0 0.0%
66015 - SICKTIME ACCRUAL 19,041 0 0 0 0 n/a
66351 - CONTRACTED TEMPORARIES 64,652 21,521 87,709 0 (87,709) -100.0%
9,645,534 4,774,189 10,003,869 10,178,032 174,163 1.7%
The budgeted dollars for labor reflects work on operating (O&M) activities. Labor planned for capitalprojects is included as part of the Capital Improvement Plan (CIP) later in this document. Overall, thepercentage of labor planned for CIP projects increased from 3.3% of total labor in 2014 to 3.4% in 2015(an increase of $13,012 or 3.8%).
Labor rates for all employees (union and non-union) were assumed to be 2.0% higher than the ratespaid to employees on July 1, 2015. The overall O&M increase for all labor categories equaled only 1.7%due to the shift to more capital work noted above (particularly for overtime and double time) and theturnover of Non-Union positions where the newer/less senior employees have a lower starting rate ofpay.
Combined the two regular labor accounts (660111 & 660121) increased 2.2% with a slight increase(0.4%) in hours due to the conversion of one part-time position to full time.
Budgeted hours were reduced for both overtime (982 hours or 8.0%) and doubletime (229 hours or18.5%) due to a shift in hours to capital and a reduction in weekend coverage hours.
The District’s overall number of employees remained the same between 2014 and 2015 at 178.
Budget 2014 Budget 2015 Budget Change
Full Time 175 176 1
Part Time 3 2 -1
Total 178 178 0
The Human Resources section has additional details.

127 Operating Expenses
Operating Expense by Category (continued)
Employee Benefits:
2013
Actual
2014 Jan-
Jun
2014
Budget
2015
Budget
Budget
Diff $
Budget
Diff %
660401 - FICA - EMPLOYERS' SHARE $710,363 $355,171 $758,587 $771,733 $13,146 1.7%
660403 - LIFE INSURANCE 0 1,200 0 0 0 n/a
660405 - SAFETY/WHY PROGRAM ITEMS 31,526 6,125 31,904 35,687 3,783 11.9%
6604065 - PENSION LEGAL EXPENSE 190 0 0 0 0 n/a
660407 - EDUCATION SUBSIDY 0 933 0 0 0 n/a
660411 - MEALS ALLOWANCE 6,338 4,460 2,158 6,396 4,238 195.6%
660413 - PWD TRAINING PROGRAM 1,092 724 0 0 0 n/a
6604151 - FIELD UNIFORMS 0 0 1,200 1,200 0 0.0%
660418 - STIPENDS 13,600 13,200 14,283 13,750 (533) -3.7%
660419 - EMPLOYEE BENEFTS-MISC OTH 28,687 3,128 1,050 5,350 4,300 409.5%
660420 - WORKFORCE PLANNING 200 0 0 0 0 n/a
660491 - FRINGE BENEFITS-REG/SAL 3,826,011 1,974,053 4,060,042 4,284,313 224,271 5.5%
4,618,007 2,358,994 4,869,224 5,118,429 249,205 5.1%
The amount noted is the operating funds’ portion of employee benefit cost. As with labor, a smallportion of benefit expense is charged to capital projects.
The largest item (Fringe Benefits - 660491) covers the District’s portion of employee benefits, mostnotably health insurance and pension. This charge is applied as a percentage of regular labor (excludingovertime, double time, etc.) charges. In the 2015 Budget, the percentage is 45.97% which is an increaseof 1.45% over 2014’s percentage of 44.52%. Total benefit costs rose 5.4% with increases in both ofpensions (7.2%) and health insurance (2.9%).
Biosolids Disposal:
2013
Actual
2014
Jan-Jun
2014
Budget
2015
Budget
Budget
Diff $
Budget
Diff %
663571 - BIOSOLIDS DISPOSAL $1,351,703 $753,733 $1,298,503 $1,387,398 $88,895 6.8%
1,351,703 753,733 1,298,503 1,387,398 88,895 6.8%
The material remaining at the end of the wastewater treatment process is called biosolids. The cost ofbiosolids disposal is the volume disposed (wet tons) times the rate per ton:
Facility 2014 2015 Change % 2014 %Solids 2015 %Solids
Portland (East End) 14,953.0 15,511.0 558.0 3.7% 23.5% 23.5%
Westbrook 4,678.0 4,958.0 280.0 6.0% 16.0% 16.0%
Cape Elizabeth 214.5 218.5 4.0 1.9% 23.5% 23.5%
Peaks Island 42.6 45.0 2.4 5.6% 23.5% 23.5%
Total 19,888.1 20,732.5 844.4 4.2%
The price per wet ton is expected to be $66.92; this is a 2.5% increase over the prior year’s budgetassumption ($65.29). The volume of material disposed is projected to increase 4.2%.

128 Operating Expenses
Operating Expense by Category (continued)
Chemicals:
2013
Actual
2014
Jan-Jun
2014
Budget
2015
Budget
Budget
Diff $
Budget
Diff %
66181 - AMMONIA $26,415 $14,473 $27,360 $23,748 ($3,612) -13.2%
661811 - SODIUM BICARBONATE 6,458 6,783 8,800 12,474 3,674 41.8%
661812 - SODIUM BISULFITE 141,687 94,634 171,211 171,042 (169) -0.1%
6618121 - SODIUM BISULFITE-ACCRUAL (1,965) 1,695 0 0 0 n/a
66182 - CAUSTIC SODA 82,417 35,117 97,219 93,610 (3,609) -3.7%
66183 - FLUORINE COMPOUND 69,267 19,894 69,018 59,265 (9,753) -14.1%
66184 - ZINC ORTHOPHOSPHATE 70,220 19,800 79,541 77,004 (2,537) -3.2%
66185 - SODIUM HYPOCHLORITE 386,754 193,940 354,960 388,018 33,058 9.3%
661851 - SODIUM HYPO - ACCURAL 236 1,102 0 0 0 n/a
66189 - POLYMER 154,107 138,366 182,020 186,029 4,009 2.2%
661891 - POLYMER - ACCRUAL 27,630 (16,037) 0 0 0 n/a
661892 - LIQUID OXYGEN (LOX) 0 17,883 143,884 53,642 (90,242) -62.7%
661899 - OTHER CHEMICALS 4,507 2,258 5,106 6,006 900 17.6%
967,733 529,908 1,139,119 1,070,838 (68,281) -6.0%
Chemicals are primarily used at the District’s one water and four wastewater treatment facilities. The2015 Budget assumes most chemicals per unit chemical pricing will either be flat or decline as comparedwith the 2014 Budget. Actual unit prices will be known in December. Volumes used were adjusted up ordown depending upon historic usage.
The biggest change was the budget for liquid oxygen. Use of liquid oxygen started in early 2014 uponthe completion of the upgrade at the District’s water treatment facility. The 2014 Budget figures weredone via engineering estimates. The 2015 Budget, which projects both lower usage and price, is basedon several months of actual production.
Units Per Unit Units Per Unit Units Per Unit Dollars
Water Treatment (Ozone)
Ammonia 17,100 1.600 15,521 1.530 -9.2% -4.4% -$3,612
Caustic Soda 92,325 0.960 105,213 0.820 14.0% -14.6% -$2,357
Fluorine Compound 214,470 0.319 207,323 0.285 -3.3% -10.8% -$9,434
Liquid Oxygen 191,846 0.750 111,753 0.480 -41.7% -36.0% -$90,242
Sodium Hypochlorite 158,230 0.700 155,656 0.650 -1.6% -7.1% -$9,585
Zinc Orthophosphate 194,010 0.410 187,814 0.410 -3.2% 0.0% -$2,537
East End WWTF
Polymer 120,680 1.250 120,680 1.250 0.0% 0.0% $0
Sodium Bisulf ite 110,711 1.300 108,042 1.300 -2.4% 0.0% -$3,470
Sodium Hypochlorite 299,282 0.700 390,000 0.650 30.3% -7.1% $44,003
Westbrook WWTF
Polymer 20,610 1.350 23,651 1.350 14.8% 0.0% $4,109
Sodium Bisulf ite 12,000 2.070 12,253 2.300 2.1% 11.1% $3,341
Sodium Hypochlorite 40,000 0.700 41,520 0.650 3.8% -7.1% -$1,012

129 Operating Expenses
Operating Expense by Category (continued)
Contracted Services:2013
Actual
2014
Jan-Jun
2014
Budget
2015
Budget
Budget
Diff $
Budget
Diff %
662062 - PRINTER REPAIR $2,000 $4,000 $3,500 $3,500 $0 0.0%
662063 - COPIER MAINTENANCE/TONER 10,610 3,733 9,500 9,500 - 0.0%
6631 - ENGINEERING SERVICES 37,611 13,426 82,500 136,000 53,500 64.8%
6632 - ACCOUNTING SERVICES 31,838 31,250 31,250 32,500 1,250 4.0%
66331 - LEGAL - LABOR RELATIONS 96,115 8,698 45,000 55,000 10,000 22.2%
66333 - BOND COUNSEL - - 7,500 7,500 - 0.0%
66339 - LEGAL - OTHER 56,802 42,748 36,400 36,400 - 0.0%
663521 - TRAFFIC CONTROL 54,813 20,935 49,001 49,010 9 0.0%
6635221 - PAVING - MINOR REPAIR 271,858 69,525 350,692 314,387 (36,305) -10.4%
663523 - SIDEWALK 24,842 7,752 10,055 15,756 5,701 56.7%
663524 - STREET OPENING 73,693 21,319 41,803 53,151 11,348 27.1%
663525 - CONTRACTOR CONSTRUCTION 461,041 133,447 495,163 653,474 158,311 32.0%
66353 - REPAIR SERVICES 19,543 36,850 10,865 28,293 17,428 160.4%
66354 - MAINTENANCE SERVICES 534,160 263,203 634,915 733,529 98,614 15.5%
663542 - LARGE METER TESTING 7,596 1,473 38,000 25,000 (13,000) -34.2%
663543 - CSO FLOW MONITORING 131,371 26,164 180,574 180,775 201 0.1%
663544 - MAINT SERVICES - CCTV 47,183 59,537 78,948 65,250 (13,698) -17.4%
663545 - RADIO SERVICING AND EQUIP 1,583 3,281 5,000 5,000 - 0.0%
663546 - MAINTENANCE - SNOW REMOVL 8,435 1,740 77,093 78,000 907 1.2%
663547 - WASTE SLUDGE TRANSPORT - - - 21,462 21,462 n/a
663551 - LAB ANALYSIS 47,268 16,654 40,415 50,725 10,310 25.5%
663561 - COMPUTER LICENSES 77,323 50,715 82,010 80,631 (1,379) -1.7%
663562 - COMPUTER MAINTAINENCE 179,022 114,864 223,877 203,159 (20,718) -9.3%
663563 - COMPUTER CONSULTING/OTHER 30,447 12,969 40,300 33,300 (7,000) -17.4%
663572 - GRIT & SCREENS DISPOSAL 62,471 25,968 70,330 73,954 3,624 5.2%
663573 - GREASE DISPOSAL 26,760 12,763 39,700 35,200 (4,500) -11.3%
663574 - DISPOSAL SERVICES 46,369 21,523 47,185 48,956 1,771 3.8%
6635801 - EMPLOYEE HEALTH SERVICES 7,198 3,688 7,950 8,746 796 10.0%
663581 - UTILITY BILLING PRINTING 82,604 52,382 85,597 74,579 (11,018) -12.9%
663582 - PAYMENT PROCESSING 128,520 65,211 127,650 131,850 4,200 3.3%
663583 - RECEIVABLE COLLECTIONS 12,165 3,906 10,000 10,000 - 0.0%
663584 - BANK SERVICE CHARGES 11,951 6,031 12,000 12,000 - 0.0%
663585 - TREATMENT CONTRACT SERVIC 464,823 280,290 560,580 545,657 (14,923) -2.7%
6635851 - WW DEWATERING SERVICES 3,242 1,688 3,357 3,526 169 5.0%
6635852 - WW DEWATERING SRVS CREDIT (3,242) (1,688) (3,400) (3,400) - 0.0%
663587 - COURIER SERVICES 21,453 11,285 19,901 22,269 2,368 11.9%
663588 - EQUIPMENT MAINTENANCE 3,255 982 29,681 27,931 (1,750) -5.9%
663589 - SECURITY SERVICES 70,311 35,203 65,000 71,500 6,500 10.0%
663592 - RECRUITING SERVICES 3,631 1,963 7,250 7,250 - 0.0%
663594 - DIGSAFE 73,517 40,902 76,080 74,736 (1,344) -1.8%
663595 - OUTPLACEMENT SERVICES - - 2,000 2,000 - 0.0%
663598 - HR CONSULTANT SERVICES 675 - 2,000 2,000 - 0.0%
6635982 - TREE TRIMMING / REMOVAL - - 7,000 7,000 - 0.0%
6635984 - LANGUAGE INTERPRETATION - - 300 300 - 0.0%
663599 - MISC OTHER SERVICES 34,712 23,004 30,864 31,550 686 2.2%
6636 - TECHNICAL SERVICES 8,375 4,732 24,300 25,100 800 3.3%
3,266,940 1,534,116 3,799,691 4,084,006 284,315 7.5%

130 Operating Expenses
Operating Expense by Category (continued)
Contracted Services covers a large variety of services contracted to outside vendors, budget changes ofnote included:
Contractor Construction (663525) – This account increased $158,311 (32.0%), the increase wasdue to valve box work and other road related work such as raising manhole covers.
Treatment Contracted Services (663585) – The account on the whole is down $14,923 (2.7%),costs were reduced for both Cape Elizabeth and Cumberland which offset the addition ofPortland payments to Westbrook which were not in the previous budget.
Maintenance Services (66354) – This account was up $98,614 (15.5%) due in large part to thenew addition to the budget of $59,500 for annual maintenance of the new UV equipment at thewater treatment plant.
Waste Sludge Transport (663547) – This expense ($21,462) involves the hauling of waste fromthe Cape Elizabeth and Peaks Island WWTF’s to the East End WWTF for further treatment anddisposal. This process was outsourced starting with the 2015 Budget.
Engineering Services – WW customers for engineering services for small projects that theinternal staff can’t support.
0
100
200
300
400
500
2009 2010 2011 2012 2013 2014 2015
Treatment Contract Services($,000)
South Portland Falmouth
Deferred Cost Write-Off:
2013
Actual
2014
Jan-Jun
2014
Budget
2015
Budget
Budget
Diff $
Budget
Diff %
66754 - DEFERRED COST WRITE OFF $38,156 $10,944 $21,888 $29,488 $7,600 34.7%
$38,156 $10,944 $21,888 $29,488 $7,600 34.7%
The Deferred Cost Write-Off contains the annual amortization of studies or other items that have multi-year impacts. The increase in 2015 is related to new costs for the Westbrook Combined Storm Overflow(CSO) study.
South Portland and Falmouth treatsthe wastewater flows from CapeElizabeth and Cumberland,respectively. The District is assessedand pays an annual fee to thosecommunities for that service.Portland (not shown of the graph)also pays Westbrook for flows fromthe Riverside area; this was includedfor the first time in the 2015 Budget.

131 Operating Expenses
Operating Expense by Category (continued)
Heat/Fuel Oil:
2013
Actual
2014
Jan-Jun
2014
Budget
2015
Budget
Budget
Diff $
Budget
Diff %
66161 - HEATING OIL $276,258 $188,767 $294,933 $294,115 ($818) -0.3%
661621 - PIPELINE DELIVERED PROPAN 120,386 89,293 143,050 130,158 (12,892) -9.0%
661622 - CONTAINER DELIVERED 42,356 28,016 52,325 50,885 (1,440) -2.8%
66166 - UNLEADED GAS 17,821 10,499 24,700 23,900 (800) -3.2%
66167 - KEROSENE GAS 21 - - - - n/a
$456,842 $316,575 $515,008 $499,058 ($15,950) -3.1%
The first three accounts in this category (66161 to 661622) involve fuel used for facilities’ heat or backupgenerators. The Unleaded Gas (66166) is for District vehicles that fuel up at remote locations and theboat used in the District’s Sebago Lake monitoring efforts.
% Change
Units Per Unit Units Per Unit Units Per Unit
Heating Oil:
Douglass Street 38,000 $3.30 38,000 $3.06 0.0% -7.3%
Water Treatment/Ozone Plant 36,669 $3.27 40,617 $3.16 10.8% -3.4%
Westbrook WWTF 6,700 $3.20 7,060 $3.10 5.4% -3.1%
Cape Elizabeth WWTF 4,020 $3.20 3,929 $3.10 -2.3% -3.1%
Peaks Island WWTF 2,000 $5.00 2,000 $5.00 0.0% 0.0%
Dana Court WWPS (Westbrook) 1,027 $3.30 1,027 $3.10 0.0% -6.1%
Water - Throttling Valve Building 786 $3.265 707 $3.329 -10.1% 1.9%
89,202 $3.31 93,340 $3.15 4.6% -4.9%
Natural Gas:
Portland (East End) WWTF 11,884 $11.78 11,878 $10.67 -0.1% -9.5%
2014 Assumption 2015 Assumption
Insurance:
2013
Actual
2014
Jan-Jun
2014
Budget
2015
Budget
Budget
Diff $
Budget
Diff %
6656 - VEHICAL INSURANCE $29,261 $14,045 $28,091 $30,057 $1,966 7.0%
66561 - VEHICAL INSURANCE REIMBUR (1,357) 541 - - - n/a
6657 - GEN LIABILITY INSURANCE 52,202 23,044 46,088 49,314 3,226 7.0%
66591 - DAMAGES AND CLAIMS - - 958 - (958) -100.0%
66592 - DAMAGES & CLAIMS-GOODWILL 7,247 - 2,000 4,000 2,000 100.0%
66593 - UMBRELLA INSURANCE COVER 12,059 5,437 10,875 11,636 761 7.0%
66594 - PROFESSION/CRIME BONDING 18,278 10,128 19,319 20,670 1,351 7.0%
66599 - PROPERTY & BOILER INSUR 68,622 36,859 81,405 88,883 7,478 9.2%
$186,312 $90,054 $188,736 $204,560 $15,824 8.4%
Insurance costs include premiums paid on coverage for District property as well as small claims paiddirectly to outside parties. Much of the increase is due to increased insured value at the District’s WaterTreatment Facility for the recent upgrade.

132 Operating Expenses
Operating Expense by Category (continued)
Materials & Supplies:
2013
Actual
2014
Jan-Jun
2014
Budget
2015
Budget
Budget
Diff $
Budget
Diff %
6619 - ASSET PURCHASES $161,303 $64,286 $144,299 $169,301 $25,002 17.3%
66201 - BULK MATERIALS - 590 - - - n/a
662012 - CRUSHED GRAVEL 288 340 845 620 (225) -26.6%
662014 - CRUSHED STONE 173 - - - - n/a
662015 - LOAM 161 84 - - - n/a
662016 - SAND 2,742 5,209 - 857 857 n/a
662017 - SAND AND SALT 6,292 - 5,187 9,043 3,856 74.3%
662018 - BANKRUN GRAVEL 60 - - - - n/a
66202 - TOOLS 38,818 14,234 44,765 48,149 3,384 7.6%
66203 - VENDOR PURCHASED SUPPLIES 387,056 223,536 472,680 451,597 (21,083) -4.5%
662041 - MATERIALS INVENTORY 251,060 154,490 177,078 204,039 26,961 15.2%
662042 - SUPPLIES INVENTORY 87,832 42,169 67,050 64,538 (2,512) -3.7%
662042 - TOOL INVENTORY 72 474 300 500 200 66.7%
66204201 - INVENTORY - QPR 9,142 1,837 18,435 8,237 (10,198) -55.3%
66204202 - INVENTORY - BNKRUN GRAVEL 1,840 (809) 7,137 6,362 (775) -10.9%
66204203 - INVENTORY - CRUSHD GRAVEL 35,381 14,094 28,055 23,586 (4,469) -15.9%
66204204 - INVENTORY - CRUSHED STONE 1,532 755 538 656 118 21.9%
66204205 - INVENTORY - LOAM 2,535 328 2,076 2,510 434 20.9%
662043 - TOOL INVENTORY 78,630 43,372 68,972 65,648 (3,324) -4.8%
66204301 - INVENTORY - TONER 10,716 5,856 12,589 11,962 (627) -5.0%
66204302 - INVENTORY - PAPER 3,423 1,546 6,000 5,850 (150) -2.5%
66204303 - INVENTORY-COMPUTER EQUIP 13,524 10,520 7,671 18,288 10,617 138.4%
662044 - METER INVENTORY 19,617 150,178 1,217 - (1,217) -100.0%
662045 - TRUCK INVENTORY (5,315) - - - - n/a
662046 - HYDRANT INVENTORY 63,438 35,611 47,060 47,015 (45) -0.1%
662047 - GARAGE INVENTORY 11,624 6,162 13,558 13,717 159 1.2%
66204701 - INVENTORY - UNLEADED GAS 163,553 81,564 168,720 187,530 18,810 11.1%
66204702 - INVENTORY - DIESEL 87,820 41,261 92,510 91,513 11,890 12.9%
66204703 - INVENTORY - TIRES 20,598 6,914 15,000 15,000 - 0.0%
66205 - CONSUMABLE SUPPLIES 83,003 42,964 104,412 101,682 (2,730) -2.6%
66206 - COMPUTER EQUIPMENT - - - 49,752 49,752 n/a
663564 - COMPUTER-RELATED EQUIP 50,931 24,686 80,011 14,000 (66,011) -82.5%
1,587,849 972,251 1,586,165 1,611,952 25,787 1.6%
This group is a wide array of items including vehicle fuel and parts, bulk materials such as gravel, waterinfrastructure items (mains, meters, hydrants, and fittings) and office supplies. These items areconsumed during normal operations and are used for the repair and maintenance of District assets.
The assumptions for vehicle fuel were:
% ChangeFuel Type Units Per Unit Units Per Unit Units Per Unit
Diesel 29,000 $3.19 29,000 $3.16 0.0% -1.1%
Unleaded Gas 57,000 $2.96 57,000 $3.29 0.0% 11.1%
86,000 86,000 0.0%
2014 Assumption 2015 Assumption

133 Operating Expenses
Operating Expense by Category (continued)
Other Expense:
2013
Actual
2014
Jan-Jun
2014
Budget
2015
Budget
Budget
Diff $
Budget
Diff %
663541 - SAFETY EXPENSES $0 -$ $2,500 $2,500 -$ 0.0%
6641 - BUILDING/REAL PROP RENT 5,600 - 5,600 5,600 - 0.0%
66411 - INTERNAL RENTAL CHARGES 48,600 24,300 48,600 48,600 - 0.0%
6642 - EQUIPMENT RENT 11,118 4,579 9,849 10,271 422 4.3%
66601 - PUBLIC RELATIONS 7,451 4,066 5,500 7,100 1,600 29.1%
66609 - OTHER ADVERTISING 12,951 9,069 47,076 45,176 (1,900) -4.0%
6670 - BAD DEBT EXPENSE 42,800 20,400 40,800 40,800 - 0.0%
6675111 - INSTATE TRAINING 60,809 43,093 69,710 69,772 62 0.1%
6675112 - OUT OF STATE TRAINING 23,715 276 15,700 20,900 5,200 33.1%
6675121 - IN STATE CONFERENCES 7,206 2,757 14,300 13,550 (750) -5.2%
6675122 - OUT-OF-STATE CONFERENCES 44,749 19,018 38,150 35,350 (2,800) -7.3%
667513 - DUES 48,499 25,873 67,970 78,971 11,001 16.2%
667514 - PROFESSIONAL LICENSES 22,655 3,431 14,363 12,672 (1,691) -11.7%
667515 - PERIODICAL SUBSCRIPTIONS 5,222 2,640 5,951 6,970 1,019 17.1%
667516 - PERMITS 26,976 6,773 29,212 29,312 100 0.3%
667517 - PLANT OPER LICENSE FEES 63 - 450 525 75 16.7%
667518 - REGULATORY REQUIRED FEES 11,540 - 14,000 14,000 - 0.0%
667519 - REGULATORY FINES 6,350 - - - - n/a
667521 - POSTAGE - THIRD PARTY 202,144 115,454 212,275 221,438 9,163 4.3%
667522 - POSTAGE - INTERNAL 17,948 7,173 19,163 19,441 278 1.5%
667523 - POSTAGE - EXPRESS DELIVER 1,814 690 1,050 1,878 828 78.9%
667531 - PRINTING COSTS 45,728 30,260 55,717 58,783 3,066 5.5%
667533 - FORMS STOCK 704 626 600 650 50 8.3%
667552 - SAFETY TRAINING 3,464 1,604 4,285 4,600 315 7.4%
667553 - DOT SUBSTANCE ABUSE 1,320 609 2,000 2,000 - 0.0%
667554 - EPA / OSHA COMPLIANCE 320 500 3,408 3,408 - 0.0%
667555 - SAFETY EXPENSES 6,136 2,301 15,200 16,190 990 6.5%
667556 - FREIGHT CHARGES (STOCK) 8,226 3,517 5,000 5,100 100 2.0%
667561 - WATERSHED GRANTS/SUPPORT 102,010 58,052 41,450 42,000 550 1.3%
6675611 - GRANTS - PASS-THROUGH 22,391 - - - - n/a
667581 - ANNUAL LAND CONTRIB CAPE 2,500 2,500 2,500 2,500 - 0.0%
667591 - UNIFORMS 3,158 1,081 2,750 2,750 - 0.0%
667592 - FOOD SUPPLIES 3,580 1,460 7,245 6,645 (600) -8.3%
667598 - GEN MANAGER CONTINGENCY - - 35,000 70,000 35,000 100.0%
6675981 - GEN MNG - TRUSTEES 7,676 5,796 11,700 11,000 (700) -6.0%
6675982 - GEN MNG - COMMUNITY 25,338 4,720 25,365 25,115 (250) -1.0%
667599 - OTHER MISCELLANEOUS 47,548 4,230 6,650 6,500 (150) -2.3%
6676 - CONTRA ACCOUNT (160,769) (73,470) (142,940) (152,800) (9,860) 6.9%
6706 - AMORT OF U P ACQ ADJUSTS 17,000 8,500 17,000 17,000 - 0.0%
744,540 341,878 755,149 806,267 51,118 6.8%
Other expenses include postage ($242,488), training and conferences ($139,572) and dues ($78,971)costs. The Contra Account (6676) contains expenses transferred to other departments or capitalprojects. General Manager Contingency increased to cover costs related to water deregulationimplementation.

134 Operating Expenses
Operating Expense by Category (continued)
Purchased Power:
2013
Actual
2014
Jan-Jun
2014
Budget
2015
Budget
Budget
Diff $
Budget
Diff %
66151 - POWER - LARGE ENERGY $824,996 $275,703 $740,689 $782,660 $41,971 5.7%
66152 - POWER - LARGE T&D 431,501 225,918 452,116 382,721 (69,395) -15.3%
66153 - POWER - MEDIUM ENERGY 335,198 167,586 331,523 326,226 (5,297) -1.6%
66154 - POWER - MEDIUM T&D 192,181 104,841 213,601 194,043 (19,558) -9.2%
66155 - POWER - SMALL ENERGY 46,079 29,537 47,915 62,557 14,642 30.6%
66156 - POWER - SMALL T&D 57,588 35,738 58,449 57,445 (1,004) -1.7%
66157 - FORWARD CAPACITY 353 - - - - n/a
66158 - LOAD RESPONSE (8,266) (3,267) (15,000) (15,000) - 0.0%
$1,879,630 $836,056 $1,829,293 $1,790,652 ($38,641) -2.1%
Electricity is purchased through Maine Power Option, an energy aggregation organization. The Districthas contracts running through 11/01/16 for the purchase of electricity on our medium accounts, EastEnd and India Street and through 12/01/16 for the Ozone Plant. Currently, the District is receiving thePUC determined standard offer rate for small accounts.
Large Accounts (3):Bud Rate Changes 2015 Budget
Facility Name (Function) Energy Rates Energy Rate
Ozone Plant (Water Treatment) 16.7% 6.77
East End (WW Treatment/Pumping) 0.0% 6.09
India Street (WW Pumping) 0.0% 6.09
Medium Accounts (19): Small Accounts (88):
Energy Rates: 6.61 cents per kwh, same as 2014Budget.
8.20 cents per kwh, 23.1%increase from 2014 Budget.
There are several components that make up the overall T&D rate. In 2014, Central Maine Powermodified their rates. Decreases in delivery charges were offset by increases in the fixed service charges.
Usage assumptions are made taking into consideration historical averages for kwh usage with someweight given to changes in operational procedures and kwh demand goals. It is anticipated that theOzone Plant will see a significant decrease in power usage resulting from changing the ozone productionprocess.
Forward capacity charges are assessed by the New England ISO to provide financial incentives toconstruct additional electricity capacity in New England. The charges are either embedded in the baseelectricity rate or separately billed and is based on facility’s electricity demand on peak day. Because theelectricity demand can be managed by going off-line and using generators on the New England annualelectricity peak day, the Ozone plant pays the fee separately and has a lower base electricity rate. Sincethe Ozone plant was able to go completely off-line on the peak day, it is anticipated the forward capacitycharge will be zero in 2015. Additionally, the Ozone Plant and East End Plants participate in a loadresponse program that provides financial incentive to reduce power usage on days when the NewEngland electricity market nears its peak.

135 Operating Expenses
Operating Expense by Category (continued)
Regulatory/Taxes:
2013
Actual
2014
Jan-Jun
2014
Budget
2015
Budget
Budget
Diff $
Budget
Diff %
670821 - STANDISH REAL ESTATE TAX $56,347 $29,173 $55,700 $58,570 $2,870 5.2%
670822 - OTHER R/E TAX(NON-STANDI) 7,889 5,090 7,021 7,170 149 2.1%
670823 - PUC ASSESSMENT 79,957 40,000 80,000 80,000 - 0.0%
670824 - ME DRINKING WTR PROGRAM 61,793 30,933 61,796 61,796 - 0.0%
670825 - PUC PUBLIC ADVOCATE 15,715 10,782 16,500 19,050 2,550 15.5%
$221,701 $115,978 $221,017 $226,586 $5,569 2.5%
The District pays real estate taxes (670821) and personal property taxes (670822) to the Town ofStandish for land and other property in the town. Annual assessments are also paid by the District tothe Maine Public Utility Commission (PUC) and the Maine Drinking Water Program. The PUC fee isbased on each utilities revenues and time spent on matters related to each industry sector.
Telephone/Other Utilities:
2013
Actual
2014
Jan-Jun
2014
Budget
2015
Budget
Budget
Diff $
Budget
Diff %
66101 - WATER $121,169 $60,058 $155,936 $143,740 ($12,196) -7.8%
66102 - WASTEWATER 18,752 13,058 8,211 16,400 8,189 99.7%
66111 - TELEPHONE LINES 24,212 12,876 30,280 26,369 (3,911) -12.9%
66112 - DATA LINES 65,603 31,309 77,461 88,606 11,145 14.4%
66113 - CELLULAR PHONES 37,425 24,244 39,454 40,075 621 1.6%
66114 - PAGERS 2,537 2,328 2,315 2,239 (76) -3.4%
$269,698 $143,873 $313,657 $317,429 $3,772 1.2%
The budgets changes in the communications related line items (Telephone, Data and Cellular) wereadjusted due to reclassification of costs to different accounts, changes in operational needs and actualcosts incurred. Wastewater costs rose due to the outsourcing of disposal services, those increases wereoffset by reductions in internal labor and transportation.
Transportation:
2013
Actual
2014
Jan-Jun
2014
Budget
2015
Budget
Budget
Diff $
Budget
Diff %
66501 - TRANSPORTATION - INTERNAL $1,020,583 $353,471 $747,401 $745,594 ($1,807) -0.2%
665019 - TRANS INTERNAL INACTIVE - 166,076 434,027 452,734 18,707 4.3%
66502 - TRANSPORTATION - EXTERNAL 92,763 25,473 59,382 74,424 15,042 25.3%
66503 - MILEAGE REIMBURSEMENT 17,570 8,909 24,125 24,487 362 1.5%
66504 - MTA TRANS-PASS TOLL FEES 23 - - - - n/a
$1,130,939 $553,929 $1,264,935 $1,297,239 $32,304 2.6%
A standard 40 hour week is charged for most vehicles, when the vehicle is in used it is charged toTransportation Internal (66501) and the balance to the Inactive (665019) account. TransportationExternal (66502) involves vehicles rented from outside vendors. Mileage Reimbursement (66503) is paidto employees who use their own vehicles when conducting District business.

136 Operating Expenses – Water Services
Water Services
Hydrant Flushing
In an effort to improve the water quality in thedistribution system, the District performs multi-directional flushing to remove any sediment thatdeposits on the bottom of these mains. Thissediment can cause a reduction in the area’schlorine residual and increase customer’s waterquality inquiries. The program’s resources hadbeen stretched thin over the past few years, withthe amount of the system flushed falling to 9%during 2009. A renewed emphasis was placed onthe program with the goal of flushing the entiresystem over a 3-year cycle, and staff met thatgoal over the 2012, 2013, and 2014 years.
PWD Flushing Program Overview
Corporate Goal to Flush 1/3 of the system each year. Mains Less than 16” In Diameter Roughly 850 Miles of Main < 16” – Approximately 283 Miles Per Year Start in late March, Weather Permitting. During May and into October Two
Crews Work 4-10 Hr. Days 8 PM- 6 AM Mon-Thur. Ended this Year in Late September – Sometimes Go into October Depending on
Productivity
2012Actual
2013Actual
2014Projected
2015Goal
% ofDistributionSystem Flushed
33% 33% 37% 33%

137 Operating Expenses – Water Services
Water Services – Purpose Statement
To operate and maintain water system infrastructure including the treatment, water storage anddistribution systems.
Core Services
Water Operations is responsible for operating and maintaining the Sebago Lake and Steep Falls Welltreatment and water distribution systems by providing the following services:
Operation and maintenance of distribution system including emergency response, contractorinspection (Transmission/Distribution Group – A2; red in the organization chart).
Operation and maintenance of the pumping, treatment, storage and chemical addition facilities(Treatment Group- A3; orange in organization chart).
Field support services including customer meter and water quality inquiries, back-flowinspection, system flushing, hydrant inspection and contractor inspection (Utility Services Group– A6; blue in the organization chart).
Water Operations has a five-person group (Administration Group- A1; green in organization chart) thatdirects, oversees and provides administrative support.
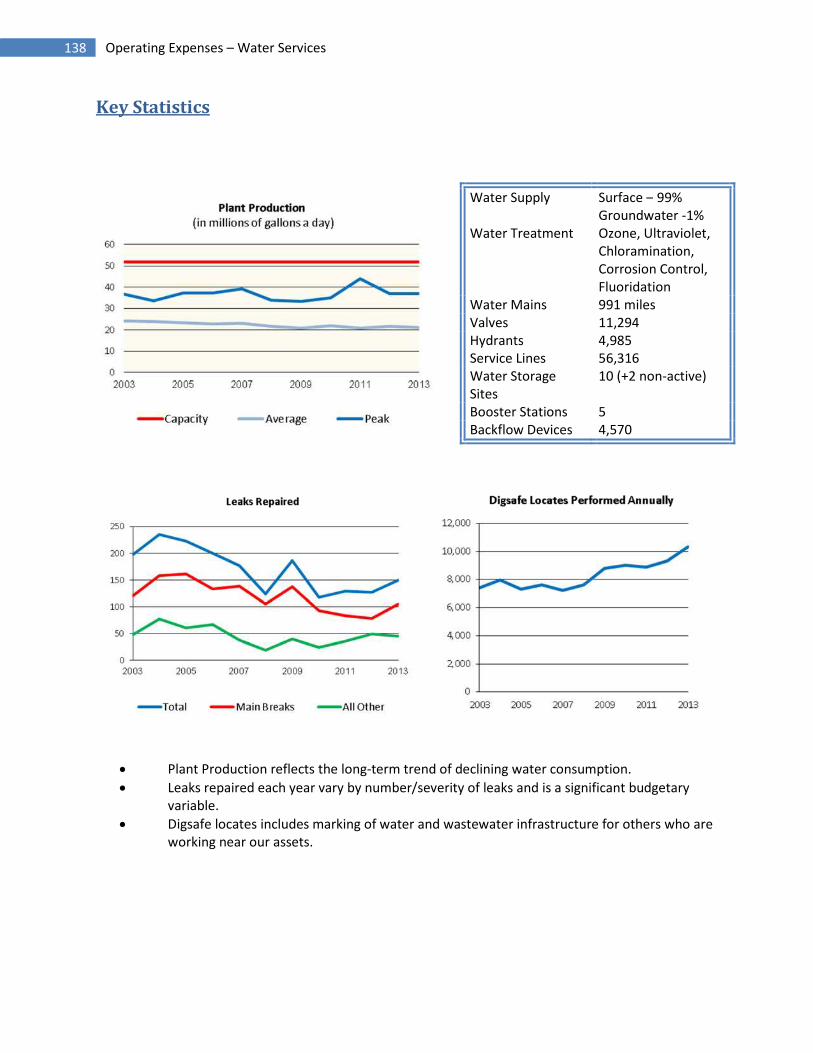
138 Operating Expenses – Water Services
Key Statistics
Plant Production reflects the long-term trend of declining water consumption.
Leaks repaired each year vary by number/severity of leaks and is a significant budgetaryvariable.
Digsafe locates includes marking of water and wastewater infrastructure for others who areworking near our assets.
Water Supply Surface – 99%Groundwater -1%
Water Treatment Ozone, Ultraviolet,Chloramination,Corrosion Control,Fluoridation
Water Mains 991 milesValves 11,294Hydrants 4,985Service Lines 56,316Water StorageSites
10 (+2 non-active)
Booster Stations 5Backflow Devices 4,570

139 Operating Expenses – Water Services
Performance Benchmarks
2013 Actual 2014 Budget 2015 BudgetCorporate Goal – Public HealthCompliance of Water Regulations 100% 100% 100%Avg. Distribution ChlorineResidual
1.3 mg/l 1.0 mg/l 1.0 mg/l
Avg. Distribution pH 7.4 SU 7.5 SU 7.4 SU
Corporate Goal – Public SafetyMeeting with Municipal FireChiefs
2 2 2
Corporate Goal – ReliabilityWater Outage Index 9.7 < 20 < 20Fire Service Outage Index 3.0 days 3 days 3 daysLeaks per 100 miles of main 10.9 < 25 < 25Transmission valves exercised 396 418 418Distribution valves exercised 87 150 150Customer Appointments On-time 99.6% 99.8% 99.8%
Corporate Goal – AffordabilityWater Facility Maintenance Ratio 70% / 30% 75% / 25% 75% / 25%Water Production million gallons 7,837 7,878 7,837Department Cost / million gal $932 $978 $1022Treatment Cost / million gal $279 $295 $303Unaccounted for Water % 10.2% < 10% < 10%
Corporate Goal – Employees andWork EnvironmentEmployee Training Hours 129 80 80
New Wedeco UV Treatment Reactor
140 Operating Expenses – Water Services
Past Accomplishments
Water Field
Completed our seventh-year of the Water System Operator apprentice program to expose newemployees to all water departments. To date, seven of the program’s participants have beenpromoted into higher skilled positions
Contracted out nearly 100% of paving preparation work, thus eliminating one of the morephysically demanding and potentially injury causing tasks
Continued management of the Transmission Main Right-of-Way (ROW) Maintenance Program;in the past 4 years our contractor has cleared approximately 9 miles of ROW and mowedselected areas that were cleared.
Participated in the AWWA Partnership for Safe Water for Distribution Systems for the secondyear. Our participation involves reporting of data for disinfectant residual, system pressure, andmain breaks to the Partnership for comparison with other utilities nationwide
Water Plant
Continued compliance with all Surface Water Treatment Rules
Successfully completed the annual Maine Drinking Water Program Audit of PWD TreatmentFacilities for the 20th straight year
Managing the ratio of Preventative to Corrective work at the Treatment Facility; the average ofpreventative maintenance for the past 7 years is 85% of the total maintenance hours, whilecorrective maintenance is 15% of the hours
Recipient of Water Fluoridation Quality Awards for Greater Portland and Steep Falls systems for2009, 2010, 2011, 2012, and 2013.
Improved the water quality in the distribution system by closely managing chemical dosages ,thus raising the yearly average chlorine residual to 1.3 mg/l and maintaining a median pH of 7.4
Supported MWUA Education & Operation Committee through participation in regular meetingsand by delivering presentations at training sessions across the state

141 Operating Expenses – Water Services
Projects and Initiatives
Corporate Goal – Public Health
Corporate Initiativeo Expand the Cross Connection Control Program to require the installation of backflow
protection devices during new construction of residential buildings
Departmental Initiativeso Complete monitoring for Unintended Impacts of New Treatment Processes
Corporate Goal – Public Safety
Departmental Initiativeo Review the past 3-years of effort on the Public Hydrant Inspection Program and update
procedures as necessary.
Corporate Goal – Reliability
Corporate Initiativeo Prepare to increase participation from Phase II to Phase III of the AWWA Partnership for
Safe Water for the Distribution System; Draft narratives by December 2015 for submittalin June 2016.
o Continue to reorganize Water Field staffing and priorities to support the increase inwater main renewal
Departmental Initiativeso Review liquid chemical addition Systems at SLWTF and update Capital Improvement
Planso Continue to Right-of-way Maintenance Program; clear another couple miles of ROW and
perform mowing to keep previously cleared areas open; make plans to repair significantdeficiencies when discovered
o Complete rehabilitation of SLWTF throttling-valves and upgrade of the valve operatorso Prioritize and replace 1-2 transmission valveso Continue efforts to understand the impact of hot soils in areas where there are leaks on
ductile iron mains
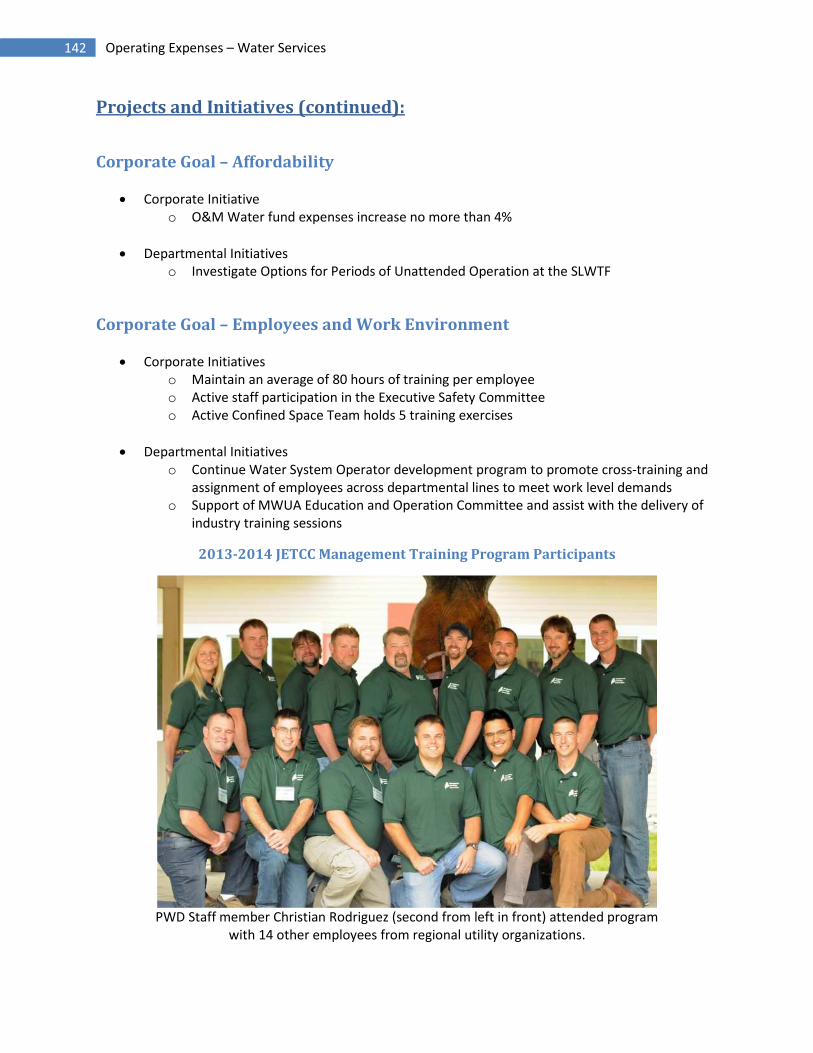
142 Operating Expenses – Water Services
Projects and Initiatives (continued):
Corporate Goal – Affordability
Corporate Initiativeo O&M Water fund expenses increase no more than 4%
Departmental Initiativeso Investigate Options for Periods of Unattended Operation at the SLWTF
Corporate Goal – Employees and Work Environment
Corporate Initiativeso Maintain an average of 80 hours of training per employeeo Active staff participation in the Executive Safety Committeeo Active Confined Space Team holds 5 training exercises
Departmental Initiativeso Continue Water System Operator development program to promote cross-training and
assignment of employees across departmental lines to meet work level demandso Support of MWUA Education and Operation Committee and assist with the delivery of
industry training sessions
2013-2014 JETCC Management Training Program Participants
PWD Staff member Christian Rodriguez (second from left in front) attended programwith 14 other employees from regional utility organizations.

143 Operating Expenses – Water Services
Financial Overview
The Water Services Budget for 2015 has increased by 4% or $304,613. The significant changes areoccurring in wages & benefits, chemicals, contracted services and transportation lines.
The A1- Water Administration area increased 3.2%, with labor and benefits accounting for all of the$14,877 increases, with decreases in cell phone, utilities and materials slightly off-setting the overalltotal.
At $184,564, A2 - Water Transmission and Distribution is increasing by 5.2%. The most significantchanges to the 2015 budget are in Contracted Services ($169,046) and Transportation ($44,529). TheContracted Services increase is to fully fund the adjustment of valve box adjustments for paving, and foran anticipated 8% increase in the cost of paving. The increases in transportation are related to updatesin the internal accounting for vehicles and the charging for idle time.
The A3 – Treatment area has an overall increase of 2.2% or $51,345. The amount of liquid oxygen usedby the ozone system is 42% less than expected and the projected price is 30% less than last year,resulting in an overall decrease of $90,242. The other bulk chemicals uses are expected to remainconsistent; however all of the prices are projected to decrease, resulting in a total decrease of $28,002.The increases in both contracted services ($57,110) and Materials and Supplies ($24,375) are largelyrelated to the new treatment equipment. Staff intends to engage the original vendors to perform thefirst year’s maintenance on the UV, LOX, and Ozone systems. A decision will then be made on whetherstaff or the vendor is better suited to perform this maintenance in the future. Power is projected toincrease ($20,673) and a new high-speed internet connection ($11,340) was run into the treatmentfacility to improve performance of the network for all staff stationed at the lake.
Finally, the A6 – Utility Services area has an increase of 3.8% or $53,827. Labor is increasing for thesecond year, as another position is being transferred to this group from the Transmission andDistribution area to support increased inspection for main renewal. Maintenance services and materialsare decreasing as meter changes are being moved to capital funds and staff adjusts budgeting to matchactual expenditures.
New High EfficiencyOzonia
Ozone Generator

144 Operating Expenses – Water Services
Water Services: Total
Financial Summary:
2013
Actual
2014
Jan-Jun
2014
Budget
2015
Budget Budget Diff $
Budget
Diff %
Sub-Groups:
A1 - Water Administration $456,781 $228,305 $457,831 $472,708 $14,877 3.2%
A2 - Wtr Transmission/Distrib 3,324,437 1,571,484 3,519,940 3,704,504 184,564 5.2%
A3 - Water Treatment 2,160,076 1,036,233 2,322,629 2,373,974 51,345 2.2%
A6 - Water Utility Services 1,275,252 807,287 1,403,798 1,457,625 53,827 3.8%
Grand Total 7,216,546 3,643,309 7,704,198 8,008,811 304,613 4.0%
Expense Types:
Salaries & Wages 2,734,911 1,403,550 2,849,808 2,884,003 34,195 1.2%
Employee Benefits 1,210,526 640,373 1,286,165 1,355,046 68,881 5.4%
Chemicals 345,958 147,089 520,884 402,640 (118,244) -22.7%
Contracted Services 968,368 351,208 1,204,604 1,415,760 211,156 17.5%
Heat/Fuel Oil 130,812 86,697 136,446 144,731 8,285 6.1%
Insurance 20,158 10,537 32,664 34,113 1,449 4.4%
Materials & Supplies 559,205 445,894 473,890 486,980 13,090 2.8%
Other Expense 20,018 12,773 33,123 39,650 6,527 19.7%
Purchased Power 451,223 175,552 399,202 419,875 20,673 5.2%
Tele/Other Utilties 46,016 28,586 43,145 59,242 16,097 37.3%
Transportation 729,350 341,050 724,267 766,771 42,504 5.9%
Grand Total 7,216,545 3,643,309 7,704,198 8,008,811 304,613 4.0%
Full-Time 53 53 53 53 0 0.0%
Part- Time 0 0 0 0 0 n/a
Total 53 53 53 53 0 0.0%
New Liquid OxygenStorage System

145 Operating Expenses – Water Services
2013
Actual
2014
Jan-Jun
2014
Budget
2015
Budget
Budget
Diff $
Budget
Diff %
Salaries & Wages
660111 - SALARIES/WAGES NON-UNION $453,068 $228,980 $459,555 $474,525 $14,970 3.3%
660121 - WAGES/REGULAR UNION 1,835,704 937,506 1,916,668 1,960,292 43,624 2.3%
660122 - WAGES/OVERTIME UNION 222,619 141,868 238,061 218,148 (19,913) -8.4%
660123 - WAGES/DOUBLETIME UNION 21,752 20,938 22,790 22,391 (399) -1.8%
660124 - WAGES/STANDBY TIME UNION 98,114 48,020 86,933 88,684 1,751 2.0%
660131 - WAGES - REGULAR - TEMPS 25,829 10,343 40,092 40,091 (1) 0.0%
660132 - WAGES - OVERTIME- TEMPS 155 71 - - - n/a
660136 - CONTRACTED - TEMPS - - - 79,872 79,872 n/a
66014 - VACATION ACCRUAL 5,461 - - - - n/a
66015 - SICKTIME ACCRUAL 14,877 - - - - n/a
66351 - CONTRACTED TEMPORARIES 57,332 15,824 85,709 - (85,709) -100.0%
Salaries & Wages Total 2,734,911 1,403,550 2,849,808 2,884,003 34,195 1.2%
Employee Benefits
660401 - FICA - EMPLOYERS' SHARE 196,935 102,788 211,454 214,516 3,062 1.4%
660405 - SAFETY/WHY PROGRAM ITEMS 10,752 2,627 10,616 11,047 431 4.1%
660407 - EDUCATION SUBSIDY - 331 - - - n/a
660411 - MEALS ALLOWANCE 5,788 4,380 1,468 5,698 4,230 288.1%
660413 - PWD TRAINING PROGRAM 110 - - - - n/a
660418 - STIPENDS 4,400 4,900 4,732 4,500 (232) -4.9%
660419 - EMPLOYEE BENEFTS-MISC OTH 7,542 232 - - - n/a
660491 - FRINGE BENEFITS-REG/SAL 984,999 525,115 1,057,895 1,119,285 61,390 5.8%
Employee Benefits Total 1,210,526 640,373 1,286,165 1,355,046 68,881 5.4%
Chemicals
66181 - AMMONIA 26,415 14,473 27,360 23,748 (3,612) -13.2%
66182 - CAUSTIC SODA 78,513 31,453 88,771 86,394 (2,377) -2.7%
66183 - FLUORINE COMPOUND 69,267 19,894 69,018 59,265 (9,753) -14.1%
66184 - ZINC ORTHOPHOSPHATE 70,220 19,800 79,541 77,004 (2,537) -3.2%
66185 - SODIUM HYPOCHLORITE 101,320 43,586 112,310 102,587 (9,723) -8.7%
661892 - LIQUID OXYGEN (LOX) - 17,883 143,884 53,642 (90,242) -62.7%
661899 - OTHER CHEMICALS 223 - - - - n/a
Chemicals Total 345,958 147,089 520,884 402,640 (118,244) -22.7%
Contracted Services
6631 - ENGINEERING SERVICES 6,432 - - 50,000 50,000 n/a
66352 - CONSTRUCTION SERVICES 1,576 - 679 65 (614) -90.4%
663521 - TRAFFIC CONTROL 54,363 20,935 48,701 48,710 9 0.0%
6635221 - PAVING - MINOR REPAIR 271,432 69,525 350,692 314,387 (36,305) -10.4%
663523 - SIDEWALK 24,842 7,751 10,055 15,756 5,701 56.7%
663524 - STREET OPENING 73,693 21,125 41,803 53,151 11,348 27.1%
663525 - CONTRACTOR CONSTRUCTION 346,432 129,499 468,163 622,974 154,811 33.1%
663526 - INSPECTION SERVICES - 555 - - - n/a
663527 - EMERGENCY RESPONSE- FEMA - - - 300 300 n/a
66353 - REPAIR SERVICES 11,111 30,462 1,865 9,893 8,028 430.5%
66354 - MAINTENANCE SERVICES 130,849 48,542 131,030 177,883 46,853 35.8%
663542 - LARGE METER TESTING 7,596 1,473 38,000 25,000 (13,000) -34.2%
663546 - MAINTENANCE - SNOW REMOVL - - 49,593 43,200 (6,393) -12.9%
663561 - COMPUTER LICENSES 14,962 9,287 15,949 16,388 439 2.8%
663574 - DISPOSAL SERVICES 7,786 7,193 7,696 7,738 42 0.5%
663587 - COURIER SERVICES 2,244 1,124 2,196 2,133 (63) -2.9%
663588 - EQUIPMENT MAINTENANCE 3,246 858 23,182 21,182 (2,000) -8.6%
663589 - SECURITY SERVICES 3,245 - - - - n/a
663594 - DIGSAFE 2,000 250 - - - n/a
6635982 - TREE TRIMMING / REMOVAL - - 7,000 7,000 - 0.0%
663599 - MISC OTHER SERVICES 6,559 2,629 8,000 - (8,000) -100.0%
Contracted Services Total 968,368 351,208 1,204,604 1,415,760 211,156 17.5%

146 Operating Expenses – Water Services
2013
Actual
2014 Jan-
Jun
2014
Budget
2015
Budget
Budget
Diff $
Budget
Diff %
Heat/Fuel Oil
66161 - HEATING OIL $117,226 $71,812 $121,840 $130,523 $8,683 7.1%
661622 - CONTAINER DELIVERED 13,586 14,845 14,606 14,208 (398) -2.7%
66166 - UNLEADED GAS - 40 - - - n/a
Heat/Fuel Oil Total 130,812 86,697 136,446 144,731 8,285 6.1%
Insurance
66591 - DAMAGES AND CLAIMS - - 958 - (958) -100.0%
66599 - PROPERTY & BOILER INSUR 20,158 10,537 31,706 34,113 2,407 7.6%
Insurance Total 20,158 10,537 32,664 34,113 1,449 4.4%
Materials & Supplies
6619 - ASSET PURCHASES 48,637 9,312 19,796 30,501 10,705 54.1%
66201 - BULK MATERIALS - 590 - - - n/a
662012 - CRUSHED GRAVEL 288 340 845 620 (225) -26.6%
662014 - CRUSHED STONE 173 - - - - n/a
662015 - LOAM 161 84 - - - n/a
662016 - SAND 2,741 5,209 - 857 857 n/a
662017 - SAND AND SALT 6,292 - 4,787 8,843 4,056 84.7%
662018 - BANKRUN GRAVEL 60 - - - - n/a
66202 - TOOLS 21,251 9,024 23,165 27,749 4,584 19.8%
66203 - VENDOR PURCHASED SUPPLIES 48,655 56,542 58,180 51,432 (6,748) -11.6%
662041 - MATERIALS INVENTORY 204,618 104,517 148,853 168,314 19,461 13.1%
662042 - SUPPLIES INVENTORY 23,505 16,382 19,050 17,488 (1,562) -8.2%
66204201 - INVENTORY - QPR 9,141 1,837 18,435 8,237 (10,198) -55.3%
66204202 - INVENTORY - BNKRUN GRAVEL 1,840 (809) 7,137 6,362 (775) -10.9%
66204203 - INVENTORY - CRUSHD GRAVEL 35,381 14,095 28,055 23,586 (4,469) -15.9%
66204204 - INVENTORY - CRUSHED STONE 1,532 756 538 656 118 21.9%
66204205 - INVENTORY - LOAM 2,535 327 2,076 2,510 434 20.9%
662043 - TOOL INVENTORY 51,865 29,425 45,047 41,999 (3,048) -6.8%
66204301 - INVENTORY - TONER 959 - 1,589 1,562 (27) -1.7%
66204302 - INVENTORY - PAPER 114 - - - - n/a
66204303 - INVENTORY-COMPUTER EQUIP 2,190 1,496 396 8,700 8,304 2097.0%
662044 - METER INVENTORY 21,864 148,746 1,217 - (1,217) -100.0%
662045 - TRUCK INVENTORY (5,315) - - - - n/a
662046 - HYDRANT INVENTORY 65,480 35,589 47,060 47,015 (45) -0.1%
662047 - GARAGE INVENTORY 2,689 1,162 2,433 2,692 259 10.6%
66205 - CONSUMABLE SUPPLIES 6,045 6,299 19,450 17,657 (1,793) -9.2%
66206 - COMPUTER EQUIPMENT - - - 20,200 20,200 n/a
663564 - COMPUTER-RELATED EQUIP 6,504 4,971 25,781 - (25,781) -100.0%
Materials & Supplies Total 559,205 445,894 473,890 486,980 13,090 2.8%

147 Operating Expenses – Water Services
2013
Actual
2014 Jan-
Jun
2014
Budget
2015
Budget
Budget
Diff $
Budget
Diff %
Other Expense
663541 - SAFETY EXPENSES $0 $0 $2,500 $2,500 $0 0.0%
6641 - BUILDING/REAL PROP RENT 5,600 - 5,600 5,600 - 0.0%
6642 - EQUIPMENT RENT 4,621 2,895 3,899 4,021 122 3.1%
66751 - EMPLOYEE DEVELOPMENT 300 - - - - n/a
667511 - TRAINING 365 - - - - n/a
6675111 - INSTATE TRAINING 19,822 13,152 18,940 23,772 4,832 25.5%
6675121 - IN STATE CONFERENCES - 63 1,000 1,000 - 0.0%
6675122 - OUT-OF-STATE CONFERENCES 48 195 - - - n/a
667513 - DUES 2,431 244 3,510 3,286 (224) -6.4%
667514 - PROFESSIONAL LICENSES 3,126 1,063 4,116 5,404 1,288 31.3%
667515 - PERIODICAL SUBSCRIPTIONS - - - 200 200 n/a
667516 - PERMITS 990 370 680 680 - 0.0%
667521 - POSTAGE - THIRD PARTY 931 1,747 3,276 3,956 680 20.8%
667522 - POSTAGE - INTERNAL 1,546 181 - 100 100 n/a
667523 - POSTAGE - EXPRESS DELIVER 176 - 200 200 - 0.0%
667531 - PRINTING COSTS 2,237 4,290 8,487 8,202 (285) -3.4%
667552 - SAFETY TRAINING - - 385 - (385) -100.0%
667554 - EPA / OSHA COMPLIANCE 320 500 3,408 3,408 - 0.0%
667555 - SAFETY EXPENSES 186 - 2,000 2,000 - 0.0%
667556 - FREIGHT CHARGES (STOCK) 933 - - - - n/a
667592 - FOOD SUPPLIES 247 63 322 521 199 62.5%
667599 - OTHER MISCELLANEOUS 1,339 610 - - - n/a
6676 - CONTRA ACCOUNT (25,200) (12,600) (25,200) (25,200) - 0.0%
Other Expense Total 20,018 12,773 33,123 39,650 6,527 19.7%
Purchased Power
66151 - POWER - LARGE ENERGY 266,142 77,332 224,818 269,261 44,443 19.8%
66152 - POWER - LARGE T&D 96,968 51,701 95,694 68,724 (26,970) -28.2%
66153 - POWER - MEDIUM ENERGY 40,590 18,173 35,422 36,252 830 2.3%
66154 - POWER - MEDIUM T&D 23,628 12,266 24,419 23,855 (564) -2.3%
66155 - POWER - SMALL ENERGY 12,146 8,044 11,749 15,101 3,352 28.5%
66156 - POWER - SMALL T&D 15,489 9,834 15,100 14,682 (418) -2.8%
66157 - FORWARD CAPACITY 331 - - - - n/a
66158 - LOAD RESPONSE (4,071) (1,798) (8,000) (8,000) - 0.0%
Purchased Power Total 451,223 175,552 399,202 419,875 20,673 5.2%
Tele/Other Utilties
66101 - WATER 4,182 1,327 2,601 3,185 584 22.5%
66102 - WASTEWATER 16,422 12,281 8,211 16,400 8,189 99.7%
66111 - TELEPHONE LINES 1,811 758 1,836 1,248 (588) -32.0%
66112 - DATA LINES 12,175 6,906 17,231 24,739 7,508 43.6%
66113 - CELLULAR PHONES 10,289 6,183 12,086 12,540 454 3.8%
66114 - PAGERS 1,137 1,131 1,180 1,130 (50) -4.2%
Tele/Other Utilties Total 46,016 28,586 43,145 59,242 16,097 37.3%
Transportation
66501 - TRANSPORTATION - INTERNAL 648,469 228,566 406,013 446,950 40,937 10.1%
665019 - TRANS INTERNAL INACTIVE - 92,493 273,879 259,583 (14,296) -5.2%
66502 - TRANSPORTATION - EXTERNAL 78,606 19,252 41,761 57,174 15,413 36.9%
66503 - MILEAGE REIMBURSEMENT 2,260 739 2,614 3,064 450 17.2%
66504 - MTA TRANS-PASS TOLL FEES 15 - - - - n/a
Transportation Total 729,350 341,050 724,267 766,771 42,504 5.9%
Grand Total 7,216,545 3,643,309 7,704,198 8,008,811 304,613 4.0%

148 Operating Expenses – Water Services
Water Services: Water Administration (A1)
Financial Summary:
2013
Actual
2014 Jan-
Jun
2014
Budget
2015
Budget
Budget
Diff $
Budget
Diff %
Expense Type:
Salaries & Wages $297,102 $146,066 $292,648 $299,892 $7,244 2.5%
Employee Benefits 148,693 77,491 152,678 160,965 $8,287 5.4%
Contracted Services 145 0 0 0 $0 n/a
Materials & Supplies 2,153 1,261 1,916 850 -$1,066 -55.6%
Other Expense 6,562 2,362 6,785 7,946 $1,161 17.1%
Tele/Other Utilties 1,704 1,042 2,556 1,920 -$636 -24.9%
Transportation 422 83 1,248 1,135 -$113 -9.0%
Grand Total 456,781 228,305 457,831 472,708 14,877 3.2%
Programs:
98 - Training 24,199 11,816 19,593 21,036 1,443 7.4%
99 - Administration 432,582 216,489 438,238 451,672 13,434 3.1%
Grand Total 456,781 228,305 457,831 472,708 14,877 3.2%
Funds:
10 - General 93,498 38,145 71,771 76,373 4,602 6.4%
20 - Water General 363,028 189,910 384,356 394,631 10,275 2.7%
50 - Wastew ater General 255 250 1,704 1,704 0 0.0%
Grand Total 456,781 228,305 457,831 472,708 14,877 3.2%
Staffing Trend:
Full-Time 5 5 5 5 0 0.0%
Part-Time 0 0 0 0 0 n/a
Total 5 5 5 5 0 0.0%
Full-Time 5 5 5 5 0 0.0%

149 Operating Expenses – Water Services
Water Services: Water Transmission/Distribution (A2)Financial Summary:
2013
Actual
2014
Jan-Jun
2014
Budget
2015
Budget
Budget
Diff $
Budget
Diff %
Expense Type:
Salaries & Wages $1,130,223 $569,918 $1,189,390 $1,146,574 -$42,816 -3.6%
Employee Benefits 481,716 248,340 497,256 506,455 9,199 1.8%
Contracted Services 810,888 259,806 971,331 1,140,377 169,046 17.4%
Heat/Fuel Oil 0 40 0 0 0 n/a
Insurance 0 0 958 0 -958 -100.0%
Materials & Supplies 369,671 216,969 314,739 312,800 -1,939 -0.6%
Other Expense 21,402 10,294 15,866 20,113 4,247 26.8%
Tele/Other Utilties 8,811 5,600 5,551 8,807 3,256 58.7%
Transportation 501,726 260,517 524,849 569,378 44,529 8.5%
Grand Total 3,324,437 1,571,484 3,519,940 3,704,504 184,564 5.2%
Programs:
1 - Seasonal Mains 89,475 54,504 83,884 89,707 5,823 6.9%
10 - General Distribution 221,239 102,378 260,182 228,205 -31,977 -12.3%
11 - Mains & Valves Maint 1,371,339 442,985 1,084,674 1,268,461 183,787 16.9%
12 - Services Maintenance 710,790 288,952 573,942 666,239 92,297 16.1%
15 - Digsafe Locates 566 216 196 0 -196 -100.0%
17 - Hydrant Mainenance 228,921 124,024 226,357 219,879 -6,478 -2.9%
2 - Meter Reading 19,161 23,355 43,723 16,304 -27,419 -62.7%
20 - Meter Service 780 186 0 0 0 n/a
4 - Paving (Mains) 10,219 95,033 418,147 349,875 -68,272 -16.3%
44 - WW Pumping 3,032 0 178 0 -178 -100.0%
45 - WW Treatment 3,407 5,245 725 0 -725 -100.0%
90 - Vehicles 28,512 14,075 30,739 29,147 -1,592 -5.2%
91 - Snow Removal 39,024 20,193 26,166 40,044 13,878 53.0%
92 - Bulk Materials Adjustment 3,202 2,384 2,583 12 -2,571 -99.5%
98 - Training 84,944 92,675 70,539 77,818 7,279 10.3%
99 - Administration 509,826 305,279 697,905 718,813 20,908 3.0%
Grand Total 3,324,437 1,571,484 3,519,940 3,704,504 184,564 5.2%
Funds:
10 - General 422,313 287,732 638,283 575,289 -62,994 -9.9%
20 - Water General 2,893,526 1,278,113 2,880,381 3,129,094 248,713 8.6%
30 - Water Standish 2,160 332 185 121 -64 -34.6%
51 - WW Cape Elizabeth 2,239 0 0 0 0 n/a
53 - WW Cumberland 0 0 178 0 -178 -100.0%
57 - WW Portland 3,257 5,209 725 0 -725 -100.0%
62 - WW Westbrook 472 0 0 0 0 n/a
64 - WW Joint Westbrook 470 36 0 0 0 n/a
66 - WW Peaks Island 0 62 188 0 -188 -100.0%
Grand Total 3,324,437 1,571,484 3,519,940 3,704,504 184,564 5.2%
Staffing Trend:
Full-Time 24 23 23 22 -1 -4.3%
Part-Time 0 0 0 0 0 n/a
Total 24 23 23 22 -1 -4.3%

150 Operating Expenses – Water Services
Water Services: Water Treatment (A3)
Financial Summary:
2013
Actual
2014
Jan-Jun
2014
Budget
2015
Budget
Budget
Diff $
Budget
Diff %
Expense Type:
Salaries & Wages $634,059 $322,724 $627,250 $652,900 $25,650 4.1%
Employee Benefits 285,101 144,756 293,777 312,064 $18,287 6.2%
Chemicals 345,958 147,089 520,884 402,640 -$118,244 -22.7%
Contracted Services 143,417 87,646 179,591 236,701 $57,110 31.8%
Heat/Fuel Oil 130,812 86,657 136,446 144,731 $8,285 6.1%
Insurance 20,158 10,537 31,706 34,113 $2,407 7.6%
Materials & Supplies 92,183 36,784 82,085 106,460 $24,375 29.7%
Other Expense -17,652 -10,334 -8,868 -8,218 $650 -7.3%
Purchased Pow er 451,223 175,552 399,202 419,875 $20,673 5.2%
Tele/Other Utilties 26,050 16,405 22,053 34,558 $12,505 56.7%
Transportation 48,767 18,417 38,503 38,150 -$353 -0.9%
Grand Total 2,160,076 1,036,233 2,322,629 2,373,974 51,345 2.2%
Programs:
1 - Seasonal Mains 3 0 0 0 0 n/a
11 - Mains & Valves Maint 0 430 0 0 0 n/a
12 - Services Maintenance 63 26 0 0 0 n/a
18 - Water Treatment Maint 103,139 51,193 109,861 109,600 -261 -0.2%
24 - Distribution Operations 291,081 141,414 302,504 276,904 -25,600 -8.5%
25 - Water Storage Maintenace 26,451 7,841 15,011 34,864 19,853 132.3%
28 - Monitoring 34 0 0 0 0 n/a
34 - Distribution Maintenance 38,529 10,736 33,263 29,443 -3,820 -11.5%
6 - Water Treatment 1,468,108 713,472 1,653,813 1,704,391 50,578 3.1%
98 - Training 43,586 37,527 40,945 40,068 -877 -2.1%
99 - Administration 189,082 73,594 167,232 178,704 11,472 6.9%
Grand Total 2,160,076 1,036,233 2,322,629 2,373,974 51,345 2.2%
Funds:
10 - General 193,107 88,310 172,314 172,634 320 0.2%
20 - Water General 1,929,552 929,170 2,101,932 2,134,817 32,885 1.6%
30 - Water Standish 37,417 18,753 48,383 66,523 18,140 37.5%
Grand Total 2,160,076 1,036,233 2,322,629 2,373,974 51,345 2.2%
Staffing Trend:
Full-Time 11 11 11 11 0 0.0%
Part-Time 0 0 0 0 0 n/a
Total 11 11 11 11 0 0.0%

151 Operating Expenses – Water Services
Water Services: Water Utility Services (A6)
Financial Summary:
2013
Actual
2014 Jan-
Jun
2014
Budget
2015
Budget
Budget
Diff $
Budget
Diff %
Expense Type:
Salaries & Wages $673,526 $364,842 $740,521 $784,638 $44,117 6.0%
Employee Benefits 295,017 169,786 342,454 375,562 $33,108 9.7%
Contracted Services 13,919 3,756 53,682 38,682 -$15,000 -27.9%
Materials & Supplies 95,199 190,880 75,150 66,870 -$8,280 -11.0%
Other Expense 9,707 10,450 19,338 19,808 $470 2.4%
Tele/Other Utilties 9,451 5,538 12,985 13,957 $972 7.5%
Transportation 178,433 62,035 159,668 158,108 -$1,560 -1.0%
Grand Total 1,275,252 807,287 1,403,798 1,457,625 53,827 3.8%
Programs:
1 - Seasonal Mains 40,673 21,415 34,268 33,557 -711 -2.1%
10 - General Distribution 23,573 17,314 77,110 51,066 -26,044 -33.8%
14 - Distribution Flushing 81,333 4,802 124,737 128,519 3,782 3.0%
15 - Digsafe Locates 221,665 100,257 236,707 268,391 31,684 13.4%
16 - Cross Connection 13,060 10,569 34,875 36,274 1,399 4.0%
17 - Hydrant Mainenance 10,847 87,198 119,862 37,471 -82,391 -68.7%
18 - Water Treatment Maint 0 0 710 602 -108 -15.2%
19 - Winter Hydrant Pump 96,942 11,881 12,780 113,030 100,250 784.4%
2 - Meter Reading 96,331 43,770 57,947 87,296 29,349 50.6%
20 - Meter Service 81,062 196,051 71,436 95,953 24,517 34.3%
21 - Large Meter Testing 11,107 3,489 50,496 41,014 -9,482 -18.8%
22 - Meter Replacement Program 2,217 209 11,061 12,277 1,216 11.0%
26 - Submeters 1,133 325 811 803 -8 -1.0%
3 - Leak Surveys 419 12 1,000 500 -500 -50.0%
31 - Vehicle Cleaning 1,290 1,547 0 3,925 3,925 n/a
4 - Paving (Mains) 783 63 4,398 0 -4,398 -100.0%
7 - General Investigation 230,719 125,641 195,531 194,203 -1,328 -0.7%
76 - Collection 14,181 5,978 11,331 14,313 2,982 26.3%
90 - Vehicles 204 49 4,398 6,204 1,806 41.1%
94 - Technology Teams 6,647 0 1,623 1,204 -419 -25.8%
98 - Training 64,871 33,788 54,406 57,799 3,393 6.2%
99 - Administration 276,195 142,929 298,311 273,224 -25,087 -8.4%
Grand Total 1,275,252 807,287 1,403,798 1,457,625 53,827 3.8%
Funds:
10 - General 391,461 355,117 391,375 405,741 14,366 3.7%
20 - Water General 880,723 443,489 991,903 1,007,565 15,662 1.6%
30 - Water Standish 1,935 8,356 4,617 5,250 633 13.7%
50 - Wastew ater General 0 0 0 13,736 13,736 n/a
51 - WW Cape Elizabeth 72 70 3,670 5,971 2,301 62.7%
53 - WW Cumberland 0 0 3,670 7,174 3,504 95.5%
55 - WW Windham LF 0 0 4,389 5,732 1,343 30.6%
57 - WW Portland 988 80 152 125 -27 -17.8%
59 - WW South Portland 39 158 254 276 22 8.7%
61 - WW Gorham 34 0 3,616 5,930 2,314 64.0%
62 - WW Westbrook 0 17 152 125 -27 -17.8%
Grand Total 1,275,252 807,287 1,403,798 1,457,625 53,827 3.8%
Staffing Trend:
Full-Time 13 14 14 15 1 7.1%
Part-Time 0 0 0 0 0 n/a
Total 13 14 14 15 1 7.1%

152 Operating Expenses – Water Services
Water Services
A key determinate of Water Services budget is the number of water main breaks. Main breaks occur fora number of reasons, including age, pressure surges, and cold weather. The long-term trend indicates adeclining number of leaks partially due to the capital investments made in prior year’s targetingreplacements of aging pipes.
A report in the American Water Works Association Journal states that a reasonable goal for main breaksin North America is 25 breaks per 100 miles of main per year.
The operating budget assumes the typical number of main breaks in a year. As the chart indicates, someyears are significantly higher than average resulting in significantly higher expenses.
0
5
10
15
20
25
30
1985 1989 1993 1997 2001 2005 2009 2013
Main Breaks per 100 Miles(2014 is YTD)
Main Breaks / 100 Miles AWWA Leaks Standard
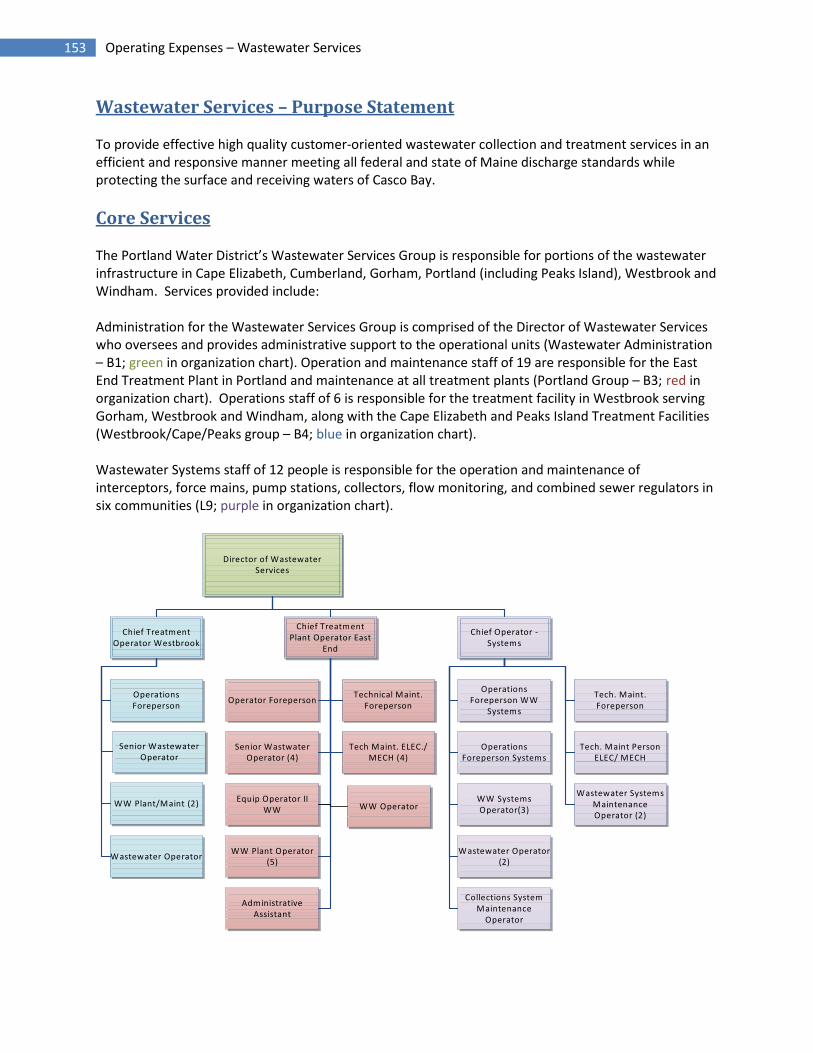
153 Operating Expenses – Wastewater Services
Wastewater Services – Purpose Statement
To provide effective high quality customer-oriented wastewater collection and treatment services in anefficient and responsive manner meeting all federal and state of Maine discharge standards whileprotecting the surface and receiving waters of Casco Bay.
Core Services
The Portland Water District’s Wastewater Services Group is responsible for portions of the wastewaterinfrastructure in Cape Elizabeth, Cumberland, Gorham, Portland (including Peaks Island), Westbrook andWindham. Services provided include:
Administration for the Wastewater Services Group is comprised of the Director of Wastewater Serviceswho oversees and provides administrative support to the operational units (Wastewater Administration– B1; green in organization chart). Operation and maintenance staff of 19 are responsible for the EastEnd Treatment Plant in Portland and maintenance at all treatment plants (Portland Group – B3; red inorganization chart). Operations staff of 6 is responsible for the treatment facility in Westbrook servingGorham, Westbrook and Windham, along with the Cape Elizabeth and Peaks Island Treatment Facilities(Westbrook/Cape/Peaks group – B4; blue in organization chart).
Wastewater Systems staff of 12 people is responsible for the operation and maintenance ofinterceptors, force mains, pump stations, collectors, flow monitoring, and combined sewer regulators insix communities (L9; purple in organization chart).
Director of WastewaterServices
Chief TreatmentOperator Westbrook
WW Plant/Maint (2)
Senior WastewaterOperator
OperationsForeperson
Chief Operator -Systems
Wastewater SystemsMaintenanceOperator (2)
WW SystemsOperator(3)
OperationsForeperson Systems
Tech. Maint PersonELEC/ MECH
Wastewater Operator(2)
Tech. Maint.Foreperson
OperationsForeperson WW
Systems
Collections SystemMaintenance
Operator
Wastewater Operator
AdministrativeAssistant
Chief TreatmentPlant Operator East
End
WW Plant Operator(5)
Equip Operator IIWW
Technical Maint.Foreperson
Tech Maint. ELEC./MECH (4)
Senior WastwaterOperator (4)
Operator Foreperson
WW Operator

154 Operating Expenses – Wastewater Services
Key Statistics
Wastewater Treatment Facilities - 2013
Cape Elizabeth South WWTFAverage Daily Flow – 0.255 million gallons
Portland – East End WWTFAverage Daily Flow – 17.21 million gallons
Peaks Island (Portland) WWTFAverage Daily Flow – 0.088 million gallons
Westbrook/Gorham/Windham Regional WWTFAverage Daily Flow – 3.00 million gallons
0
2000
4000
6000
8000
10000
2002
2003
2004
2005
2006
2007
2008
2009
2010
2011
2012
2013
Millions of Gallons Treated
0
0.0002
0.0004
0.0006
0.0008
0.001
0.0012
2003
2004
2005
2006
2007
2008
2009
2010
2011
2012
Cost per Gallon Treated
Wastewater Services Group Facts CSO program includes a web-based system that allows for near real-time monitoring and
alarming of nearly 90% of the total overflow sites.
The East End Treatment plant provided primary treatment and disinfection of 51.4% (186.62million gallons) of CSO and wet weather flow in 2013 as part of Portland’s overall CSO controlprogram
The investigation of sources of inflow and infiltration of clear water into the sewer systemduring wet weather periods continues in most of our wastewater communities, either as part ofa CSO Long Term Control Plan (LTCP) or in separate system to better manage the capacity of thecollection system. The Ottawa Rd. CSO LTCP was approved by MEDEP in 2013. In 2014, theTown of Cape Elizabeth will begin working to identify source of residential infiltration and inflowin the drainage area.
The Wastewater Operator apprentice program has been implemented to address comingworkforce management issues due to pending retirements in the coming years. Four positionshave been created which allow operators to work in each of our treatment plants and thewastewater systems and pumping group. The positions also assist the Engineering Servicesgroup with the asset management program and spend a short time with the water operationsgroups.

155 Operating Expenses – Wastewater Services
Wastewater Systems Responsibility
Performance Benchmarks
2013 Actual 2014 Projected 2015 GoalWastewater Systems
Corporate Goal - EnvironmentWet wells cleaned 137 125 125Feet of pipe cleaned 2,601 5,000 >20,000Feet of pipe televised 49,330 30,000 >30,000Dry weather overflows 3 4 0
Corporate Goal -ReliabilityCorrective Maintenance tasks 255 245 <500
Corporate Goal -AffordabilityPreventive Maintenance tasks 1,150 1,274 1,100
Treatment Operations
Corporate Goal - EnvironmentTotal license excursions 10 10 <26
Corporate Goal -ReliabilityBiosolids removed (wet tons) 21,220 22,656 <21,500% BOD removed 93.5 93.5 >85% suspended solids removed 95.5 95.5 >85
Cape Elizabeth – Interceptors, force mains, and 27 pump stations
Cumberland – Collectors, interceptors, force mains and 11 pump stations
Gorham – Collectors, interceptors, force mains and 15 pump stations
Portland – Interceptors, force mains, 29 combined sewer regulators, CSO monitoring, and 10 pump stations
Peaks Island (Portland) – Collectors, interceptors, force mains, storm drain system and 3 pump stations
Westbrook – Interceptors, force mains, 5 combined sewer regulators, CSO monitoring and 3 pump stations
Windham – Collectors, force mains and 2 pump stations

156 Operating Expenses – Wastewater Services
Past Accomplishments
Flow monitoring of combined sewer overflow eventso PWD continuously monitors over 95% of all combined sewer overflows in Portland,
Westbrook, and Cape Elizabeth. This program has assisted in the development of LongTerm CSO Control Plans in Portland, Westbrook, and Cape Elizabeth.
o The CSO Long-Term Control Plan for the Ottawa Road CSO was approved by DEP in2013. The 5-year work-plan began in 2014 with a focus by the Town of Cape Elizabethto identify source of residential I/I.
o Using data from the flow monitoring system, sources of seawater inflow to the Portlandcollection system are monitored and any increases are investigated to minimize theinflow of seawater. Seawater infiltration accounts for approximately 5% of the annualtreatment plant flow in Portland.
o The Town of Falmouth is entertaining the upgrade of the Mill Creek Pump Station, whichserves the Town of Cumberland. PWD continues to work with Cumberland to identifycurrent and future flow needs with a focus on the elimination of significant wet weatherpeak flows.
Westbrook/Gorham/Windham Regional Treatment Facility upgradeso The treatment plant’s control system was upgraded in 2013. Major processes are
controlled through the plant’s SCADA control system. The plant is monitored remotelythrough the District’s radio network.
o The Westbrook Plant has again accepted septage during summer months – due in partto the efforts of the treatment plant team and septage haulers to manage odors duringseptage deliveries.
o In 2014, the flow split project will be completed to further automate the plant’sresponse to wet weather events and to ensure the facility meets effluent permit limitsduring these events.
o At the request of the Department of Environmental Protection, effluent samples forphosphorus and nitrogen were collected during the summer months. This informationwill be sent to the DEP and will be used to better understand the need for futureeffluent limitations on these nutrients. This is part of a state-wide effort by DEP.
Improvements to Pump Station reliabilityo PWD monitors all systems through a SCADA computer system. Treatment plants can be
remotely operated from the East End Treatment Facility, the Westbrook/GorhamRegional Treatment Facility, or the Douglass St. Office during emergencies using theSCADA system.
o To improve the reliability of systems during power interruption, PWD requiresgenerators at new pump stations and has installed an average of 3 generators per yearat its existing pump stations. The majority of pump stations that require emergencygenerators have been upgraded or have generators installed during construction as partof our new infrastructure standards.
o Staff completed an assessment of all pump stations in 2014. A summary report hasbeen prepared for each community that PWD services.
Wastewater Services Department changeso The Wastewater Operator apprentice program continues to train operators to assist
with workforce management as pending retirements in the coming years.

157 Operating Expenses – Wastewater Services
Past Accomplishments (continued)
East End Wastewater Treatment Planto The conversion from fuel oil to natural gas for heating has reduced annual heating costs
by an estimated $200,000.o Dewatering system improvements and operational enhancements have reduced
Biosolids costs and improved the operations of the treatment plant.o New local limits for BOD and TSS have been in place since 2011. To date there has not
been a reduction in loading to the treatment plant, which operates with influentloadings slightly above the design capacity. The local limits will remain in place until the2016 permit renewal. If the current limits do not decrease the loading to the treatmentplant, the ultimate design capacity may have to be revisited as the aeration system isdesigned and upgraded in 2014 – 2015.
Projects and Initiatives
B1 – Administration We continue to monitor changing regulations related to phosphorus, nitrogen, and the primary
bypass operation at the East End Wastewater Treatment Facility. These changes could result insignificant future capital costs to meet the required treatment levels.
Staff continues to work with the City of Portland to coordinate the operation of the City’s BaxterBoulevard Wet Weather Flow Storage Conduit. The 2 million gallons storage tank system is thefirst of 5 planned conduits that will capture and store excessive sewer flows during wet weather.Using flow signals from PWD’s control system, the City will operate the system to release thestored flow for ultimate treatment at the East End Wastewater Treatment Facility. Throughstaff efforts at both the City and PWD, the process of accepting flow from the conduit has beenlargely automated.
As part of the Peaks Island sewer expansion, PWD has worked with the City of Portland andMEDEP to identify and removed inflow and infiltration to the sewer in an effort to eliminate theneed to operate the plant in emergency bypass mode several times each year. The goal forremoval of flow from the system is at least 250 gallons per minute during peak wet weatherperiods. The City has completed a survey of 80% of the homes and is working to develop a planto remove roof leaders and sump pumps that have been identified.
Working with treatment and systems groups, and with the support of AMaP and EnvironmentalServices, we continue to refine business practices with a goal of developing consistentdepartmental Standard Operating Procedures. This will ensure efficient operations whilemaking the transition of new staff into the Department more successful.
B3, B4, L9 – Operations Treatment Plant Operators continue to focus on effluent compliance. Staff continues to make
process control adjustments to the operation of the treatment plant as needed.
The installation of a security system, operational adjustments, and changes to the requiredsampling program has reduced the need for overtime staffing to cover operator leave time.Additional areas continue to be added to the system to further monitor chemical storage areasand to monitor additional points of entry.
The operations team continues to focus on implementing safe work practices throughout theworkplace.

158 Operating Expenses – Wastewater Services
Projects and Initiatives (continued)
Corporate Goal – Reliability
B1 – Administration Assist with the implementation of SCADA Standards through regular coordination with AMaP
and Operations staff. Monthly coordination meetings take place to further support this effort.
B3, B4, L9 – Operations Continue developing preventive maintenance practices that lead to or exceed a 75%/25% mix of
preventive to corrective work order history.
Monitor pump system’s ability to minimize pump station downtime.
Continue the condition assessment program of combining line cleaning and CCTV inspection of10% of each community’s buried infrastructure.
The Westbrook/Gorham/Windham Regional WWTF control system was upgraded in 2013.
The Peaks Island Facility Controls was upgraded in 2013 to further enhance the operation of theplant and to allow for improved remote operation of the facility. By the spring of 2015, a newultraviolet (UV) treatment system will be installed at the Peak’s Island facility.
Corporate Goal – Affordability
B1 – Administration Working with Engineering Services, the Operations team has implemented the bulk of the 2008
Energy Management Work Plan. Power use is monitored and managed to ensure efficientoperations. The EEWWTF participates in an electricity Demand Response through ISO NewEngland and receives roughly $7,000 for its participation.
Work with operations staff to implement cost savings related to overtime and off-shift coverage.
B3, B4, L9 – Operations Manage departmental budgets with area supervisors that lead to cost savings measures, i.e.
dewatered solids, station visits, chemical use, etc. Major budget items, including chemicals,power, Biosolids, and others are monitored using the WIMS data management system tomeasure and control operations and budgets.
Continue to implement process control measures in the operation of wastewater treatmentfacilities. Operations Plans have been developed for each facility and Operations Manuals arebeing updated to serve as guidance for the Operations Team.
Continue to support the use of the District’s asset management systems to efficiently manageequipment and systems. Operations staff and maintenance staff are working with the AMaPDepartment to complete our asset inventory and to ensure preventative maintenance tasks foreach facility are in place.

159 Operating Expenses – Wastewater Services
Projects and Initiatives (continued)
Corporate Goal – Environment
B1 – Administration Continue to monitor existing performance and developing regulations.
B3, B4, L9 – Operations Treatment and Systems teams work to ensure facilities operate in accordance to permit
requirements.
Through process control enhancements at the Peaks Island and Cape Elizabeth WWTF’s, eachplant is managing effluent nitrogen limits. While not currently required, the currentperformance would likely meet DEP’s future permit limits. The configuration of these plants hasmade this possible with minor control upgrades and the process control enhancements. Thiswill not be possible at the Westbrook/Gorham/Windham Regional and East End WWTFs withoutsignificant capital investments.
The target for effluent violations for permit exceedences has been reduced by over 10 per yearin the past 3 years. By 2016, our goal will be zero exceedences each year from all treatmentplants.
Corporate Goal – Employees and Work Environment
B1 – Administration Promote the District’s professional development program of a minimum 80 hours of training
each year.
B3, B4, L9 – Operations Provide support to employees through annual performance reviews and regular support.
Develop and maintain a safe working environment in each area of responsibility. Developwastewater operators through the apprentice program; operators will rotate through systems,treatment plants, the Asset Management and Planning department (AMaP), and the WaterServices Department.

160 Operating Expenses – Wastewater Services
Financial Overview
The Wastewater Services Group continues to operate with a goal of delivering effective services atreasonable costs to its member communities. Overall, the 2015 budget total includes an increase of$161,066 to $9,091,655. This is a 1.8% increase from the 2014 budget.
Salaries/Wages: Overall budgeted staffing levels remain unchanged from 2014. Maintenance supportfor all treatment plants continues to come from the central treatment maintenance group at the EastEnd treatment plant. Premium Pay has been decreased by $8,334 due to staffing optimization andfurther reductions in weekend sampling requirements at remote plants.
Biosolids Disposal: The total budget for the disposal of biosolids generated from the treatment ofwastewater has increased by $88,895 in 2015 or 6.8%. The budgeted % Total Solid from theWestbrook/Gorham Regional WWTF has been lowered to 16.0% to reflect performance and biosolidsproduction over the past several years. When combined with the expected increase in the service fee,this is responsible for approximately 1/3 of the total increase. The remaining increase is due toprojected biosolids production at the East End WWTF.
Chemicals: Generally, chemicals are used at each of our facilities to disinfect the treated wastewaterbefore being discharged to the environment to aid in dewatering biosolids and for odor control. Theamount of sodium hypochlorite at the East End WWTF has been increased to manage compliance withthe effluent permit. Over the past two years, average use has increased and the 2015 budget includes a10% increase in the projected chemical use. Sodium hypochlorite at the East End is used to controlfilamentous bacteria in the activated sludge process. Unit prices are also expected to increase slightly in2015 budget. Overall, the total budget for chemicals has increased by $49,064 or 8.0% from the 2014budget.
Contracted Services: Contracted services include the costs of the Falmouth and South Portlandtreatment plants to treat flows conveyed by PWD from Cumberland and Northern Cape Elizabeth.Contracted Services also includes a maintenance agreement related to the CSO monitoring services. Thebudget amount increased by $26,994, or 2.0%, to a total of $1,345,658.
Heat/Fuel Oil: The East End treatment plant converted from fuel oil to natural gas in 2012. Natural gasuse is continually monitored and recorded by the SCADA control system. Along with recent efficiencyimprovements, like the window replacement at the East End plant, the new roof installation is expectedto increase system efficiency. Additionally, the boiler at the Peaks Island WWTF was replaced with amore efficient unit. Overall, heat and fuel oil costs have decreased by 5.3% or $11,485 to a total of$204,272.
Purchased Power: Based on usage trends related to energy use at the East End (associated withaeration) and an expected reductions in the cost for power the overall energy budget has decreased by$57,622 or -4.3% in the 2015 budget.
Transportation: In the 2015 budget, the hauling of liquid sludge from the Cape Elizabeth and PeaksIsland WWTFs has been contracted with a private hauler. This has resulted in a reduction in thetransportation budget. The 2015 budget total is $331,033, a $33,007 or 9.1% reduction from 2014.

161 Operating Expenses – Wastewater Services
Wastewater Services: Total
Financial Summary:
2013
Actual
2014
Jan-Jun
2014
Budget
2015
Budget
Budget
Diff $
Budget
Diff %
Sub-Groups:
B1 - Wasteater Administration $211,498 $77,382 $154,766 $165,980 $11,214 7.2%
B3 - East End Port WWTF 4,370,861 2,220,780 4,490,608 4,580,660 90,052 2.0%
B4 - Westbr/Cape/Peaks WWTF's 1,409,294 750,556 1,528,327 1,606,245 77,918 5.1%
L9 - Wastew ater Systems 2,443,035 1,256,271 2,756,888 2,738,770 -18,118 -0.7%
Grand Total 8,434,688 4,304,989 8,930,589 9,091,655 161,066 1.8%
Expense Types:
Salaries & Wages 2,031,910 1,006,738 2,105,290 2,145,104 39,814 1.9%
Employee Benefits 988,297 502,401 1,028,694 1,083,096 54,402 5.3%
Biosolids Disposal 1,351,703 753,733 1,298,503 1,387,398 88,895 6.8%
Chemicals 617,490 380,563 615,128 664,192 49,064 8.0%
Contracted Services 999,027 522,475 1,318,664 1,345,658 26,994 2.0%
Heat/Fuel Oil 184,057 137,118 215,757 204,272 -11,485 -5.3%
Insurance 39,922 21,881 40,820 45,192 4,372 10.7%
Materials & Supplies 378,325 147,666 378,276 382,038 3,762 1.0%
Other Expense 99,672 11,756 62,709 68,927 6,218 9.9%
Purchased Pow er 1,355,061 625,118 1,352,116 1,294,494 -57,622 -4.3%
Tele/Other Utilties 121,122 61,797 150,592 140,251 -10,341 -6.9%
Transportation 268,102 133,743 364,040 331,033 -33,007 -9.1%
Grand Total 8,434,688 4,304,989 8,930,589 9,091,655 161,066 1.8%
Staffing Trend:
Full-Time 39 39 39 39 0 0.0%
Part- Time 0 0 0 0 0 n/a
Total 39 39 39 39 0 0.0%

162 Operating Expenses – Wastewater Services
2013 2014 2014 2015
Actual Jan-Jun Budget Budget Diff $ Diff %
Salaries & Wages
660111 - SALARIES/WAGES NON-UNION $283,761 $141,903 $286,574 $294,627 $8,053 2.8%
660121 - WAGES/REGULAR UNION 1,574,183 788,550 1,636,509 1,676,604 40,095 2.5%
660122 - WAGES/OVERTIME UNION 122,549 51,303 121,964 118,067 (3,897) -3.2%
660123 - WAGES/DOUBLETIME UNION 19,808 6,557 21,583 16,520 (5,063) -23.5%
660124 - WAGES/STANDBY TIME UNION 31,626 15,731 31,453 32,079 626 2.0%
660131 - WAGES - REGULAR - TEMPS 6,216 2,694 7,207 7,207 - 0.0%
66014 - VACATION ACCRUAL (4,832) - - - - n/a
66015 - SICKTIME ACCRUAL (1,401) - - - - n/a
Salaries & Wages Total 2,031,910 1,006,738 2,105,290 2,145,104 39,814 1.9%
Employee Benefits
660401 - FICA - EMPLOYERS' SHARE 152,600 75,876 161,055 164,100 3,045 1.9%
660405 - SAFETY/WHY PROGRAM ITEMS 7,299 1,416 5,558 7,195 1,637 29.5%
660411 - MEALS ALLOWANCE 483 40 575 575 - 0.0%
660418 - STIPENDS 5,300 4,400 5,349 5,051 (298) -5.6%
660419 - EMPLOYEE BENEFTS-MISC OTH 5,892 217 - - - n/a
660491 - FRINGE BENEFITS-REG/SAL 816,723 420,452 856,157 906,175 50,018 5.8%
Employee Benefits Total 988,297 502,401 1,028,694 1,083,096 54,402 5.3%
Biosolids Disposal
663571 - BIOSOLIDS DISPOSAL 1,351,703 753,733 1,298,503 1,387,398 88,895 6.8%
Biosolids Disposal Total 1,351,703 753,733 1,298,503 1,387,398 88,895 6.8%
Chemicals
661811 - SODIUM BICARBONATE 6,456 6,782 8,799 12,474 3,675 41.8%
661812 - SODIUM BISULFITE 141,687 94,634 171,211 171,042 (169) -0.5%
6618121 - SODIUM BISULFITE-ACCRUAL (1,965) 1,695 - - - n/a
66182 - CAUSTIC SODA 3,904 3,664 8,448 7,216 (1,232) -14.6%
66185 - SODIUM HYPOCHLORITE 285,435 150,356 242,650 285,431 42,781 17.1%
661851 - SODIUM HYPO - ACCURAL 235 1,102 - - - n/a
66189 - POLYMER 154,107 138,366 182,020 185,929 3,909 -0.1%
661891 - POLYMER - ACCRUAL 27,631 (16,036) - - - n/a
661899 - OTHER CHEMICALS - - 2,000 2,000 - 0.0%
Chemicals Total 617,490 380,563 615,128 664,092 48,964 8.0%
Contracted Services
6631 - ENGINEERING SERVICES 23,880 11,018 77,500 81,000 3,500 4.5%
663521 - TRAFFIC CONTROL 450 - 300 300 - 0.0%
663525 - CONTRACTOR CONSTRUCTION 5,625 3,948 27,000 30,500 3,500 13.0%
66353 - REPAIR SERVICES 4,691 3 4,000 4,000 - 0.0%
66354 - MAINTENANCE SERVICES 167,353 71,492 197,450 218,630 21,180 10.7%
663543 - CSO FLOW MONITORING 131,371 26,164 180,574 180,775 201 0.1%
663544 - MAINT SERVICES - CCTV 47,183 59,537 78,948 65,250 (13,698) -17.4%
663546 - MAINTENANCE - SNOW REMOVL 8,435 1,740 26,000 33,300 7,300 28.1%
663547 - WASTE SLUDGE TRANSPORT - - - 21,462 21,462 n/a
663551 - LAB ANALYSIS 350 - 2,300 2,300 - 0.0%
663561 - COMPUTER LICENSES 32,047 22,050 34,944 34,123 (821) -2.3%
663572 - GRIT & SCREENS DISPOSAL 62,471 25,967 70,330 73,950 3,620 5.1%
663573 - GREASE DISPOSAL 26,767 12,762 39,700 35,200 (4,500) -11.3%
663574 - DISPOSAL SERVICES 17,870 5,257 14,689 14,818 129 0.9%
663585 - TREATMENT CONTRACT SERVIC 464,823 280,290 560,580 545,657 (14,923) -2.7%
6635851 - WW DEWATERING SERVICES 3,242 1,688 3,357 3,527 170 5.1%
6635852 - WW DEWATERING SRVS CREDIT (3,242) (1,688) (3,400) (3,400) - 0.0%
663587 - COURIER SERVICES 4,488 2,247 4,392 4,266 (126) -2.9%
663594 - DIGSAFE 300 - - - - n/a
6636 - TECHNICAL SERVICES 923 - - - - n/a
Contracted Services Total 999,027 522,475 1,318,664 1,345,658 26,994 2.0%

163 Operating Expenses – Wastewater Services
2013 2014 2014 2015
Actual Jan-Jun Budget Budget Diff $ Diff %
Heat/Fuel Oil
66161 - HEATING OIL $46,104 $40,647 $47,693 $47,326 ($367) -0.8%
661621 - PIPELINE DELIVERED PROPANE 118,746 88,368 141,250 128,178 (13,072) -9.3%
661622 - CONTAINER DELIVERED 19,117 7,878 26,414 28,368 1,954 7.4%
66166 - UNLEADED GAS 69 225 400 400 - 0.0%
66167 - KEROSENE GAS 21 - - - - n/a
Heat/Fuel Oil Total 184,057 137,118 215,757 204,272 (11,485) -5.3%
Insurance
66599 - PROPERTY & BOILER INSUR 39,922 21,881 40,820 45,192 4,372 10.7%
Insurance Total 39,922 21,881 40,820 45,192 4,372 10.7%
Materials & Supplies
6619 - ASSET PURCHASES 71,539 22,393 84,500 91,000 6,500 7.7%
662017 - SAND AND SALT - - 400 200 (200) -50.0%
66202 - TOOLS 5,389 3,476 8,000 7,300 (700) -8.8%
66203 - VENDOR PURCHASED SUPPLIES 184,742 80,443 211,550 205,900 (5,650) -2.7%
662041 - MATERIALS INVENTORY 46,515 15,964 20,925 27,975 7,050 33.7%
662042 - SUPPLIES INVENTORY 43,028 14,312 26,075 25,725 (350) -1.3%
662043 - TOOL INVENTORY 10,640 7,624 13,425 11,875 (1,550) -11.5%
66204301 - INVENTORY - TONER 153 - 250 250 - 0.0%
66204302 - INVENTORY - PAPER 257 - 500 350 (150) -30.0%
66204303 - INVENTORY-COMPUTER EQUIP 2,950 1,555 1,525 750 (775) -50.8%
662046 - HYDRANT INVENTORY - 1 - - - n/a
662047 - GARAGE INVENTORY 2,011 617 2,175 2,075 (100) -4.6%
66205 - CONSUMABLE SUPPLIES 2,131 135 2,175 2,125 (50) -2.3%
66206 - COMPUTER EQUIPMENT - - - 6,513 6,513 n/a
663564 - COMPUTER-RELATED EQUIP 8,970 1,146 6,776 - (6,776) -100.0%
Materials & Supplies Total 378,325 147,666 378,276 382,038 3,762 1.0%
Other Expense
6642 - EQUIPMENT RENT 540 226 500 500 - 0.0%
66609 - OTHER ADVERTISING - 266 - - - n/a
667511 - TRAINING - - 1,000 - (1,000) -100.0%
6675111 - INSTATE TRAINING 11,446 7,140 9,570 10,700 1,130 11.8%
6675112 - OUT OF STATE TRAINING 779 125 6,200 6,400 200 3.2%
6675121 - IN STATE CONFERENCES 3,455 986 4,050 5,300 1,250 30.9%
6675122 - OUT-OF-STATE CONFERENCES 12,790 5,473 3,350 3,850 500 14.9%
667513 - DUES 8,138 - 9,300 13,100 3,800 40.9%
667514 - PROFESSIONAL LICENSES 2,335 625 2,130 2,130 - 0.0%
667515 - PERIODICAL SUBSCRIPTIONS 616 - 200 250 50 25.0%
667516 - PERMITS 24,746 5,613 26,032 26,032 - 0.0%
667517 - PLANT OPER LICENSE FEES - - 450 525 75 16.7%
667518 - REGULATORY REQUIRED FEES 11,542 - 14,000 14,000 - 0.0%
667519 - REGULATORY FINES 6,350 - - - - n/a
667521 - POSTAGE - THIRD PARTY 167 13 25 62 37 148.0%
667522 - POSTAGE - INTERNAL 55 103 100 100 - 0.0%
667523 - POSTAGE - EXPRESS DELIVER 477 8 200 378 178 89.0%
667552 - SAFETY TRAINING 40 - - - - n/a
667555 - SAFETY EXPENSES 3,310 (425) 5,900 5,900 - 0.0%
667556 - FREIGHT CHARGES (STOCK) 475 427 - 100 100 n/a
667581 - ANNUAL LAND CONTRIB CAPE 2,500 2,500 2,500 2,500 - 0.0%
667592 - FOOD SUPPLIES 523 83 602 500 (102) -16.7%
667599 - OTHER MISCELLANEOUS 32,788 293 - - - n/a
6676 - CONTRA ACCOUNT (23,400) (11,700) (23,400) (23,400) - 0.0%
Other Expense Total 99,672 11,756 62,709 68,927 6,218 9.9%

164 Operating Expenses – Wastewater Services
2013 2014 2014 2015
Actual Jan-Jun Budget Budget Diff $ Diff %
Purchased Power
66151 - POWER - LARGE ENERGY $558,854 $198,371 $515,871 $513,399 ($2,472) -0.5%
66152 - POWER - LARGE T&D 334,534 174,218 356,421 313,997 (42,424) -11.9%
66153 - POWER - MEDIUM ENERGY 248,481 127,537 246,924 240,796 (6,128) -2.5%
66154 - POWER - MEDIUM T&D 146,471 82,257 165,819 149,092 (16,727) -10.1%
66155 - POWER - SMALL ENERGY 31,461 19,943 33,476 44,012 10,536 31.5%
66156 - POWER - SMALL T&D 39,456 24,262 40,605 40,198 (407) -1.0%
66158 - LOAD RESPONSE (4,196) (1,470) (7,000) (7,000) - 0.0%
Purchased Power Total 1,355,061 625,118 1,352,116 1,294,494 (57,622) -4.3%
Tele/Other Utilties
66101 - WATER 101,742 50,260 129,525 120,745 (8,780) -6.8%
66102 - WASTEWATER 2,330 778 - - - n/a
66111 - TELEPHONE LINES (1) - 3,840 1,340 (2,500) -65.1%
66112 - DATA LINES 9,079 4,989 8,570 8,857 287 3.3%
66113 - CELLULAR PHONES 7,114 4,920 7,977 8,607 630 7.9%
66114 - PAGERS 858 850 680 702 22 3.2%
Tele/Other Utilties Total 121,122 61,797 150,592 140,251 (10,341) -6.9%
Transportation
66501 - TRANSPORTATION - INTERNAL 254,805 93,672 243,142 195,997 (47,145) -19.4%
665019 - TRANS INTERNAL INACTIVE - 34,571 106,179 120,391 14,212 13.4%
66502 - TRANSPORTATION - EXTERNAL 12,523 5,259 13,300 13,300 - 0.0%
66503 - MILEAGE REIMBURSEMENT 774 241 1,419 1,345 (74) -5.4%
Transportation Total 268,102 133,743 364,040 331,033 (33,007) -9.1%
Grand Total 8,434,688 4,304,989 8,930,589 9,091,655 161,066 1.8%

165 Operating Expenses – Wastewater Services
Wastewater Services: Wastewater Administration (B1)
Financial Summary:
2013
Actual
2014
Jan-Jun
2014
Budget
2015
Budget
Budget
Diff $
Budget
Diff %
Expense Type:
Salaries & Wages $125,749 $47,184 $94,244 $96,618 $2,374 2.5%
Employee Benefits 65,290 25,003 49,167 52,006 $2,839 5.8%
Contracted Services 0 0 500 500 $0 0.0%
Materials & Supplies 631 0 575 325 -$250 -43.5%
Other Expense 18,073 4,305 9,150 14,605 $5,455 59.6%
Tele/Other Utilties 597 674 960 1,756 $796 82.9%
Transportation 1,158 216 170 170 $0 -0.6%
Grand Total 211,498 77,382 154,766 165,980 11,214 7.2%
Programs:
45 - WW Treatment 43,170 128 0 0 0 n/a
98 - Training 16,394 7,026 5,521 5,640 119 2.2%
99 - Administration 151,934 70,228 149,245 160,340 11,095 7.4%
Grand Total 211,498 77,382 154,766 165,980 11,214 7.2%
Funds:
10 - General 1,896 9 0 0 0 n/a
50 - Wastew ater General 166,433 77,245 154,766 165,980 11,214 7.2%
51 - WW Cape Elizabeth 1,162 0 0 0 0 n/a
57 - WW Portland 39,737 128 0 0 0 n/a
64 - WW Joint Westbrook 1,108 0 0 0 0 n/a
66 - WW Peaks Island 1,162 0 0 0 0 n/a
Grand Total 211,498 77,382 154,766 165,980 11,214 7.2%
Staffing Trend:
Full-Time 2 1 1 1 0 0.0%
Part-Time 0 0 0 0 0 n/a
Total 2 1 1 1 0 0.0%

166 Operating Expenses – Wastewater Services
Wastewater Services: East End Treatment Plant - Portland (B3)
Financial Summary:
2013
Actual
2014
Jan-Jun
2014
Budget
2015
Budget
Budget
Diff $
Budget
Diff %
Expense Type:
Biosolids Disposal $1,035,809 $567,845 $976,294 $1,037,996 $61,702 6.3%
Salaries & Wages 947,610 483,580 1,008,242 1,032,917 24,675 2.4%
Employee Benefits 460,079 238,397 486,673 515,435 28,762 5.9%
Chemicals 535,809 341,469 514,723 554,021 39,298 7.6%
Contracted Services 134,722 69,527 222,276 254,283 32,007 14.4%
Heat/Fuel Oil 129,494 92,820 156,338 143,798 -12,540 -8.0%
Insurance 13,978 7,316 14,633 15,664 1,031 7.0%
Materials & Supplies 196,216 69,692 199,938 204,400 4,462 2.2%
Other Expense 55,197 -5,624 29,075 29,340 265 0.9%
Purchased Pow er 751,966 293,466 724,438 688,341 -36,097 -5.0%
Tele/Other Utilties 57,206 31,171 71,737 68,018 -3,719 -5.2%
Transportation 52,775 31,121 86,241 36,447 -49,794 -57.7%
Grand Total 4,370,861 2,220,780 4,490,608 4,580,660 90,052 2.0%
Programs:
44 - WW Pumping 4,132 2,464 0 0 0 n/a
45 - WW Treatment 4,048,683 2,082,737 4,218,043 4,312,851 94,808 2.2%
98 - Training 60,368 46,146 65,797 64,285 -1,512 -2.3%
99 - Administration 257,678 89,433 206,768 203,524 -3,244 -1.6%
Grand Total 4,370,861 2,220,780 4,490,608 4,580,660 90,052 2.0%
Funds:
10 - General 2,062 704 0 0 0 n/a
20 - Water General 12,673 13,096 3,415 0 -3,415 -100.0%
50 - Wastew ater General 315,983 134,875 272,564 267,808 -4,756 -1.7%
51 - WW Cape Elizabeth 47,707 23,151 76,421 41,334 -35,087 -45.9%
53 - WW Cumberland 0 113 0 0 0 n/a
57 - WW Portland 3,916,322 2,013,732 4,024,607 4,167,168 142,561 3.5%
64 - WW Joint Westbrook 40,179 19,942 71,077 64,332 -6,745 -9.5%
66 - WW Peaks Island 35,935 15,167 42,524 40,018 -2,506 -5.9%
Grand Total 4,370,861 2,220,780 4,490,608 4,580,660 90,052 2.0%
Staffing Trend:
Full-Time 17.67 19 19 19 0 0.0%
Part-Time 0 0 0 0 0 n/a
Total 17.67 19 19 19 0 0.0%

167 Operating Expenses – Wastewater Services
Wastewater Services: Westbrook Regional/Cape Elizabeth, and PeaksIsland Treatment Plants (B4)
Financial Summary:
2013
Actual
2014
Jan-Jun
2014
Budget
2015
Budget
Budget
Diff $
Budget
Diff %
Expense Type:
Biosolids Disposal $315,894 $185,888 $322,209 $349,402 $27,193 8.4%
Salaries & Wages 322,457 159,331 327,636 327,925 289 0.1%
Employee Benefits 151,416 78,061 156,743 163,618 6,875 4.4%
Chemicals 81,682 39,094 100,405 110,171 9,766 9.7%
Contracted Services 229,892 121,591 254,947 296,809 41,862 16.4%
Heat/Fuel Oil 42,424 33,746 47,676 47,553 -123 -0.3%
Insurance 5,950 3,166 6,332 6,773 441 7.0%
Materials & Supplies 43,657 18,363 64,750 66,500 1,750 2.7%
Other Expense 12,624 6,686 12,832 12,932 100 0.8%
Purchased Pow er 159,143 75,047 162,350 154,851 -7,499 -4.6%
Tele/Other Utilties 25,180 10,697 30,090 27,790 -2,300 -7.6%
Transportation 18,975 18,886 42,357 41,921 -436 -1.0%
Grand Total 1,409,294 750,556 1,528,327 1,606,245 77,918 5.1%
Programs:
44 - WW Pumping 5,953 4,046 0 0 0 n/a
45 - WW Treatment 1,310,713 677,500 1,416,224 1,503,958 87,734 6.2%
98 - Training 21,863 14,319 20,923 19,957 -966 -4.6%
99 - Administration 70,765 54,691 91,180 82,330 -8,850 -9.7%
Grand Total 1,409,294 750,556 1,528,327 1,606,245 77,918 5.1%
Funds:
10 - General 671 105 0 0 0 n/a
50 - Wastew ater General 91,958 68,906 112,103 102,287 -9,816 -8.8%
51 - WW Cape Elizabeth 310,593 152,344 338,648 372,997 34,349 10.1%
57 - WW Portland 2,451 1,567 13,706 11,021 -2,685 -19.6%
62 - WW Westbrook 2,971 2,030 0 0 0 n/a
64 - WW Joint Westbrook 881,727 441,678 899,128 941,193 42,065 4.7%
66 - WW Peaks Island 118,923 83,926 164,742 178,747 14,005 8.5%
Grand Total 1,409,294 750,556 1,528,327 1,606,245 77,918 5.1%
Staffing Trend:
Full-Time 6.67 6 6 6 0 0.0%
Part-Time 0 0 0 0 0 n/a
Total 6.67 6 6 6 0 0.0%

168 Operating Expenses – Wastewater Services
Wastewater Services: Wastewater Systems (L9)
Financial Summary:
2013
Actual
2014
Jan-Jun
2014
Budget
2015
Budget
Budget
Diff $
Budget
Diff %
Expense Type:
Salaries & Wages $636,095 $316,643 $675,169 $687,644 $12,475 1.8%
Employee Benefits 311,512 160,940 336,111 352,036 15,925 4.7%
Contracted Services 634,412 331,358 840,941 794,066 -46,875 -5.6%
Heat/Fuel Oil 12,139 10,553 11,743 12,921 1,178 10.0%
Insurance 19,993 11,398 19,856 22,755 2,899 14.6%
Materials & Supplies 137,821 59,611 113,013 110,813 -2,200 -1.9%
Other Expense 13,777 6,389 11,650 12,050 400 3.4%
Purchased Pow er 443,953 256,605 465,328 451,303 -14,025 -3.0%
Tele/Other Utilties 38,139 19,254 47,805 42,687 -5,118 -10.7%
Transportation 195,194 83,520 235,272 252,495 17,223 7.3%
Grand Total 2,443,035 1,256,271 2,756,888 2,738,770 -18,118 -0.7%
Programs:
24 - Distribution Operations 90 28 0 0 0 n/a
30 - Maintenance 305 0 0 0 0 n/a
39 - Compost Site 3,499 966 2,050 2,000 -50 -2.4%
44 - WW Pumping 1,718,310 843,471 1,923,497 1,915,544 -7,953 -0.4%
45 - WW Treatment 319,426 203,879 411,485 366,308 -45,177 -11.0%
90 - Vehicles 34,335 14,231 30,504 31,211 707 2.3%
95 - Douglass Street 12,621 4,410 9,440 9,910 470 5.0%
98 - Training 46,229 43,796 47,784 58,979 11,195 23.4%
99 - Administration 308,220 145,490 332,128 354,818 22,690 6.8%
Grand Total 2,443,035 1,256,271 2,756,888 2,738,770 -18,118 -0.7%
Funds:
10 - General 33,213 15,480 20,351 21,363 1,012 5.0%
20 - Water General 6,952 4,514 4,335 4,064 -271 -6.3%
30 - Water Standish 90 5 0 0 0 n/a
50 - Wastew ater General 391,752 211,591 431,747 465,851 34,104 7.9%
51 - WW Cape Elizabeth 277,037 133,649 280,237 305,226 24,989 8.9%
53 - WW Cumberland 484,718 301,171 574,026 522,675 -51,351 -8.9%
55 - WW Windham LF 20,478 9,972 32,180 30,997 -1,183 -3.7%
57 - WW Portland 799,530 337,087 858,550 873,823 15,273 1.8%
61 - WW Gorham 147,828 97,791 184,377 147,157 -37,220 -20.2%
62 - WW Westbrook 117,393 57,321 159,231 159,672 441 0.3%
64 - WW Joint Westbrook 93,464 50,040 111,918 102,116 -9,802 -8.8%
65 - WW Joint LF 35,142 18,244 45,863 52,529 6,666 14.5%
66 - WW Peaks Island 35,438 19,406 54,073 53,297 -776 -1.4%
Grand Total 2,443,035 1,256,271 2,756,888 2,738,770 -18,118 -0.7%
Staffing Trend:
Full-Time 12.66 13 13 13 0 0.0%
Part-Time 0 0 0 0 0 n/a
Total 12.66 13 13 13 0 0.0%

169 Operating Expenses – Environmental Services
Environmental Services
Sebago Lake Land Reserve
The Sebago Lake Land Reserve is 2,500 acres of land around the southern end of Sebago Lake near thewater intakes. It was purchased over the previous century to protect the water supply and to provide forpublic recreation. In 2005 a trail and visitor kiosk system was established to manage public access to1,700 acres of this land. There are more than 13 miles of trails just in the Otter Ponds section of the LandReserve and these trails have been improved and marked with signs in the past few years.
The picture above was taken in May 2014 at the second annual Trail Day. This event is organized to raiseawareness of this recreational resource. Part of the planning strategy this year included reaching out tolocal partners to lead one of the five events offered. District staff led two events, and were joined by thePresumpscot Regional Land Trust, Maine Department of Inland Fisheries & Wildlife’s Hooked on FishingProgram, New England Mountain Biking Association, and Bicycle Coalition of Maine, who lead the others.More than 130 member of the public attended.

170 Operating Expenses – Environmental Services
Environmental Services – Purpose Statement
Environmental Services is organized to monitor and protect water quality from watershed to tap andwastewater from collection to discharge.
Core Services
Environmental Services provides services in five core areas:
Water Resource Group (A5; red in the organization chart)1. The Source Protection section monitors Sebago Lake and the watershed, inspects development
projects in the watershed to minimize their impact, works with watershed partners to installpollution prevention and mitigation projects and works with watershed land trusts to helplandowners seeking to conserve their land in perpetuity.
2. The Environmental Education section communicates water quality and environmental principlesto children and adults throughout the watershed and service area with the goal of encouragingpublic stewardship of our water resources.
3. The Water Resources Security section provides for the protection of Sebago Lake by patrollingLower Bay and enforcing the rules of access to the Sebago Lake Land Reserve.
Laboratory Services Group (L6; blue in organization chart)4. The Environmental Laboratories ensure the proper collection, chemical and microbiological
analysis and reporting of water, wastewater and biosolids samples and the maintenance andoperation of all laboratory sampling and monitoring equipment at the District’s five laboratories.
5. The Industrial Pretreatment Program is responsible for permitting and monitoring industrial sewercustomers who discharge significant quantities of non-domestic wastewater to the collectionsystem to ensure their activities do not impact our operation or the receiving waters.

171 Operating Expenses – Environmental Services
Key Statistics
Map shows water distribution system sampling locations
Performance Benchmarks
Corporate Goals – Public Health and Environment 2013 Actual 2014 Projected 2015 Goal
Verified Water Quality Inquiries 52 70 40
Shore Land Zone Inspections 507 500 550
Watershed Properties Improved or Recommendations Made 35 20 30
Lower Bay Water Violations 127 119 110
Land Reserve Day Use Visitors 12,851 17,851 20,000
Land Reserve Violations 151 148 130
Visitors per Land Reserve Violation 143 160 150
Certified Laboratory Analytes 38 70 71
Students served monthly by HydrologicsIn-School Program
1003 1000 1000
Watershed Monitoring Programs: 18
Annual Watershed Inspections: 500
Students and Adults Impacted by Education andOutreach programs: More than 4,000 annually
Annual Land Reserve Day-use Visitors: 15,000
Land Reserve Violations Issued: 150
Annual Lower Bay Patrol Hours: 2000
Annual Lower Bay Violators cited: 125
Certified Laboratory Analytes: 70
Average Annual Water Quality Inquiries: 258
IPT Industries Regulated: 44

172 Operating Expenses – Environmental Services
Past Accomplishments:
Source Protection since 2000:
Completed more than 7,800 watershed inspections
Made recommendations for improvement to more than 500 watershed properties
Directed water quality-related improvements to more than 200 properties
Awarded more than $230,000 in Lake Stewards Grants which leveraged more than $730,000 inwater quality improvements
Maintained 18 ongoing lake and watershed monitoring programs
Reviewed plans for more than 144 large developments and, when necessary, provided planningboard feedback in an effort to minimize the impact of these projects.
Responded to 421 complaints, 243 of which prevented or mitigated environmental violationsand/or pollution
Contributed more than $450,000 to assist in the conservation by area land trusts of more than4,200 acres of land in the watershed.
Education and Outreach since 2000:
Produced 21 Watershed News newsletters and 4 State of the Lake reports
Distributed more than 41,000 Sebago Lake maps and 9,000 “Images of Sebago Lake” calendarsto watershed residents and visitors
Distributed more than 75,000 brochures and fact sheets to watershed residents and visitors
Taught water principles to approximately 13,000 middle school-aged students through ourHydrologics in-school education program
Provided environmental instruction to approximately 15,600 additional children, teachers, andadults through tours, events, workshops, and one-time lessons
Water Resources Security since 2005:
Patrolled Lower Bay by boat and attended the Standish Boat Launch for approximately 16,850hours combined.
Issued more than 1,330 warnings for violation of water contact regulations.
Recorded more than 87,029 day-use visits to the Sebago Lake Land Reserve.
Issued more than 1,920 warnings for violation of Land Reserve Rules.
Suspended privileges to visit Land Reserve of 42 individuals for aggravated or multiple LandReserve Rule violations.
Environmental Laboratories since 2000:
Combined the water and wastewater laboratories into one functioning unit with sharedresources, staff, and expertise.
Consolidated in one location the daily wastewater analyses for the four wastewater treatmentfacilities in order to improve consistency and reduce duplication of quality control requirements.
Upgraded laboratory certification program to current EPA and state standards to maintaincertification for 70 water and wastewater analytes.
Correctly analyzed performance testing samples to maintain lab certification.
Re-engineered the customer water quality inquiry process to ensure prompt and consistentresponse by appropriate staff. Responded to 317 water quality inquiries in 2012 and 271 in2013.
Supported the Maine State Planning Office by participating in the Maine healthy beachesprogram.
Accomplished the adoption of more stringent local limits on Portland and Westbrook industrialdischargers.

173 Operating Expenses – Environmental Services
Past Accomplishments (continued)
Budget Year 2014 Highlights:
Continued implementation of the Board’s new Watershed Land Conservation Program. TheDistrict approved $346,000 to help conserve over 1300 acres of land in 2014.
Performed an assessment of the Portland-Montreal Pipeline including its current operations,integrity management, public awareness, and spill response plans.
In partnership with towns of Standish and Frye Island and the CCSWCD, the Sebago Lake Phase IIfederal non-point source grant was completed representing approximately $47,000 of on-the-ground water quality improvements.
Began implementation of federal non-point source grant to develop a watershed-basedmanagement for Sebago Lake.
Worked with the Town of Standish Beach Committee to provide technical assistance for thepotential development of a town swimming beach on Sebago Lake.
Developed arsenic and TKN methods to analyze wastewater samples in the PWD lab rather thanoutsourcing to other labs.
Analyzed more than 500 wastewater samples to support the East End aeration project.
Completed and distributed an Industrial Waste Survey to Westbrook industries who in thefuture may be included in the IPT program.
Analyzed several samples to support UV/Ozone project and monitored for unintended WQchanged due to the new treatment.
A wastewater response exercise is planned for the last part of the year.
Constructed a footbridge within the Land Reserve, protecting a small waterway from soildisturbance.
Began construction of an outside amphitheater located behind the Resource Center.
Incorporated additional PWD staff and local partners for annual TroutKids trout releases,including those from Maine Department of Inland Fisheries & Wildlife, Maine Department ofEnvironmental Protection, Casco Bay Estuary Partnership, Cumberland County Soil & WaterConservation District, City of South Portland, and Royal River Conservation Trust.
Hosted second annual Trail Day on the Sebago Lake Land Reserve; attended by 134 members ofthe public with events hosted by both the District and five local partners.
Budget Year 2015 Staffing Changes:
There were no changes made in staffing levels.

174 Operating Expenses – Environmental Services
2014 Highlights
Organized the second annual Trail Day on theSLLR and welcomed 134 guests
Completed the re-establishment of 13 miles oftrails at Otter Ponds
2014 Trout releases, the culmination of theTroutKids Program, were facilitated byadditional experts from other departments atPWD and six community partners.
488th MP National Guard Exercise, June, 2014
Supported conservation of 1300 acres ofwatershed land through the Land ConservationProgram
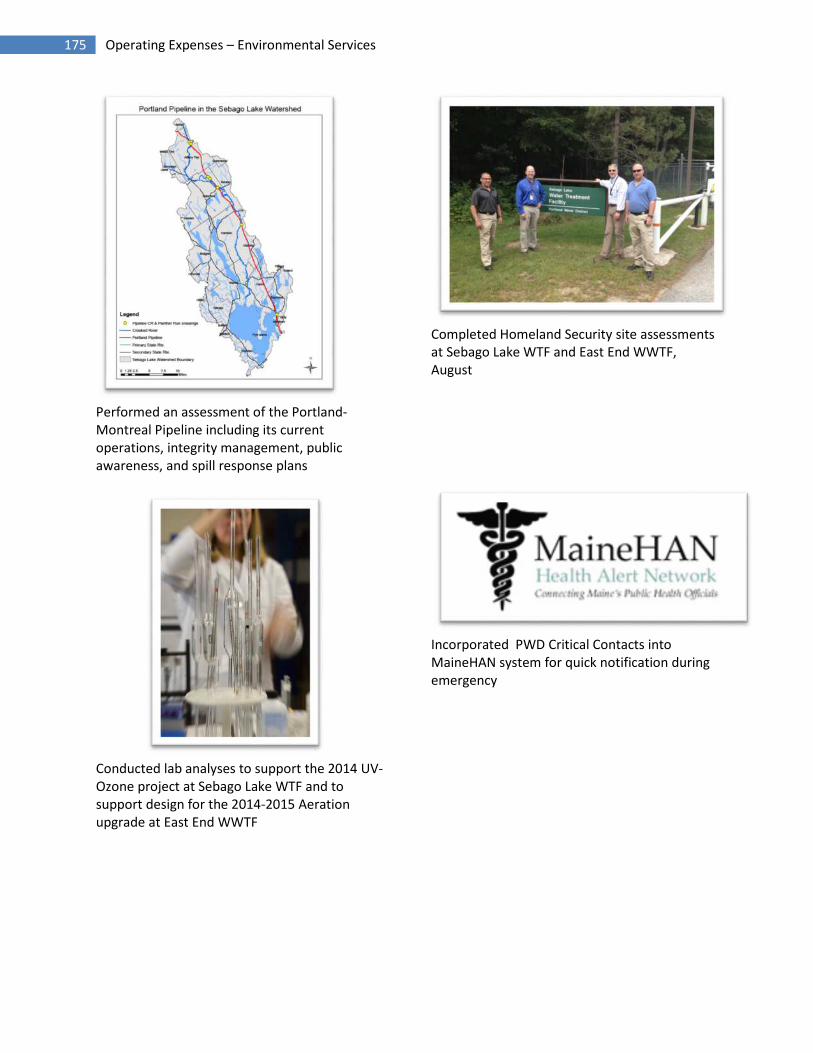
175 Operating Expenses – Environmental Services
Performed an assessment of the Portland-Montreal Pipeline including its currentoperations, integrity management, publicawareness, and spill response plans
Conducted lab analyses to support the 2014 UV-Ozone project at Sebago Lake WTF and tosupport design for the 2014-2015 Aerationupgrade at East End WWTF
Completed Homeland Security site assessmentsat Sebago Lake WTF and East End WWTF,August
Incorporated PWD Critical Contacts intoMaineHAN system for quick notification duringemergency

176 Operating Expenses – Environmental Services
Projects and Initiatives
General
Work with Administrative Facility Chief Operator to redesign the Lake office space.
Source Protection
Perform inspections of all property development in the shoreland zone of Sebago Lake.
Provide technical assistance for home owners, road associations and camps to improve stormwater quality.
Complete scheduled monitoring and testing for all 18 water quality monitoring programs,analyze the data, and produce applicable water quality assessment reports.
Continue implementation of the watershed-based management for Sebago Lake.
Monitor planning board agendas, provide technical assistance, and track large-scale projectssuch as subdivision and commercial development within the Sebago Lake watershed.
Track progress of Eel Weir Dam relicensing and provide data to regulators as necessary.
Continue collaboration with the Presumpscot Regional Land Trust to ensure that trailstewardship remains in accordance with District security/land use policies.
Perform upper watershed outreach and work with Portland Pipeline to ensure pipeline spillresponse contractors and watershed emergency response agencies are prepared in the event ofa pipeline spill in the watershed.
Complete a 2015 State of Lake Report.
Complete process of digitizing watershed septic system files.
Environmental Laboratories and Industrial Pretreatment
Maintain certification for testing methods at East End and Sebago Lake laboratories for allanalytes reportable to state regulators.
Report on water quality inquiries at dead end locations.
Initiate Round #2 monitoring for Cryptosporidium per LT2 drinking water regulation
Provide water quality training to District staff.
Improve lab safety through hazard analysis and improved chemical inventory procedures.
Manage IPT scheduling and data management through the District’s AIM system.
Provide analytical support for ultraviolet light pilot test at Peaks Island Wastewater TreatmentFacility.
Support operations with continued monitoring for unintended water quality impacts of newtreatment at Sebago Lake WTF.
Update the District’s water vulnerability assessment.

177 Operating Expenses – Environmental Services
Projects and Initiatives (continued)
District Security
Exercise District’s emergency response plan, full scale or table top. Patrol Lower Bay by boat during summer, ensuring compliance with body contact and
trespassing restrictions. Patrol Sebago Lake Land Reserve year-round to ensure compliance with District land use policy. Conduct training for Operations staff in security patrol procedures of District’s water storage
facilities. Conduct training of Lake Office staff in Land Reserve patrol procedures. Support local first responders as requested in response to lake rescue incidents. Patrol Lower Bay during ice fishing season to minimize impact of activity on water quality. Improve parking conditions at the Route 237 kiosk. Develop a 5-year Management and Maintenance Plan for the Sebago Lake Land Reserve. Finish construction of an amphitheater located behind the Resource Center within the Sebago
Lake Land Reserve.
Environmental Education and Outreach
Maintain 2014 level of HydroLogics and TroutKids programs in watershed and service areaschools.
Evaluate current education programming to ensure consistency with new national sciencestandards (Next Generation Science Standards), best practices, and teacher feedback.
Coordinate outreach initiatives with District public relations efforts. Utilize technology and a variety of media to connect the public with PWD events and
environmental stewardship messages. Recognize Drinking Water Week with District-sponsored activities for adults and children. Provide outreach materials to lake area public including maps, calendars, and informational
brochures. Provide support to the Southern Maine Children’s Water Festival.

178 Operating Expenses – Environmental Services
2015 Goals
Continue monitoring for unintended WQchanges after start of UV treatment at SebagoLake Water Treatment Facility
Evaluate current education programming toensure consistency with new national sciencestandards, best practices, and teacher feedback
Begin 2-year crypto monitoring per LT2drinking water regulation
Work with Portland Pipe Line and upperwatershed towns to ensure an effective spillresponse.
Complete a 2015 State of Lake Report.

179 Operating Expenses – Environmental Services
2015 Targeted Grants to Watershed Partners
2015Proposed
Type Recipient Purpose
$300Watershed Education
SupportWatershed organizations Environmental Education
Materials for watershed events.
$4,350 Service Learning ProjectCumberland County Soil &
Water Conservation DistrictEnvironmental Education
Support for a service learning project in a school that recently completed a year of HydroLogics. Students will learn one water-related topic in-depth and provide a related service to their community. This program will also increase local program effectiveness through partner
collaboration.
$1,500 Teacher Support Grants Maine Educators Environmental Education
Provides teaching resources to local teachers to support water education.
$15,000 Lakescaping GrantsWatershed propertyowners, businesses
Source Protection
Grants of up to $1,000 are made to individual property owners and up to $2,000 to businesses, associations, or municipalities for implementingerosion and sedimentation control BMPs based on our recommendations. A 50-50 match is required.
$750 Lakes Protection Support Maine Lakes Society Advocacy
A contribution of $750 to Maine Lakes Society to support their operations. Their advocacy benefits all surface supplies including PWD.
$1,250 Lake Protection SupportVolunteer Lakes Monitoring
ProgramAdvocacy, Monitoring
A contribution of $1,250 to support their operations. Their outreach raises awareness statewide to issues of lake protection, particularlyinvasive aquatic plants. They conduct training at PWD and for PWD employees on request.
$13,050Watershed Organization
SupportLakes Environmental
AssociationAdvocacy, Education, Source Protection
LEA provides support for our upper watershed protection efforts. The lakes they work on all drain ultimately to Sebago. LEA monitors lakewater quality and participates in the planning process in upper watershed towns to minimize development impact. Staff provides technical
assistance to lakefront landowners on BMPs for lake protection and compliance with Shoreland zoning and the Natural Resources ProtectionAct.
$1,250Watershed Organization
SupportRaymond WaterwaysProtective Association
Outreach, Source Protection
RWPA works on invasive plant control, BMP installation, and do outreach via a newsletter. They work on 319 projects in the indirectwatershed. They also receive financial support from the town, grants, and individuals.

180 Operating Expenses – Environmental Services
2015 Targeted Grants to Watershed Partners (Continued)
2015Proposed
Type Recipient Purpose
$1,500 Land Trust Support Loon Echo Land Trust Source Protection
Loon Echo’s mission is to conserve land in the towns of Denmark, Bridgton, Harrison, Naples, Casco, Sebago, and Raymond. The trust’s servicearea encompasses 126,000 acres – nearly half - of the Sebago Lake watershed. As they make progress in pursuit of their mission our water
supply is better protected.
$1,500 Land Trust supportWestern Maine Foothills
Land TrustSource Protection
The Western Foothills Land Trust is organized to conserve land in the towns of Otisfield, Norway, Bethel and Waterford, among others. Thetrust’s service area encompasses 54,000 acres – about 20% - of the Sebago Lake watershed. As they make progress in pursuit of their mission
our water supply is better protected.
$750Maine Water Conference
SupportU Maine Mitchell Center Public Relations
Our support mostly serves a public relations function, ensuring the District's name on promotional materials. The conference also provides anopportunity to attract Maine colleges and Universities to research on Sebago Lake. We are working with the Michelle Center to initiate a
Sebago Lake Track for presentations at the conference.
$800 Children's Water FestivalSouthern Maine CWF
CommitteeEducation, Public Relations
Our support serves both a PR purpose and contributes to the educational goal of the event - raising student awareness of water issues.
$42,000 Total Grant Support to Watershed Partners
All Grants are subject to Board of Trustee approval.
181 Operating Expenses – Environmental Services
Financial Overview
The overall Environmental Services budget is up $45,256 from the 2014 budget, an increase of 2.4%. Ofthat total $37,261 is for employee wages and benefits. Beyond the cost of labor, the most significantincrease is for contracted services – lab analysis ($10,310). These costs are for analyses required byfederal or state regulation.
A5: Water Resources
The heating budget for the lake office was reduced by $3,000. Some contingency funds were cut($1,000) and the rest of the reduction represents expected savings from the installation of newwindows.
Printing costs were increased by $3,200. This increase is because the cost of the WatershedNews was underestimated last year and because in 2015 we will publish the periodic “State ofthe Lake” report which is more expensive to produce.
The budget for advertising is reduced by $3,400 due to a shift from paid advertising innewspapers and publications to less expensive advertising through social media and email.
The budget for data lines is increased by $1,100 to support in-field hand held data devices.
$4,350 is budgeted to provide a grant to Cumberland County Soil and Water ConservationDistrict. They have agreed to pilot a service learning project which, if successful, will make theirin-school education program complimentary to ours.
L6: Laboratory Services
The budget for Professional Licenses is decreased by more than $3,000 because the laboratoriesare required to be licensed every other year and 2015 is an off year.
The lab analysis budget is increased by more than $10,000 to cover the cost of requiredmonitoring for cryptosporidium on the water side and Whole Effluent Toxicity and IndustrialPretreatment samples on the wastewater side. All these analyses are required by regulation.

182 Operating Expenses – Environmental Services
Environmental Services: Total
Financial Summary:
2013
Actual
2014
Jan-Jun
2014
Budget
2015
Budget
Budget
Diff $
Budget
Diff %
Sub-Groups:
A5 - Water Resources $924,499 $488,114 $1,024,919 $1,052,393 $27,474 2.7%
L6 - Water/WW Laboratory 820,000 406,092 829,266 847,048 17,782 2.1%
Grand Total 1,744,499 894,206 1,854,185 1,899,441 45,256 2.4%
Expense Types:
Salaries & Wages 923,804 452,808 936,649 952,841 16,192 1.7%
Employee Benefits 419,740 218,480 439,405 460,474 21,069 4.8%
Chemicals 4,281 2,257 3,106 4,006 900 29.0%
Contracted Services 96,359 40,658 123,646 136,019 12,373 10.0%
Deferred Cost W/O 4,400 0 0 0 0 n/a
Heat/Fuel Oil 17,369 7,437 19,605 15,809 -3,796 -19.4%
Insurance 2,265 1,161 2,321 2,554 233 10.0%
Materials & Supplies 100,422 60,865 110,328 108,288 -2,040 -1.8%
Other Expense 142,630 88,758 161,895 161,230 -665 -0.4%
Purchased Pow er 2,352 1,428 2,532 2,923 391 15.4%
Tele/Other Utilties 5,314 2,527 4,020 4,700 680 16.9%
Transportation 25,563 17,827 50,678 50,597 -81 -0.2%
Grand Total 1,744,499 894,206 1,854,185 1,899,441 45,256 2.4%
Staffing Trend:
Full-Time 14 14 14 14 0 0.0%
Part- Time 1 1 1 1 0 0.0%
Total 15 15 15 15 0 0.0%

183 Operating Expenses – Environmental Services
2013 2014 2014 2015
Actual Jan-Jun Budget Budget Diff $ Diff %
Salaries & Wages
660111 - SALARIES/WAGES NON-UNION $302,259 $155,088 $312,901 $320,574 $7,673 2.5%
660121 - WAGES/REGULAR UNION 492,770 244,657 498,188 508,286 10,098 2.0%
660122 - WAGES/OVERTIME UNION 21,080 10,203 25,590 22,511 (3,079) -12.0%
660123 - WAGES/DOUBLETIME UNION 6,388 2,180 6,720 6,654 (66) -1.0%
660124 - WAGES/STANDBY TIME UNION 204 - - - - n/a
660131 - WAGES - REGULAR - TEMPS 90,081 40,680 93,250 94,816 1,566 1.7%
660132 - WAGES - OVERTIME- TEMPS 57 - - - - n/a
660133 - WAGES - DOUBLETIME - TEMP 77 - - - - n/a
66014 - VACATION ACCRUAL 5,720 - - - - n/a
66015 - SICKTIME ACCRUAL 5,168 - - - - n/a
Salaries & Wages Total 923,804 452,808 936,649 952,841 16,192 1.7%
Employee Benefits
660401 - FICA - EMPLOYERS' SHARE 68,371 34,474 71,654 72,892 1,238 1.7%
660403 - LIFE INSURANCE - 1,200 - - - n/a
660405 - SAFETY/WHY PROGRAM ITEMS 2,752 367 3,554 3,455 (99) -2.8%
660411 - MEALS ALLOWANCE 36 - - - - n/a
6604151 - FIELD UNIFORMS - - 1,200 1,200 - 0.0%
660418 - STIPENDS 1,700 1,800 1,900 1,900 - 0.0%
660419 - EMPLOYEE BENEFTS-MISC OTH 1,891 40 - - - n/a
660491 - FRINGE BENEFITS-REG/SAL 344,990 180,599 361,097 381,027 19,930 5.5%
Employee Benefits Total 419,740 218,480 439,405 460,474 21,069 4.8%
Chemicals
661899 - OTHER CHEMICALS 4,281 2,257 3,106 4,006 900 29.0%
Chemicals Total 4,281 2,257 3,106 4,006 900 29.0%
Contracted Services
66353 - REPAIR SERVICES - - - 4,400 4,400 n/a
66354 - MAINTENANCE SERVICES 32,919 16,852 52,835 49,848 (2,987) -5.7%
663545 - RADIO SERVICING AND EQUIP - 157 - - - n/a
663546 - MAINTENANCE - SNOW REMOVL - - 1,500 1,500 - 0.0%
663551 - LAB ANALYSIS 46,918 16,654 38,115 48,425 10,310 27.0%
663574 - DISPOSAL SERVICES 5,689 702 6,700 4,800 (1,900) -28.4%
663587 - COURIER SERVICES 2,244 1,124 2,196 2,946 750 34.2%
663599 - MISC OTHER SERVICES 1,137 2,682 - - - n/a
6636 - TECHNICAL SERVICES 7,452 2,487 22,300 24,100 1,800 8.1%
Contracted Services Total 96,359 40,658 123,646 136,019 12,373 10.0%
Deferred Cost W/O
66754 - DEFERRED COSTS WRITE OFF 4,400 - - - - n/a
Deferred Cost W/O Total 4,400 - - - - n/a
Heat/Fuel Oil
661622 - CONTAINER DELIVERED 9,653 5,293 11,305 8,309 (2,996) -26.5%
66166 - UNLEADED GAS 7,716 2,144 8,300 7,500 (800) -9.6%
Heat/Fuel Oil Total 17,369 7,437 19,605 15,809 (3,796) -19.4%
Insurance
66599 - PROPERTY & BOILER INSUR 2,265 1,161 2,321 2,554 233 10.0%
Insurance Total 2,265 1,161 2,321 2,554 233 10.0%

184 Operating Expenses – Environmental Services
2013 2014 2014 2015
Actual Jan-Jun Budget Budget Diff $ Diff %
Materials & Supplies
6619 - ASSET PURCHASES $19,213 $16,527 $12,750 $12,050 ($700) -5.5%
66202 - TOOLS 158 176 1,450 1,100 (350) -24.1%
66203 - VENDOR PURCHASED SUPPLIES 7,312 2,146 10,750 10,250 (500) -4.7%
662042 - SUPPLIES INVENTORY 743 439 1,575 1,675 100 6.3%
662042 - TOOL INVENTORY 72 474 300 500 200 66.7%
662043 - TOOL INVENTORY 30 140 550 550 - 0.0%
66204301 - INVENTORY - TONER 1,154 - - - - n/a
66204302 - INVENTORY - PAPER 88 - - - - n/a
66204303 - INVENTORY-COMPUTER EQUIP 1,579 1,942 350 1,350 1,000 285.7%
662047 - GARAGE INVENTORY 21 11 100 100 - 0.0%
66205 - CONSUMABLE SUPPLIES 68,388 35,019 75,690 75,250 (440) -0.6%
66206 - COMPUTER EQUIPMENT - - - 5,463 5,463 n/a
663564 - COMPUTER-RELATED EQUIP 1,664 3,991 6,813 - (6,813) -100.0%
Materials & Supplies Total 100,422 60,865 110,328 108,288 (2,040) -1.8%
Other Expense
66411 - INTERNAL RENTAL CHARGES 48,600 24,300 48,600 48,600 - 0.0%
6642 - EQUIPMENT RENT - - - 300 300 n/a
66601 - PUBLIC RELATIONS 6,031 3,193 5,500 5,500 - 0.0%
66609 - OTHER ADVERTISING 5,881 2,971 5,600 2,200 (3,400) -60.7%
6675111 - INSTATE TRAINING 3,487 4,466 4,200 6,800 2,600 61.9%
6675112 - OUT OF STATE TRAINING 1,111 48 1,500 6,500 5,000 333.3%
6675121 - IN STATE CONFERENCES 1,647 596 3,500 - (3,500) -100.0%
6675122 - OUT-OF-STATE CONFERENCES 3,664 1,623 2,300 - (2,300) -100.0%
667513 - DUES 2,480 14,914 16,245 16,480 235 1.4%
667514 - PROFESSIONAL LICENSES 14,300 418 3,945 795 (3,150) -79.8%
667515 - PERIODICAL SUBSCRIPTIONS 201 33 580 580 - 0.0%
667516 - PERMITS 90 80 - 100 100 n/a
667521 - POSTAGE - THIRD PARTY 1,951 1,103 3,350 2,900 (450) -13.4%
667522 - POSTAGE - INTERNAL 329 229 400 750 350 87.5%
667523 - POSTAGE - EXPRESS DELIVER 7 - 300 150 (150) -50.0%
667531 - PRINTING COSTS 14,905 9,603 19,550 22,750 3,200 16.4%
667556 - FREIGHT CHARGES (STOCK) 183 183 - - - n/a
667561 - WATERSHED GRANTS/SUPPORT 32,020 22,452 41,450 42,000 550 1.3%
667591 - UNIFORMS 3,158 1,073 2,750 2,750 - 0.0%
667592 - FOOD SUPPLIES 938 613 1,975 2,075 100 5.1%
667599 - OTHER MISCELLANEOUS 1,647 860 150 - (150) -100.0%
Other Expense Total 142,630 88,758 161,895 161,230 (665) -0.4%
Purchased Power
66155 - POWER - SMALL ENERGY 1,129 691 1,248 1,673 425 34.1%
66156 - POWER - SMALL T&D 1,223 737 1,284 1,250 (34) -2.6%
Purchased Power Total 2,352 1,428 2,532 2,923 391 15.4%
Tele/Other Utilties
66101 - WATER 149 79 310 310 - 0.0%
66111 - TELEPHONE LINES 296 - 650 650 - 0.0%
66112 - DATA LINES 1,985 932 540 1,640 1,100 203.7%
66113 - CELLULAR PHONES 2,884 1,516 2,520 2,100 (420) -16.7%
Tele/Other Utilties Total 5,314 2,527 4,020 4,700 680 16.9%
Transportation
66501 - TRANSPORTATION - INTERNAL 17,406 7,435 14,419 16,507 2,088 14.5%
665019 - TRANS INTERNAL INACTIVE - 5,937 27,209 24,640 (2,569) -9.4%
66503 - MILEAGE REIMBURSEMENT 8,157 4,455 9,050 9,450 400 4.4%
Transportation Total 25,563 17,827 50,678 50,597 (81) -0.2%
Grand Total 1,744,499 894,206 1,854,185 1,899,441 45,256 2.4%

185 Operating Expenses – Environmental Services
Environmental Services: Water Resources (A5)
Financial Summary:
2013
Actual
2014
Jan-Jun
2014
Budget
2015
Budget
Budget
Diff $
Budget
Diff %
Expense Type:
Salaries & Wages $513,397 $252,490 $523,457 $534,192 $10,735 2.1%
Employee Benefits 226,536 118,170 237,792 249,424 11,632 4.9%
Contracted Services 38,707 20,387 74,832 79,382 4,550 6.1%
Deferred Cost W/O 4,400 0 0 0 0 n/a
Heat/Fuel Oil 16,258 7,003 18,300 14,500 -3,800 -20.8%
Insurance 2,265 1,161 2,321 2,554 233 10.0%
Materials & Supplies 20,865 23,272 29,338 29,025 -313 -1.1%
Other Expense 73,407 45,926 85,670 89,495 3,825 4.5%
Purchased Pow er 2,352 1,428 2,532 2,923 391 15.4%
Tele/Other Utilties 5,314 2,527 4,020 4,700 680 16.9%
Transportation 20,998 15,750 46,657 46,198 -459 -1.0%
Grand Total 924,499 488,114 1,024,919 1,052,393 27,474 2.7%
Programs:
28 - Monitoring 123,541 49,719 122,294 143,606 21,312 17.4%
41 - Pretreatment 3,367 954 5,928 6,134 206 3.5%
56 - Tech Ops Support 43,682 16,582 71,585 53,019 -18,566 -25.9%
78 - Education 99,595 61,137 148,102 123,925 -24,177 -16.3%
82 - Lake Security 178,100 83,535 179,705 183,237 3,532 2.0%
83 - Customer Outreach 106,680 69,560 106,147 121,651 15,504 14.6%
98 - Training 41,769 26,182 31,870 35,639 3,769 11.8%
99 - Administration 327,765 180,445 359,288 385,182 25,894 7.2%
Grand Total 924,499 488,114 1,024,919 1,052,393 27,474 2.7%
Funds:
10 - General 215,801 112,417 231,361 258,553 27,192 11.8%
20 - Water General 705,331 374,743 787,630 787,706 76 0.0%
57 - WW Portland 3,135 358 5,928 6,134 206 3.5%
61 - WW Gorham 0 358 0 0 0 n/a
62 - WW Westbrook 232 238 0 0 0 n/a
Grand Total 924,499 488,114 1,024,919 1,052,393 27,474 2.7%
Staffing Trend:
Full-Time 7 7 7 7 0 0.0%
Part-Time 1 1 1 1 0 0.0%
Total 8 8 8 8 0 0.0%

186 Operating Expenses – Environmental Services
Environmental Services: Laboratory Service (L6)
Financial Summary:
2013
Actual
2014
Jan-Jun
2014
Budget
2015
Budget
Budget
Diff $
Budget
Diff %
Expense Type:
Salaries & Wages $410,407 $200,317 $413,192 $418,648 $5,456 1.3%
Employee Benefits 193,203 100,310 201,613 211,051 9,438 4.7%
Chemicals 4,281 2,257 3,106 4,006 900 29.0%
Contracted Services 57,653 20,272 48,814 56,637 7,823 16.0%
Heat/Fuel Oil 1,111 434 1,305 1,309 4 0.3%
Materials & Supplies 79,557 37,593 80,990 79,263 -1,727 -2.1%
Other Expense 69,222 42,833 76,225 71,735 -4,490 -5.9%
Transportation 4,566 2,076 4,021 4,399 378 9.4%
Grand Total 820,000 406,092 829,266 847,048 17,782 2.1%
Programs:
28 - Monitoring 218 0 0 0 0 n/a
41 - Pretreatment 66,145 35,837 67,144 66,506 -638 -1.0%
56 - Tech Ops Support 48,610 33,851 64,009 55,738 -8,271 -12.9%
63 - Sample Analysis 402,094 188,270 394,947 371,814 -23,133 -5.9%
78 - Education 155 241 2,571 1,603 -968 -37.7%
98 - Training 27,414 15,133 29,284 28,683 -601 -2.1%
99 - Administration 275,364 132,760 271,311 322,704 51,393 18.9%
Grand Total 820,000 406,092 829,266 847,048 17,782 2.1%
Funds:
10 - General 244,874 112,182 240,758 288,500 47,742 19.8%
20 - Water General 229,765 119,421 244,250 237,849 -6,401 -2.6%
50 - Wastew ater General 233,501 126,246 249,837 224,495 -25,342 -10.1%
51 - WW Cape Elizabeth 2,614 317 1,000 1,980 980 98.0%
57 - WW Portland 72,312 32,020 56,495 58,024 1,529 2.7%
61 - WW Gorham 4,310 1,837 6,431 4,940 -1,491 -23.2%
62 - WW Westbrook 20,529 10,437 22,073 20,730 -1,343 -6.1%
64 - WW Joint Westbrook 10,067 2,347 6,822 9,605 2,783 40.8%
66 - WW Peaks Island 2,028 1,285 1,600 925 -675 -42.2%
Grand Total 820,000 406,092 829,266 847,048 17,782 2.1%
Staffing Trend:
Full-Time 7 7 7 7 0 0.0%
Part-Time 0 0 0 0 0 n/a
Total 7 7 7 7 0 0.0%

187 Operating Expenses – Engineering Services
Engineering Services - Purpose Statement
To provide direct and supported design and construction of water, wastewater and administrativeinfrastructure and support an asset management approach to infrastructure acquisition andmaintenance.
Core Services
Engineering Services is responsible for providing engineering and maintenance services to internal andexternal customers. They are responsible for the following services:
Manages planning and design of developer installed water and sewer infrastructure andcoordination of existing District field and facilities assets. Supports long range planning,alternatives evaluation, and detailed design development of water main renewal programs aswell as treatment and pumping facility projects. Provides construction oversight/recordkeepingfor all infrastructure projects. (Asset Engineering Services Group, E2; purple in organizationchart).
Responsible for operation and maintenance of administrative facilities. Provides facility supportservices including garage, structural maintenance and stock room services (Facility ServicesGroup-C1; blue in organization chart).
Provides design, installation, maintenance and technical support of the Supervisory Control andData Acquisition (SCADA) systems (Instrumentation Group-E7; red in organization chart).
Director of Asset Managementand Planning
Utility AssetCoordinator
Engineering ServicesManager
EngineeringTechnician
Senior ProjectEngineer
InstrumentationForeperson
Project Engineer
InstrumentationTechnician (2)
Engineering Tech II
Project Engineer (2)
Scheduler/Coordinator AMAP
Senior ProjectEngineer
Design Engineer
Utility AssetCoordinator
Right Of Way Agent
Asset ManagementTechnician (3)
Senior ProjectEngineer
AdministrativeFacilities Chief
Operator
Millwright
Facilities SupportGeneralist
Facility MaintenanceForeperson
Garage Foreperson
Garage Mechanic
FacilitiesMaintenanceTechnician (3)
Inventory ControlLead Person

188 Operating Expenses – Engineering Services
Key Statistics
New Water Services
Assets in the AssetInformationManagement System (AIM)
Performance Benchmarks
Corporate Goal – Reliability 2013 Actual 2014 Projected 2015 GoalLeaks per 100 miles of main 10.9 <25 <25Main Renewals, feet 24,500 29,500 27,000Main Extensions, feet 10,700 8,000 11,000SCADA telemetry uptime (Wastewater), percent 99.64 99.00 99.00SCADA telemetry uptime (Water), percent 98.92 99.00 99.00
Corporate Goal - AffordabilityNew Water Services 300 300 350
Corporate Goal – Employees and Work EnvironmentEmployee Training Hours 83 85 80
0
100
200
300
400
500
600
700
800
900
1000
2005 2007 2009 2011 2013 2015
New Service Applications
Serviceline Installs
Serviceline Activations
Facilities 141
Facility Processes & Systems 1,318
Equipment/Components 9,144
Vehicles/Heavy Equipment 109
Water Service Association Assets (meters, backflows, etc) 209,300
Water Field Assets 45,776
Sewer Field Assets 6,436
Total Assets 272,273

189 Operating Expenses – Engineering Services
Past Accomplishments
Implemented and supported improvements to water/wastewater process control anddocumentation through SCADA, data warehouse, digital control and radio projects.
Supported Wastewater vertical asset P&ID development and apprentice training.
Reviewed and ensured a one-to-one relationship between water service lines and billingaccounts in Falmouth as part of the Service-Associated Asset documentation effort.
Undertook project design and construction support efforts at wastewater treatment facilities todeliver identified capital improvements, including EEWWTF aeration upgrade preliminarydesign.
Renewed more than 5 miles of water mains as lead agency and as a partner with MDOT andmunicipalities. Undertook water and sewer main design and construction in support ofCombined Sewer Overflow (CSO) initiatives in the Cities of Portland and Westbrook.
Continued building envelope improvements with additional roof projects at Douglass St and theSouth Portland Metering Station.
Managed construction of new customer service entrance to Douglass St.
Coordinated and provided internal lead for construction of the Peaks Island Sewer project.
Supported the construction project for UV/Ozone disinfection upgrade project at Sebago LakeWater Treatment Facility (SLWTF).
Projects and Initiatives
Corporate Goal – Public Health
Continue lead/support role of design and construction of EEWWTF aeration upgrade project.
Corporate Goals – Reliability and Affordability
Continue facility improvements including the Nixon Center Audio system and roof at theDouglass St facility and the Fore River Pump Station roof.
Continue to support development and deployment of the hierarchy browser and GIS AIMSpatialasset management tools.
Continue development of wastewater capital project delivery through Engineering Services.Projects include work at all wastewater treatment facilities
Continue implementation of project to improve quality and digital accessibility of Service-Associated Assets (Water Service line, Water Meter, Water Backflow, etc.).
Continue to support effort to move more work processes and asset data into the District’s AssetInformation Management (AIM) system.
Corporate Goal – Employees and Work Environment
Reach an average of 80 hours of training per employee.
Continue to support ongoing workplace safety management and training.

190 Operating Expenses – Engineering Services
2014 Highlights
Oversaw design and construction of DouglassSt. Customer Service entrance
Managed UV/Ozone Disinfection upgradeproject
Managed EEWWTF Aeration Upgrade project
Successfully partnered with Municipalities,Developers and MDOT to deliver water mainreplacement program through District

191 Operating Expenses – Engineering Services
2015 Goals
Lead and support implementation of improvedvertical asset definitions in Asset InformationManagement System (AIM)
Successfully manage design and construction ofEEWWTF Aeration Upgrade
Lead program to prioritize, design and constructwater main replacement program
Work cooperatively with WastewaterOperations to scope, prioritize, design anddeliver infrastructure renewal projects

192 Operating Expenses – Engineering Services
Financial Overview
The Engineering Services 2015 budget request is $4,011,001 which is $132,522 or 3.4% higher than lastyear’s budget. The group consists of 3 subgroups – Facility Services (C1), Asset Engineering (E2) andInstrumentation (E7).
Facility Services’ budget increases by $110,121 or 5.5% reflecting higher gasoline costs and increasedmaintenance costs.
Asset Engineering’s budget increases by $22,071 or 1.4%. Salaries/Wages/Benefits increases arepartially offset by reduction in engineering project charge-offs.
Instrumentation‘s budget is $330 or 0.1% higher due to Salaries/Wages/Benefits increases offset byreductions in certain inventories.
Significant Expense Type changes in 2015 are listed below:
Salaries, Wages and Employee Benefits
No changes in the number of employees are planned for 2015. Increase reflects salary increase of 2.0%and higher allocated benefits costs, primarily due to the increases in pension plan costs.
Contracted Services
There is a $33,573 increase in Maintenance Services. This is primarily due to increases in grounds andvehicle maintenance.
Deferred Cost W/O
The line item includes an increase of $7,600 to reflect costs related to the Wastewater CSO Master PlanStudy.
Heat/Fuel Oil
This line was decreased $8,955 (6.3%) to reflect the decrease in per gallon costs ($3.06 from $3.30) forDouglass Street heating oil. The usage was kept constant to reflect the 3-year actual usage.
Materials and Supplies
The line item includes an increase of $18,810 in unleaded gas reflecting higher unit prices.
Other Expenses
The line item includes an increase in the credit to the O&M budget for engineering costs allocated tocapital projects of $9,860.
Transportation
The line item includes an increase in inactive internal transportation costs of $21,070.

193 Operating Expenses – Engineering Services
Engineering Services – Total
Financial Summary
2013
Actual
2014
Jan-Jun
2014
Budget
2015
Budget
Budget
Diff $
Budget
Diff %
Sub-Groups:
C1 - Facilities Services $1,779,072 $986,658 $1,984,546 $2,094,667 $110,121 5.5%
E2 - Asset Engineering 1,544,216 727,317 1,564,399 1,586,470 22,071 1.4%
E7 - Instrumentation 303,316 161,701 329,534 329,864 330 0.1%
Grand Total 3,626,604 1,875,676 3,878,479 4,011,001 132,522 3.4%
Expense Types:
Salaries & Wages 1,632,037 771,303 1,656,554 1,676,192 19,638 1.2%
Employee Benefits 848,049 405,189 849,582 885,891 36,309 4.3%
Contracted Services 335,629 205,440 390,672 438,746 48,074 12.3%
Deferred Cost W/O 11,802 5,901 11,802 19,402 7,600 64.4%
Heat/Fuel Oil 124,603 85,324 143,200 134,245 -8,955 -6.3%
Insurance 42,018 21,400 41,717 44,644 2,927 7.0%
Materials & Supplies 492,163 291,302 566,618 585,258 18,640 3.3%
Other Expense -72,089 -32,825 -50,840 -58,000 -7,160 14.1%
Purchased Pow er 70,994 33,958 75,442 73,360 -2,082 -2.8%
Tele/Other Utilties 70,274 38,889 91,100 85,213 -5,887 -6.5%
Transportation 71,124 49,795 102,632 126,050 23,418 22.8%
Grand Total 3,626,604 1,875,676 3,878,479 4,011,001 132,522 3.4%
Staffing Trend:
Full-Time 30 30 30 30 0 0.0%
Part- Time 0 0 0 0 0 n/a
Total 30 30 30 30 0 0.0%

194 Operating Expenses – Engineering Services
2013 2014 2014 2015
Actual Jan-Jun Budget Budget Diff $ Diff %
Salaries & Wages
660111 - SALARIES/WAGES NON-UNION $915,803 $407,103 $898,127 $897,917 ($210) 0.0%
660121 - WAGES/REGULAR UNION 716,986 354,269 709,254 729,464 20,210 2.8%
660122 - WAGES/OVERTIME UNION 4,567 1,116 6,121 9,418 3,297 53.9%
660123 - WAGES/DOUBLETIME UNION - - 4,861 1,481 (3,380) -69.5%
660124 - WAGES/STANDBY TIME UNION 293 226 232 472 240 103.4%
660131 - WAGES - REGULAR - TEMPS 28,108 8,589 37,959 37,440 (519) -1.4%
66014 - VACATION ACCRUAL (8,347) - - - - n/a
66015 - SICKTIME ACCRUAL (25,373) - - - - n/a
Salaries & Wages Total 1,632,037 771,303 1,656,554 1,676,192 19,638 1.2%
Employee Benefits
660401 - FICA - EMPLOYERS' SHARE 122,778 56,982 126,726 128,229 1,503 1.2%
660405 - SAFETY/WHY PROGRAM ITEMS 5,471 797 5,210 7,415 2,205 42.3%
660411 - MEALS ALLOWANCE 10 20 40 40 - 0.0%
660413 - PWD TRAINING PROGRAM 355 14 - - - n/a
660418 - STIPENDS 1,900 1,800 2,000 2,100 100 5.0%
660419 - EMPLOYEE BENEFTS-MISC OTH 6,431 927 - - - n/a
660491 - FRINGE BENEFITS-REG/SAL 711,104 344,649 715,606 748,107 32,501 4.5%
Employee Benefits Total 848,049 405,189 849,582 885,891 36,309 4.3%
Contracted Services
6631 - ENGINEERING SERVICES 7,299 2,408 5,000 5,000 - 0.0%
6635221 - PAVING - MINOR REPAIR 426 - - - - n/a
663524 - STREET OPENING - 194 - - - n/a
663525 - CONTRACTOR CONSTRUCTION 500 - - - - n/a
663526 - INSPECTION SERVICES 1,193 13 - - - n/a
66353 - REPAIR SERVICES 3,741 6,385 5,000 10,000 5,000 100.0%
66354 - MAINTENANCE SERVICES 201,099 126,309 253,600 287,173 33,573 13.2%
663561 - COMPUTER LICENSES 21,520 19,157 25,120 25,120 - 0.0%
663562 - COMPUTER MAINTAINENCE 3,000 - 250 250 - 0.0%
663563 - COMPUTER CONSULTING/OTHER - - 800 800 - 0.0%
663574 - DISPOSAL SERVICES 15,024 8,373 18,100 21,600 3,500 19.3%
663587 - COURIER SERVICES 9,004 4,495 8,802 8,553 (249) -2.8%
663588 - EQUIPMENT MAINTENANCE - 125 5,000 5,250 250 5.0%
663589 - SECURITY SERVICES 67,066 35,203 65,000 71,500 6,500 10.0%
663591 - APPRAISAL SERVICES 900 - - - - n/a
663599 - MISC OTHER SERVICES 4,857 533 2,000 2,500 500 25.0%
6636 - TECHNICAL SERVICES - 2,245 2,000 1,000 (1,000) -50.0%
Contracted Services Total 335,629 205,440 390,672 438,746 48,074 12.3%
Deferred Cost W/O
66754 - DEFERRED COSTS WRITE OFF 11,802 5,901 11,802 19,402 7,600 64.4%
Deferred Cost W/O Total 11,802 5,901 11,802 19,402 7,600 64.4%
Heat/Fuel Oil
66161 - HEATING OIL 112,927 76,309 125,400 116,265 (9,135) -7.3%
661621 - PIPELINE DELIVERED PROPAN 1,640 925 1,800 1,980 180 10.0%
66166 - UNLEADED GAS 10,036 8,090 16,000 16,000 - 0.0%
Heat/Fuel Oil Total 124,603 85,324 143,200 134,245 (8,955) -6.3%

195 Operating Expenses – Engineering Services
2013 2014 2014 2015
Actual Jan-Jun Budget Budget Diff $ Diff %
Insurance
6656 - VEHICAL INSURANCE $29,261 $14,045 $28,090 $30,056 $1,966 7.0%
66561 - VEHICAL INSURANCE REIMBUR (1,357) 541 - - - n/a
66593 - UMBRELLA INSURANCE COVER 7,838 3,534 7,069 7,564 495 7.0%
66599 - PROPERTY & BOILER INSUR 6,276 3,280 6,558 7,024 466 7.1%
Insurance Total 42,018 21,400 41,717 44,644 2,927 7.0%
Materials & Supplies
6619 - ASSET PURCHASES 15,949 12,746 25,250 32,750 7,500 29.7%
66202 - TOOLS 11,940 1,556 12,150 12,000 (150) -1.2%
66203 - VENDOR PURCHASED SUPPLIES 144,859 84,050 188,450 180,915 (7,535) -4.0%
662041 - MATERIALS INVENTORY (73) 34,004 7,300 7,750 450 6.2%
662042 - SUPPLIES INVENTORY 17,751 9,547 17,800 17,050 (750) -4.2%
662043 - TOOL INVENTORY 13,304 5,774 9,775 11,000 1,225 12.5%
66204301 - INVENTORY - TONER 2,341 - 750 - (750) -100.0%
66204302 - INVENTORY - PAPER 561 63 500 500 - 0.0%
66204303 - INVENTORY-COMPUTER EQUIP 4,677 2,595 2,300 3,300 1,000 43.5%
662044 - METER INVENTORY (2,246) 1,432 - - - n/a
662046 - HYDRANT INVENTORY (2,044) 21 - - - n/a
662047 - GARAGE INVENTORY 6,856 4,332 8,850 8,850 - 0.0%
66204701 - INVENTORY - UNLEADED GAS 163,553 81,564 168,720 187,530 18,810 11.1%
66204702 - INVENTORY - DIESEL 87,820 41,261 92,510 91,512 (998) -1.1%
66204703 - INVENTORY - TIRES 20,598 6,914 15,000 15,000 - 0.0%
66205 - CONSUMABLE SUPPLIES 1,681 939 4,350 4,100 (250) -5.7%
66206 - COMPUTER EQUIPMENT - - - 13,001 13,001 n/a
663564 - COMPUTER-RELATED EQUIP 4,636 4,504 12,913 - (12,913) -100.0%
Materials & Supplies Total 492,163 291,302 566,618 585,258 18,640 3.3%
Other Expense
6642 - EQUIPMENT RENT 3,202 - 2,500 2,500 - 0.0%
66601 - PUBLIC RELATIONS - 62 - - - n/a
66609 - OTHER ADVERTISING 681 - - - - n/a
6675111 - INSTATE TRAINING 8,358 8,983 10,000 10,500 500 5.0%
6675112 - OUT OF STATE TRAINING 9,127 84 7,000 7,000 - 0.0%
6675121 - IN STATE CONFERENCES 251 226 3,000 3,000 - 0.0%
6675122 - OUT-OF-STATE CONFERENCES 1,191 788 4,000 5,000 1,000 25.0%
667513 - DUES 1,265 514 2,550 2,850 300 11.8%
667514 - PROFESSIONAL LICENSES 2,145 1,103 3,350 3,450 100 3.0%
667515 - PERIODICAL SUBSCRIPTIONS 66 - 550 550 - 0.0%
667516 - PERMITS 1,150 710 2,500 2,500 - 0.0%
667521 - POSTAGE - THIRD PARTY 8 - - - - n/a
667522 - POSTAGE - INTERNAL 437 170 500 500 - 0.0%
667523 - POSTAGE - EXPRESS DELIVER 1,111 554 - 800 800 n/a
667552 - SAFETY TRAINING - - 500 500 - 0.0%
667555 - SAFETY EXPENSES 458 - 1,500 1,500 - 0.0%
667556 - FREIGHT CHARGES (STOCK) 6,635 2,912 5,000 5,000 - 0.0%
667592 - FOOD SUPPLIES 358 - 50 50 - 0.0%
667599 - OTHER MISCELLANEOUS 3,637 239 500 500 - 0.0%
6676 - CONTRA ACCOUNT (112,169) (49,170) (94,340) (104,200) (9,860) 10.5%
Other Expense Total (72,089) (32,825) (50,840) (58,000) (7,160) 14.1%

196 Operating Expenses – Engineering Services
2013 2014 2014 2015
Actual Jan-Jun Budget Budget Diff $ Diff %
Purchased Power
66153 - POWER - MEDIUM ENERGY 46,127 21,876 49,178 49,178 - 0.0%
66154 - POWER - MEDIUM T&D 22,082 10,319 23,362 21,098 (2,264) -9.7%
66155 - POWER - SMALL ENERGY 1,344 859 1,440 1,771 331 23.0%
66156 - POWER - SMALL T&D 1,419 904 1,462 1,313 (149) -10.2%
66157 - FORWARD CAPACITY 22 - - - - n/a
Purchased Power Total 70,994 33,958 75,442 73,360 (2,082) -2.8%
Tele/Other Utilties
66101 - WATER 15,096 8,392 23,500 19,500 (4,000) -17.0%
66111 - TELEPHONE LINES 22,105 12,118 23,954 23,131 (823) -3.4%
66112 - DATA LINES 27,061 15,162 36,302 36,068 (234) -0.6%
66113 - CELLULAR PHONES 5,470 2,871 6,890 6,110 (780) -11.3%
66114 - PAGERS 542 346 454 404 (50) -11.0%
Tele/Other Utilties Total 70,274 38,889 91,100 85,213 (5,887) -6.5%
Transportation
66501 - TRANSPORTATION - INTERNAL 68,133 16,854 69,696 73,244 3,548 5.1%
665019 - TRANS INTERNAL INACTIVE - 31,166 22,761 43,831 21,070 92.6%
66502 - TRANSPORTATION - EXTERNAL 822 573 3,450 3,100 (350) -10.1%
66503 - MILEAGE REIMBURSEMENT 2,169 1,202 6,725 5,875 (850) -12.6%
Transportation Total 71,124 49,795 102,632 126,050 23,418 22.8%
Grand Total 3,626,604 1,875,676 3,878,479 4,011,001 132,522 3.4%

197 Operating Expenses – Engineering Services
Engineering Services - Facilities Services (C1)
Financial Summary
2013
Actual
2014
Jan-Jun
2014
Budget
2015
Budget
Budget
Diff $
Budget
Diff %
Expense Type:
Salaries & Wages $463,928 $222,752 $468,910 $481,188 $12,278 2.6%
Employee Benefits 235,527 116,433 238,028 253,041 15,013 6.3%
Contracted Services 297,841 183,617 357,502 379,253 21,751 6.1%
Heat/Fuel Oil 124,603 85,324 143,200 147,180 3,980 2.8%
Insurance 42,018 21,400 41,717 44,644 2,927 7.0%
Materials & Supplies 454,463 265,814 527,718 564,868 37,150 7.0%
Other Expense -7,798 -3,526 110 1,250 1,140 1036.4%
Purchased Pow er 70,994 33,958 75,442 73,360 -2,082 -2.8%
Tele/Other Utilties 59,993 33,292 76,988 72,655 -4,333 -5.6%
Transportation 37,503 27,594 54,931 77,228 22,297 40.6%
Grand Total 1,779,072 986,658 1,984,546 2,094,667 110,121 5.5%
Programs:
23 - Stockroom Operations 91,606 52,793 97,761 127,675 29,914 30.6%
24 - Distribution Operations 52,127 30,199 43,706 48,168 4,462 10.2%
30 - Maintenance 215,239 98,947 226,879 224,523 -2,356 -1.0%
55 - Prof Ops Support 67,871 37,565 43,037 69,012 25,975 60.4%
90 - Vehicles 623,365 309,036 712,123 711,374 -749 -0.1%
93 - Stockroom Scrap 7,998 22,688 250 250 0 0.0%
95 - Douglass Street 578,715 359,064 738,001 749,836 11,835 1.6%
98 - Training 27,493 23,729 35,818 35,156 -662 -1.8%
99 - Administration 114,658 52,637 86,971 128,673 41,702 47.9%
Grand Total 1,779,072 986,658 1,984,546 2,094,667 110,121 5.5%
Funds:
10 - General 1,342,699 744,414 1,572,913 1,625,040 52,127 3.3%
20 - Water General 293,065 187,132 249,870 322,383 72,513 29.0%
30 - Water Standish 11,606 293 16,287 11,857 -4,430 -27.2%
51 - WW Cape Elizabeth 26,498 11,837 19,544 22,164 2,620 13.4%
53 - WW Cumberland 6,927 5,425 8,960 8,974 14 0.2%
55 - WW Windham LF 206 0 110 130 20 18.2%
57 - WW Portland 65,515 29,285 78,454 71,785 -6,669 -8.5%
61 - WW Gorham 7,090 2,088 8,811 7,353 -1,458 -16.5%
62 - WW Westbrook 4,811 1,582 4,433 4,353 -80 -1.8%
64 - WW Joint Westbrook 13,692 2,142 20,226 17,058 -3,168 -15.7%
65 - WW Joint LF 1,125 495 1,200 1,200 0 0.0%
66 - WW Peaks Island 5,838 1,965 3,738 2,370 -1,368 -36.6%
Grand Total 1,779,072 986,658 1,984,546 2,094,667 110,121 5.5%
Staffing Trend:
Full-Time 10 10 10 10 0 0.0%
Part-Time 0 0 0 0 0 n/a
Total 10 10 10 10 0 0.0%

198 Operating Expenses – Engineering Services
Engineering Services -Asset Engineering Services (E2)
Financial Summary
2013
Actual
2014
Jan-Jun
2014
Budget
2015
Budget
Budget
Diff $
Budget
Diff %
Expense Type:
Salaries & Wages $1,012,572 $476,684 $1,030,395 $1,035,220 $4,825 0.5%
Employee Benefits 534,010 250,502 529,865 547,331 17,466 3.3%
Contracted Services 20,343 2,665 9,800 10,300 500 5.1%
Deferred Cost W/O 11,802 5,901 11,802 19,402 7,600 64.4%
Materials & Supplies 19,317 5,834 12,100 11,813 -287 -2.4%
Other Expense -68,918 -30,965 -61,050 -69,750 -8,700 14.3%
Tele/Other Utilties 7,586 3,984 10,042 8,708 -1,334 -13.3%
Transportation 7,504 12,712 21,445 23,446 2,001 9.3%
Grand Total 1,544,216 727,317 1,564,399 1,586,470 22,071 1.4%
Programs:
57 - Means Coordination 210,779 111,644 285,052 286,395 1,343 0.5%
79 - Amap Services 347,633 215,816 483,212 487,324 4,112 0.9%
94 - Technology Teams 235,990 108,514 266,252 259,140 -7,112 -2.7%
98 - Training 74,260 44,078 74,017 73,955 -62 -0.1%
99 - Administration 675,554 247,265 455,866 479,656 23,790 5.2%
Grand Total 1,544,216 727,317 1,564,399 1,586,470 22,071 1.4%
Funds:
10 - General 882,554 375,133 689,238 708,823 19,585 2.8%
20 - Water General 497,879 275,166 635,927 635,716 -211 0.0%
50 - Wastew ater General 36,632 18,419 228,548 223,122 -5,426 -2.4%
51 - WW Cape Elizabeth 3,245 1,975 0 0 0 n/a
53 - WW Cumberland 1,059 0 0 0 0 n/a
55 - WW Windham LF 114 0 0 0 0 n/a
57 - WW Portland 32,871 30,227 84 207 123 146.4%
61 - WW Gorham 398 0 0 0 0 n/a
62 - WW Westbrook 10,602 6,830 10,602 18,602 8,000 75.5%
64 - WW Joint Westbrook 28,140 10,662 0 0 0 n/a
66 - WW Peaks Island 50,722 8,905 0 0 0 n/a
Grand Total 1,544,216 727,317 1,564,399 1,586,470 22,071 1.4%
Staffing Trend:
Full-Time 17 17 17 17 0 0.0%
Part-Time 0 0 0 0 0 n/a
Total 17 17 17 17 0 0.0%

199 Operating Expenses – Engineering Services
Engineering Services - Instrumentation Services (E7)
Financial Summary
2013
Actual
2014
Jan-Jun
2014
Budget
2015
Budget
Budget
Diff $
Budget
Diff %
Expense Type:
Salaries & Wages $155,538 $71,866 $157,248 $159,785 $2,537 1.6%
Employee Benefits 78,512 38,254 81,690 85,519 3,829 4.7%
Contracted Services 17,445 19,157 23,370 23,370 0 0.0%
Materials & Supplies 18,382 19,654 26,800 21,465 -5,335 -19.9%
Other Expense 4,627 1,666 10,100 10,500 400 4.0%
Tele/Other Utilties 2,695 1,612 4,070 3,850 -220 -5.4%
Transportation 26,117 9,492 26,256 25,375 -881 -3.4%
Grand Total 303,316 161,701 329,534 329,864 330 0.1%
Programs:
81 - Instrumentation & Control 182,642 75,856 206,481 187,247 -19,234 -9.3%
94 - Technology Teams 16 0 3,085 1,861 -1,224 -39.7%
98 - Training 12,889 8,327 18,609 18,755 146 0.8%
99 - Administration 107,769 77,518 101,359 122,001 20,642 20.4%
Grand Total 303,316 161,701 329,534 329,864 330 0.1%
Funds:
10 - General 120,675 85,846 123,053 142,616 19,563 15.9%
20 - Water General 53,271 26,876 73,911 63,525 -10,386 -14.1%
50 - Wastew ater General 14,916 11,315 57,919 58,181 262 0.5%
51 - WW Cape Elizabeth 25,616 4,463 500 425 -75 -15.0%
53 - WW Cumberland 2,483 0 1,000 850 -150 -15.0%
57 - WW Portland 53,135 10,365 70,751 62,407 -8,344 -11.8%
61 - WW Gorham 6,910 5,549 500 425 -75 -15.0%
62 - WW Westbrook 11,202 4,675 500 425 -75 -15.0%
64 - WW Joint Westbrook 6,959 7,114 800 560 -240 -30.0%
65 - WW Joint LF 2,420 1,071 0 0 0 n/a
66 - WW Peaks Island 5,729 4,427 600 450 -150 -25.0%
Grand Total 303,316 161,701 329,534 329,864 330 0.1%
Staffing Trend:
Full-Time 3 3 3 3 0 0.0%
Part-Time 0 0 0 0 0 n/a
Total 3 3 3 3 0 0.0%

200 Operating Expenses – Administrative Services
Administrative Services - Purpose Statement
To provide support services to internal and external customers
Core Services
Administrative Services provides support services to internal and external customers by providing thefollowing services:
External customers’ call center response and billing services (Customer Service Group- F1; greenin the organization chart).
Computer system and related technology support and maintenance services (InformationServices Group – G1; orange in the organization chart).
Financial transaction processing and information services (Financial Services Group – H1; blue inthe organization chart).
Employee development, benefits and management services (Employee Services Group – I1;purple in the organization chart).
The District has a seven-person group (Executive Group – J1; black in the organization chart) that directs,oversees and provides administrative support for the District.
General Manager
Executive Director ofAdministration
Information ServicesManager
Business SystemAnalyst
NetworkAdministrator (3)
I, II, III
BSA/GIS Analyst
DatabaseAdministrator
Director OfCustomer Service
Customer ServiceSupervisor
Customer ServiceCoordinator (6)
CollectionsCoordinator
AMR Specialist
Control CenterOperator (3)
Customer ServiceProgram Manager
Director of FinancialServices
Admin AssistantFinance (3)
Financial Analyst (3)
Financial AnalystAssistant
Buyer / Purchasing
Corporate Counsel
ExecutiveAdministrative
Assistant
Employees ServicesDirector
Safety and TrainingConsultant
Employee ServicesConsultant
Public RelationsManager
Executive Director ofAMAP

201 Operating Expenses – Administrative Services
Past Accomplishments and 2015 Projects and Initiatives
Customer Service
Past Accomplishments
Title Check Program: Self-service on the WEB to ReducePhone Calls: When a property is being sold, titlecompanies call PWD to obtain outstanding water andsewer balances so full payment can be collected at theclosing. PWD created a WEB program allowing titlecompanies to obtain this information themselves withoutinvolving PWD’s call center. From August 2013 throughAugust 2014 the Title Check WEB program has reducedthe number of customer rep assisted phone calls by 60%.
.
Paperless Bills: We continued our campaign toincrease the number of paperless bills by running a contest for a drawing to Win Free Water forA Year for customers who signed up for paperless bills. We increased the number of paperlessbills by 14% in 2014. We expect to have a total of 12,230 customers on paperless bills by yearend, for an annual savings of $79,250.
Rates: PWD Water rates were updated and tested as well as sewer rates for the City of Portland,City of South Portland, and the Town of Cape Elizabeth.
RFP for Bill Printing: The contract for bill printing, mailing and billing supplies went out to bid in2014.We secured a 3 year contract with Direct Mail of Maine and Tall Oaks Printing. Thecontract included a price reduction for DMM’s labor and a price reduction in the cost of billstatement forms
Memorandum of Understanding (MOU): A Memorandums of Understanding, outlining sewerbilling and collection services provided by PWD to participating municipalities, was created foreach municipality.
Submeters: June 2014 completed a one year pilot program for Portland customers to purchasesubmeters from the City instead of PWD. The program was a success and will be rolled out toother sewer municipalities in the near future. The program clarifies the municipality’s ownershipof the submeter program.
Training: Our field training program for CS employees continued into 2014 with visits to theecology center and the Sebago Lake Water Treatment Facility. The SLWTF included tours of thelab and the new UV disinfection area.
Paperless WOs and SRs for Utility Specialists: Customer Service participated on a team with
water operations to eliminate printing daily work orders used by Utility Specialists. Under the
new process the Utility Specialists use their truck laptops to access orders and complete their
work. CS staff now processes completed work by report rather than stacks of printed orders.
20
13
20
14
0
1000
2000
3000
4000
5000
Rep Assisted Title Check Calls60% Reduction

202 Operating Expenses – Administrative Services
Past Accomplishments and 2015 Projects and Initiatives (continued)
Customer Service (continued)
2015 Projects and Initiatives
Paper-free Bill Campaign: We will continue to work on increasing the number of customers whochoose environmentally friendly, paper-free bills to keep costs as low as possible.
MOU and New Submeter Process: Meetings will be set up with wastewater municipalities whoreceive our billing and collection services to review their newly created Memorandum ofUnderstanding. As part of the MOU, we will recommend each municipality move to the newsubmeter process where the municipality sells and inspects the submeter, and PWD ships it. TheMOU will be an addendum to the contract we currently have with municipalities who receiveour sewer billing and collection services.
ITRON Equipment Upgrade: We expect our automated mobile meter reading equipment andhandheld units to be replaced in 2015. This may also involve an upgrade of our meter readingsoftware called MVRS. Our original equipment is aging and will not be able to read the new100w ERTS that are replacing the 60w ERTS we currently install.
Rates: PWD water rates and wastewater rates for municipalities who are changing their rateswill be updated in our billing system and tested to ensure bills are accurate.
Automated Processing to Finalize or Establish Service: PWD receives approximately 400requests each month to open or close an account due to change of ownership. A meter readingis required to start or end billing, and several fields in the customer billing system are manuallyupdated. We would like to automate the manual processing to be more efficient and accurate.
SMART Form for Self-service on the WEB: We will explore creating a form on the WEB thatallows customers to self-help rather than contact our call center for assistance. Depending onwhat type of self-service we decide to allow, we may need to build intelligence into the formthat looks to the billing system to approve or deny the self-service request. If denied thecustomer would be advised to call us to speak with a customer service representative.
Create SMART Report for URR (Usage Reading Review): We manually review usage before billingfor anomalies (high usage, negative usage, usage but no one to bill, etc.). The anomalies aredisplayed on a screen in the billing system but are not captured on a report. Once reviewed theinformation disappears. We want to create a report that preserves the data and builds in theintelligence, currently provided by staff, to screen the data.
Key Statistics
2013Actual
2014Projected
2015Goal
Customers Served 53,790 54,000 54,500
Phone calls answered within 1 min 81.00% 85.00% 82.00%
Customer satisfaction 98.00% 97.00% 97.00Actual vs Estimated Reads 99.67% 99.57% 99.00%Accurate bill index 99.97% 99.96% 99.85%Customer ContactsBills Produced
51,552 55,700 57,500
Bills Produced 633,604 636,000 631,000

203 Operating Expenses – Administrative Services
Past Accomplishments and 2015 Projects and Initiatives (continued)
Information Services
2014 Highlights
Computer Infrastructure Projects
VDI Deployment – Converted end user machines to virtual desktops
Windows 7 Upgrade from Windows XP
Call Rex – Upgraded enterprise call recording system.
WINOPS – Lab Data collection server – increased performance by
200%
3 Citrix Servers Migration of the following servers from Physical to
Virtual ( reducing overall server count by 5 servers)
Water Treatment Facilities Projects
Fiber upgrade at Ozone Plant Speed increase from 5MB to 20MB
Cold Site Phase 1 at Ozone Plant – First phase of developing a
redundant data center.
Wi-Fi Installation at Ozone Plant and Resource Center
Replacement Ozone DHCP Server – Critical server used to enable
network logons.
Computer Security
SCADA Security Audit - Installation of SCADA Virus Scan Stations –
Used to ensure now virus can be transferred onto SCADA network
via contractor USB keys.
System Development and Process Projects
Vehicle Booking Workflow – Automated booking and tracking
application.
New CIP Database – Used to track Capital Improvement Programs at
PWD.
Redesign of PWD.ORG website – Enable viewing of pwd.org website
on mobile devices.
Timecard automation of Hansen data to Pentamation.
Email to Project Logs – Integrates Outlook and our Asset
Management System.
Vehicle Utilization Electronic Sign Off
SharePoint Document Management Pilot
Paperless Timecard

204 Operating Expenses – Administrative Services
Past Accomplishments and 2015 Projects and Initiatives (continued)
Information Services
2015 Projects and Initiatives
Computer Infrastructure Projects
Mail Server Upgrade to Exchange
2010
Phone system software upgrade
Active Directory Upgrade – used to
manage network users.
SharePoint Upgrade to SharePoint
2013
Crystal Enterprise Upgrade – PWD
reporting system
Upgrade GIS to ESRI 10.1 – PWD’s
mapping software
Microsoft Office Upgrade to Office
2013
Hansen Server Upgrade – Upgrade of
physical server that runs our asset
management system and billing
system.
System Development and Process Projects
SharePoint Document Management
SharePoint Dashboards
Devices Maintained:Device Type 2012 2013 2014 2015
Servers 30 30 43 38
Virtual Servers 6 9 19 25
Laptops 60 54 54 55
CPU 52 40 30 25
Thin Clients 95 112 120 130
Firewall 3 3 3 3
Switches 32 24 26 28
Routers 5 5 5 5
Phone Switches 11 11 11 11
Desk Phones 162 164 164 168
Smart Phones 16 19 18 18
Printers/Scanner 40 47 47 47
Copiers 8 8 8 8
Tablets 3 16 20 20
Total 523 542 564 581
Major Software:
AutoCAD
CallRex Call Recording
Citrix Presentation Server and XenServer
Crystal Reports
ESRI Geographic Information Systems
Hach WIMS
Hansen Asset Management/Customer Relation
Informix (1), Oracle (3) and SQL (1) databases
Microsoft Office 2010
Pentamation Financial
SharePoint Enterprise 2010
ShoreTel IP Phone System
Windows Server 2008

205 Operating Expenses – Administrative Services
Past Accomplishments and 2015 Projects and Initiatives (continued)
Financial Services
Past Accomplishments
Received Government Finance Officers Association’s "Certificate of Achievement for Excellencein Financial Reporting" for the 2011 CAFR which was the 16th annual award in a row and the"Distinguished Budget Presentation Award" for the 2013 Comprehensive Budget Report whichwas the third year in a row.
Put in place a feature that allows managers to view scanned copies of paid vendor invoices fromtheir computers via the SharePoint and the Pentamation software.
Developed process to bring payroll data directly from the Hansen timecard system to thePentamation payroll system eliminating the manual input of timecard and eliminating potentialdata input errors.
Put in place a process for the electronic request and approval of fixed capital project requestforms.
2015 Projects and Initiatives
Develop and put in place a process for electronic review and approval of employee timecards.
Link all fixed asset additions between the Pentamation financial system and the Hansen assetsystem via Hansen’s asset valuation module.
Develop and put in place a process a new database for managers to input and create theirannual labor budget requests that will give them immediate feedback on changes they aremaking and that will eliminate manual input to the Finance system.
Key statistics
Significant financial transaction processing:
Payroll (weekly, 9,600 checks/year)
Vendor payment (weekly, 6,150 check/year)
Customer Bill payments (daily, 600,000/year)
Fixed Capital (FC) project requests processed (daily, 550/year)
Requisitions/Purchases orders processed/created (daily, 1,600/year)
0.0%
10.0%
20.0%
30.0%
40.0%
50.0%
60.0%
2009 2010 2011 2012 2013
Customer Payments by Type
Check
Electronic
Internal

206 Operating Expenses – Administrative Services
Past Accomplishments and 2015 Projects and Initiatives (continued)
Employee Services
Past Accomplishments
Based on the 3 year Labor Contract negotiated in 2012-3, the following agreed to changes wereimplemented in 2014:
o Employee-only medical cost sharing increased another 1% this yearo the traditional monthly pension increased by another $0.25 (defined benefit plan)o “reasonable suspicion drug testing” was put in place
Received Board approval to modify the Defined Benefit to ensure same gender couples who arelegally married are recognized in Maine, and are legally eligible for spousal benefits regardless oftheir ultimate State of residency.
Several policies were updated, communicated and distributed.
Conducted bi-annual salary survey for Union and non-Union positions.
Captured all employee required license and certification requirements in electronicformat. Obtained cross-functional alignment.
Clarified required safety training by job function, and improved tracking and reportingmechanisms.
2015 Projects and Initiatives
Preparation for labor negotiations as the current labor contract expires in November 2015.
Employee satisfaction survey will be conducted, evaluated, and related action items initiated.
Collaborate with Finance to implement Affordable Care Act employer reporting requirements tothe IRS.
Union and non-Union defined benefit plans will be re-stated.
Continue to review and potentially modify the medical plan design to diminish/avoid the 2018“Cadillac Tax” (40% excise tax).
Implement re-modeled accident/incident reporting form and process.

207 Operating Expenses – Administrative Services
Financial Overview
The Administrative Services budget request is $5,249,828, which is $178,714 or 3.5% higher than lastyear. The number of employees remains the same at 40 with one employee, the Customer ServiceProgram Manager, increasing his hours to 40 hours per week from 24 hours.
Information Service (G1) Group ($926,077 request; $7,610 or 0.8% lower)
Salaries/Wages and Benefits: Same number of positions however Network Administrator Iadded and part-time Strategic Project Manager eliminated.
Contracted Services: Reduced the amount needed for third-party consulting and maintenancecosts
Other Expenses: Reduced the amount of planned training.
Financial Services (H1) Group ($958,329 request; $5,586 or 0.6% higher)
Salaries/Wages and Benefits: Same level of staffing. Decrease attributed to lower salary of newemployee compared with the longer tenured employee who left the District.
Contracted Services: Increase in fees related to higher number on-line payments.
Other Expenses: Reduced the amount of planned training
Employee Service (I1) Group ($415,724 request; $25,073 or 6.4% higher)
Salaries/Wages and Benefits: No staffing changes planned.
Contracted Services: Additional legal expenses planned due to 2015 being a year the unioncontract needs to be renegotiated.
Other Expenses: Increased the amount of planned training.
Executive (J1) Group ($1,428,623 request; $89,586 or 6.7% higher)
Salaries/Wages and Benefits: No staffing changes planned.
Contracted Services: The periodic customer satisfaction survey is planned for 2015
Other Expenses: Additional amount is included to cover expenses related to water deregulationeffort and search for a new general manager.
Customer Service (F1) Group ($1,521,075 request; $66,079 or 4.5% higher)
Salaries/Wages and Benefits: Same number of position however Customer Service ProgramManager added and Control Center Operator position eliminated. Additionally, a summer-timetemporary was added.
Contracted Services : Decrease costs due to the cost savings related to higher number ofcustomer opting to receive their bills electronically rather than through the mail. Also, the billprinting service was put out to bid resulting in lower costs.
Materials & Supplies: Meter reading equipment that was in last year’s operating budget wasnot purchased. The plan is to purchase in 2015 but costs will be included in the capital budget.
Other Expenses: Postage rate increase of 1 cent incorporated into the budget.

208 Operating Expenses – Administrative Services
Administrative Services: Total
Financial Summary:
2013
Actual
2014
Jan-Jun
2014
Budget
2015
Budget
Budget
Diff $
Budget
Diff %
Sub-Groups:
F1 - Customer Service $1,382,662 $696,923 $1,454,996 $1,521,075 $66,079 4.5%
G1 - Information Services 871,354 432,047 933,687 926,077 -7,610 -0.8%
H1 - Financial Services 971,154 518,789 952,743 958,329 5,586 0.6%
I1 - Employee Services 411,781 174,053 390,651 415,724 25,073 6.4%
J1 - BOT & Senior Management 1,222,511 612,009 1,339,037 1,428,623 89,586 6.7%
Grand Total 4,859,462 2,433,821 5,071,114 5,249,828 178,714 3.5%
Expense Types:
Salaries & Wages 2,322,859 1,139,786 2,397,165 2,469,891 72,726 3.0%
Employee Benefits 1,151,400 592,551 1,234,908 1,307,111 72,203 5.8%
Contracted Services 757,653 414,324 762,105 747,824 -14,281 -1.9%
Deferred Cost W/O 21,954 5,043 10,086 10,086 0 0.0%
Insurance 81,947 35,076 71,213 78,057 6,844 9.6%
Materials & Supplies 57,731 26,522 57,053 49,388 -7,665 -13.4%
Other Expense 402,148 196,936 490,466 536,660 46,194 9.4%
Tele/Other Utilties 26,969 12,072 24,800 28,022 3,222 13.0%
Transportation 36,801 11,511 23,318 22,789 -529 -2.3%
Grand Total 4,859,462 2,433,821 5,071,114 5,249,828 178,714 3.5%
Staffing Trend:
Full-Time 39 38 38 39 1 2.6%
Part- Time 1 2 2 1 -1 -50.0%
Total 40 40 40 40 0 0.0%
$88
$95
$97$96
$92$94
$96$95 $95 $95
$96
$82
$84
$86
$88
$90
$92
$94
$96
$98
$100
2005 2006 2007 2008 2009 2010 2011 2012 2013 2014 2015
Administrative ServicesCost Per Customer

209 Operating Expenses – Administrative Services
2013
Actual
2014
Jan-Jun
2014
Budget
2015
Budget
Budget
Diff $
Budget
Diff %
Salaries & Wages
660111 - SALARIES/WAGES NON-UNION $1,665,863 $823,622 $1,723,458 $1,816,356 $92,898 5.4%
660121 - WAGES/REGULAR UNION 579,242 288,977 619,944 591,157 (28,787) -4.6%
660122 - WAGES/OVERTIME UNION 25,102 9,540 20,925 21,420 495 2.4%
660131 - WAGES - REGULAR - TEMPS 2,172 - 3,838 3,838 - 0.0%
660136 - CONTRACTED - TEMPS - - - 10,120 10,120 n/a
66014 - VACATION ACCRUAL (5,759) - - - - n/a
660141 - TRUSTEES COMPENSATION 23,150 11,950 27,000 27,000 - 0.0%
66015 - SICKTIME ACCRUAL 25,769 - - - - n/a
66351 - CONTRACTED TEMPORARIES 7,320 5,697 2,000 - (2,000) -100.0%
Salaries & Wages Total 2,322,859 1,139,786 2,397,165 2,469,891 72,726 3.0%
Employee Benefits
660401 - FICA - EMPLOYERS' SHARE 169,685 85,051 183,230 188,172 4,942 2.7%
660405 - SAFETY/WHY PROGRAM ITEMS 5,252 918 6,965 6,575 (390) -5.6%
6604065 - PENSION LEGAL EXPENSE 190 - - - - n/a
660407 - EDUCATION SUBSIDY - 602 - - - n/a
660411 - MEALS ALLOWANCE 21 20 80 80 - 0.0%
660413 - PWD TRAINING PROGRAM 627 710 - - - n/a
660418 - STIPENDS 300 300 300 200 (100) -33.3%
660419 - EMPLOYEE BENEFTS-MISC OTH 6,931 1,711 1,050 5,350 4,300 409.5%
660420 - WORKFORCE PLANNING 200 - - - - n/a
660491 - FRINGE BENEFITS-REG/SAL 968,194 503,239 1,043,283 1,106,734 63,451 6.1%
Employee Benefits Total 1,151,400 592,551 1,234,908 1,307,111 72,203 5.8%
Contracted Services
662062 - PRINTER REPAIR 2,000 4,000 3,500 3,500 - 0.0%
662063 - COPIER MAINTENANCE/TONER 10,610 3,733 9,500 9,500 - 0.0%
6632 - ACCOUNTING SERVICES 31,838 31,250 31,250 32,500 1,250 4.0%
66331 - LEGAL - LABOR RELATIONS 96,115 8,698 45,000 55,000 10,000 22.2%
66333 - BOND COUNSEL - - 7,500 7,500 - 0.0%
66339 - LEGAL - OTHER 56,802 42,747 36,400 36,400 - 0.0%
66354 - MAINTENANCE SERVICES 1,938 - - - - n/a
663545 - RADIO SERVICING AND EQUIP 1,583 3,124 5,000 5,000 - 0.0%
663561 - COMPUTER LICENSES 8,794 221 6,000 5,000 (1,000) -16.7%
663562 - COMPUTER MAINTAINENCE 176,022 114,863 223,627 202,909 (20,718) -9.3%
663563 - COMPUTER CONSULTING/OTHER 30,447 12,969 39,500 32,500 (7,000) -17.7%
6635801 - EMPLOYEE HEALTH SERVICES 7,198 3,688 7,950 8,745 795 10.0%
663581 - UTILITY BILLING PRINTING 82,604 52,382 85,597 74,579 (11,018) -12.9%
663582 - PAYMENT PROCESSING 128,520 65,211 127,650 131,850 4,200 3.3%
663583 - RECEIVABLE COLLECTIONS 12,164 3,906 10,000 10,000 - 0.0%
663584 - BANK SERVICE CHARGES 11,951 6,031 12,000 12,000 - 0.0%
663587 - COURIER SERVICES 3,473 2,294 2,316 4,370 2,054 88.7%
663588 - EQUIPMENT MAINTENANCE 10 - 1,500 1,500 - 0.0%
663592 - RECRUITING SERVICES 3,631 1,963 7,250 7,250 - 0.0%
663594 - DIGSAFE 71,217 40,652 76,080 74,736 (1,344) -1.8%
663595 - OUTPLACEMENT SERVICES - - 2,000 2,000 - 0.0%
663598 - HR CONSULTANT SERVICES 675 - 2,000 2,000 - 0.0%
6635984 - LANGUAGE INTERPRETATION - - 300 300 - 0.0%
663599 - MISC OTHER SERVICES 20,061 16,592 20,185 28,685 8,500 42.1%
Contracted Services Total 757,653 414,324 762,105 747,824 (14,281) -1.9%
Deferred Cost W/O
66754 - DEFERRED COSTS WRITE OFF 21,954 5,043 10,086 10,086 - 0.0%
Deferred Cost W/O Total 21,954 5,043 10,086 10,086 - 0.0%
Insurance
6657 - GEN LIABILITY INSURANCE 52,201 23,045 46,088 49,314 3,226 7.0%
66592 - DAMAGES & CLAIMS-GOODWILL 7,247 - 2,000 4,000 2,000 100.0%
66593 - UMBRELLA INSURANCE COVER 4,221 1,903 3,806 4,072 266 7.0%
66594 - PROFESSION/CRIME BONDING 18,278 10,128 19,319 20,671 1,352 7.0%
Insurance Total 81,947 35,076 71,213 78,057 6,844 9.6%

210 Operating Expenses – Administrative Services
2013 2014 2014 2015
Actual Jan-Jun Budget Budget Diff $ Diff %
Materials & Supplies6619 - ASSET PURCHASES $5,965 $3,308 $2,000 $3,000 $1,000 50.0%66202 - TOOLS 81 - - - - n/a66203 - VENDOR PURCHASED SUPPLIES 1,491 354 3,750 3,100 (650) -17.3%662042 - SUPPLIES INVENTORY 2,805 1,493 2,550 2,600 50 2.0%662043 - TOOL INVENTORY 2,790 411 175 225 50 28.6%66204301 - INVENTORY - TONER 6,109 5,856 10,000 10,150 150 1.5%66204302 - INVENTORY - PAPER 2,403 1,483 5,000 5,000 - 0.0%66204303 - INVENTORY-COMPUTER EQUIP 2,126 2,928 3,100 4,188 1,088 35.1%662047 - GARAGE INVENTORY 49 37 - - - n/a66205 - CONSUMABLE SUPPLIES 4,758 572 2,750 2,550 (200) -7.3%66206 - COMPUTER EQUIPMENT - - - 4,575 4,575 n/a663564 - COMPUTER-RELATED EQUIP 29,154 10,080 27,728 14,000 (13,728) -49.5%Materials & Supplies Total 57,731 26,522 57,053 49,388 (7,665) -13.4%Other Expense6642 - EQUIPMENT RENT 2,755 1,458 2,950 2,950 - 0.0%66601 - PUBLIC RELATIONS 1,420 811 - 1,600 1,600 n/a66609 - OTHER ADVERTISING 6,388 5,831 41,476 42,976 1,500 3.6%6675111 - INSTATE TRAINING 17,032 9,351 26,000 18,000 (8,000) -30.8%6675112 - OUT OF STATE TRAINING 12,697 19 1,000 1,000 - 0.0%6675121 - IN STATE CONFERENCES 1,853 886 2,750 4,250 1,500 54.5%6675122 - OUT-OF-STATE CONFERENCES 27,057 10,938 28,500 26,500 (2,000) -7.0%667513 - DUES 34,185 10,203 36,365 43,255 6,890 18.9%667514 - PROFESSIONAL LICENSES 752 222 822 900 78 9.5%667515 - PERIODICAL SUBSCRIPTIONS 4,339 2,607 4,621 5,389 768 16.6%667517 - PLANT OPER LICENSE FEES 63 - - - - n/a667521 - POSTAGE - THIRD PARTY 199,088 112,590 205,624 214,520 8,896 4.3%667522 - POSTAGE - INTERNAL 15,586 6,492 18,163 17,990 (173) -0.9%667523 - POSTAGE - EXPRESS DELIVER 44 129 350 350 - 0.0%667531 - PRINTING COSTS 28,586 16,413 27,680 27,825 145 0.5%667532 - PHOTOCOPYING COSTS (77) - - - - n/a667533 - FORMS STOCK 704 626 600 650 50 8.3%667552 - SAFETY TRAINING 3,424 1,604 3,400 4,100 700 20.6%667553 - DOT SUBSTANCE ABUSE 1,320 609 2,000 2,000 - 0.0%667555 - SAFETY EXPENSES 2,185 2,689 5,800 6,790 990 17.1%667591 - UNIFORMS - 8 - - - n/a667592 - FOOD SUPPLIES 1,513 700 4,300 3,500 (800) -18.6%667598 - GEN MANAGER CONTINGENCY - - 35,000 70,000 35,000 100.0%6675981 - GEN MNG - TRUSTEES 7,676 5,796 11,700 11,000 (700) -6.0%6675982 - GEN MNG - COMMUNITY 25,339 4,720 25,365 25,115 (250) -1.0%667599 - OTHER MISCELLANEOUS 8,219 2,234 6,000 6,000 - 0.0%Other Expense Total 402,148 196,936 490,466 536,660 46,194 9.4%Tele/Other Utilties66112 - DATA LINES 15,304 3,319 14,818 17,302 2,484 16.8%66113 - CELLULAR PHONES 11,665 8,753 9,982 10,720 738 7.4%Tele/Other Utilties Total 26,969 12,072 24,800 28,022 3,222 13.0%Transportation66501 - TRANSPORTATION - INTERNAL 31,771 6,942 14,133 12,900 (1,233) -8.7%665019 - TRANS INTERNAL INACTIVE - 1,910 4,000 4,289 289 7.2%66502 - TRANSPORTATION - EXTERNAL 811 390 871 850 (21) -2.4%66503 - MILEAGE REIMBURSEMENT 4,219 2,269 4,314 4,750 436 10.1%Transportation Total 36,801 11,511 23,318 22,789 (529) -2.3%Grand Total 4,859,462 2,433,821 5,071,114 5,249,828 178,714 3.5%

211 Operating Expenses – Administrative Services
Administrative Services: Customer Services (F1)
Financial Summary:
2013
Actual
2014
Jan-Jun
2014
Budget
2015
Budget
Budget
Diff $
Budget
Diff %
Expense Type:
Salaries & Wages $641,757 $320,383 $674,249 $727,781 $53,532 7.9%
Employee Benefits 318,430 162,792 347,614 380,385 32,771 9.4%
Contracted Services 174,801 96,940 184,704 166,424 -18,280 -9.9%
Materials & Supplies 9,371 4,134 15,338 8,138 -7,200 -46.9%
Other Expense 204,435 102,721 212,552 218,011 5,459 2.6%
Tele/Other Utilties 1,602 956 2,148 2,148 0 0.0%
Transportation 32,266 8,997 18,391 18,188 -203 -1.1%
Grand Total 1,382,662 696,923 1,454,996 1,521,075 66,079 4.5%
Programs:
74 - Control Center 233,141 95,943 200,313 160,263 -40,050 -20.0%
76 - Collection 71,799 29,624 61,324 60,163 -1,161 -1.9%
77 - Billing 281,801 158,760 329,547 324,743 -4,804 -1.5%
80 - Meter Reading 88,318 34,373 86,708 70,891 -15,817 -18.2%
98 - Training 114,173 23,023 46,537 48,836 2,299 4.9%
99 - Administration 593,430 355,200 730,567 856,179 125,612 17.2%
Grand Total 1,382,662 696,923 1,454,996 1,521,075 66,079 4.5%
Funds:
10 - General 1,307,512 662,825 1,373,234 1,439,521 66,287 4.8%
20 - Water General 46,784 19,802 43,176 42,433 -743 -1.7%
30 - Water Standish 1,723 851 428 1,898 1,470 343.5%
51 - WW Cape Elizabeth 1,661 1,645 3,144 3,334 190 6.0%
53 - WW Cumberland 1,914 251 3,385 3,414 29 0.9%
54 - WW Falmouth 911 307 569 457 -112 -19.7%
55 - WW Windham LF 0 0 37 75 38 102.7%
57 - WW Portland 10,457 6,061 15,414 14,258 -1,156 -7.5%
59 - WW South Portland 5,755 2,533 6,094 5,982 -112 -1.8%
61 - WW Gorham 2,016 684 3,255 3,259 4 0.1%
62 - WW Westbrook 3,929 1,964 6,260 6,444 184 2.9%
Grand Total 1,382,662 696,923 1,454,996 1,521,075 66,079 4.5%
Staffing Trend:
Full-Time 14 14 14 14 0 0.0%
Part-Time 0 0 0 0 0 n/a
Total 14 14 14 14 0 0.0%
Salaries &Wages
48%EmployeeBenefits
25%
ContractedServices
11%
Materials &Supplies
1%
Other Expense14%
Tele/OtherUtilties
0%
Transportation1%

212 Operating Expenses – Administrative Services
Administrative Services: Information Services (G1)
Financial Summary:
2013
Actual
2014
Jan-Jun
2014
Budget
2015
Budget
Budget
Diff $
Budget
Diff %
Expense Type:
Salaries & Wages $417,234 $195,553 $420,800 $433,391 $12,591 3.0%
Employee Benefits 211,844 104,301 218,823 231,620 12,797 5.8%
Contracted Services 184,004 107,820 235,900 211,900 -24,000 -10.2%
Deferred Cost W/O 11,868 0 0 0 0 n/a
Materials & Supplies 29,880 17,544 31,500 31,500 0 0.0%
Other Expense 10,240 3,352 20,274 11,276 -8,998 -44.4%
Tele/Other Utilties 5,592 3,201 5,890 5,890 0 0.0%
Transportation 692 276 500 500 0 0.0%
Grand Total 871,354 432,047 933,687 926,077 -7,610 -0.8%
Programs:
88 - Safety 66,076 30,876 0 0 0 n/a
94 - Technology Teams 11,620 6,628 0 0 0 n/a
98 - Training 55,053 25,169 42,678 34,619 -8,059 -18.9%
99 - Administration 738,605 369,374 891,009 891,458 449 0.1%
Grand Total 871,354 432,047 933,687 926,077 -7,610 -0.8%
Funds:
10 - General 871,214 432,047 933,687 926,077 -7,610 -0.8%
20 - Water General 140 0 0 0 0 n/a
Grand Total 871,354 432,047 933,687 926,077 -7,610 -0.8%
Staffing Trend:
Full-Time 6 6 6 7 1 16.7%
Part-Time 1 1 1 0 -1 -100.0%
Total 7 7 7 7 0 0.0%
Salaries & Wages47%
EmployeeBenefits
25%
ContractedServices
23%
Materials &Supplies
3%
Other Expense1% Tele/Other
Utilties1%

213 Operating Expenses – Administrative Services
Administrative Services: Financial Services (H1)
Financial Summary:
2013
Actual
2014
Jan-Jun
2014
Budget
2015
Budget
Budget
Diff $
Budget
Diff %
Expense Type:
Salaries & Wages $491,679 $236,108 $468,865 $463,318 -$5,547 -1.2%
Employee Benefits 248,716 126,130 244,356 248,625 4,269 1.7%
Contracted Services 204,597 140,554 203,181 212,885 9,704 4.8%
Deferred Cost W/O 10,086 5,043 10,086 10,086 0 0.0%
Materials & Supplies 5,229 4,365 6,315 4,925 -1,390 -22.0%
Other Expense 10,691 6,555 19,540 18,090 -1,450 -7.4%
Tele/Other Utilties 88 0 0 0 0 n/a
Transportation 68 34 400 400 0 0.0%
Grand Total 971,154 518,789 952,743 958,329 5,586 0.6%
Programs:
77 - Billing 153,604 77,982 153,758 164,141 10,383 6.8%
98 - Training 13,847 7,442 37,127 35,119 -2,008 -5.4%
99 - Administration 803,703 433,365 761,858 759,069 -2,789 -0.4%
Grand Total 971,154 518,789 952,743 958,329 5,586 0.6%
Funds:
10 - General 869,746 460,448 854,073 879,878 25,805 3.0%
20 - Water General 101,408 58,341 98,670 78,451 -20,219 -20.5%
Grand Total 971,154 518,789 952,743 958,329 5,586 0.6%
Staffing Trend:
Full-Time 8 9 9 9 0 0.0%
Part-Time 0 0 0 0 0 n/a
Total 8 9 9 9 0 0.0%
Salaries & Wages48%
EmployeeBenefits
26%
ContractedServices
22%
Deferred CostW/O1%
Materials &Supplies
1%
Other Expense2%

214 Operating Expenses – Administrative Services
Administrative Services: Employee Services (I1)
Financial Summary:
2013
Actual
2014
Jan-Jun
2014
Budget
2015
Budget
Budget
Diff $
Budget
Diff %
Expense Type:
Salaries & Wages $192,490 $98,619 $199,488 $204,716 $5,228 2.6%
Employee Benefits 96,625 52,770 104,801 110,483 5,682 5.4%
Contracted Services 106,198 14,348 63,950 74,745 10,795 16.9%
Materials & Supplies 604 432 2,250 2,300 50 2.2%
Other Expense 14,411 7,212 15,900 19,880 3,980 25.0%
Tele/Other Utilties 1,054 575 3,100 3,100 0 0.0%
Transportation 399 97 1,162 500 -662 -57.0%
Grand Total 411,781 174,053 390,651 415,724 25,073 6.4%
Programs:
88 - Safety 24,258 31 0 0 0 n/a
98 - Training 15,771 4,270 11,628 15,049 3,421 29.4%
99 - Administration 371,752 169,752 379,023 400,675 21,652 5.7%
Grand Total 411,781 174,053 390,651 415,724 25,073 6.4%
Funds:
10 - General 411,781 174,053 390,651 415,724 25,073 6.4%
Grand Total 411,781 174,053 390,651 415,724 25,073 6.4%
Staffing Trend:
Full-Time 3 3 3 3 0 0.0%
Part-Time 0 0 0 0 0 n/a
Total 3 3 3 3 0 0.0%
Salaries & Wages49%
EmployeeBenefits
27%
ContractedServices
18%
Materials &Supplies
0%
Other Expense5%
Tele/OtherUtilties
1%Transportation
0%

215 Operating Expenses – Administrative Services
Administrative Services: Executive (J1)
Financial Summary:
2013
Actual
2014
Jan-Jun
2014
Budget
2015
Budget
Budget
Diff $
Budget
Diff %
Expense Type:
Salaries & Wages $579,699 $289,124 $633,764 $640,684 $6,920 1.1%
Employee Benefits 275,784 146,559 319,314 335,998 16,684 5.2%
Contracted Services 88,053 54,662 74,370 81,870 7,500 10.1%
Insurance 81,947 35,076 71,213 78,057 6,844 9.6%
Materials & Supplies 12,648 48 1,650 2,525 875 53.0%
Other Expense 162,369 77,093 222,200 269,405 47,205 21.2%
Tele/Other Utilties 18,634 7,341 13,662 16,884 3,222 23.6%
Transportation 3,377 2,106 2,864 3,200 336 11.7%
Grand Total 1,222,511 612,009 1,339,037 1,428,623 89,586 6.7%
Programs:
5 - Public Relations 145,127 75,830 167,203 179,301 12,098 7.2%
98 - Training 49,472 26,027 61,450 62,215 765 1.2%
99 - Administration 1,027,912 510,152 1,110,384 1,187,107 76,723 6.9%
Grand Total 1,222,511 612,009 1,339,037 1,428,623 89,586 6.7%
Funds:
10 - General 1,194,043 586,813 1,293,037 1,328,623 35,586 2.8%
20 - Water General 20,237 25,181 46,000 100,000 54,000 117.4%
50 - Wastew ater General 8,231 15 0 0 0 n/a
Grand Total 1,222,511 612,009 1,339,037 1,428,623 89,586 6.7%
Staffing Trend:
Full-Time 8 6 6 6 0 0.0%
Part-Time 0 1 1 1 0 0.0%
Total 8 7 7 7 0 0.0%
Salaries &Wages
45%
EmployeeBenefits
24%
ContractedServices
6%
Insurance5%
Materials &Supplies
0% Other Expense19%
Tele/OtherUtilties
1%
Transportation0%

216 Operating Expenses – Administrative Services
Non-Departmental
Non-Department expenses are expenses that are not specifically assigned to a department. Otherexpenses include Public Utilities Commission’s assessment, real estate taxes assessed by the Town ofStandish and Bad Debt write-off.
2013
Actual
2014
Jan-Jun
2014
Budget
2015
Budget
Budget
Diff $
Budget
Diff %
Expense Type:
Salaries & Wages $0 $0 $58,404 $50,002 -$8,402 -14.4%
Employee Benefits 0 0 30,469 26,811 -3,658 -12.0%
Contracted Services 109,903 0 0 0 0 n/a
Other Expense 152,181 64,500 57,800 57,800 0 0.0%
Regulatory/Taxes 221,701 115,978 221,016 226,585 5,569 2.5%
Grand Total 483,785 180,478 367,689 361,198 -6,491 -1.8%
The District pays real estate taxes (670821) and personal property taxes (670822) to the Town ofStandish for land and other property in the town. Annual assessments are also paid by the District tothe Maine Public Utility Commission (PUC) and the Maine Drinking Water Program. The PUC assessmenthas two components – general assessment and public advocate. The PUC general assessment is basedon the utilities size and the amount of time the Commission spends in each industry sector. Because ofthe PUC efforts to update the Consumer Protection rule (Chapter 660), the assessment is projected toincrease. The assessment from the Drinking Water Program is based on population. The budget includesan amount to be available for work force management purposes.
Salaries & Wages14%
Employee Benefits7%
Other Expense16%
Regulatory/Taxes63%

217 Human Resources
Introduction
Total salaries, wages and benefits budget for 2015 is $15,744,911 which is $427,904 or 2.8% higher thanthe 2014 budget.
Total Labor & Benefits (O&M and Capital):
2013
Actual
2014
Budget
2015
Budget
Budget
Diff $
Budget
Diff %
Salaries & Wages $9,920,213 $10,346,692 $10,533,870 $187,178 1.8%
Employee Benefits 4,655,635 4,970,315 5,211,041 240,726 4.8%
14,575,848 15,317,007 15,744,911 427,904 2.8%
Employees record their labor hours by specific water and wastewater operating funds and capitalprojects. Benefits are allocated based on the labor dollars to the funds. It is estimated staff will allocate$510,829 in labor/benefits to capital projects in 2015; which is $16,321 (3.3%) higher than the 2014budget.
2013
Actual
2014
Budget
2015
Budget
Budget
Diff $
Budget
Diff %
Operations & Maintenance $14,153,857 $14,822,498 $15,234,078 $411,580 2.8%
Capital 421,991 494,509 510,833 16,324 3.3%
14,575,848 15,317,007 15,744,911 427,904 2.8%
Total Employee Headcount:
Authorized headcount remains at 178; this is the same as in the previous three budgets (2013, 2014 &2015). In addition, there were no shifts of headcount between District departments.
53 53 53
39 39 39
15 15 15
30 30 30
41 41 41
0
25
50
75
100
125
150
175
200
2013 2014 2015
Administration Services
Engineering Services
Environmental Services
Wastwater Services
Water Services

218 Human Resources
Salary Costs
The Budget assumes total labor costs will increase by 1.8% ($187,178). Because of a shift away to capitalwork (from 2.7% to 3.3% of total labor), operating fund labor costs will increase by 1.7% while capitallabor increases 3.8%.
Total Labor (O&M and Capital) by Type:
2013
Actual
2014
Budget
2015
Budget
Budget
Diff $
Budget
Diff %
Regular (Hourly & Salaried) $9,040,959 $9,403,177 $9,597,748 $194,571 2.1%
Overtime 458,750 461,031 464,459 3,428 0.7%
Doubletime 49,661 56,474 50,043 -6,431 -11.4%
Standby 130,238 118,617 121,235 2,618 2.2%
Premium Time/Standby 638,649 636,122 635,737 -385 -0.1%
Trustee Compensation 23,150 27,000 27,000 0 0.0%
District Employed Temps 152,803 182,347 183,393 1,046 0.6%
Agency Temps 64,652 98,046 89,992 -8,054 -8.2%
Temporary Employees 217,455 280,393 273,385 -7,008 -2.5%
Total Labor Cost 9,920,213 10,346,692 10,533,870 187,178 1.8%
Total Labor broken out by O&M and Capital:
2012
Actual
2013
Budget
2014
Budget
Budget
Diff $
Budget
Diff %
Operating Expense $9,626,483 $10,003,870 $10,178,035 $174,165 1.7%
Capital Expenditures 293,730 342,822 355,834 13,012 3.8%
9,920,213 10,346,692 10,533,869 187,177 1.8%
Operating Expense 97.0% 96.7% 96.6% -0.1%
Capital Expenditures 3.0% 3.3% 3.4% 0.1%
100.0% 100.0% 100.0% 0.0%

219 Human Resources
Labor Hours/Average Pay Rates
Budgeted hours for the 2015 Budget were essentially flat (an increase of 71 hours). Regular timeincreased 832 hours as one employee went from 24 hours/week to full time. This increase was mostlyoffset by reductions in overtime (204 hours), doubletime (171) and temporary employees (402).
Total Labor (O&M and Capital) Hours by Type:
2013
Actual
2014
Budget
2015
Budget
Budget
Diff $
Budget
Diff %
Regular (Hourly & Salaried) 359,699 368,316 369,148 832 0.2%
Overtime 14,340 13,773 13,569 (204) -1.5%
Doubletime 1,127 1,245 1,074 (171) -13.7%
Standby 5,639 5,340 5,356 16 0.3%
Premium Time/Standby 21,106 20,358 19,999 (359) -1.8%
District Employed Temps 12,200 14,524 14,526 3 0.0%
Agency Temps 3,233 5,095 4,690 (405) -7.9%
Temporary Employees 15,433 19,619 19,216 (402) -2.1%
396,238 408,293 408,363 71 0.0%
Labor Rates by Type:
On average pay rates were increased 2.0%. The increase in average rate for regular pay was slightlylower (1.8%) due to turnover in Non-Union employees where the new hires came in at a lower rate thantheir predecessors. Changes to overtime, double-time and standby varied due to shifts in personnelbudgeted to cover those hours. Temp rates were kept relatively flat. Please note that the rates forAgency Temps are higher because the agencies must cover costs such as FICA and workers comp.
2012
Actual
2013
Budget
2014
Budget
Budget
Diff $
Budget
Diff %
Regular (Hourly & Salaried) 25.13 25.53 26.00 0.47 1.8%
Overtime 31.99 33.47 34.23 0.76 2.3%
Doubletime 44.06 45.36 46.59 1.23 2.7%
Standby 23.10 22.21 22.64 0.43 1.9%
Premium Time/Standby 30.26 31.25 31.79 0.54 1.7%
District Employed Temps 12.52 12.56 12.62 0.07 0.6%
Agency Temps n/a 19.24 19.19 (0.06) -0.3%
Temporary Employees 9.90 14.29 14.23 (0.07) -0.5%
24.98 25.28 25.73 0.45 1.8%

220 Human Resources
Employee Benefits
In order to qualify for benefits employees must work more than 20/24 hours/week (non-union/union).Seasonal or temporary employees do not qualify for benefits. Benefits are charged to departments as apercentage of the regular non-premium pay. In 2015, the benefits percentage increased from 44.52% to45.97%. Pension costs rose 7.2% while health insurance expense increased 2.9%.
Health Insurance
The largest benefit expense is the District’s portion of employee health insurance costs ($2,364,628 inthe 2015 Budget). The 2014 Budget assumed a rate decrease of 1.2%; the actual decrease was 0.4%.The 2015 Budget saw an increase in cost from $2,306,115 in 2014 to $2,373,572, a 2.9% increase.
$0
$500
$1,000
$1,500
$2,000
$2,500
$3,000
2007 2008 2009 2010 2011 2012 2013 2014
Cost of Health Insurance(In Thousands)
As a result of labor negotiations, employee premium share cost toward medical coverage will increase1% each year, over the term of the labor contract. The District had been contributing 96% and theemployee 4% of the cost for regular employees who work 40 hours per week. As of January 1, 2015PWD’s premium cost share for all employees will increase to 5%.
The District makes health insurance coverage available to regular employees who work over 20/24hours per week. The medical cost for part-time employees is pro-rated based on hours worked.
The District continues to pay $20/week to any employee who is insured outside the District. At the endof 2014 we had 9 opt-outs.
Year Insured Non-Insured Total2014 164 9 1732015 164 9 173Change 0 0 0
We assume that five positions will either be vacant or that we would have new employees who had notyet become eligible for coverage. We also factor in how many employees qualify for insurance but optout.

221 Human Resources
Employee Benefits (continued)
Pension
Pension related expenses are $1,380,508 in the 2015 Budget. The District offers employees a definedbenefit and a defined contribution pension plans.
The defined benefit plan contributions in the 2015 Budget increased $74,000 (8.0%) to $1,000,000. Thecontribution is consistent with Board adopted long-term funding policy and estimated by the District’sactuary. The actual actuarially determined contribution will be calculated early 2015. The plan is solelyfunded by the District without any employee contribution.
The deferred compensation plan for Union employees hired prior to 2011, and Non-Union employeeshired prior to 2012, will fully match employee contributions up to $1,225 annually. The cost of thismatch is $137,875.
New Union employees hired starting in 2011 (and Non-Union in 2012) were not enrolled in the definedbenefit plan but in a new defined compensation plan. The plan requires employees to contribute 3.0%of pay which the District matches at a rate of 150%. The expense for the match is budgeted at $101,633in 2015.
Workers Compensation
The District participates in the Maine MunicipalAssociation’s workers compensation program.The cost in the 2015 Budget is $256,683. Thepremium assessed is based on amount of wagesand a claim experience factor. In 2015, the “Mod”factor is 1.16 which indicates the District injuryexperience is slightly higher than average (a factorof 1.0 is average). Our 10 year average is 1.08.
Other BenefitsOther benefits which include dental, uniforms, unemployment, long-term disability and life insurancetotaled $401,322.
2005
2006
2007 2008
2009
2010
2011
2012
2013
2014
0.90
0.95
1.00
1.05
1.10
1.15
1.20
Maine Municipal Association - Mod
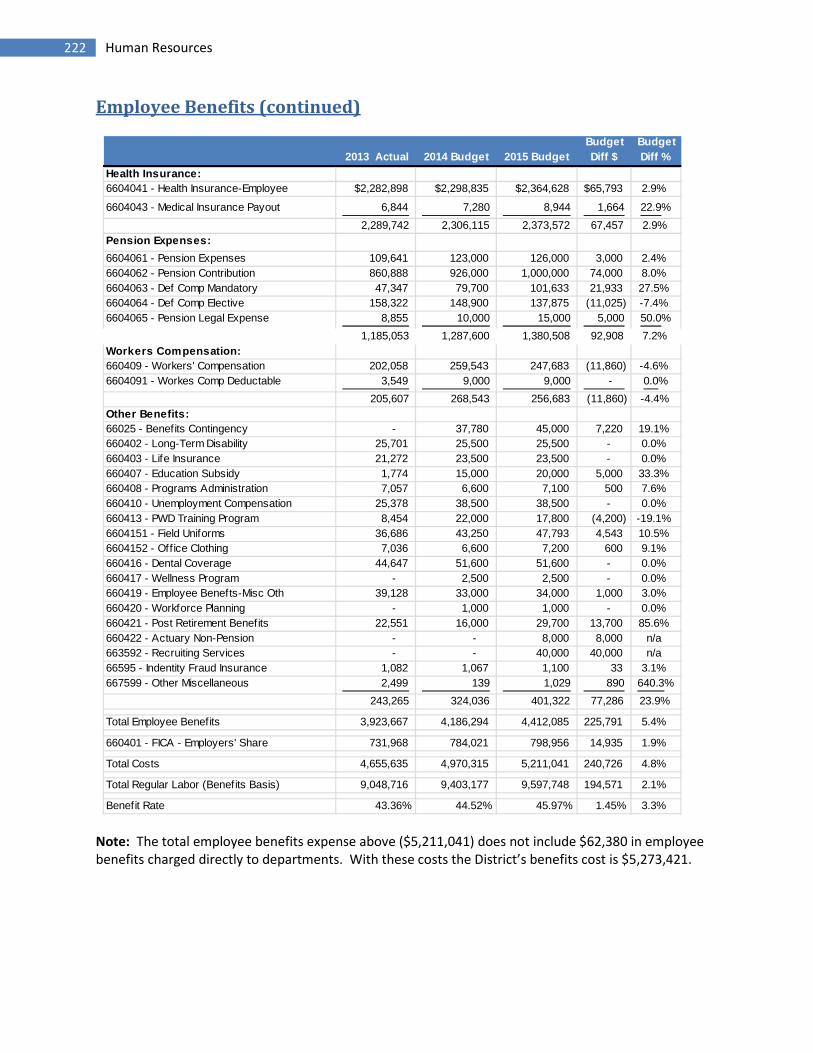
222 Human Resources
Employee Benefits (continued)
2013 Actual 2014 Budget 2015 Budget
Budget
Diff $
Budget
Diff %
Health Insurance:
6604041 - Health Insurance-Employee $2,282,898 $2,298,835 $2,364,628 $65,793 2.9%
6604043 - Medical Insurance Payout 6,844 7,280 8,944 1,664 22.9%
2,289,742 2,306,115 2,373,572 67,457 2.9%
Pension Expenses:
6604061 - Pension Expenses 109,641 123,000 126,000 3,000 2.4%
6604062 - Pension Contribution 860,888 926,000 1,000,000 74,000 8.0%
6604063 - Def Comp Mandatory 47,347 79,700 101,633 21,933 27.5%
6604064 - Def Comp Elective 158,322 148,900 137,875 (11,025) -7.4%
6604065 - Pension Legal Expense 8,855 10,000 15,000 5,000 50.0%
1,185,053 1,287,600 1,380,508 92,908 7.2%
Workers Compensation:
660409 - Workers' Compensation 202,058 259,543 247,683 (11,860) -4.6%
6604091 - Workes Comp Deductable 3,549 9,000 9,000 - 0.0%
205,607 268,543 256,683 (11,860) -4.4%
Other Benefits:
66025 - Benefits Contingency - 37,780 45,000 7,220 19.1%
660402 - Long-Term Disability 25,701 25,500 25,500 - 0.0%
660403 - Life Insurance 21,272 23,500 23,500 - 0.0%
660407 - Education Subsidy 1,774 15,000 20,000 5,000 33.3%
660408 - Programs Administration 7,057 6,600 7,100 500 7.6%
660410 - Unemployment Compensation 25,378 38,500 38,500 - 0.0%
660413 - PWD Training Program 8,454 22,000 17,800 (4,200) -19.1%
6604151 - Field Uniforms 36,686 43,250 47,793 4,543 10.5%
6604152 - Office Clothing 7,036 6,600 7,200 600 9.1%
660416 - Dental Coverage 44,647 51,600 51,600 - 0.0%
660417 - Wellness Program - 2,500 2,500 - 0.0%
660419 - Employee Benefts-Misc Oth 39,128 33,000 34,000 1,000 3.0%
660420 - Workforce Planning - 1,000 1,000 - 0.0%
660421 - Post Retirement Benefits 22,551 16,000 29,700 13,700 85.6%
660422 - Actuary Non-Pension - - 8,000 8,000 n/a
663592 - Recruiting Services - - 40,000 40,000 n/a
66595 - Indentity Fraud Insurance 1,082 1,067 1,100 33 3.1%
667599 - Other Miscellaneous 2,499 139 1,029 890 640.3%
243,265 324,036 401,322 77,286 23.9%
Total Employee Benefits 3,923,667 4,186,294 4,412,085 225,791 5.4%
660401 - FICA - Employers' Share 731,968 784,021 798,956 14,935 1.9%
Total Costs 4,655,635 4,970,315 5,211,041 240,726 4.8%
Total Regular Labor (Benefits Basis) 9,048,716 9,403,177 9,597,748 194,571 2.1%
Benefit Rate 43.36% 44.52% 45.97% 1.45% 3.3%
Note: The total employee benefits expense above ($5,211,041) does not include $62,380 in employeebenefits charged directly to departments. With these costs the District’s benefits cost is $5,273,421.

223 Human Resources
Employee Benefits (continued)
Authorized HeadcountThe overall headcount is unchanged at 178 between 2014 and 2015, however, several changes arebetween and within sub-departments as outline below:
Added Eliminated Reason for changeA2 - Equipment Operator Decreased number of excavation done.
A6 Utility Specialist - Additional resources for Main Renewal Inspection
L9 WW Operator WW System Operator Cross-functional position for cross training and workforce management purposes
F1 Customer Service ProgramManager
Customer ServiceCoordinator–Control Center
Billing system/process efficiency projects
G1 Network Administrator I Strategic Project Manager Expanding computer system support
E2 Asset Analyst Utility Asset Coordinator Additional Asset management practiceimplementation
2013 2014 2015 13 to 15 14 to 15
Water Services
A1 - Water Administration 5.00 5.00 5.00 0.00 0.00
A2 - Transmission/Distribution 24.00 23.00 22.00 -2.00 -1.00
A3 - Water Treatment 11.00 11.00 11.00 0.00 0.00
A6 - Utility Services 13.00 14.00 15.00 2.00 1.00
53.00 53.00 53.00 0.00 0.00
Wastwater Services
B1 - Wastewater Administration 2.00 1.00 1.00 -1.00 0.00
B3 - Portland (East End) WWTF 17.67 19.00 19.00 1.33 0.00
B4 - Westbrook/Cape/Peaks WWTF's 6.67 6.00 6.00 -0.67 0.00
L9 - Water / WW Systems 12.66 13.00 13.00 0.34 0.00
39.00 39.00 39.00 0.00 0.00
Environmental Services
A5 - Environmental Services 8.00 8.00 8.00 0.00 0.00
L6 - Water / WW Laboratory 7.00 7.00 7.00 0.00 0.00
15.00 15.00 15.00 0.00 0.00
Engineering Services
C1 - Facility Services Administration 10.00 10.00 10.00 0.00 0.00
E2 - Planning & Design 17.00 17.00 17.00 0.00 0.00
E7 - Instrumentation 3.00 3.00 3.00 0.00 0.00
30.00 30.00 30.00 0.00 0.00
Administrative Services
F1 - Customer Service 14.00 14.00 14.00 0.00 0.00
G1 - Information Services 7.00 7.00 7.00 0.00 0.00
H1 - Financial Services 8.00 9.00 9.00 1.00 0.00
I1 - Employee Services 3.00 3.00 3.00 0.00 0.00
J1 - Executive Office 8.00 7.00 7.00 -1.00 0.00
Non-Departmental 1.00 1.00 1.00 0.00 0.00
41.00 41.00 41.00 0.00 0.00
Total 178.00 178.00 178.00 0.00 0.00

224 Human Resources
Non-Union Positions
The overall Non-Union headcount increased from 55 to 56. In addition, the number of part-timepositions was reduced from two to one.
The table below shows the requested Non-Union positions by pay range:
Range 1 ($30,197 to $45,355) 2014 2015 Change Range 4 ($61,597 to $92,395) 2014 2015 Change
Executive Admin Asst 1 1 0 Director Of Customer Ser 1 1 0
General Accounting Asst 1 1 0 Director Of Finance Serv 1 1 0
2 2 0 Dist Sys Manager - Water 1 1 0
Eng/Asset Mgmt Srv Mngr 1 1 0
Range 2 ($44,032 to $66,048) 2014 2015 Change Environmental Srv Manager 1 1 0
Asset Analyst 0 1 1 Information Srvs Manager 1 1 0
BSA - Gis 1 1 0 Senior Project Engineer 3 3 0
Business Systems Analyst 1 1 0 9 9 0
Chief Of Security Oper 1 1 0
Cust Serv Supervisor 1 1 0 Range 5 ($69,056 to $103,674) 2014 2015 Change
Cust Srv Program Manager 0 1 1 Director Of Opr Srvs 2 2 0
Design Engineer 1 1 0 Exec Director Of EE Srvs 1 1 0
Environmental Educ Coord 1 1 0 3 3 0
ES Conslt Safety/Training 1 1 0
ES Consultant Employment 1 1 0 Range 6 ($77,718 to $116,455) 2014 2015 Change
Financial Analyst 3 3 0 Corporate Counsel 1 1 0
Netw ork Admin I 0 1 1 Exec Director Of Admin 1 1 0
Netw ork Admin II 1 1 0 Exec Director Of AMAP 1 1 0
Purchasing Agent/Buyer 1 1 0 3 3 0
Right Of Way Agent 1 1 0
Scheduler/Coord AMAP 1 1 0 Range 7 ($93,598 to $140,277) 2014 2015 Change
Scheduler/Coordinator Ops 1 1 0 General Manager 1 1 0
Source Protection Coord 1 1 0
17 20 3 Workforce Management 2014 2015 Change
Position 2 2 0
Range 3 ($51,370 to $77,116) 2014 2015 Change
Admin Facility Chief Oper 1 1 0 Full Time Positions 53 55 2
Database Administrator 1 1 0 Part Time Positions 2 1 -1
Netw ork Admin III 1 1 0 Total Non-Union Positions: 55 56 1
Project Engineer 3 3 0
Public Relations Manager (PT) 1 1 0
Regulatory Security Advsr 1 1 0
Strategic Project Manager (PT) 1 0 -1
Transm Dist Supervisor 1 1 0
Utility Asset Coord AMAP 2 1 -1
Utility Asset Coord Water 1 1 0
Utility Specialist Suprv 1 1 0
Wtr Svs Plnt/Sys Chief Op 1 1 0
WW Chief Oper Plant/Sys 3 3 0
18 16 -2

225 Human Resources
Union Positions
For the 2015 Budget, the Union headcount was down one to 122. The number of part-time positionswas unchanged at one. The current Union Contract was ratified in March 2013, retro to November2012; the rates shown (probationary and regular) will be paid through October 2015.
Paygrade - D ($16.75/$17.62) 2014 2015 Change Paygrade - I ($22.40/$23.55) 2014 2015 Change
AMR Specialist 1 1 0 Instrumentation Maint Per 2 2 0
1 1 0 Senior WW Operator 5 5 0
Utility Specialist 12 13 1
Paygrade - E ($17.72/$18.65) 2014 2015 Change Wtr Treat Plant Sys Oper 7 7 0
Admin Dept Asst Finance 3 3 0 WW System Maint/Operator 2 2 0
Administrative Asst Ops 1 1 0 28 29 1
Administrative Asst WW 1 1 0
5 5 0 Paygrade - J ($23.75/$25.00) 2014 2015 Change
Environmental Scientist 5 5 0
Paygrade - F ($18.80/$19.77) 2014 2015 Change Facility Maint Foreperson 1 1 0
Construction Technician 2 2 0 Tech Maint Pers Mech/Elec 5 5 0
Cust Serv Coord Ctrl Ctr 4 3 -1 Tech Maint Person SLWTF 1 1 0
Equip Operator II WW 2 2 0 Water Resource Specialist 4 4 0
Facility Maint Technician 3 3 0 (1 of 4 is part-time) 16 16 0Facility Supp Generalist 1 1 0
Technical Admin Asst 1 1 0 Paygrade - K ($25.16/$26.45) 2014 2015 Change
Wastewater Operator 3 4 1 Dist System Foreperson 6 6 0
Water System Operator 9 9 0 Garage Foreperson 1 1 0
25 25 0 Lead Env Scien-Foreperson 1 1 0
Operations Foreman, Sys 1 1 0
Paygrade - G ($19.93/$20.96) 2014 2015 Change Operations Foreperson 3 3 0
Collections Coordinator 1 1 0 Ops Foreman, WW System 1 1 0
Cust Serv Coordinator 3 3 0 13 13 0
Engineering Tech II 1 1 0
Equip Operator I 5 4 -1 Paygrade - L ($26.70/$28.08) 2014 2015 Change
Garage Mechanic I 1 1 0 Inst Maint Foreperson 1 1 0
Millwright I 1 1 0 Tech Maint Foreperson 2 2 0
WW Plant Maint/Operator 7 7 0 3 3 0
WW Systems Operator 4 3 -1
23 21 -2 Full Time Positions 123 122 -1
Part Time Positions 1 1 0
Paygrade - H ($21.15$22.23) 2014 2015 Change Total Union Positions 123 122 -1
Asset Mgmt Technician 3 3 0
Cust Serv Coordinator 3 3 0
Collection Sys Maint Oper 1 1 0
Engineering Technician 1 1 0
Inv Control Leadperson 1 1 0
9 9 0

226 Human Resources
Temporary & Non-Benefit Employees
Temporary and non-benefit employees supplement regular employees particularly during the busytimes of year. The Lab Assist II position is a full-time, non-benefit, employee (usually a college “intern”)who works 20 hours/week. All other positions are seasonal employees who also do not receive benefits.The position totals are listed as full time equivalents (FTE’s). Temporary employees hired via outsideagencies are also included below.
Water Operations 2013 2014 2015 Change '14 to 15
A1 - Water Administration 0.0 0.0 0.0 0.0
A2 - Transmission/Distribution 2.5 2.5 2.3 -0.2
A3 - Water Treatment 0.0 0.0 0.0 0.0
A6 - Utility Services 1.3 1.3 1.3 0.0
3.8 3.8 3.6 -0.2
Wastwater Operations
B1 - Wastew ater Administration 0.0 0.0 0.0 0.0
B3 - Portland/Cape/Peaks WWTP's 0.2 0.2 0.2 0.0
B4 - Westbrook/Gorham/Windham WWTP 0.0 0.0 0.0 0.0
L9 - Water / WW Systems 0.1 0.1 0.1 0.0
0.3 0.3 0.3 0.0
Environmental Services
A5 - Environmental Services 3.1 3.1 3.0 -0.2
L6 - Water / WW Laboratory 0.5 0.5 0.5 0.0
3.6 3.6 3.5 -0.2
Engineering Services
C1 - Facility Services Administration 0.5 0.5 0.5 0.0
E2 - Planning & Design 1.0 1.0 1.0 0.0
E3 - New Mains & Construction 0.0 0.0 0.0 0.0
E7 - Instrumentation 0.0 0.0 0.0 0.0
1.5 1.5 1.5 0.0
Administration Department
F1 - Customer Service 0.0 0.0 0.2 0.2
G1 - Information Services 0.2 0.2 0.2 -0.1
H1 - Financial Services 0.0 0.0 0.0 0.0
I1 - Employee Services 0.0 0.0 0.0 0.0
J1 - Executive Office 0.0 0.0 0.0 0.0
0.2 0.2 0.4 0.2
9.4 9.4 9.2 -0.2

227 Human Resources
Temporary & Non-Benefit Employees (continued)
Temporary Positions Detail:
District Paid (Account 660131):
Org Job Class #EE Hrs/Wk # Wks Hours FTE's
A2 Engineering Tech - Temp 1 40 15 600 0.29
A5 Envir Educator-School Yr 2 40 40 3,200 1.54
Temp Boat Launch Insp 5 14 20 1,400 0.67
Temp Boat Launch Insp 1 12 25 300 0.14
Temp Boat Launch Insp 1 16 40 640 0.31
Temp Watershed Prot Spec 1 40 15 600 0.29
10 6,140 2.95
A6 Constr Laborer - Temp 2 40 34 2,720 1.31
B3 Engineering Tech - Temp 1 40 10 400 0.19
C1 Facility Maint Tech -Temp 1 40 26 1,040 0.50
E2 Engineering Tech - Temp 4 40 13 2,080 1.00
G1 Temp IT Temp 1 40 8 320 0.15
L6 Lab Assistant II 1 20 52 1,040 0.50
L9 Engineering Tech - Temp 1 40 5 200 0.10
22 14,540 6.99
Agency Paid (Account 660136)
Org Job Class #EE Hrs/Wk # Wks Hours FTE's
A2 Temp Laborer 4 40 26 4,160 2.00
F1 Temp Clerical 1 40 12 480 0.23
I1 Temp Clerical 1 50 1 50 0.02
6 4,690 2.25
Total District & Agency 28 19,230 9.25
69%
31%
Union vs Non-Union
Union
Non-Union
22%
78%
Gender
Female
Male

228 Human Resources
Work Force Management
In 2015, 10 employees will reach age 65, thenormal retirement age.
Management has been proactively managing thechallenges of baby boomer retirements and thedevelopment of promoted personnel andunseasoned new hires.
The Wastewater Department has implemented anApprentice Program to help educate new hires tothe breadth of knowledge needed to operate ourfacilities, as well as to get exposure to other areasof PWD operations. Documentation, such asprocedures for operating the rotary press, hasfurther supported knowledge transfer.
The Water Department’s apprentice program hasbeen satisfying its labor needs. It has served tolaunch capable Water System Operators into themore advanced Utility System and WaterTreatment System Operator roles. The nextchallenge is preparing employees for the highesttechnical roles, and foreperson or supervisoryroles.
Generally speaking, the AdministrationDepartment is well positioned with existingpersonnel.
In 2015 the Board of Trustees will begin its work tofind a replacement for the retiring GeneralManager.
10%
23%
16%
32%
18%
1%
All Employees by Age
20s
30s
40s
50s
60s
70s
5 111 2
97
24
3
95
12
3
1012
21
16
45
11
141
0
20
40
60
80
100
Administration Engineering Water WW
Age by Department
70s
60s
50s
40s
30s
20s

229 Human Resources
Work Force Management (continued)
Employee Development
The District actively promotes skill development by encouraging participation in local, regional andnational organizations, and on the job training. Also, a goal of an average of 80 hours of training peremployee per year has been established.
Managing Today
To address work force management issues, the District requires all employees’ performance beevaluated yearly with an action plan to assist with continuous development. Pay adjustments for non-union employees are based on performance. Non-Union Compensation policy requires that a marketsurvey be conducted every two years to assure we are competitively compensating employees. The nextnon-union market survey will be conducted in 2016 with results implemented January 2017.
Travel Budget
The Board of Trustees approves an annual budget for out-of-state and overnight business travel. TheGeneral Manager specifically approves all travel requests. The total costs may not exceed the District'stotal budget without the Board's authorization.
Department 2014 Budget 2015 Budget Change
Water Services $0 $3,000 $3,000
Wastewater Services 9,550 8,450 -1,100
Environmental Services 3,800 3,500 -300
Engineering Services 11,000 12,000 1,000
Administration 29,500 27,500 -2,000
$53,850 $54,450 $600
Training Budget
Employee development is comprised of the annual budget for all in-state and out-of-state trainingevents. Employee development costs include the travel budget listed above.
Department 2014 Budget 2015 Budget Change
Water Services $186,483 $225,403 $38,920
Wastewater Services 143,444 148,861 5,417
Environmental Services 61,154 35,639 -25,515
Engineering Services 128,444 127,866 -578
Administration 201,420 195,838 -5,582
$720,945 $733,607 $12,662
Operating Expense Budget $26,912,548 $27,711,949
Percentage of O&M Budget 2.7% 2.6%

230 Human Resources
Work Force Management (continued)
Environment and Tools
Organizational development and improvement is an on-going process. Management continues toevaluate areas that require additional focus as business needs and demands evolve, and as laws or rulesgoverning our practices change. Many of these focus areas require cross-functional involvementincluding alignment to ensure understanding, practical and consistent application and communication ofchanges.
Management continues to utilize department monthly meetings to keep employees up to date re: Boardactivities and decisions, significant capital improvement projects, business challenges and changes, andupdates of organizational practices and policies.
SharePoint will continue to evolve in 2015 as our forum of daily information sharing, and documentmanagement across PWD. Developing and implementing a common methodology for catalogingdocuments to improve knowledge retrieval/sharing, and reducing document redundancy are significantareas of growth this year, ultimately involving every employee.
An organization’s total compensation package is a key factor in establishing our competitive posture inthe employment market, and employee satisfaction. As with most organizations, the Affordable CareAct will likely impact PWD’s medical plan design. 2015 will be a year of evaluating viable change optionsto bring to senior management, and ultimately to Union negotiations. Negotiations are due to starttoward the end of 2015.
Employee Satisfaction Survey
A survey of employees on the work climate is conducted every other year. The survey results arereviewed with employees and areas to improve are identified. A survey was conducted in 2013 andthree focus areas were identified, and they are the same as in 2011. They are: inconsistent applicationof policies, fairness of decisions regarding promotion and value of the employee evaluation process.Specific actions have been identified and managers have been asked to include them in 2014-15 workplans. A new survey will be conducted in 2015, evaluated, and updated action items establishedintended to positively affect employee satisfaction.
1
2
3
4
5
6
01 02 03 05 07 09 11 13
Scal
e
Employee Satisfaction Survey TrendYear-to-Year Results 2001-2013
Non-Represented Total Represented

231 Capital Finance
Introduction
Capital expenditures are financed either from withdrawals from the renewal and replacement fund (R&R fund) established for each enterprise fund or through the issuance of a bond. The financing option foreach project is noted when the Board authorizes the project. A summary of 2015 financing options(source of funds) are noted in the chart below. The funds will be used to fund $11.3 million waterprojects and $13.7 million wastewater projects.
Deferred OpEx,$180 , 1%
Water Bonds,$8,000 , 32%
Water R&R,$3,245 , 13%
WastewaterBonds, $12,338 ,
49%
Wastewater R&R,$1,200 , 5%
SOURCE OF FUNDS (000's)
Annual Fund Operating Budget
The annual budget includes the impact of issuing $11.64 million of debt and $4.87 million incontributions to the renewal and replacement funds.
The transportation debt service and renewal & replacement contributions are allocated to funds anddepartments through an hourly rate and are included in the transportation - internal line item.
2014 Budget 2015 Budget $ Change
Debt Service Principal, Interest & Related Expense $6,457,926 $6,140,039 -$317,887
Debt Service - Allocated 683,559 670,620 (12,939)
Debt Service - Funds 7,141,485 6,810,659 (330,826)
Annual Debt Service 7,141,485 6,810,659 (330,826)
Renewal & Replacement - Water - General 2,400,000 2,600,000 200,000
Renewal & Replacement - Wastewater 1,332,950 1,396,362 63,412
Renewal & Replacement - Multi-Fund Assets 490,000 490,000 -
Renewal & Replacement - Funds 4,222,950 4,486,362 263,412
Renewal and Replacement - Transportation 380,000 380,000 -
Annual Renewal and Replacement Contributions 4,602,950 4,866,362 263,412
Total Capital / Finance 11,744,435 11,677,021 (67,414)

232 Capital Finance
Bond Financing
Overview
The District typically finances larger capital projects by issuing revenue bonds for a term of the asset’suseful life or 20 years, whichever is shorter. Since most of the District’s assets have useful life in excessof 20 years, the typical bond term is 20 years. The District’s charter authorizes the District, through itstrustees and without vote of its inhabitants, to issue bonds to pay for the costs of capital outlaysincurred in connection with acquiring, renovating or constructing water and wastewater assets.Water bonds are secured by the revenues of customers’ water rates and charges. In the event of a bondpayment default, the District has the power to assess its member municipalities to provide funds to curethe default. Such assessments would be allocated based upon the municipalities’ respective statevaluation.
Wastewater bonds are secured by the District’s sewer assessment revenue. In the event of a bondpayment default, the municipalities served would be responsible for the debt service related to assetsserving that municipality. The annual sewer Assessment once certified to the municipality by the Districtis an obligation of the municipality on parity with the municipalities’ general obligation debt and entitledto the full faith and credit of the municipality.
Water Capital Reserve Bond
The 2015 Budget includes issuing a $2 million, 10-Year bond to finance the replacement of aging watermains. A new rule promulgated by the Maine Public Utilities Commission (MPUC) in 2013 allows utilitiesto create a capital reserve to pay for infrastructure improvements, including debt service costs, andallows the reserve to be funded by designating a portion of the utility’s revenue. The 2015 budgetassumes that 1% of the proposed 3.8% rate adjustment will be used to fund the reserve and will pay forthe debt service of the proposed $2 million bond. The tentative plan is to issue a $2 million bond each ofthe next 10 years and raise water rates an additional 1% each year.
Bond Options
The District issues bonds either directly to the market or through the Maine Municipal Bond Bank(MMBB). For larger projects, typically greater than $10 million, the District considers issuing directly tothe market. For smaller projects, the most cost effective option is to issue through MMBB.
MMBB has three different programs – General Bond, Drinking Water SRF (State Revolving Fund) andClean Water SRF programs. General Bond issues are done twice a year at tax-exempt market rates. TheSRF programs have a more flexible closing date and typically result in an interest rate 2% less thanmarket. For qualifying projects, part of the principal may be forgiven. Projects financed through the SRFare competitively awarded by the State of Maine’s Department of Human Services (water projects) orDepartment of Environmental Protection (wastewater projects). Those projects need to comply withcertain procurement standards.

233 Capital Finance
Bond Financing (continued)
The current water bond ratings by Moody’s and Standard & Poor’s ratings are A1 and A+, respectively.Moody’s bond ratings range from AAA (highest quality) to C (lowest quality) and apply a numberqualifier (1-high, 2-mid and 3-low) for each letter range. Standard & Poor’s top four bond ratings (AAA,AA, A and BBB) generally are regarded as eligible for bank investment (AAA is highest rating). The latestrating was in June 2014. Moody’s noted the District’s strength was sizable, wealthy service area andsound debt service coverage supported by annual rate increases. In addition to the items Moody noted,S&P noted the District’s sound system operations with virtually unlimited water supply and goodfinancial flexibility due to the affordability of the water rates. Moody’s noted as a challenge the weaklegal security. The weak legal security references that the District has to be in default before evoking themunicipalities’ ‘double barrel’ general taxes cure. S&P noted the lack of autonomy in raising water ratesbecause Maine Public Utilities Commission must approve all increases and the fact additional debtneeds, absent future rate increases, may pressure the debt service coverage.
The current Portland Fund wastewater bond rating by Moody’s and Standard & Poor’s ratings are AA1and AA, respectively. Because the municipalities are ultimately responsible for wastewater debt, bothfirms used Portland’s general obligation bond rating. Both noted the relatively strong regional economy,diverse tax base and above average socioeconomics factors along with the strong city’s financialperformance.
Maine Municipal Bond Bank
The Maine Municipal Bond Bank was created in 1972 by the Maine State Legislature. The agency has animmense history of providing Maine’s cities, towns, school systems, water and sewer districts, and othergovernmental entities access to low cost capital funds through the sale of its highly rated tax-exemptbonds. Established as an independent agency, the Bond Bank is administered by a board ofcommissioners appointed by the Governor. The Bond Bank works closely with its municipal clientele toprovide unique, cost effective and competitive financing programs.

234 Capital Finance
Bond Limits
The District has no legal limits of debt. A board approved policy establishes a target maximum level ofdebt service to 35% of total fund budget and minimum debt service ratio of 1.25. The table indicates thecurrent status and projected status. The projected status is based on the projection included at the endof the Revenue section and includes bond financed capital projects as noted in the 5-year capital plan inthe Capital Expenditures section.
The Gorham & Windham fund exceeds the debt service target due to a 2009 project requested by bothmunicipalities. The project connected the Little Falls area to the Westbrook Regional Treatment Facility.The ratios for all communities except for Cumberland improved over the prior year. The shortfall in thedebt service ratio is primarily due to utilization of operating fund balances greater than target fundbalance.
Percent of Budget Dedicated to Debt Service – Target: Not to Exceed 35%
Funds 2014 2015 2016 2017 2018 2019
Water 17% 17% 20% 22% 25% 26%
Wastewater
Cape Elizabeth 14% 14% 19% 26% 25% 25%
Cumberland 2% 2% 2% 2% 2% 2%
Gorham 37% 36% 35% 34% 35% 33%
Portland 20% 18% 19% 23% 25% 24%
Westbrook 16% 16% 18% 15% 16% 16%
Windham 44% 43% 42% 41% 41% 40%
Debt Service Ratio – Target: Greater or Equal to 1.25
Funds 2014 2015 2016 2017 2018 2019
Water 1.87 1.98 1.73 1.57 1.45 1.44
Wastewater
Cape Elizabeth 1.50 1.49 1.21 0.97 1.20 1.23
Cumberland 0.28 2.81 2.05 3.30 4.58 5.89
Gorham 1.19 1.34 1.32 1.35 1.33 1.41
Portland 1.40 1.43 1.42 1.32 1.27 1.33
Westbrook 2.01 2.01 1.76 2.13 1.90 1.92
Windham 1.23 1.23 1.20 1.19 1.20 1.24

235 Capital Finance
Water & Wastewater Funds Debt Service
Long-Term Debt
The District has $4,853,279 and $1,823,770 of principal and interest payments in 2015. Of the total,$4,424,529 and $1,581,990 of principal and interest, respectively, are expensed to the individual funds.A portion of the debt service related to Meters is allocated directly to water and wastewater funds(principal of $428,750 and interest of $241,870). The Meter debt service relates to bonds issued formeters that are used for both water and wastewater purposes and is allocated based on relative benefitreceived by each fund.
Intra-Fund Note and Bond Anticipation Notes
The Windham Intra-fund note payable to Westbrook is for Windham’s portion of a one-time buy-in ofthe regional treatment facility. The original note of $264,733 was issued on 4/1/08 at 4.395% interestwith annual principal and interest payments. The 2015 principal and interest expense accrued are$13,240 and $7,710 respectively.
Debt Issuance Expense
The Water and Wastewater funds incur costs for issuance of the permanent financing. Prior to 2014governments were allowed to carry the cost of these issuances on their balance sheets and write off theexpense over the life of the debt. A change in accounting rules now requires that all issuance costs berecognized in the year of debt issuance. That cost in 2015 is estimated to be $14,748.
In addition, the accounting rule change required governments expense any past issuance expenses theyhad on their balance sheets. This amount, $164,421, was expensed to the various District funds in 2013.There was no impact to the 2015 Budget for this expense recognition.
Administrative Fees
Maine Municipal Bond Bank bonds issued under the Drinking Water State Revolving Fund (DWSRF) forWater and the State Revolving Fund (SRF) for Wastewater access an administrative fee of 5% of eachyear’s principal and coupon interest payments. Maine Municipal Bond Bank Non-SRF bonds do notaccess any administrative fees. Water and Wastewater bonds issued as stand-alone bonds directly tothe market also do not access administrative fees.

236 Capital Finance
Water & Wastewater Funds Debt Service (continued)
Summary of Debt Service
Funds Principal Interest
Intra-Fund
Note
Debt
Issuance
Expense
MMBB &
DEP Admin
Fees
Debt
Service
Total
Direct Charges:
Water $2,101,551 $1,028,040 $0 $10,574 $30,483 $3,170,648
Wastewater:
Cape Elizabeth 134,250 32,575 - 734 7,108 174,667
Cumberland 6,250 1,058 - - 366 7,674
Gorham 303,069 74,872 - - 15,502 393,443
Portland 1,502,354 292,324 - 2,000 44,638 1,841,316
Westbrook 276,170 128,117 (13,240) 1,440 7,759 400,246
Windham 100,885 24,914 20,950 - 5,296 152,045
Subtotal - Wastewater 2,322,978 553,860 7,710 4,174 80,669 2,969,391
Total Direct Charges 4,424,529 1,581,900 7,710 14,748 111,152 6,140,039
Meters Allocated:
Water 267,699 148,486 - - - 416,185
Wastewater:
Cape Elizabeth 10,809 6,058 - - - 16,867
Cumberland 4,670 2,622 - - - 7,292
Gorham 7,836 4,402 - - - 12,238
Portland 81,857 46,084 - - - 127,941
Westbrook 20,038 11,274 - - - 31,312
Windham 332 187 - - - 519
Subtotal - Wastewater 125,542 70,627 - - - 196,169
Contracted Services:
Falmouth - - - - - -
Scarborough 3,937 2,583 - - - 6,520
South Portland 31,572 20,174 - - - 51,746
Total Meters Allocated 428,750 241,870 - - - 670,620
Debt Service - Funds 4,853,279 1,823,770 7,710 14,748 111,152 6,810,659
Debt Service (Total) 4,853,279 1,823,770 7,710 14,748 111,152 6,810,659

237 Capital Finance
Debt Service Summary
The debt service expense for each fund consists of two parts:
Fund Debt Service – These charges are related to assets belonging to the specific fund such as treatmentplants, pump stations, mains, etc.
Meter Debt Service – Meters are an asset of the Water fund but are used to calculate both water andwastewater bills. The debt related to meters is allocated to each fund based on number and size of themeters in each municipality.
Together, these two are combined to become each fund’s debt service expense.
Fund Meter Total
Water $3,170,648 $416,185 $3,586,833
Wastewater:
Cape Elizabeth 174,667 16,867 191,534
Cumberland 7,674 7,292 14,966
Gorham 393,443 12,238 405,681
Portland 1,841,316 127,941 1,969,257
Westbrook 400,246 31,312 431,558
Windham 152,045 519 152,564
Contracted Services:
Falmouth - - -
Scarborough - 6,520 6,520
South Portland - 51,746 51,746
$6,140,039 $670,620 $6,810,659

238 Capital Finance
Water Debt
The Water Fund has significant future bond financing needs including completing the 407 zone systemupgrade and main renewals. Starting in 2014, it is proposed that an additional $2 million be bonded topay for main renewal and be funded through the capital reserve.
$-
$2,000,000
$4,000,000
$6,000,000
$8,000,000
$10,000,000
$12,000,000
20
13
20
14
20
15
20
16
20
17
20
18
20
19
20
20
20
21
20
22
20
23
20
24
20
25
20
26
20
27
20
28
20
29
20
30
20
31
20
32
20
33
20
34
20
35
Capital Reserve
Current Main
Other Project
407 Zone
Existing Debt
0%
5%
10%
15%
20%
25%
30%
35%
Board Policy: No more than 35% of RevenueAssumptions: Water Rate Increases of 3% per year
Debt Service as Percent of Revenue
Projected Debt Service

Capital Finance
Water Funds Long-Term Debt
Long-Term Debt Detail:
The table below is a list of all outstanding water fund bonds. A significant amount of debt will be paid off in the
current year and will mitigate the debt service of the new bonds scheduled to be issued.
2014 bond issues may appear in the proposed section if the target issue date is after the publication date of
2015 budget.
239
IssueDate BondID Maturity Range of Interest
Original Issue
Principal
Yr End 2014
Balance Principal Balance
Yr End 2015 2015
Interest ExpPurpose
2015
PUC_Docket#Issue Cost
MMBB/DEP
Admin Fee
Existing Debt Water General LTD
10/27/2005 WTR05-02 2025General Assets $45,000 $450,000 $495,000 $900,000 $18,940 5.0000% 3.0000% - 2005-48810/26/2006 WTR06-01 2026General Assets $75,000 $825,000 $900,000 $1,500,000 $33,426 6.0000% 3.0000% - 2006-51009/01/2007 WTR07-03 2027General Assets $321,250 $3,840,000 $4,161,250 $6,125,000 $170,679 4.2500% 4.2500% - 2006-732 & 2007-33310/30/2008 WTR08-01 2028General Assets $75,000 $975,000 $1,050,000 $1,500,000 $52,363 5.5750% 2.0750% - 2008-36004/01/2009 WTR09-01 2028General Assets (407 Zone) $79,925 $1,039,025 $1,118,950 $1,598,500 $11,609 1.0500% 1.0500% - 2008-360 AMENDED$4,584
08/28/2009 WTR09-04 2029General Assets (ARRA) $149,553 $2,093,746 $2,243,300 $2,991,066 $0 0.0000% 0.0000% - 2009-128$7,478
08/28/2009 WTR09-05 2029General Assets (ARRA) $8,198 $114,767 $122,965 $163,953 $0 0.0000% 0.0000% - 2009-128$410
05/27/2010 WTR10-02 2030General Assets (RZEDB) $25,000 $375,000 $400,000 $400,000 $11,003 5.7460% 3.3640% - 2010-6211/01/2010 WTR10-03 2030General Assets (DWSRF) $45,125 $676,875 $722,000 $902,500 $7,145 1.0000% 1.0000% - 2010-62$2,617
10/27/2011 WTR11-01 2031General Assets $115,000 $1,840,000 $1,955,000 $2,300,000 $62,872 5.5000% 0.5000% - 2011-26605/01/2012 WTR12-03 2032Ozone UV Design & Forest Ave (DWSRF) $56,500 $960,500 $1,017,000 $1,130,000 $9,793 1.0000% 1.0000% - 2011-266$3,319
10/25/2012 WTR12-01 2032General Assets $100,000 $1,700,000 $1,800,000 $2,000,000 $48,882 3.7060% 1.4800% - 2012-35705/01/2013 WTR13-01 2032Ozone-UV Construction Phase 1 (DWSRF) $150,000 $2,550,000 $2,700,000 $2,850,000 $26,750 1.0000% 1.0000% - 2011-266$8,850
05/23/2013 WTR13-04 2033General Assets $71,400 $1,285,200 $1,356,600 $1,428,000 $33,900 3.7000% 0.7300% - 2013-0016711/04/2013 WTR13-06 2034Ozone-UV Construction Phase 2 $400,000 $7,600,000 $8,000,000 $8,000,000 $275,967 4.2500% 2.0000% - 2011-26611/15/2013 WTR13-05 2033General Assets (DWSRF) $53,600 $964,800 $1,018,400 $1,072,000 $10,801 1.0700% 1.0700% - 2013-00167$3,225
06/30/2014 WTR14-01 2034General Assets $131,000 $2,410,000 $2,541,000 $2,541,000 $69,290 3.5000% 3.0000% - 2014-0009306/30/2014 WTR14-02 2024General Assets - Capital Reserve $200,000 $1,800,000 $2,000,000 $2,000,000 $48,992 3.0000% 3.0000% - 2014-00093
$33,601,464 Total Existing Debt Water General LTD $2,101,551 $31,499,913 $892,412 $30,483
Proposed Water General LTD
09/01/2015 WT_407 PS Constr_2 2035407 Zone Pump Station Construction $0 $2,000,000 $2,000,000 $33,333 5.0000% 5.0000% - $2,500 $0
09/01/2015 WT_GA2015 CR_2 2025Water General Assets - Capital Reserve $0 $2,000,000 $2,000,000 $33,333 5.0000% 5.0000% - $2,500 $0
09/01/2015 WT_GA2015_6 2035Water Gen Asset/Ozone UV Construction $0 $4,000,000 $4,000,000 $66,667 5.0000% 5.0000% - $5,000 $0
11/01/2015 WT_GA2015_4 2035General Assets (DWSRF) $0 $459,000 $459,000 $2,295 3.0000% 3.0000% - $574 $0
$0 $8,459,000 $135,628 $0 $10,574 $0 Total Proposed Debt Water General LTD
$39,958,913 $1,028,040 $2,101,551 $33,601,464 Total Existing and Proposed Debt Water General LTD $10,574 $30,483
Existing Debt Meters Allocated
09/01/2007 WTR07-01 2027Meters $175,000 $2,100,000 $2,275,000 $3,500,000 $93,316 4.2500% 4.2500% - 2006-40309/01/2007 WTR07-02 2027Sub-meters $18,750 $225,000 $243,750 $375,000 $9,999 4.2500% 4.2500% - 2006-40305/28/2009 WTR09-02 2029Meters $225,990 $3,163,860 $3,389,850 $4,519,800 $133,242 5.5800% 2.0800% - 2006-40305/28/2009 WTR09-03 2029Sub-Meters $9,010 $126,140 $135,150 $180,200 $5,312 5.5800% 0.0000% - 2006-403
$6,043,750 Total Existing Debt Meters Allocated $428,750 $5,615,000 $241,869
$45,573,913 $1,269,909 $2,530,301 $39,645,214 Total Existing and Proposed Water Debt $30,483 $10,574

Capital Finance
Wastewater Funds Long-Term Debt
Long-Term Debt Detail:
The tables below contain a list of all outstanding debt for Cape Elizabeth, Cumberland, Gorham and Portland
wastewater funds. Bonds for the Westbrook Regional Wastewater Treatment Plant and related interception
assets are proportionately split between Westbrook, Windham and Gorham.
2014 bond issues may appear in the proposed section if the target issue date is after the publication date of the
2015 budget.
240
IssueDate BondID Maturity Range of Interest
Original Issue
Principal
Yr End 2014
Balance Principal Balance
Yr End 2015 2015
Interest Exp DEP Mgt Fee
Accrued 2015 Interest & Fees
Interest ExpensePurpose
MMBB/DEP
Admin Fee Issue Cost
Existing Debt Cape Elizabeth
10/30/2008 WW08-03 2028Cape - Generators $4,750 $61,750 $66,500 $95,000 $3,316 $0 $3,316 5.5750% 2.0750% -12/16/2011 WW11-01 2031CESO Treatment / Spurwink (SRF) $121,500 $1,944,000 $2,065,500 $2,430,000 $20,453 $0 $20,453 1.0000% 1.0000% - $7,108
10/25/2012 WW12-03 2032Cape Ottawa Rd CSO Studies / Treatment $8,000 $136,000 $144,000 $160,000 $3,911 $0 $3,911 3.7060% 1.4800% -
$2,276,000 Total Existing Debt Cape Elizabeth $134,250 $2,141,750 $27,679 $0 $27,679 $7,108
Proposed Cape Elizabeth
11/01/2015 WW_Cape TP/PS Misc_2 2035Cape TP/PS Misc. Projects $0 $337,500 $337,500 $2,813 $0 $2,813 5.0000% 5.0000% - $421 $0
11/01/2015 WW_Garden Ln_7 2035Garden Lane P.S. Upgrade $0 $250,000 $250,000 $2,083 $0 $2,083 5.0000% 5.0000% - $313 $0
$0 $587,500 $4,896 $4,896 $0 $0 Total Proposed Debt Cape Elizabeth $734
$0 $32,575 $2,729,250 $32,575 $134,250 $2,276,000 Total Existing and Proposed Debt Cape Elizabeth $7,108 $734
Existing Debt Cumberland
12/22/2006 WW06-01 2026Cumberland -Tuttle Pump Station (SRF) $6,250 $68,750 $75,000 $125,000 $1,058 $0 $1,058 1.4200% 1.4200% - $366
$75,000 Total Existing Debt Cumberland $6,250 $68,750 $1,058 $0 $1,058 $366
Existing Debt Gorham
04/01/2003 WW03-03 2022Westbrook Treatment Dewatering (SRF) $3,906 $26,806 $30,712 $78,120 $383 $0 $383 4.2030% 0.0000% - $65
11/13/2003 WW03-14 2023Westbrook Treatment Headworks Upgrade (SRF) $3,659 $29,120 $32,780 $73,185 $391 $0 $391 4.4930% 0.0000% - $146
12/01/2005 WW05-02 2025WB Cottage Place/ E. Bridge PS upgrades (SRF) $12,600 $126,000 $138,600 $252,000 $2,242 $0 $2,242 1.6300% 1.6300% - $743
07/02/2007 WW07-01 2017GR Portion -Treatment Water Plant & Scum (SRF) $14,600 $29,200 $43,800 $146,000 $365 $0 $365 1.0000% 1.0000% - $752
05/15/2008 WW08-01 2028WB Treatment Generator / Electrical Upgrades $2,520 $32,760 $35,280 $50,400 $1,512 $0 $1,512 5.5000% 2.0000% -10/30/2008 WW08-02 2029Westbrook Cottage Place/ E. Bridge PS Screens $23,734 $332,270 $356,004 $474,672 $18,343 $0 $18,343 5.5750% 2.0750% -01/15/2009 WW09-01 2028Little Falls Conveyance (SRF) $215,061 $2,795,793 $3,010,854 $4,258,208 $42,582 $0 $42,582 1.4400% 1.4400% - $12,921
02/27/2009 WW09-02 2028WB Headworks/Cottage Place/ E Bridge (SRF) $12,674 $164,759 $177,433 $253,475 $1,743 $0 $1,743 1.0000% 1.0000% - $722
05/28/2009 WW09-04 2029Little Falls Conveyance $11,698 $163,768 $175,466 $233,954 $6,897 $0 $6,897 5.5800% 2.0800% -11/01/2010 WW10-04 2030Westbrook Treatment Misc Upgrades (SRF) $2,618 $39,270 $41,888 $52,360 $415 $0 $415 1.0000% 1.0000% - $152
$4,042,816 Total Existing Debt Gorham $303,069 $3,739,746 $74,872 $0 $74,872 $15,502

Capital Finance
Wastewater Funds Long-Term Debt (continued
Long-Term Debt Detail: (continued)
The tables below contain a list of all outstanding debt for Cape Elizabeth, Cumberland, Gorham and Portland
wastewater funds. Bonds for the Westbrook Regional Wastewater Treatment Plant and related interception
assets are proportionately split between Westbrook, Windham and Gorham.
2014 bond issues may appear in the proposed section if the target issue date is after the publication date of the
2015 budget.
241
IssueDate BondID Maturity Range of Interest
Original Issue
Principal
Yr End 2014
Balance Principal Balance
Yr End 2015 2015
Interest Exp DEP Mgt Fee
Accrued 2015 Interest & Fees
Interest ExpensePurpose
MMBB/DEP
Admin Fee Issue Cost
Existing Debt Portland
05/23/1996 WW96-01 2016Portland CSO Upgrades $45,000 $45,000 $90,000 $900,000 $3,591 $0 $3,591 5.9010% 5.9010% -10/30/1997 WW97-01 2017Peaks Torrington Point Upgrades $55,000 $110,000 $165,000 $1,100,000 $7,215 $0 $7,215 5.3800% 5.3800% -10/26/2001 WW01-01 2021Peaks Ryefield / Seashore Upgrades (SRF) $139,250 $835,500 $974,750 $2,785,000 $19,982 $0 $19,982 2.1000% 2.1000% - $2,396
11/01/2001 WW01-02 2021EETreatment Clarifiers/Screens/Grit Upgrades (SRF) $62,500 $375,000 $437,500 $1,250,000 $8,969 $0 $8,969 2.1000% 2.1000% - $1,075
04/01/2003 WW03-01 2020Refund Issue EETF Clarifiers/Screens/Grit (SRF) $89,750 $444,011 $533,761 $1,615,500 $5,436 $0 $5,436 4.0590% 0.0000% - $1,447
04/01/2003 WW03-02 2022Portland Treatment Odor Control (SRF) $260,000 $1,784,302 $2,044,302 $5,200,000 $25,523 $0 $25,523 4.2030% 0.0000% - $4,344
11/13/2003 WW03-12 2023EETF Dewatering/Clarifiers/Screens/Grit (SRF) $61,500 $483,850 $545,350 $1,230,000 $5,338 $0 $5,338 4.4930% 0.0000% - $2,459
11/13/2003 WW03-13 2023EE Treatment Primary Sedimentation & Odor (SRF) $100,000 $798,721 $898,721 $2,000,000 $11,972 $0 $11,972 4.4930% 0.0000% - $3,999
12/03/2004 WW04-01 2024EE Treatment Odor Control (SRF) $18,750 $168,750 $187,500 $375,000 $2,431 $0 $2,431 1.3300% 1.3300% - $744
12/03/2004 WW04-02 2024EE Treatment Dewatering (SRF) $87,000 $783,000 $870,000 $1,740,000 $11,282 $0 $11,282 1.3300% 1.3300% - $3,450
12/01/2005 WW05-01 2025EE Treatment Hypochlorite Upgrade (SRF) $95,000 $950,000 $1,045,000 $1,900,000 $16,904 $0 $16,904 1.6300% 1.6300% - $5,602
04/01/2009 WW09-03 2028Portland India Pump Station Upgrade (SRF) $280,994 $3,652,922 $3,933,916 $5,700,000 $57,140 $0 $57,140 1.4700% 1.4700% - $16,941
11/01/2010 WW10-03 2030Portland Northeast & Pump Station Upgrades (SRF) $37,610 $564,150 $601,760 $752,200 $5,955 $0 $5,955 1.0000% 1.0000% - $2,181
10/27/2011 WW11-02 2031Portland Pump Station Upgrades $20,000 $320,000 $340,000 $400,000 $10,934 $0 $10,934 5.5000% 0.5000% -11/04/2013 WW13-02 2033Peaks Island Sewer Extension $150,000 $2,700,000 $2,850,000 $3,000,000 $95,650 $0 $95,650 4.0000% 3.0000% -
$15,517,561 Total Existing Debt Portland $1,502,354 $14,015,207 $288,324 $0 $288,324 $44,638
Proposed Portland
11/01/2015 WW_Fore_River_SRF_3 2035Fore River P.S. Upgrades (SRF) $0 $1,600,000 $1,600,000 $0 $4,000 $4,000 3.0000% 3.0000% - $2,000 $0
$0 $1,600,000 $0 $4,000 $4,000 $0 Total Proposed Debt Portland $2,000
$4,000 $292,324 $15,615,207 $288,324 $1,502,354 $15,517,561 Total Existing and Proposed Debt Portland $44,638 $2,000

Capital Finance
Wastewater Funds Long-Term Debt (continued):
Long-Term Debt Detail: (continued)
The tables below contain a list of all outstanding debt for the Westbrook wastewater fund. Bonds for the
Westbrook Regional Wastewater Treatment Plant and related interception assets are proportionately split
between Westbrook, Windham and Gorham.
2014 Bond issues may appear in the proposed section if the target issue date is after the publication date of the
2015 budget.
242
IssueDate BondID Maturity Range of Interest
Original Issue
Principal
Yr End 2014
Balance Principal Balance
Yr End 2015 2015
Interest Exp DEP Mgt Fee
Accrued 2015 Interest & Fees
Interest ExpensePurpose
MMBB/DEP
Admin Fee Issue Cost
Existing Debt Westbrook
04/01/2003 WW03-03 2022Westbrook Treatment Dewatering (SRF) $14,210 $97,522 $111,732 $284,208 $1,395 $0 $1,395 4.2030% 0.0000% - $237
11/13/2003 WW03-14 2023Westbrook Treatment Headworks Upgrade (SRF) $13,313 $105,943 $119,255 $266,254 $1,421 $0 $1,421 4.4930% 0.0000% - $532
12/01/2005 WW05-02 2025WB Cottage Place/ E. Bridge PS upgrades (SRF) $65,840 $658,400 $724,240 $1,316,800 $11,716 $0 $11,716 1.6300% 1.6300% - $3,882
05/15/2008 WW08-01 2028WB Treatment Generator / Electrical Upgrades $9,168 $119,184 $128,352 $183,360 $5,501 $0 $5,501 5.5000% 2.0000% -10/30/2008 WW08-02 2029Westbrook Cottage Place/ E. Bridge PS Screens $119,232 $1,669,249 $1,788,481 $2,384,641 $92,152 $0 $92,152 5.5750% 2.0750% -02/27/2009 WW09-02 2028WB Headworks/Cottage Place/ E Bridge (SRF) $48,746 $633,701 $682,448 $974,925 $6,703 $0 $6,703 1.0000% 1.0000% - $2,779
11/01/2010 WW10-04 2030Westbrook Treatment Misc Upgrades (SRF) $5,661 $84,915 $90,576 $113,220 $896 $0 $896 1.0000% 1.0000% - $328
$3,645,084 Total Existing Debt Westbrook $276,170 $3,368,913 $119,784 $0 $119,784 $7,759
Proposed Westbrook
11/01/2015 WW_CSO DES_CONST_2 2035CSO Design & Construction $0 $1,000,000 $1,000,000 $8,333 $0 $8,333 5.0000% 5.0000% - $1,440 $0
$0 $1,000,000 $8,333 $8,333 $0 $0 Total Proposed Debt Westbrook $0.00 $1,440
$0 $128,117 $4,368,913 $128,117 $276,170 $3,645,084 Total Existing and Proposed Debt Westbrook $7,759 $1,440

Capital Finance
Wastewater Funds Long-Term Debt (continued):
Long-Term Debt Detail: (continued)
The tables below contain a list of all outstanding debt for the Windham wastewater fund. Bonds for the
Westbrook Regional Wastewater Treatment Plant and related interception assets are proportionately split
between Westbrook, Windham and Gorham.
2014 Bond issues may appear in the proposed section if the target issue date is after the publication date of the
2015 budget.
243
IssueDate BondID Maturity Range of Interest
Original Issue
Principal
Yr End 2014
Balance Principal Balance
Yr End 2015 2015
Interest Exp DEP Mgt Fee
Accrued 2015 Interest & Fees
Interest ExpensePurpose
MMBB/DEP
Admin Fee Issue Cost
Existing Debt Windham
04/01/2003 WW03-03 2022Westbrook Treatment Dewatering (SRF) $484 $3,319 $3,802 $9,672 $47 $0 $47 4.2030% 0.0000% - $8
11/13/2003 WW03-14 2023Westbrook Treatment Headworks Upgrade (SRF) $453 $3,605 $4,058 $9,061 $48 $0 $48 4.4930% 0.0000% - $18
12/01/2005 WW05-02 2025WB Cottage Place/ E. Bridge PS upgrades (SRF) $1,560 $15,600 $17,160 $31,200 $278 $0 $278 1.6300% 1.6300% - $92
05/15/2008 WW08-01 2028WB Treatment Generator / Electrical Upgrades $312 $4,056 $4,368 $6,240 $187 $0 $187 5.5000% 2.0000% -10/30/2008 WW08-02 2029Westbrook Cottage Place/ E. Bridge PS Screens $2,034 $28,481 $30,515 $40,687 $1,572 $0 $1,572 5.5750% 2.0750% -01/15/2009 WW09-01 2028Little Falls Conveyance (SRF) $84,939 $1,104,207 $1,189,146 $1,681,792 $16,818 $0 $16,818 1.4400% 1.4400% - $5,103
02/27/2009 WW09-02 2028WB Headworks/Cottage Place/ E Bridge (SRF) $1,080 $14,040 $15,120 $21,600 $149 $0 $149 1.0000% 1.0000% - $62
05/28/2009 WW09-04 2029Little Falls Conveyance $9,802 $137,232 $147,034 $196,046 $5,779 $0 $5,779 5.5800% 2.0800% -11/01/2010 WW10-04 2030Westbrook Treatment Misc Upgrades (SRF) $221 $3,315 $3,536 $4,420 $35 $0 $35 1.0000% 1.0000% - $13
$1,414,740 Total Existing Debt Windham $100,885 $1,313,855 $24,914 $0 $24,914 $5,296
244 Capital Finance
Capital Reserve – Water
In 2013, a new state law (35-A M.R.S. 6107-A, Funding for infrastructure improvements for waterutilities) was enacted. The law allows a water utility to fund future infrastructure improvements throughrecovery in rates. As required by the law, the Maine Public Utilities Commission adopted a rule (Chapter675 – Infrastructure Surcharge and Capital Reserve Accounts) that outlines the maximum amount offunds the may be recovered through rates, use of those funds, and reporting requirements.
The maximum dollar amount of funds that may be recovered through rates depends on the size of theutility. Portland Water District is considered a large utility (utilities with revenues greater than $750,000are considered large) and therefore the amount of revenue requirement attributed to funding a capitalreserve should not exceed either of the following:
1% of Gross Plant $ 2,678,40010% of Revenue Requirement $ 2,078,065
The capital reserve can only be used to pay for the costs of construction associated with the projectsidentified in the utility’s System Infrastructure Assessment Report (SIA) and are related to transmission,distribution, and treatment of water. The District submitted a SIA that identified water mains that needto be replaced due to age or type of material.
The District has chosen to increase each year an additional 1% for 10 years with the revenue reserved topay the debt service costs of issuing a $2 million bond each year. The bond proceeds will be used toreplace water mains identified in the SIA.
The 2015 budget assumes 1% of the proposed 3.8% water rate adjustment be dedicated to the capitalreserve. In 2014, 1% of the 2.9% rate adjustment was dedicated to the reserve.
.
2014
Budget
2015
Budget
2014 Rate Increase 138,931 207,423
2015 Rate Increase - 141,733
Revenue 138,931 349,156
2014 Issue Principal - 200,000
2014 Issue Interest 24,382 48,992
2015 Issue Principal - -
2015 Issue Interest - 33,333
Expense 24,382 282,325
Annual Change 114,549 66,831
Carry Forward - 114,549
Accumulated Balance 114,549 181,380

245 Capital Finance
Renewal & Replacement
Each fund contributes to a renewal and replacement (R&R) fund. These funds are used to pay forsmaller capital projections as an alternative to issuing long term debt. Each fund maintains an R&R fundfor assets owned by that fund. In addition, R&R balances are maintained for other groups of assets that,while owned by the Water fund, serve the needs of all District funds. These other R&R balances are:
Douglass St – This fund is for the building and grounds that serve as the District’s main headquarters.
Meters – Water meters measure water flow but provide data used in both water and wastewater billing.
Technology – This category includes both computer hardware and software systems that serve allDistrict funds.
Transportation – These assets are used by all District funds. The charge for the R&R funding is part ofthe hourly rate of each vehicle (an internal line item).
2015 Contributions:
Fund Douglass St Meters Technology Combined* Total
Water $2,600,000 $94,875 $91,784 $109,220 $295,879 $2,895,879
Wastewater:
Cape Elizabeth 80,000 4,860 2,478 7,340 14,678 94,678
Cumberland 19,628 2,280 1,232 4,240 7,752 27,380
Gorham 127,947 3,795 2,044 5,860 11,699 139,646
Portland 728,196 33,855 24,276 58,100 116,231 844,427
Westbrook 407,904 7,920 5,768 13,380 27,068 434,972
Windham 32,687 975 112 1,860 2,947 35,634
Contracted Services:
Falmouth - - - - - -
Scarborough - 15 1,610 - 1,625 1,625
South Portland - 1,425 10,696 - 12,121 12,121
R&R - Funds 3,996,362 150,000 140,000 200,000 490,000 4,486,362
R&R - Transportation 380,000
R&R - Total 4,866,362
*Combined = Douglass St + Meters + Technology

246 Capital Finance
Water Fund - Renewal & Replacement Fund
A total of $3,470,000 is contributed to the renewal and replacement fund in 2014. Similar to the debtservice costs, renewal and replacement reserve is directly received from the fund or indirectly throughappropriate allocation method from all funds. The Water renewal and replacement contribution iscapped at approximately $3,690,000, which is the estimated depreciation of all water assets, per MainePublic Utility Commission rules. Starting in 2011, the District began to track and reserve balances bydifferent categories of renewal & replacement with part of the general surplus designated to thetransportation, technology, meter and Douglass Street building reserves.
0
1,000
2,000
3,000
4,000
2011 2012 2013 2014 2015
Water Fund - R&R Contribution($,000)
Transportation
Technology
Meter
Douglass Street
Water General
Water General Douglass Street Water Meters Transportation Technology Total
Balance 12/31/12 1,579,896 272,288 271,555 133,761 117,283 2,374,783
Contribution - 2013 2,400,000 150,000 140,000 380,000 200,000 3,270,000
Expenditure (2,109,156) (147,800) (117,368) (318,490) (69,183) (2,761,997)
Balance 12/31/13 1,870,740 274,488 294,187 195,271 248,100 2,882,786
Contribution - 2014 2,400,000 150,000 140,000 380,000 200,000 3,270,000
Expenditure (Est'd) (3,436,500) (144,500) (225,000) (275,000) (147,000) (4,228,000)
Balance 12/31/14 (Est'd) 834,240 279,988 209,187 300,271 301,100 1,924,786
Contribution - 2015 2,600,000 150,000 140,000 380,000 200,000 3,470,000
Expenditure (Est'd) (1,846,000) (210,000) (190,000) (275,000) (265,000) (2,786,000)
Balance 12/31/15 (Est'd) 1,588,240 219,988 159,187 405,271 236,100 2,608,786
Target Renewal and
Replacement (1% of Gross
Fixed Asset Cost) $2,687,840

247 Capital Finance
Wastewater Funds - Renewal & Replacement Funds
Each wastewater fund includes an annual contribution to the renewal and replacement (R&R) reserve tofinance capital additions or replacements.
At the end of 2013, operating surpluses in Gorham, Portland, Westbrook and Windham weretransferred to each fund’s R&R fund. In addition, the proceeds from that sale easement were placed inPortland’s R&R fund.
In 2015, R&R contributions stayed the same in Cape Elizabeth, Cumberland and Portland. Gorham had arelatively large increase (from $67,313 to 127,947) while Westbrook and Windham had small upwardincreases. Increases were made to provide funding for anticipated future capital projects at theWestbrook Regional Treatment facility. As a group, the Wastewater funds increased their R&Rcontributions by $63,412 (4.8%).
Recently, the State Revolving Loan program amended their program to grant principal forgiveness toorganization that implemented good asset management practices including allocating at least 2% of theannual budget into a R&R fund. The District received $270,000 and $47,800 principal forgiveness on theCape Elizabeth 2011 $2,700,000 and Portland 2010 $800,000 bonds. Both Cape Elizabeth and Portlandare contributing more than 2% of the operating budget in 2015 to their respective R&R fund.
The estimated 2015 expenditures from the R&R fund are based on the 2015 Capital ImprovementsBudget as outlined in the Capital Expenditure section.
CAPE
ELIZABETH CUMBERLAND GORHAM PORTLAND WESTBROOK WINDHAM
Balance 12/31/12 $128,499 $264,675 $456,089 $2,185,372 $921,861 $140,756
Contribution - 2013 80,000 35,000 107,017 728,196 409,910 43,727
Operating Surplus Transfer - - 80,874 52,386 133,580 15,671
Expenditure (64,745) (15,599) (125,249) (415,625) (145,120) (11,934)
Sale of Easement - - - 736 - -
Balance 12/31/13 143,754 284,076 518,731 2,551,065 1,320,231 188,220
Contribution - 2014 80,000 19,628 67,313 728,196 405,798 32,015
Operating Surplus Transfer - - - - - -
Expenditure (Est'd) (52,987) (76,500) (96,491) (1,402,351) (244,572) (13,562)
Balance 12/31/14 Estimated 170,767 227,204 489,553 1,876,910 1,481,457 206,673
Contribution - 2015 80,000 19,628 127,947 728,196 407,904 32,687
Operating Surplus Transfer - - - - - -
Expenditure (Est'd) (75,176) (48,740) (58,249) (906,477) (117,366) (24,089)
Balance 12/31/15 Estimated $175,591 $198,092 $559,251 $1,698,629 $1,771,995 $215,271
Target Renew al & Replacement
(3% of gross fixed asset cost) $471,607 $231,315 $524,756 $2,926,039 $605,745 $88,828
------------------------------------------ Wastew ater Funds ------------------------------------------

248 Capital Finance
Bond Issued for Water Treatment Plant Upgrade Project –Ultraviolet/Ozone System Upgrade
A second water treatment process, ultraviolet (UV), was completed on April 2014. Upon completion,water is now treated by both ozone and UV processes. While installing the UV system, the 20-year oldozone equipment was replaced with more cost-effective equipment.
The impact to the 2015 budget includes the debt service costs related to issuing $12 million bonds topay for the project and reduced electricity costs due to the new ozone equipment. Debt Service costs in2015 is $676,000.
Water is pumped from Sebago Lake to the plant. The water is treated with ozone. Previously, ozone wascreated from air that was compressed and cooled. The new process uses liquid oxygen. After the ozonetreatment process, the new UV process adds a second treatment process. Fluoride (teeth health),chlorine & ammonia (distribution system disinfectant), sodium hydroxide (pH control) and corrosioncontrol chemicals are added to the water before sending the water to the distribution system.

249 Capital Expenditures
S
Introduction
A five-year capital improvement plan is developed each year taking into consideration various factorsincluding Infrastructure and Operational Evaluation Plans, Strategic/Tactical Goals and Benchmarks, Multi-year Financial Projections and Board Established Budget Guidelines (described in the Introduction Section).The plan is developed with much stakeholder’s input, including input from customers, municipalities,regulators and staff. Staff recommends the Board of Trustees authorize the projects in first year of the planto be completed.
ServiceGoals
StakeholderInput
TrusteesGoals
MasterPlans
FinancialGoals

250 Capital Expenditures
Capital Improvement Program Process

251 Capital Expenditures
Infrastructure and Operational Evaluation Plans
The water and wastewater industry is an infrastructure oriented industry. Approximately 95% of theDistrict’s total assets are infrastructure assets and capital financing costs related to those assets are 30% ofthe annual budget. As the chart on the previous page indicates, a number of studies have been conducted toprovide an assessment of those assets and is the basis for the capital improvement plan. A summary of thestudies are provided below. Projects to be done in 2015 are identified by project numbers.
Water Fund
Comprehensive Waster System Strategic Plan (CWSSP) - March 2003
Camp Dresser & McKee completed the master plan of the distribution system in March of 2003. The planwas prepared to guide the development, operations and financing of the water system through year 2020.The first 7- year planning cycle (priority -1 projects 2003-2010) included an investment increase in the watermain renewal program. This annual investment increase of $1,000,000 was added to the $1,000,000 theDistrict was already funding to address the aging water main pipelines. This level of investment started in2004. In 2012 an additional $700,000 was funded for CIP # 43 Water Main Replacement and CIP #111Galvanize Replacement bringing the total investment in main renewal up to$3,000,000. In 2013, an additional $500,000 was programmed for Water MainReplacement. In 2014 an additional $2,500,000 is being proposed to be added to theCIP #43. Along with the increase in water main renewals, the District undertook thereplacement of our existing water meters with new radio read meters. The projectwas completed in 2009 as recommended in the plan.
CWSSP also recommended removal or rehabilitation of existing water storage tanks.The District has removed 3 tanks from the system – Munjoy Hill reservoir, Shore Acresand Oak Hill. In 2008 the District rehabilitated 2 tanks, Steep Falls and Gowen. In 2009 the Standish Tankwas rehabilitated and a bulk mixer added. In 2012 modifications to the concrete tanks to comply with OHSAfall protection standards were made (CIP project #203). A similar project was proposed for 2013.
In the plan, system deficiencies and recommended actions were identified. The most significant projectidentified from the priority -1 projects was inadequacies associated with service from the Elevation 407zone. CWSSP recommended the combining of the 407 north zone with the south zone. Many projects havebeen completed to that end. This included the inclusion of transmission main piping in the MDOT Rt.202/Presumpscot River Bridge project, installation of 8,000 feet of trunk main on Fort Hill road along withseveral upgrades in the Little Falls area of Gorham and Windham as part of the Little Falls ConveyanceProject. In 2008, 4,000 feet of transmission main was extended to the new pump station location on Ward’sHill road. In 2009, the transmission main was extended from the end of the Fort Hill main along HustonRoad to the proposed pump station location.
A hydraulic analysis of the combined system, final design of the proposed pump station and land acquisitionfor a new storage facility to replace the Windham Center Tank were proposed for 2011 (CIP 307) and will becompleted in 2014. In the 2012 plan, construction of the new 407 zone pump station was funded but hassince been reprogrammed to 2015.

252 Capital Expenditures
Water Fund (continued)
Southern Maine Regional Water Council – Water Master Plan Study – October 2008
The Southern Maine Regional Water Council, made up of the 7 major water utilitiesof Cumberland and York County, completed a master plan in October of 2008. Thisdocument provides the southern Maine region with a planning tool for regionalsolutions to sustainable water resources and infrastructure for the foreseeablefuture. This study attained the following goals:
• Identified existing and potential sources of supply in the region and established the present andprojected water needs in the region. Also, identified the limitations and risks of the existing andfuture supplies.
• Explored the logistics, benefits and impediments of creating an integrated, regional watersupply system.
• Detailed the hydraulic considerations and infrastructure required to supply water over a largegeographical area and evaluated potential water quality issues associated with blending varioussupplies and considered existing and future interconnections between systems.
• Developed short-term strategies for mutual-aid and sharing of resources between memberutilities and developed an action plan to protect identified resources for future generations.
• Developed an integrated water supply plan for the entire region.• Considered potential governance models for a regional supply organization.
The Council has continued to collaborate on regional utility planning and purchasing efforts and will bedeveloping an action plan to carry out the report’s recommendations.
Greater Portland Water System – Water Treatment/Alternate Source – November 2008
Camp Dresser & McKee completed a study of the Sebago Lake Water Treatment Facility in November of2008. The primary focus of the study was to evaluate design alternatives for the ultraviolet disinfectionprocess proposed to meet upcoming disinfection requirements and evaluate replacement of the existing 20-year old Ozone equipment. This study also reviewed raw water screening alternatives to replace theexisting screening equipment. The third area looked at by this study was to evaluate the potential toconnect the well supply that was being investigated in the Otter Ponds Aquifer area to the Sebago LakeWater Treatment Facility (SLWTF) as a backup or supplemental supply.
The report recommended conducting a pilot study of ultraviolet disinfection to evaluate the potential offouling on the ultraviolet disinfection equipment and to help guide the choice of location and technology.The pilot work was completed in 2011. Final design of the UV facility and Ozone replacement equipmentcommenced in 2011 and was completed in May 2012. Construction is currently underway for the $12million project and is expected to be on line by April of 2014.

253 Capital Expenditures
Water Fund (continued)
The final hydrogeological study of the Otter Ponds Aquifer well has been completed. A production well hasbeen developed, tested and is licensed for an emergency supply that could supply Standish, Gorham andWindham if needed. The in-lake screening alternative was recommended to provide raw water screeningfor SLWTF. In this alternative, large screens would be added to the two intake pipes and the screeningprocess would be removed from the current Intake Facilities. This project is proposed in 2015 (CIP #18SLWTF intakes).
Below is the newly installed liquid oxygen tanks as part of the UV disinfection and Ozone replacementProject March 2014.
New UV unit on line March of 2014
254 Capital Expenditures
Wastewater Funds
Cape Elizabeth – Sewer System
To increase the hydraulic capacity of the C ape Elizabeth WWTF, particularly during high wet weather flowevents, the plant was upgraded to accept 2.75 mgd and the bypass pump station was eliminated. Since theupgrade, the plant has performed well during several significant wet weather events.
In 2009, the District engaged Wright-Pierce to evaluate methods that could lead to elimination of anunlicensed combined sewer overflow associated with the Ottawa Road pump station in Northern CapeElizabeth. The report stated the estimated expense involved in elimination of the CSO and recommendedthat another approach be taken. This report was accepted by the Department and lead to a three-partylicense between the Town of Cape Elizabeth, the City of South Portland and the Portland Water District. TheOttawa Rd. CSO License includes the requirement for the development of a Long-Term Control Plan tomitigate the Ottawa Rd. CSO.
The scope of work will included flow monitoring and CCTV assessments in the area’s collection systems anda final plan for the mitigation of CSO’s through infiltration/inflow (I/I) reduction, pump stationimprovements, or other options. The report was submitted in 2001 and approved by the DEP in 2013. Workon the 5-year plan will begin in 2014. The majority of the work in the first years will involve the identificationand removal of private I/I sources to the collection systems.
Cape Elizabeth - Pump Stations
The District has continued with the installation of standby power generators at key pump stations. Thesegenerators enable systems to operate during the frequent power outages that occur in Cape Elizabeth whilereducing manpower during these events. Additionally, the emergency power will go a long way towardseliminating the occasional back up that has occurred within the collection system.
The Garden Circle Pump Station is regularly flooded during extreme high tides. Following the completion ofdesign in 2013, the pump station is being replaced in 2014 by a submersible station that will not be prone todamage from flooding. This will improve the reliability of the station and reduce the cost to service thisstation.
Future years will need to include the CCTV assessment of the collection system as part of the District’s 10year program to inspect its entire collection systems.

255 Capital Expenditures
Wastewater Funds (continued)
Gorham/Westbrook/Windham – Westbrook Regional Treatment Plant Evaluation - March,2001.
Wright-Pierce completed a comprehensive plant evaluation of the Westbrook Regional WWTF. The planoutlined recommended upgrades to the facility constructed in the late ‘70s. To date, the District has madeimprovements to:
The plant electrical system (including the installation of an emergency power generator)
HVAC systems
Complete roof replacement
Plant water system
Clarifier scum removal
Scum handling, and sludge handling processes
Filtrate pumps
Chlorine contact tanks
RAS pumping system
Belt filter press dewatering power pack
Polymer system
RAS and flow split to the secondary clarifiers
The Plant Control System was upgraded in 2012/2013
Proposed major modifications for a headworks upgrade were set aside in favor of installing screens at thetwo major pump stations feeding the treatment plant. Start-up of these systems at the Cottage Place andEast Bridge St. Pump Stations has successfully eliminated pump plugging and has reduced the quantity ofrags at the treatment plant.
In 2013, design and replacement of the control system began. This was completed in 2014 along withimprovements and automation of the disinfection system.
The aeration system will be evaluated beginning in late 2014 to establish a budget for upgrades. While theplant is operating well within its design capacity, the equipment will approach the end of its useful life in thenot-to-distant future. In the summer of 2014, the Department of Environmental Protection requested thattreatment plants across the State of Maine complete ambient and treatment plant effluent sampling fornitrogen and phosphorus. It seems likely that the Westbrook will have at least a phosphorus monitoringrequirement in the next permit. The 2014 study will also evaluate options for nutrient management at thetreatment plant to develop a scope and probable cost for future compliance with any regulatory mandates. .
During 2010, the Town of Windham completed a feasibility study to sewer a significant section of the townin the North Windham area. The study recommended the construction of collector sewers and interceptionto convey wastewater to the treatment plant in Westbrook. A vote in 2012 to not implement the sewerplan has placed this project on hold indefinitely.

256 Capital Expenditures
Wastewater Funds (continued)
Westbrook – Sewer System
In late 2007, the District signed a contract with Woodard & Curran, Brown & Caldwell and JordanEnvironmental to upgrade the City of Westbrook’s CSO Master Plan. This plan was completed andsubmitted to Maine DEP in 2008. Some of the work included in the plan will involve the City, and some willinvolve the District. Because the City operates the collection system, the bulk of the first five years will focuson the removal of I/I from the City collection system. Later portions of the plan will include storage andother work on District owned assets.
The flow from all CSO outfalls is now continuously monitored.
The plan will be updated in 2014 and will include a summary of the work completed in the first 5 years. Thisplan will be submitted to the DEP in 2014 and may include a revised set of projects and schedule. The planwill likely include a revised schedule to accommodate a number of current projects that have not yet beencompleted.
Gorham/Windham – Pump Stations and Collector Systems
In May of 2008, flows from the Town of Windham, the Maine Correctional Center and the Little Falls sectionof Gorham began to be treated at the Westbrook/Gorham WWTF. This action led to the closure of twooutfalls into the Presumpscot River. This project also led to an upgrade of the Tow Path pump station andthe decommissioning of the treatment plant side in 2010. Due to the relatively young age of most ofGorham’s other pump stations, preventive maintenance, condition assessment through CCTV inspection ofburied infrastructure, and minor repairs were completed in 2010.
To increase reliability and improve service during power outages, standby generators have been installed atmost of the pump stations in the Town. Growth continues in the Town of Gorham, with 2 new pumpstations added in 2014.
To ensure that accurate wastewater flow is measured and used for allocating operating costs to the Town ofGorham, a new meter was installed to measure the flow from the Town of Gorham. This meter wasinstalled and is maintained by a third party vendor as part of the District’s extensive flow monitoringprogram.
257 Capital Expenditures
Wastewater Funds (continued)
Portland Wastewater – East End Treatment Plant Evaluation – March, 1998
As a result of a comprehensive evaluation completed by Woodard & Curran, the Portland Water District hascompleted a number of key projects at the East End Wastewater Treatment Facility. Each of the majorprocesses associated with this treatment plant has been upgraded; excluding the aeration system. Majorwork that has been completed (under CIP projects 21 and 409) includes:
Grit and screenings removal systems at the headworks facility including odor control
Influent flow split into the primary sedimentation basins including odor control
Primary sedimentation basin improvements including odor control
Clarifier drive mechanism replacement and flow baffling
Change over from chlorine and sulfur gas use to sodium hypochlorite and sodium bisulfite
Modifications to the instrumentation and controls associated with the disinfection system
Complete upgrade to the sludge dewatering system and year three of a five year upgrade to HVACsystems
Major roof replacements and Demolition of obsolete equipment and systems
In addition to the large projects listed above, a number of smaller projects that supported these majorupgrades have also been completed:
Replacement of process gates for the aeration system and chlorine contact tanks
Installation of a second CSO rated screen in the headworks
Installation of a polymer system to manage high flows
Installation of nine process gates in the aeration system
The only major system that remains to be upgraded at the EEWTF is the aeration system. This upgrade willenable the treatment plant to manage the increasing pollutant loading to the treatment plant whileexercising regular process control to better manage the performance of the treatment system. Design ofthe upgrade began in 2015and construction of the project is being proposed in the draft 2015 CapitalImprovements Plan. Any improvement to the aeration system will require consideration of future possiblenutrient removal requirements that may be required by the State to ensure the system will “fit into” futureplans.
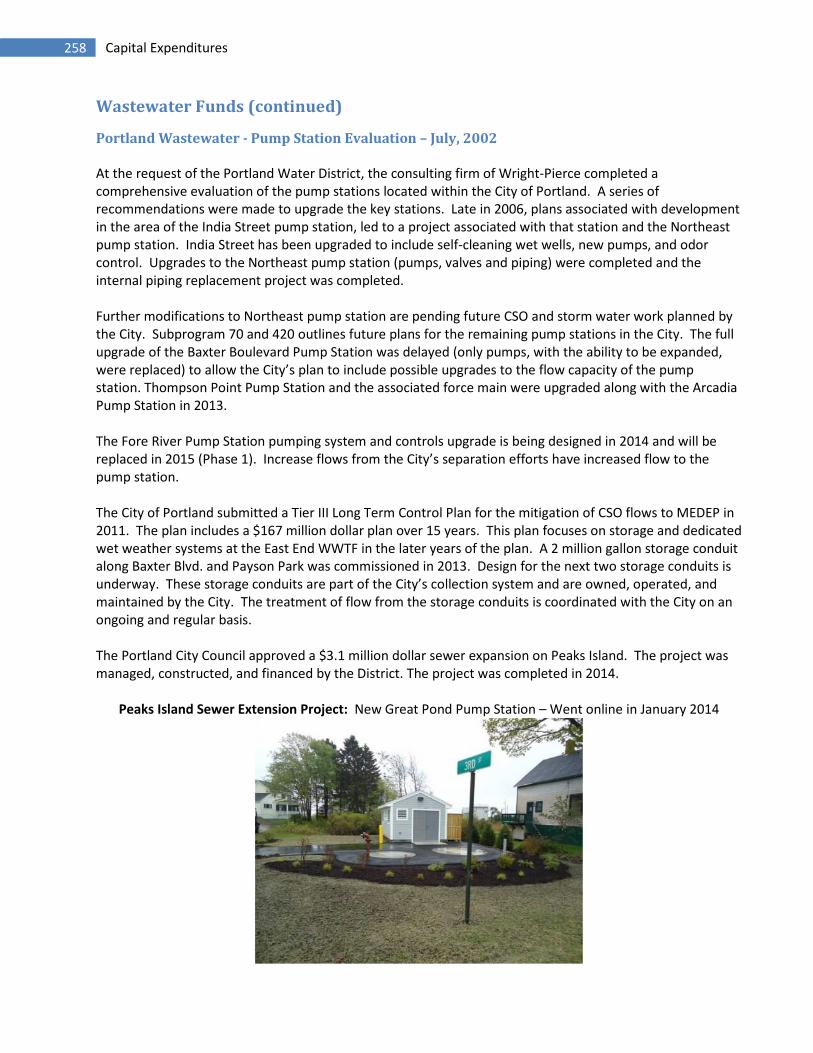
258 Capital Expenditures
Wastewater Funds (continued)
Portland Wastewater - Pump Station Evaluation – July, 2002
At the request of the Portland Water District, the consulting firm of Wright-Pierce completed acomprehensive evaluation of the pump stations located within the City of Portland. A series ofrecommendations were made to upgrade the key stations. Late in 2006, plans associated with developmentin the area of the India Street pump station, led to a project associated with that station and the Northeastpump station. India Street has been upgraded to include self-cleaning wet wells, new pumps, and odorcontrol. Upgrades to the Northeast pump station (pumps, valves and piping) were completed and theinternal piping replacement project was completed.
Further modifications to Northeast pump station are pending future CSO and storm water work planned bythe City. Subprogram 70 and 420 outlines future plans for the remaining pump stations in the City. The fullupgrade of the Baxter Boulevard Pump Station was delayed (only pumps, with the ability to be expanded,were replaced) to allow the City’s plan to include possible upgrades to the flow capacity of the pumpstation. Thompson Point Pump Station and the associated force main were upgraded along with the ArcadiaPump Station in 2013.
The Fore River Pump Station pumping system and controls upgrade is being designed in 2014 and will bereplaced in 2015 (Phase 1). Increase flows from the City’s separation efforts have increased flow to thepump station.
The City of Portland submitted a Tier III Long Term Control Plan for the mitigation of CSO flows to MEDEP in2011. The plan includes a $167 million dollar plan over 15 years. This plan focuses on storage and dedicatedwet weather systems at the East End WWTF in the later years of the plan. A 2 million gallon storage conduitalong Baxter Blvd. and Payson Park was commissioned in 2013. Design for the next two storage conduits isunderway. These storage conduits are part of the City’s collection system and are owned, operated, andmaintained by the City. The treatment of flow from the storage conduits is coordinated with the City on anongoing and regular basis.
The Portland City Council approved a $3.1 million dollar sewer expansion on Peaks Island. The project wasmanaged, constructed, and financed by the District. The project was completed in 2014.
Peaks Island Sewer Extension Project: New Great Pond Pump Station – Went online in January 2014
259 Capital Expenditures
Wastewater Funds (continued)
Cumberland – Pump Stations
In 2007, the District completed upgrading the Tuttle Road pump station and the Foreside Road pumpstation. Minor revisions were completed at Powell Road pump station in 2006. The Powell Rd. Pump Stationwas completed in 2008. This work completes major upgrades to all of the primary Cumberland pumpingstations. Planned improvements to the Cumberland system are shown in subprogram 41. The followingwas completed in 2009:
Hooking up a metering vault located on Route 88. This will give us a reading of all Cumberland flowgoing into Falmouth
Refurbishment of the Ledge Lane pump station
Minor repairs as needed
In 2011, the 4th year of CCTV assessment of buried infrastructure was completed. An emergency generatorwas installed at the Smalls Brook Crossing Pump Station. This was part of a continued program to installemergency generators at pump stations.
The District and the Town of Cumberland have investigated Infiltration and Inflow sources in the collectionsystem. CCTV work, flow monitoring, and smoke testing will be used to identify sources of I/I. The Town ofCumberland, with the District’s assistance, will also inspect homes in an effort to properly manage sumppumps and other sources of inflow. This project is intended to better understand the peak flows that will besent to Falmouth for treatment and will possible impact the capacity and cost of shared infrastructure inFalmouth.
The Town of Falmouth is contemplating the replacement of the joint use Mill Creek Pump Station and ForceMain. The project is now expected to begin in 2015 or 2016.

260 Capital Expenditures
Wastewater Funds (continued)
Wastewater – SCADA and Process Control Plan
In the early part of this decade, the District began installing Supervisory Control and Data Acquisition(SCADA) equipment throughout its service area. The goal was to bring all critical alarming back into theDistrict. Since then, standards have developed and SCADA is in place at most all of our installations. Thenext step is to meet our goal of bringing all wastewater related SCADA information into a single site locatedat the EEWTF. This will allow us to monitor each wastewater facility at a single wastewater location. Theconstruction of the Central Control Center at the East End WWTF began in mid-2010. During this time, theWestbrook/Gorham/Windham WWTF was connected to the control system directly, improving the ability tomonitor and control this facility.
Future programming routines will allow staff to interact with remote sites from a central location. In theend, our goal is to have operation staff in position to acknowledge alarms, trouble shoot mechanicalproblems and make process adjustments to four wastewater plants and better than 70 pump stationswithout having to call in additional staff.
Project 177 outlines much of the work that is needed to complete the long-range SCADA plan. The 2009plan began the installation of the Centralized Control Center at the EEWTF. The Peaks Island WWTFautomation upgrade was completed in 2009, allowing for improved automatic operation and monitoringand control of the plant from the EEWWTF’s SCADA System. The upgrade of the treatment plant in CapeElizabeth included similar control system improvements.
The SCADA panel for the newly installed Great PondPump Station for the Peaks island Sewer ExtensionProject

261 Capital Expenditures
Program Summary and Board of Trustees Approval Order
Program
Program Approval11/24/14 Special Approval
SCADA & Technology $423,697
Vehicle and Equipment Replacement $275,000
Wastewater Collection Systems and Pumping $1,411,400
Wastewater Treatment Facilities
CIP #21, Project 671, Aeration System Upgrade
$1,147,500$11,000,000
Water Distribution System Upgrades $9,815,000
Water Facilities Program $865,000
Water Supply - Sebago Lake and Steep Falls $25,000
Program Totals $13,962,597 $11,000,000
Combined Program Total $24,962,597
Note: Projects that require "Special Approval" will be brought back to the Board of Trustees for specificauthorization. In 2015 there is one project included in this category.
Proposed Board Action:
ORDERED: that the 2015-2019 Capital Improvement Plan is hereby adopted and the General Manager isauthorized to solicit bids or proposals for the year 2015 projects; except CIP# 21, project 671 and toauthorize the General Manager to award contracts for approved projects to the lowest bidder if the bid iswithin the project budget.
BE IT FURTHER ORDERED: that the General Manager shall solicit bids or proposals and to partner withMunicipalities, MDOT and Developers for the year 2015 for the replacement and extension of water mains,services, valves and hydrants as outlined in the Water Distribution Systems Upgrades Program and toauthorize the General Manager to award and enter into contracts if the bid or partnering proposals arewithin the overall program budget.

262 Capital Expenditures
Program Summary for 2015
Program Subprogram # Budget
SCADA & Technology
SCADA /Process Control - Water 177 $158,697
SCADA /Process Control - Wastewater 110 $80,000
Technology Upgrade and Replacement 50 $185,000
Program Total $423,697
Vehicle and Equipment Replacement
Vehicle and Equipment Replacement 326 $275,000
Program Total $275,000
Wastewater Collection Systems and Pumping
Cape Eliz. Pump Stations - R&R 52 $30,000
Cape Eliz. Pump Stations - Capital 407 $95,000
Cumberland WW Pump Stations - R&R 41 $40,000
Gorham WW Pump Stations - R&R 60 $10,000
Portland WW Pump Stations -R&R 70 $206,400
Westbrook CSO Abatement 29 $1,000,000
Westbrook WW Systems R&R 411 $10,000
Windham - Little Falls WW system R&R 180 $20,000
Program Total $1,411,400
Wastewater Treatment Facilities
Cape Eliz. WWTF - R&R 424 $25,000
Cape Eliz. WWTF – Capital 418 $242,500
East End WWTF - R&R 409 $455,000
East End WWTF Capital Upgrade 21 $11,000,000
Peaks Island R&R 423 $155,000
Wastewater Asset Condition Evaluations 421 $150,000
Westbrook/Gorham /Windham WWTF Capital 167 $30,000
Westbrook/Gorham /Windham WWTF R&R 416 $90,000
Program Total $12,147,500

263 Capital Expenditures
Program Summary for 2015
Program Subprogram # Budget
Water Distribution System Upgrades
Meter Replacement and Leak Detection 63 $190,000
Gorham/Windham 407 Zone Improvements 307 $2,000,000
Water Distribution Valve Replacement 53 $250,000
Water Hydrants Replacement 65 $200,000
Water Main Renewal - Seasonal Mains 56 $25,000
Water Main Replacement - Capital 43 $5,500,000
Water Main Replacement - R&R 111 $1,000,000
Water Services - Renew Domestic & Fire 61 $600,000
Water System Redundancy (Looping) and Upsizing Dev. 408 $50,000
Program Total $9,815,000
Water Facilities Program
Facilities Improvements 68 $210,000
SLWTF – Treatment Process Improvements 315 $500,000
Water Facilities Renewal and Replacement 122 $80,000
Water Storage Facility Maintenance & Upgrade 203 $75,000
Program Total $865,000
Water Supply - Sebago Lake and Steep Falls
Water System Security 46 $25,000
Program Total $25,000
CIP Total $24,962,597

264 Capital Expenditures
Fund Summary for 2015
Subprogram Subprogram # Budget Manager
Division 10 Allocation
Facilities Improvements 68 $210,000 Paradis, Roger
Meter Replacement and Leak Detection 63 $190,000 Wallace, Jim
Technology Upgrade and Replacement 50 $185,000 Davis, Chad
Vehicle and Equipment Replacement 326 $275,000 Paradis, Roger
Division 10 Total $860,000
Division 20 Water - General
Gorham/Windham 407 Zone Improvements 307 $2,000,000 Johnson, Gordon
SCADA /Process Control - Water 110 $80,000 Richard, Emile
SLWTF – Treatment Process Improvements 315 $500,000 Wallace, Jim
Water Distribution Valve Replacement 53 $250,000 Wallace, Jim
Water Facilities Renewal and Replacement 122 $80,000 Wallace, Jim
Water Hydrants Replacement 65 $200,000 Wallace, Jim
Water Main Renewal- Seasonal Mains 56 $25,000 Wallace, Jim
Water Main Replacement - Capital 43 $5,500,000 Pierce, Ned
Water Main Replacement - R&R 111 $1,000,000 Pierce, Ned
Water Services - Renew Domestic & Fire 61 $600,000 Wallace, Jim
Water Storage Facility Maintenance & Upgrade 203 $75,000 Johnson, Gordon
Water System Redundancy (Looping) and Upsizing dev 408 $50,000 Spugnardi, Rico
Water System Security 46 $25,000 Wallace, Jim
Division 20 Total $10,385,000
Division 50 Wastewater - General
Wastewater Asset Condition Evaluation 421 $150,000 Firmin, Scott
SCADA /Process Control – Wastewater 177 $94,331 Richard, Emile
Division 51 Total $244,331
Division 51 Wastewater - Cape Elizabeth
Cape Eliz. Pump Stations - R&R 52 $30,000 Poulin, Charlene
Cape Eliz. Pump Stations - Capital 407 $95,000 Rodriguez, Paul
Cape Eliz. WWTF - Capital 418 $242,500 Firmin, Scott
Cape Eliz. WWTF - R&R 424 $25,000 Waterman, Robert
Division 51 Total $392,500
Division 53 Wastewater - Cumberland
Cumberland WW Pump Stations - R&R 41 $40,000 Poulin, Charlene
Division 53 Total $40,000

265 Capital Expenditures
Fund Summary for 2015
Subprogram Subprogram # Budget Manager
Division 55 Wastewater - Windham Little Falls
Windham - Little Falls WW System R&R 180 $20,000 Poulin, Charlene
Division 55 Total $20,000
Division 57 Wastewater - Portland
East End WWTF - R&R 409 $455,000 Sloan, Steve
East End WWTF Capital Upgrade 21 $11,000,000 Sloan, Steve
Portland WW Pump Stations - R&R 70 $206,400 Poulin, Charlene
SCADA /Process Control - Wastewater 177 $47,366 Richard, Emile
Division 57 Total $11,708,766
Division 61 Wastewater - Gorham Village
Gorham WW Pump Stations - R&R 60 $10,000 Poulin, Charlene
Division 61 Total $10,000
Division 62 Wastewater - Westbrook
Westbrook CSO Abatement 29 $1,000,000 Poulin, Charlene
Westbrook WW Systems R&R 411 $10,000 Poulin, Charlene
Division 62 Total $1,010,000
Division 64 Wastewater - Joint Westbrook
SCADA /Process Control - Wastewater 177 $17,000 Richard, Emile
Westbrook/Gorham /Windham WWTF Capital 167 $30,000 Rodriguez, Paul
Westbrook/Gorham /Windham WWTF R&R 416 $90,000 Waterman, Robert
Division 64 Total $137,000
Division 66 Wastewater - Peaks
Peaks Island R&R 423 $155,000 Waterman, Robert
Division 66 Total $155,000
Total of All Divisions: $24,962,597
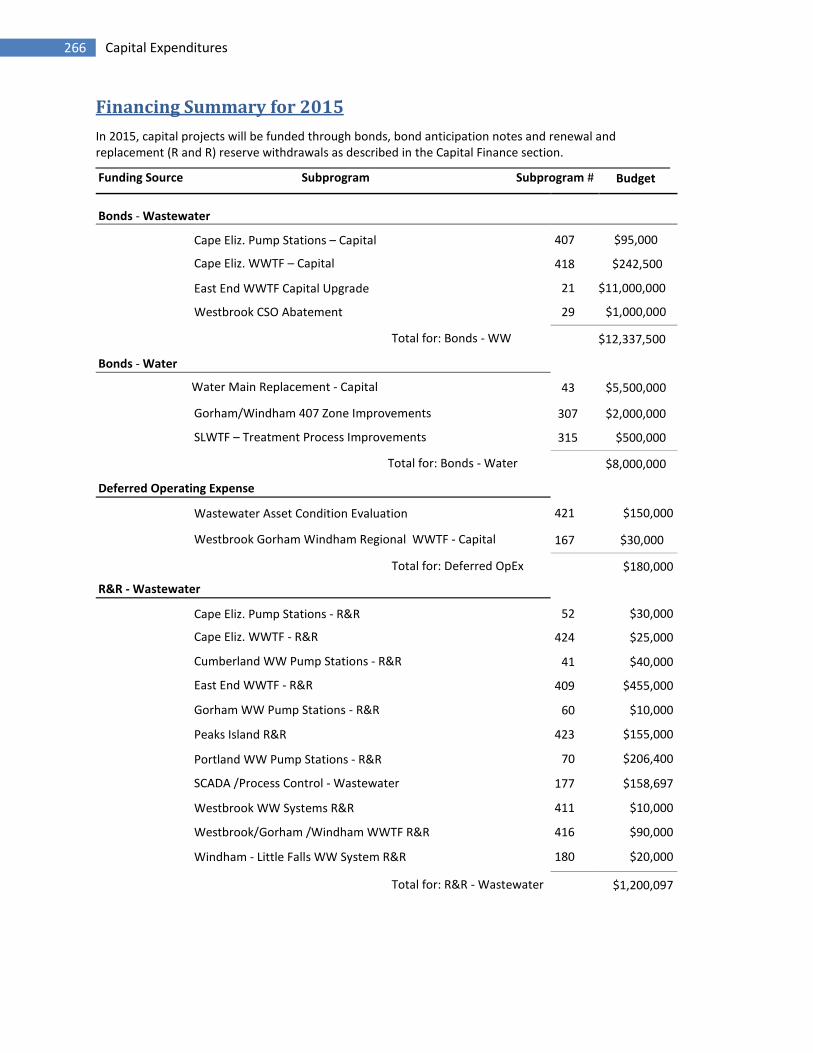
266 Capital Expenditures
Financing Summary for 2015
In 2015, capital projects will be funded through bonds, bond anticipation notes and renewal andreplacement (R and R) reserve withdrawals as described in the Capital Finance section.
Funding Source Subprogram Subprogram # Budget
Bonds - Wastewater
Cape Eliz. Pump Stations – Capital 407 $95,000
Cape Eliz. WWTF – Capital 418 $242,500
East End WWTF Capital Upgrade 21 $11,000,000
Westbrook CSO Abatement 29 $1,000,000
Total for: Bonds - WW $12,337,500
Bonds - Water
43 $5,500,000Water Main Replacement - Capital
Gorham/Windham 407 Zone Improvements 307 $2,000,000
SLWTF – Treatment Process Improvements 315 $500,000
Total for: Bonds - Water $8,000,000
Deferred Operating Expense
Wastewater Asset Condition Evaluation 421 $150,000
Westbrook Gorham Windham Regional WWTF - Capital 167 $30,000
Total for: Deferred OpEx $180,000
R&R - Wastewater
Cape Eliz. Pump Stations - R&R 52 $30,000
Cape Eliz. WWTF - R&R 424 $25,000
Cumberland WW Pump Stations - R&R 41 $40,000
East End WWTF - R&R 409 $455,000
Gorham WW Pump Stations - R&R 60 $10,000
Peaks Island R&R 423 $155,000
Portland WW Pump Stations - R&R 70 $206,400
SCADA /Process Control - Wastewater 177 $158,697
Westbrook WW Systems R&R 411 $10,000
Westbrook/Gorham /Windham WWTF R&R 416 $90,000
Windham - Little Falls WW System R&R 180 $20,000
Total for: R&R - Wastewater $1,200,097

267 Capital Expenditures
Financing Summary for 2015
In 2015, capital projects will be funded through bonds, bond anticipation notes and renewal andreplacement (R&R) reserve withdrawals as described in the Capital Finance section.
Funding Source Subprogram Subprogram # Budget
R&R - Water
Facilities Improvements 68 $210,000
Meter Replacement and Leak Detection 63 $190,000
Water Storage Facility Maintenance & Upgrade 203 $75,000
SCADA /Process Control - Water 110 $80,000
Technology Upgrade and Replacement 50 $185,000
Vehicle and Equipment Replacement 326 $275,000
Water Distribution Valve Replacement 53 $250,000
Water Facilities Renewal and Replacement 122 $80,000
Water Hydrants Replacement 65 $200,000
Water Main Renewal- Seasonal Mains 56 $25,000
Water Main Replacement - R&R 111 $1,000,000
Water Services - Renew Domestic & Fire 61 $600,000
Water System Redundancy (Looping) and Upsizing dev 408 $50,000
Water System Security 46 $25,000
Total for: R&R - Water $3,245,000
Grand Total for: 2015 $24,962,597

268 Capital Expenditures
Priority Summary Report for 2015
Non-Routine
Priority Reason Subprogram Subprogram # Budget
Regulatory mandate
These projects are required by law or permits.
SLWTF – Treatment Process Improvements 315 $500,000
Westbrook CSO Abatement 29 $1,000,000
Total for: Regulatory mandate $1,500,000
Security of facilities
These are projects to address water and wastewater system security vulnerabilities.
Water System Security 46 $25,000
Total for: Security of facilities $25,000
Upgrade obsolete facility
These projects have been identified through comprehensive facility evaluations (CWSSP and CPE)as necessary to extend the life of existing facilities.
Wastewater Asset Condition Evaluation 421 $150,000
Cape Eliz. Pump Stations – Capital 407 $95,000
Cape Eliz. WWTF – Capital 418 $242,500
East End WWTF Capital Upgrade 21 $11,000,000
Gorham/Windham 407 Zone Improvements 307 $2,000,000
SCADA /Process Control - Wastewater 177 $158,697
SCADA /Process Control - Water 110 $80,000
Westbrook Gorham Windham Regional WWTF Capital 167 $30,000
Facilities Improvements 68 $210,000
Total for: Upgrade Obsolete facility $13,966,197
Items in RED are planned to be financed from bond issues in 2015 or Future Years. Other projects are to befinanced through the renewal and replacement reserves.

269 Capital Expenditures
Priority Summary Report for 2015
Routine
Priority Reason Subprogram Subprogram # Budget
Routine replacement
Projects that require year-to-year funding to routinely replace or renew
Cape Elizabeth Pump Stations - R&R 52 $30,000
Cape Elizabeth WWTF - R&R 424 $25,000
Cumberland WW Pump Stations - R&R 41 $40,000
East End WWTF - R&R 409 $455,000
Gorham WW Pump Stations - R&R 60 $10,000
Meter Replacement and Leak Detection 63 $190,000
Peaks Island R&R 423 $155,000
Portland WW Pump Stations - R&R 70 $206,400
Technology Upgrade and Replacement 50 $185,000
Vehicle and Equipment Replacement 326 $275,000
Water Distribution Valve Replacement 53 $250,000
Water Facilities Renewal and Replacement 122 $80,000
Water Hydrants Replacement 65 $200,000
Water Main Renewal - Seasonal Mains 56 $25,000
Water Main Replacement - Capital 43 $5,500,000
Water Main Replacement - R&R 111 $1,000,000
Water Services - Renew Domestic & Fire 61 $600,000
Water Storage Facility Maintenance & Upgrade 203 $75,000
Water System Redundancy (Looping) and Upsizing Dev. 408 $50,000
Westbrook WW Systems R&R 411 $10,000
Westbrook/Gorham/Windham WWTF R&R 416 $90,000
Windham- Little Falls WW system R&R 180 $20,000
Total for: Routine replacement $9,471,400
Grand Total $24,962,597
Items in RED are planned to be financed from bond issues in 2015 or Future Years. Other projects are to befinanced through the renewal and replacement reserves.

270 Capital Expenditures
Operating Fund Impact of Non–Routine Capital Projects
Gorham/ Windham 407 Zone Improvements The new pump station in Gorham will be designed toreplace the 120 year old (1895) pump station inGorham and the 53 year old (1962) Prides Cornerpump. Upon completion of construction sometime in2016 the station will immediately replace the Gorhamstation and the Prides Corner Station will be taken offline after planned piping improvements arecompleted in the 407 north zone. This will not impactthe 2015 operating budget but will impact futureyears estimated to be a reduction of $10,000 inelectrical and maintenance costs. Project will bebond financed so future budget will have debt serviceexpense ($200,000/year).
Westbrook CSO Abatement Program - NPDES permit This will provide a 5-year update to the City ofWestbrook Long Term Control plan for CombinedSewer Overflows as required by Permit. The design ofpipe enlargements took place in 2014 in preparationfor construction in 2015. No expected cost from thisto 2015 operating budget but the project will be bondfinanced so future budget will have debt serviceexpense ($100,000/year).
East End WWTF Capital Upgrade Aeration System Upgrade. In 2014, alternativesanalysis and capacity improvements were studied adesign was prepared for bidding. Estimated start ofconstruction is May of 2015 with a completion date ofApril 2017. Energy efficient system will replace thecurrent system. No impact to the 2015 budget butfuture budgets will be impacted by an estimated$100,000 savings in chemical and power use. Projectwill be bond financed so future budget will have debtservice expense ($1,200,000/year).
Facilities Improvements Program Replacement of various roofs at Douglass StreetFacility will improve the work environment ofemployees along with the protection of the buildingstructure. No impact to operating fund
Portland WW Pump Station Capital Upgrade Program Fore Rive Pump Station Upgrade - Pumps replacedwill be more energy efficient and reduce energy costsan estimated $2,000. Project will be bond financed sofuture budget will have debt service expense($135,100/year).
SCADA /Process Control Program –Wastewater/Water
Planned improvements to the water/wastewaterSCADA systems will result more reliability along withsome benefits to the operations. The resultingsavings to operations will be minimal.

271 Capital Expenditures
Subprograms with Pending Unscheduled Work
Subprogram Title Subprogram # Cost Manager
Division 20 Water - General
Watershed Security and Safety – Rt 35/237 Redesign 425 $1,000,000 Johnson, Gordon
Watershed Land Acquisition 1 $434,000 Twaddel, Norman
Division 51 Wastewater - Cape Elizabeth
Cape Elizabeth Pump Stations - Capital 407 $200,000 Firmin, Scott
Division 57 Wastewater - Portland
East End WWTF - R&R 409 $150,000 Sloan, Steve
Total of All Divisions: $1,784,000
Pending Unscheduled Work are projects that may occur in 2015.
Subprogram # 1 - Watershed land acquisitions occur if a buyer approaches the District to sell their propertylocated in our watershed area.
Subprogram # 407 - A study is underway exploring the source and possible solutions to address seweroverflow on Ottawa Road in Cape Elizabeth. The study may indicate that a capital improvement needs to bemade at the pump station.
Subprogram #409 - Certain repairs of the aeration system at the East End wastewater treatment facilityneed to occur. A major capital improvement to the system is planned in 2015 but more than likely will notbe functional until 2016.
Subprogram #425 – Pending Maine Department of Transportation estimate of cost to relocate a road nearthe intake.
If the project is undertaken, the Board of Trustees will be requested to approve and the CapitalImprovement Plan amended. The project funding has not been included in the 2015 Budget.

Subprogram # 20192015 2016 2017 2018 Five -Year Total
Capital Improvement Program - Five Year Plan
Capital Expenditures
Division: 10 AllocationFacilities Improvements $400,00068 $210,000 $150,000 $300,000 $1,260,000$200,000
Meter Replacement and Leak Detection $200,00063 $190,000 $200,000 $200,000 $990,000$200,000
Technology Upgrade and Replacement $240,00050 $185,000 $200,000 $200,000 $1,045,000$220,000
Vehicle and Equipment Replacement $400,000326 $275,000 $400,000 $400,000 $1,875,000$400,000
$860,000 $1,240,000 $950,000 $1,100,000 $5,170,000Division 10 Total $1,020,000
Division: 20 Water - GeneralGorham/Windham 407 Zone Improvements $2,000,000307 $2,000,000 $2,500,000 $7,500,000$1,000,000
SCADA /Process Control -Water $68,000110 $80,000 $50,000 $50,000 $303,000$55,000
SLWTF - Treatment Process Improvements 315 $500,000 $500,000
SLWTF Intakes - Replace Mechanical Screens 18 $1,100,000 $1,100,000
Water Distribution Valve Replacement $250,00053 $250,000 $250,000 $250,000 $1,250,000$250,000
Water Facilities Renewal and Replacement $205,000122 $80,000 $50,000 $50,000 $435,000$50,000
Water Hydrants Replacement $200,00065 $200,000 $200,000 $200,000 $1,000,000$200,000
Water Main Renewal- Seasonal Mains $25,00056 $25,000 $25,000 $25,000 $125,000$25,000
Water Main Replacement - Capital $6,000,00043 $5,500,000 $6,000,000 $6,000,000 $29,500,000$6,000,000
Water Main Replacement - R&R $1,000,000111 $1,000,000 $1,000,000 $1,000,000 $5,000,000$1,000,000
Water Services - Renew Domestic & Fire $600,00061 $600,000 $600,000 $600,000 $3,000,000$600,000
Water Storage Facility Maintenance & Upgrade $25,000203 $75,000 $425,000 $25,000 $650,000$100,000
Water System Redundancy (Looping) and Upsizing dev $50,000408 $50,000 $50,000 $50,000 $250,000$50,000
Water System Security $25,00046 $25,000 $25,000 $25,000 $125,000$25,000
$10,385,000 $10,448,000 $12,275,000 $8,275,000 $50,738,000Division 20 Total $9,355,000
Division: 50 Wastewater - GeneralWastewater Asset Condition Evaluations $150,000421 $150,000 $300,000
SCADA /Process Control - Wastewater $39,561177 $94,331 $150,892$17,000
$244,331 $189,561 $450,892Division 50 Total $17,000

Subprogram # 20192015 2016 2017 2018 Five -Year Total
Capital Improvement Program - Five Year Plan
Capital Expenditures
Division: 51 Wastewater - Cape ElizabethCape Eliz. Pump Stations -Capital $970,000407 $95,000 $125,000 $1,190,000
Cape Eliz. WWTF - Capital $1,000,000418 $242,500 $1,242,500
Cape Eliz. WWTF - R&R $70,000424 $25,000 $20,000 $50,000 $215,000$50,000
Cape Elizathbeth Pump Stations- R&R $50,00052 $30,000 $30,000 $30,000 $160,000$20,000
SCADA /Process Control - Wastewater $225,400177 $225,400
$392,500 $2,315,400 $50,000 $205,000 $3,032,900Division 51 Total $70,000
Division: 53 Wastewater - CumberlandCumberland WW Pump Stations - R&R $20,00041 $40,000 $20,000 $20,000 $120,000$20,000
$40,000 $20,000 $20,000 $20,000 $120,000Division 53 Total $20,000
Division: 55 Wastewater - Windham Little FallsWindham- Little Falls WW system R&R $20,000180 $20,000 $20,000 $20,000 $100,000$20,000
$20,000 $20,000 $20,000 $20,000 $100,000Division 55 Total $20,000
Division: 57 Wastewater - PortlandEast End WWTF - R&R $553,000409 $455,000 $400,000 $560,000 $2,518,000$550,000
East End WWTF Capital Upgrade $400,00021 $11,000,000 $500,000 $11,900,000
Portland WW Pump Station Capital Upgrade $2,500,000420 $2,500,000
Portland WW Pump Stations -R&R $50,00070 $206,400 $50,000 $100,000 $456,400$50,000
SCADA /Process Control - Wastewater $210,000177 $47,366 $50,000 $50,000 $407,366$50,000
$11,708,766 $3,713,000 $1,000,000 $710,000 $17,781,766Division 57 Total $650,000
Division: 61 Wastewater - Gorham VillageGorham WW Pump Stations - R&R $29,00060 $10,000 $10,000 $15,000 $74,000$10,000
$10,000 $29,000 $10,000 $15,000 $74,000Division 61 Total $10,000
Division: 62 Wastewater - Westbrook

Subprogram # 20192015 2016 2017 2018 Five -Year Total
Capital Improvement Program - Five Year Plan
Capital Expenditures
Westbrook CSO Abatement $382,00029 $1,000,000 $1,275,000 $400,000 $6,257,000$3,200,000
Westbrook WW Systems R&R $10,000411 $10,000 $10,000 $10,000 $50,000$10,000
$1,010,000 $392,000 $1,285,000 $410,000 $6,307,000Division 62 Total $3,210,000
Division: 64 Wastewater - Joint WestbrookSCADA /Process Control - Wastewater 177 $17,000 $19,000 $42,000$6,000
Westbrook Gorham Windham Regional WWTF - Capital 167 $30,000 $1,154,733 $1,184,733
Westbrook/Gorham /Windham WWTF R&R $180,000416 $90,000 $50,000 $50,000 $420,000$50,000
$137,000 $180,000 $1,223,733 $50,000 $1,646,733Division 64 Total $56,000
Division: 66 Wastewater - PeaksPeaks Island R&R $180,000423 $155,000 $20,000 $20,000 $395,000$20,000
$155,000 $180,000 $20,000 $20,000 $395,000Division 66 Total $20,000
Grand Total $14,448,000$24,962,597 $18,726,961 $16,853,733 $10,825,000 $85,816,291

275 Capital Expenditures
2014 CIP Progress Report
Program CIP # Appropriated
Funds
Carry over projects to 2015 Unspent
Re-appropriateto R&R
SCADA & Technology
SCADA /Process Control - Water 110 $47,000 (2282 reprogrammed) $47,000
SCADA /Process Control - Wastewater 177 $74,000 Completed 2014 (1551 not spent) $50,000
Technology Upgrades 50 $200,000 Completed 2014 $100,000
Vehicle and Equipment Replacement
Vehicle and Equipment Replacement 326 $325,000 Completed 2014 $50,000
Wastewater Collection Systems andPumping
Cape Eliz. Pump Stations - R&R 52 $38,000 Completed 2014 $25,000
Cumberland WW Pump Stations - R&R 41 $55,0001912 PS R&R – did not utilize2298 Ledge Road Generator- May1. 2015 $20,000
Gorham Wastewater PS R&R Prog. 60 $55,000 Routine R&R did not utilize
2320 Briarwood Generator - May 1, 2015
$10,000
Portland CSO Mitigation 131 $200,000 Completed 2014
Portland Pump Station – R&R 70 $134,000 Completed 2014
Portland Pump Station – Capital 420 1,600,000 Design Completed end of 2014,Construction – July 2016
Westbrook CSO Abatement 29 $152,000 Completed 2014 (1554 canceled) $17,000
Westbrook WW Systems R&R 411 $10,000 Routine RR did not utilize $10,000
Windham Little Falls System R&R 180 $10,000 Completed 2014
Wastewater Treatment Facilities
Cape Eliz. WWTF - R&R 424 $20,000 Completed 2014
East End WWTF - R&R 409 $665,000 2308 Wash Press - July 1, 2015
1816 Influent Gates - July 1, 2015
2076 Lower Parking Lot – reprogram
Completed 2014 - 2273, 2305, 2306,
2307, 2310,2370,2398
$75,000
East End WWTF – Capital 21 $1,000,000 Completed 2014
Peaks Island R&R 423 $45,000 2072- UV Disinfection – July 1, 2015
2338-
Westbrook/Gorham /Windham WWTFR&R
416 $47,000 Completed 2014

276 Capital Expenditures
2014 CIP Progress Report-continued
Program
CIP # Appropriated
Funds
Carry over to 2015 Unspent
Re-appropriateto R&R
Water Distribution System Upgrades
Meter Replacement and Leak Detection 63 $150,000 Completed 2014
Water Distribution Valve Replacement53 $250,000 Completed 2014
Water Hydrants Replacement 65 $200,000 Completed 2014
Water Main Renewal - Cast Iron Mains43 $5,000,000 Washington Ave, West Kidder, Portland
expected to be completed June of 2014 –$530,000
Water Main Renewal - Galvanized Mains 111 $1,000,000 Completed 2014
Water Main Renewal - Seasonal Mains 53 $25,000 Completed 2014
Water Services - Renew Domestic & Fire 61 $600,000 Completed 2014
Water System Redundancy (Looping) andUpsizing
408 $50,000 Completed 2014
Water Facilities Program
Facilities Improvements 68 $167,000 #2285 - $60,000 -Douglass Street roofrepairs expected to combine with 2015project #874 -$50.000 – July 2015
$25,000
Water Facilities Renewal and Replacement 122 $50,000 Completed 2014
Water Storage Facility Maintenance &Upgrade
203 $50,000 $50,000
Water Supply - Sebago Lake and SteepFalls
Water System Security 46 $25,000 Completed 2014
Completed 2014 - This designates the subprogram is either completed or will be completed by first quarterof 2015. Carry over projects are projects that were programmed to be started in 2014 but will not start untilsometime in 2015.
In the following Subprogram descriptions, items highlighted in yellow are going to happen in 2015.

277 Capital Expenditures
Subprogram # 1 Watershed Land Acquisition
Division: Water - General Manager: Twaddel, NormanFunding: Land Reserve Priority: Regulatory mandate
Description:
Purchase land with or without buildings in accordance with the Watershed Land Purchase Policy.
Justification / Impact:
Ownership of land, particularly along the shore of Sebago Lake within the two-mile limit is the surestway to control land use which affects Lower Bay water quality and body contact.
History:
The District has a long standing policy to purchase Sebago Lake water frontage and other critical land forthe purpose of watershed protection and long-term maintenance of Sebago Lake water quality. We donot aggressively solicit land to buy. We have made public our interest to purchase Watershed land and,in recent times, all purchases have resulted from seller initiated contacts.
Origin of the Subprogram:
Budget Summary:
Budget year Project Budget Year CostPEND 1 Watershed Protection Land Purchase $434,000
Total Cost, All Years: $434,000
Previous Years on CIP: All since 1994Related Projects: NoneProcurement Issues: Purchase decisions are negotiated on the basis of professional real
estate appraisals. Board of Trustees approval of individual purchases isrequired.
Eel Cove – Shorefront properties within the 2 mile limit left(Lanni, Porter purchased in 2007 and Stanford in 2008)

278 Capital Expenditures
Subprogram # 18 SLWTF Intakes - Replace Mechanical Screens
Division: Water - General Manager: McMullin, TimFunding: Bonds - Water Priority: Routine replacement
Description:
This project involves selecting and installing a screen system to replace the existing screens in service atthe intakes on Sebago Lake. The present systems use two travelling screens with backwash at eachlocation with three sets of hand screens at the 1925 Intake and two sets of hand screens at the 1952Intake.
Justification / Impact:
The existing equipment is approaching 50 years old and is basically worn out. The new equipment willbe chosen to automate the screening process as much as possible to minimize operator time andreduce/prevent fish breakthrough.
History:
The intake screens were supposed to be retired after SLWTF start-up. Manual screens, designed for theinlet channel of the ozone contactor, were supposed to replace the need for the ones at the intakes.Unfortunately, a method for washing the screens was not designed into the facility. Many attemptswere made to use the inlet screens before deciding to continue the use of the intake screens.
Origin of the Subprogram:
The hand and travelling screens at the intake buildings were installed in the early 1950's. They are pasttheir expected lifespan. Present washing procedures are labor intensive, requiring nine to fifteen laborhours per week. We have experienced small fish getting by the screens and showing up in theclearwell. The ozone and chlorination process kills the fish, but we do not want to let them escape intothe system.
Budget Summary:
Budget year Project Budget Year Cost2017 675 Replace Mechanical Screens with Intake Screens $1,100,000
Total Cost, All Years: $1,100,000
Previous Years on CIP: 1998 to presentRelated Projects:
Procurement Issues: Internal engineering services followed by competitive proposals forpurchase and installation.

279 Capital Expenditures
Subprogram # 21 East End WWTF Capital Upgrade
Division: Wastewater - Portland Manager: Sloan, SteveFunding: Bonds - Wastewater Priority: Upgrade obsolete facility
Description:
The Portland Comprehensive Plant Evaluation (CPE) Program completed in 1998 identified a long rangeseries of plant system upgrades needed to replace obsolete equipment and systems to meet futureoperating and regulatory conditions. This CPE Upgrade Program represents the phased implementationof that long range program. The inclusion of the initial phase of odor control was requested by the Cityof Portland and included in this Program. This Program continues to provide for the replacement ofoutdated and obsolete systems, including the primary clarifier sludge collection equipment and sludgedewatering system.
Justification / Impact:
The current facility is thirty-seven years old and many of the original systems are worn out and/orfunctionally obsolete. Implementation of the program shown below allows the District to meet currentand future regulatory requirements while obtaining the operating cost advantages of new technology.The impact and benefit of this program is reduced operating cost, system reliability and the ability tomeet permit conditions.
History:
This implementation program began with the Woodard & Curran CPE completed in 1998. Wright-Pierceand CH2M-Hill were retained to implement the initial phases of this on-going program. Since then, workhas been completed on the influent channels, screening, grit removal, primary sedimentation basins,odor control and secondary clarifiers. Construction of the new dewatering system, including theFournier Rotary Presses, was completed in 2005.
Origin of the Subprogram:
The aging facility and increasing difficulty to achieve reliable operations that consistently meet licenserequirements led to the CPE. This implementation program is a direct result of the CPE.
Budget Summary:
Budget year Project Budget Year Cost2015 671 Aeration System Upgrade - Construction $11,000,0002016 2046 EEWWTF - Influent screen replacement $400,0002017 1525 Septage Receiving Improvements $500,000
Total Cost, All Years: $11,900,000
Previous Years on CIP: 1999 to presentRelated Projects: 409 EE WW TF- RR, 422 EEWWTF Treatment Process ImpProcurement Issues: RFP for engineering services. Construction services will be low bid.

280 Capital Expenditures
Subprogram # 21 East End WWTF Capital Upgrade
Proposed - Project 671 Design (2014) and replacement (2015) of the orginial 1978 aeration system atthe East End Wastewater Treatment Facility . The picture below is dewatered areator tank exposing themixer (taken in October of 2013).
Design underway - Project 796
The District selected Hazen and Sawyer Environmental in April of 2014 toDesign the improvement to the aeration process.
Conceptual Design of the proposed changes to the aeration basins – Installationof new baffle walls and mixers

281 Capital Expenditures
$-
$2,000,000
$4,000,000
$6,000,000
$8,000,000
$10,000,000
$12,000,000
Jan-15 Jul-15 Jan-16 Jul-16 Jan-17
Aeration Project - Monthy Cash Flow
Monthly cash payments
Cumluative cash payments
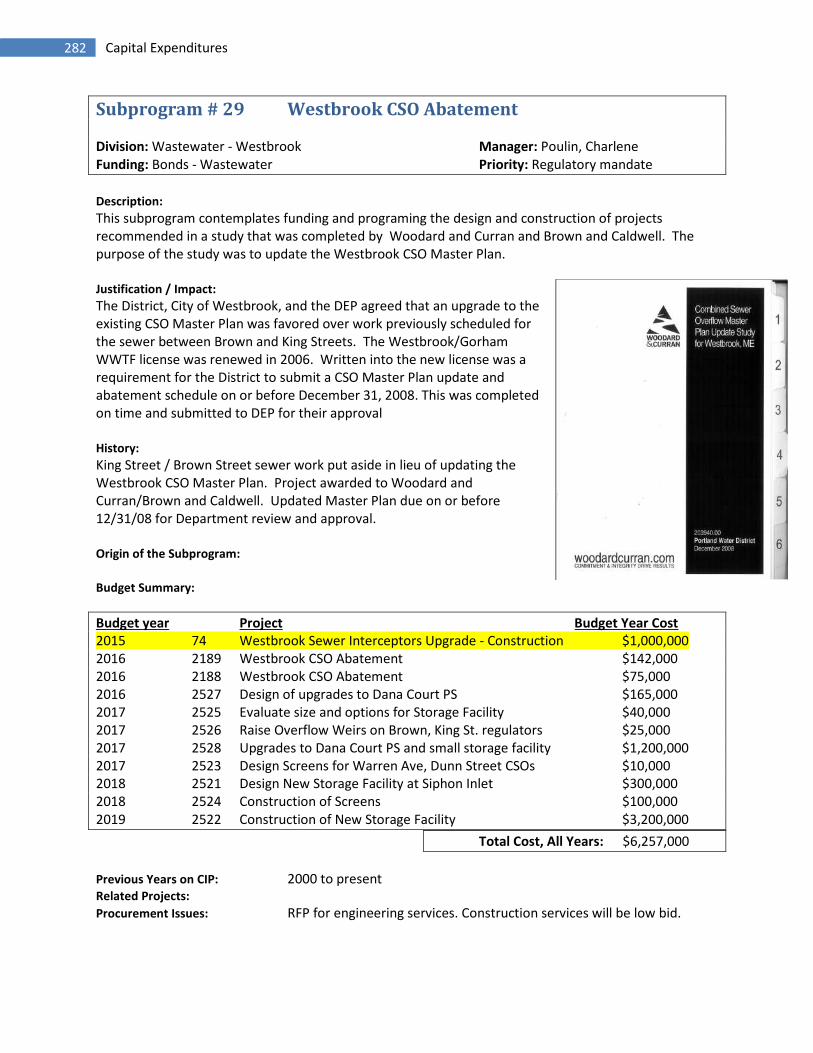
282 Capital Expenditures
Subprogram # 29 Westbrook CSO Abatement
Division: Wastewater - Westbrook Manager: Poulin, CharleneFunding: Bonds - Wastewater Priority: Regulatory mandate
Description:
This subprogram contemplates funding and programing the design and construction of projectsrecommended in a study that was completed by Woodard and Curran and Brown and Caldwell. Thepurpose of the study was to update the Westbrook CSO Master Plan.
Justification / Impact:
The District, City of Westbrook, and the DEP agreed that an upgrade to theexisting CSO Master Plan was favored over work previously scheduled forthe sewer between Brown and King Streets. The Westbrook/GorhamWWTF license was renewed in 2006. Written into the new license was arequirement for the District to submit a CSO Master Plan update andabatement schedule on or before December 31, 2008. This was completedon time and submitted to DEP for their approval
History:
King Street / Brown Street sewer work put aside in lieu of updating theWestbrook CSO Master Plan. Project awarded to Woodard andCurran/Brown and Caldwell. Updated Master Plan due on or before12/31/08 for Department review and approval.
Origin of the Subprogram:
Budget Summary:
Budget year Project Budget Year Cost2015 74 Westbrook Sewer Interceptors Upgrade - Construction $1,000,0002016 2189 Westbrook CSO Abatement $142,0002016 2188 Westbrook CSO Abatement $75,0002016 2527 Design of upgrades to Dana Court PS $165,0002017 2525 Evaluate size and options for Storage Facility $40,0002017 2526 Raise Overflow Weirs on Brown, King St. regulators $25,0002017 2528 Upgrades to Dana Court PS and small storage facility $1,200,0002017 2523 Design Screens for Warren Ave, Dunn Street CSOs $10,0002018 2521 Design New Storage Facility at Siphon Inlet $300,0002018 2524 Construction of Screens $100,0002019 2522 Construction of New Storage Facility $3,200,000
Total Cost, All Years: $6,257,000
Previous Years on CIP: 2000 to presentRelated Projects:
Procurement Issues: RFP for engineering services. Construction services will be low bid.

283 Capital Expenditures
Subprogram # 29 Westbrook CSO Abatement
The Scope of Project # 74 Westbrook Sewer Interceptors Upgrade is to replace 1100 feet of the existing
interceptors on Brown, North River and Reserve Streets with larger diameter pipe. This will allow more
combined flow to be pumped to the Westbrook/Gorham/Windham Regional Wastewater Treatment
Facility and ultimately reduce the Combine Sewer Overflow frequency and volumes entering the
Presumpscot River. The District will also be replacing the old 1889 vintage water mains along the route.
The water main replacements will be funded out of CIP subprogram #43 – Water Main Replacement.
Project location map for Westbrook Sewer Interceptors Upgrade

284 Capital Expenditures
Subprogram # 41 Cumberland WW Pump Stations - R&R
Division: Wastewater - Cumberland Manager: Poulin, CharleneFunding: R & R - Wastewater Priority: Routine replacement
Description:
This project provides for continual upgrade of the pumping stations located within the Cumberlandwastewater system. In most cases the work involves pump and rail replacements along with controlmodifications.
Justification / Impact:
Physical assests require scheduled maintenance and eventual replacement. This program will provide aplanned approach to the maintenance management of Cumberland's wastewater pump stations.
History:
This planned approach will assist maintenance and operations in moving towards a goal of predictiveand preventative maintenance.
Origin of the Subprogram:
Budget Summary:
Budget year Project Budget Year Cost2015 2316 Brookside Pump Station Cumberland $20,0002015 2023 Cumberland WW Pump Stations – R&R $20,0002016 2186 Cumberland WW Pump Stations - R&R $20,0002017 2261 Cumberland WW Pump Stations - R&R $20,0002018 2315 Cumberland WW Pump Stations - R&R $20,0002019 2515 Cumberland WW Pump Stations - R&R $20,000
Total Cost, All Years: $120,000
Previous Years on CIP: 2001 to presentRelated Projects: 415- Cumberland Pump Stations Capital UpgradesProcurement Issues: Internal Engineering and Construction Services

285 Capital Expenditures
Subprogram # 43 Water Main Replacement - Capital
Division: Water - General Manager: Pierce, NedFunding: Bonds - Water Priority: Routine replacement
Description:
Renew, replace, upgrade and loop cast iron water mains using materials and sizing for current andfuture conditions. Approximately 15,000 feet is scheduled for yearly replacement.
Justification / Impact:
This is a cost saving and water quality improvement process. Mains selected for replacement use thesame priority system as the Galvanized Main Renewal Program: water quality complaints, leakfrequency data, and municipal/state reconstruction projects.
History:
Cast iron mains in sizes 2 inches and above had been a standard from the late 1800s until theintroduction of Ductile Iron pipe in the late 60s and early 70s and PVC and HDPE pipe in the 80s. Therigidity and lack of flexibility of cast iron has been attributed to failures such as frost movement, crosstrenches, water hammers, contractor damages, as well as normal deterioration and corrosion throughage. A percentage of these mains are unlined causing iron build up resulting in restricted flow and dirtywater complaints. The District has a long term program to upgrade these mains.
Origin of the Subprogram:
The current list of projects is determined on the basis of water quality complaints, leak frequency data,age of main, and municipal/state reconstruction projects
Budget year Project Budget Year Cost2015 2018 Water Main Replacement - Capital $5,500,0002016 1540 Water Main Replacement – Capital $6,000,0002017 1754 Water Main Replacement – Capital $6,000,0002018 1693 Water Main Replacement - Capital $6,000,0002019 2507 Water Main Replacement - Capital $6,000,000
Total Cost, All Years: $29,500,000
Previous Years on CIP: AllRelated Projects: 111 Galvanized Main Renewal ProgramProcurement Issues: Projects are contracted out by the District or through a Muninipality or
MDOT . It is the District's intent to seek cost effective ways of partneringwith the municipalities and state on various projects.
October 7, 2014Pleasant Hill Road Scarborough Water Main Replacement - 2014Final connection made with poly wrap 8” Ductile iron on Pleasant Hill - Phase 1 inScarborough. This was in conjunction with the town of Scarborough and theDistrict replaced 3800 feet of main.

286 Capital Expenditures
Anticipated Main ReplacementProjects - 2015
Districts
PipeFootage Partnering Agency
Installed
Huston Road (407 zone connector) GO 1800 MDOT
Deering Street (State to High), Mellen Street PO 2200 Portland CSO
Somerset Street (Elm to Hanover) - Phase I PO 500 Portland
Allen Avenue (Yale to Pennell), Ray Street, Brookside Drive PO 3250
Somerset Street (Hanover to Forest) - Phase II PO 1200 Portland
Gray Road, Winn Road ps discharge to 12" 8"-1941 FA 1200
High Street (Commercial to York) PO 260 Portland CSO
Anderson Street Phase I PO 140 Portland
Anderson Street Phase II PO 1800 Portland
Maple Street Pleasant to Danforth 6" -1935 PO 270
York St. High to Center 6" - 1884 PO 1340
Danforth St, High to York 8"-1887 PO 1100
High St. Danforth to York 6"- 1904 PO 500
Pleasant Hill Avenue - Phase 2 - Main St. to RR SC 4000 Scarborough
Postal Service Way, Broadway, Mussey Rd SP/SC 2700
Thornton Heights - Phase 2 SP 2560 South Portland CSO
Broadway (Anthoine Street to Elm Street) SP 2500 South Portland
Bridge Street Bridge WE 1100 MDOT
Conant Street (Town Line to William Clark Drive) - Phase I WE 3100 Westbrook CSO
Reserve, River, Brown, North Street WE 2200 PWD CSO
Cloudman St, Cloudman Ct, Dunn Street WE 1130 Westbrook CSO
Speirs and Stevens Street WE 640 Westbrook CSO
Estimated 2015 Totals 36,530
Priority Projects to be funded in 2015Remaining projects will be constructed if funding is available in 2015 or will be reprogrammed for 2016.
Pleasent Hill Road Scarborough Water Main Replacement - 2014Temporary water system set up to the Pleasant Hill Water Mainreplacement. This system continued to provide fire protection anddomestic water for the customers along the route of the project.

287 Capital Expenditures
Subprogram # 46 Water System Security
Division: Water - General Manager: Wallace, JimFunding: R & R - Water Priority: Security of facilities
Description:
This program is to improve the security of the District's facilities. The wireless network project willprovide the backbone for a video surveillance system on all critical facilities. Many of the facilities are atremote sites (tanks) and would be difficult to transmit video. This wireless network (WIFI) will providecost effective and secure method to transmit video and data. It is the intent of District to have a systemover time that can monitor all its facilities from one location.
Justification / Impact:
Along with the security benefits of video surveillance, this project will also provide for redundantcommunication lines for voice and data transmission.
History:
In the fall of 2004 and summer of 2005 fencing was installed on the East and West side of the lower bayinside the 2 mile limit. This was funded thought the CIP. In 2005 hatch covers along with alarms wereinstalled over tank hatches and a cyberlock system was installed on all SCADA panels. This was fundedby a grant from MEMA - Homeland Security.
Origin of the Subprogram:
The vulnerability assessment completed in March of 2003 indicated that physical protection of existingfacilities could be improved.
Budget Summary:
Budget year Project Budget Year Cost2015 2024 Water System Security improvements $25,0002016 2259 Water System Security improvements $25,0002017 2258 Water System Security improvements $25,0002018 2421 Water System Security improvements $25,0002019 2511 Water System Security Improvements $25,000
Total Cost, All Years: $125,000
Previous Years on CIP: 2004 to presentRelated Projects:
Procurement Issues: Standard purchasing procedures will apply.

288 Capital Expenditures
Subprogram # 50 Technology Upgrade and Replacement
Division: Allocation Manager: Davis, ChadFunding: R & R - Water Priority: Routine replacement
Description:
PWD has made a commitment to using technology as a means of operating more efficiently. Thisproject is therefore an ongoing one. Project crosses all department lines and major processes. Focus ison establishing and maintaining a stable reliable network and databases to support PWD decisionmaking, planning, budgeting and daily work activities. Project must also plan for growth and adaptationas new technology solutions become feasible.
Justification / Impact:
While economic payback can be demonstrated for many of the line items in this project, replacement ofobsolete facilities is also a factor in technology investment. A fast, secure, reliable network anddatabases impacts PWD ability to be proactive and competitive. Better available information that istimely supports a customer centric business perspective.
History:
Technology infusion into PWD began anew after EMA study in 1996 recommended the use oftechnology to reduce a competitive gap, improve customer service and operating efficiency. Early on atechnology master plan was developed as a guide for our investments. Key development work focusedon building a stable reliable network infrastructure, acquiring best fit software solutions and populatingthe associated databases and documenting standard operating procedures. Most of the work was donein team environments to ensure the technology solution met the needs of the target PWD employeegroup. PWD network consists of a 206 PC/Laptop/Thin Client wide area network supported by 39servers housing various applications and data sources supporting asset management, customer billing,financials, GIS, voice mail, email, and VoIP phone. Our network also supports over fifty employees in thefield via a wireless data network. Technology advances and cost savings continue to influence thedesign and delivery of information to our employees and customers.
Budget year Project Budget Year Cost2015 2498 Network Printers Replacements $25,0002015 2499 AIM Technology $50,0002015 2497 SharePoint Implementation $70,0002015 2450 Annual Server Replacement $40,0002016 2161 Technology Upgrades $200,0002016 2354 AIM Spatial Upgrade $20,0002016 2359 GIS - SCADA integration $20,0002017 2248 Technology Upgrades $200,0002018 2414 Technology Upgrades $200,0002019 2025 Technology Upgrades $200,0002019 2449 Replace 4 servers $20,000
Total Cost, All Years: $1,045,000
Previous Years on CIP: All since 1996Procurement Issues: Standard procurement procedures are used for major hardware, software andconsulting purchases.

289 Capital Expenditures
Subprogram # 52 Cape Elizabeth Pump Stations - R&R
Division: Wastewater - Cape Elizabeth Manager: Poulin, CharleneFunding: R & R - Wastewater Priority: Routine replacement
Description:
This program provides a planned approach for the replacement of obsolete equipment in Cape Elizabethwastewater pump stations.
Justification / Impact:
The pump stations have reached the end of their useful design life and obsolete equipment must bereplaced. Upgrades, including the addition of VFD's in some cases, will provide more pumping capacity,mitigate CSO activity, and provide some power savings.
History:
This planned approach will assist maintenance and operations in moving toward a goal of performingmore predictive/ preventative maintenance instead of emergency maintenance.
Origin of the Subprogram:
Budget Summary:
Budget year Project Budget Year Cost2015 1122 Cape Elizabeth Pump Stations –R&R $30,0002016 2313 Broad Cove South Pump Station Upgrades $40,0002016 2183 Cape Elizabeth Pump Stations - R&R $10,0002017 2260 Cape Elizabeth Pump Stations- R&R $30,0002018 2312 Cape Elizabeth Pump Stations- R&R $30,0002019 2513 Cape Elizabeth Pump Stations - R&R $20,000
Total Cost, All Years: $160,000
Previous Years on CIP: various similar projects in previous yearsRelated Projects:Procurement Issues:

290 Capital Expenditures
Subprogram # 53 Water Distribution Valve Replacement
Division: Water - General Manager: Wallace, JimFunding: R & R - Water Priority: Routine replacement
Description:
Replacement of deteriorated valves in the distribution system.
Justification / Impact:
Replacement is determined and prioritized through data and workorders generated from ourDistribution Valve Operation Program, Inspectors Valve Operation Reports, Leak Reports, FlushingProgram Data, and the Distribution Maintenance Crews.
History:
Internal inspection of valves replaced has shown decay of the discs and spreaders which render thevalves non-operational and ineffective in isolating a section of the distribution system. Externalinspection has shown corrosion of nuts and bolts, corroded operating nuts, and bent operating stems.Repacking and rebolting these valves has only provided a costly and temporary solution to the externalportion of the valve. Replacement insures the valve will be up to standard and operational for manyyears to come with no required maintenance.
Origin of the Subprogram:
Our target is to replace 50 ( + or - ) valves per year
Budget Summary:
Budget year Project Budget Year Cost2015 1836 Replace Distribution Valves $250,0002016 2176 Replace Distribution Valves $250,0002017 2251 Replace Distribution Valves $250,0002018 2416 Replace Distribution Valves $250,0002019 2504 Replace Distribution Valves $250,000
Total Cost, All Years: $1,250,000
Previous Years on CIP: AllRelated Projects: 43,111,Procurement Issues: Work is to be performed using District Staff, equipment, and materials
New 12 inch valves are preassemble to be installed on County Road in Westbrook
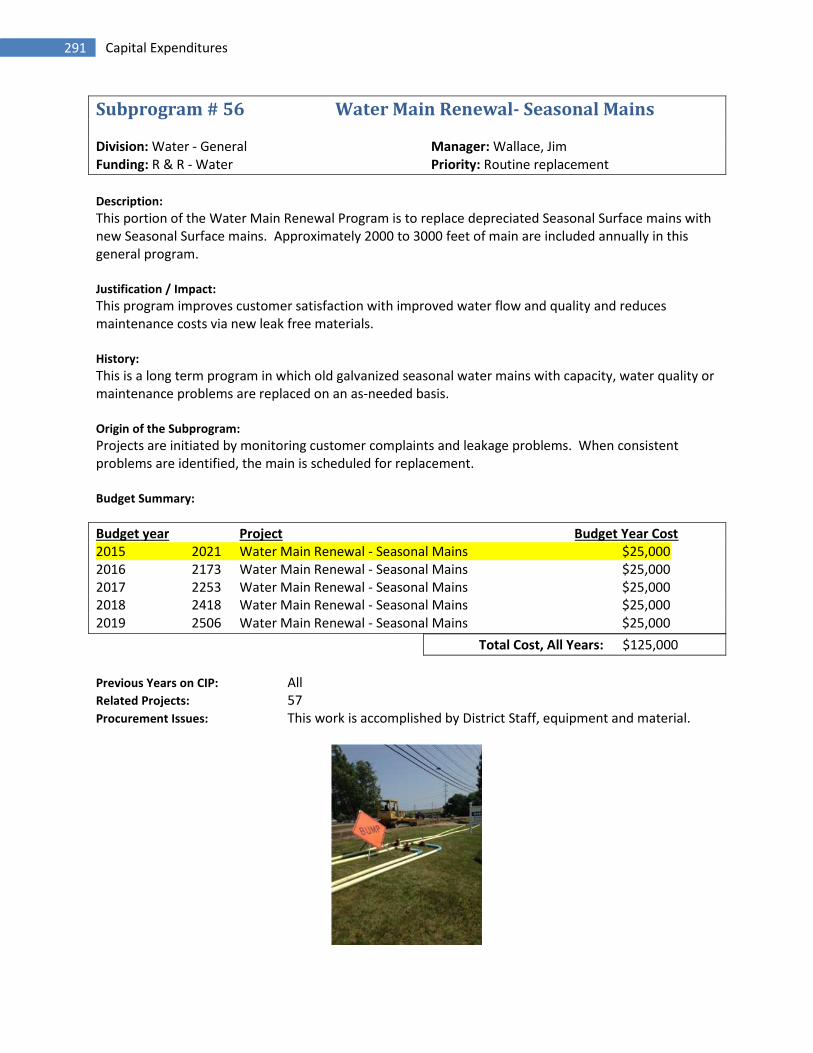
291 Capital Expenditures
Subprogram # 56 Water Main Renewal- Seasonal Mains
Division: Water - General Manager: Wallace, JimFunding: R & R - Water Priority: Routine replacement
Description:
This portion of the Water Main Renewal Program is to replace depreciated Seasonal Surface mains withnew Seasonal Surface mains. Approximately 2000 to 3000 feet of main are included annually in thisgeneral program.
Justification / Impact:
This program improves customer satisfaction with improved water flow and quality and reducesmaintenance costs via new leak free materials.
History:
This is a long term program in which old galvanized seasonal water mains with capacity, water quality ormaintenance problems are replaced on an as-needed basis.
Origin of the Subprogram:
Projects are initiated by monitoring customer complaints and leakage problems. When consistentproblems are identified, the main is scheduled for replacement.
Budget Summary:
Budget year Project Budget Year Cost2015 2021 Water Main Renewal - Seasonal Mains $25,0002016 2173 Water Main Renewal - Seasonal Mains $25,0002017 2253 Water Main Renewal - Seasonal Mains $25,0002018 2418 Water Main Renewal - Seasonal Mains $25,0002019 2506 Water Main Renewal - Seasonal Mains $25,000
Total Cost, All Years: $125,000
Previous Years on CIP: AllRelated Projects: 57Procurement Issues: This work is accomplished by District Staff, equipment and material.

292 Capital Expenditures
Subprogram # 60 Gorham WW Pump Stations - R&R
Division: Wastewater - Gorham Village Manager: Poulin, CharleneFunding: R & R - Wastewater Priority: Routine replacement
Description:
This is an ongoing project designed to maintain and improve Gorham wastewater pump stations.Modifications and upgrades will assure adequate capacity, reliability and safety.
Justification / Impact:
Components of the older pump stations have reach their useful life and obsolete equipment should bereplaced. Replacing this equipment before it fails completely will reduce the amount spent on operatingand maintaining the equipment
History:
This planned renewal and replacement will assit operations in moving toward a goal of performing morepredictive and preventive maintenance instead of emergency maintenance.
Origin of the Subprogram:
Budget Summary:
Budget year Project Budget Year Cost2015 2022 Gorham WW Pump Stations – R&R $10,0002016 2185 Gorham WW Pump Stations - R&R $10,0002016 2500 Manhole Raising on Main Street Gorham $19,0002017 2264 Gorham WW Pump Stations - R&R $10,0002018 2319 Gorham WW Pump Stations - R&R $15,0002019 2517 Gorham WW Pump Stations - R&R $10,000
Total Cost, All Years: $74,000
Previous Years on CIP: 2000- presentRelated Projects: 71Procurement Issues: Primarily staff labor for installation using standard parts procured
competitively.
Old Dynamite Way Pump Station – On line 2013
servicing new subdivision
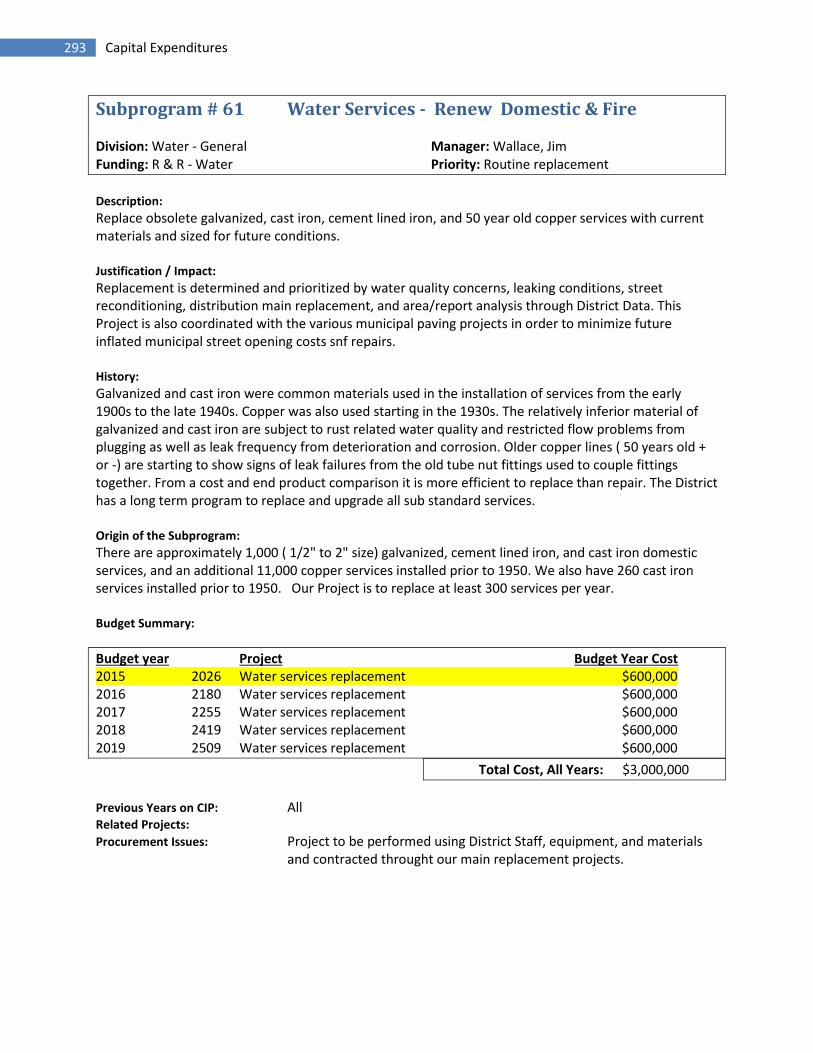
293 Capital Expenditures
Subprogram # 61 Water Services - Renew Domestic & Fire
Division: Water - General Manager: Wallace, JimFunding: R & R - Water Priority: Routine replacement
Description:
Replace obsolete galvanized, cast iron, cement lined iron, and 50 year old copper services with currentmaterials and sized for future conditions.
Justification / Impact:
Replacement is determined and prioritized by water quality concerns, leaking conditions, streetreconditioning, distribution main replacement, and area/report analysis through District Data. ThisProject is also coordinated with the various municipal paving projects in order to minimize futureinflated municipal street opening costs snf repairs.
History:
Galvanized and cast iron were common materials used in the installation of services from the early1900s to the late 1940s. Copper was also used starting in the 1930s. The relatively inferior material ofgalvanized and cast iron are subject to rust related water quality and restricted flow problems fromplugging as well as leak frequency from deterioration and corrosion. Older copper lines ( 50 years old +or -) are starting to show signs of leak failures from the old tube nut fittings used to couple fittingstogether. From a cost and end product comparison it is more efficient to replace than repair. The Districthas a long term program to replace and upgrade all sub standard services.
Origin of the Subprogram:
There are approximately 1,000 ( 1/2" to 2" size) galvanized, cement lined iron, and cast iron domesticservices, and an additional 11,000 copper services installed prior to 1950. We also have 260 cast ironservices installed prior to 1950. Our Project is to replace at least 300 services per year.
Budget Summary:
Budget year Project Budget Year Cost2015 2026 Water services replacement $600,0002016 2180 Water services replacement $600,0002017 2255 Water services replacement $600,0002018 2419 Water services replacement $600,0002019 2509 Water services replacement $600,000
Total Cost, All Years: $3,000,000
Previous Years on CIP: AllRelated Projects:
Procurement Issues: Project to be performed using District Staff, equipment, and materialsand contracted throught our main replacement projects.

294 Capital Expenditures
Thornton Heights Water Main Replacement Project, South Portland - Contractor pulling new service
across Main Street.

295 Capital Expenditures
Subprogram # 63 Meter Replacement and Leak Detection
Division: Allocation Manager: Wallace, JimFunding: R & R - Water Priority: Routine replacement
Description:
This work includes the cost to maintain the Long Service Meter Change program, and replacement ofdamaged meters. It also include the purchasing of leak detection and monitoring equipment. TheDistrict completed a change out all of its 50,000 meters to radio read system in 2009. The meters andbatteries are expected to last 20 years for the smaller meters and less for the larger meters. Also, theprogram includes the replacement of meter reading related equipment.
Justification / Impact:
This is a required program to meet PUC requirements and maintain accurate billing of customeraccounts and account for loss water. Since long service meters typically under estimate the actual waterflow, the Long Service Meter Change program is needed to assure that the District receives all therevenue to which it is entitled.
History:
New terms and conditions have recently been instituted to increase the long service interval from15 to20 years.
Origin of the Subprogram:
These costs do not reflect the value of meters and radio reading devices which is contributed bycustomers.
Budget Summary:
Budget year Project Budget Year Cost2015 2020 Water metering and leak detection $190,0002016 1676 Water metering and leak detection $200,0002017 2249 water metering and leak detection $200,0002018 2411 Meter Replacement and Leak Detection $200,0002019 2502 Meter Replacement and Leak Detection $200,000
Total Cost, All Years: $990,000
Previous Years on CIP: allRelated Projects: noneProcurement Issues: Standard meter procurement procedures, rebuilding of old meters by
staff and staff installation.
Leak Detection Equipment

296 Capital Expenditures
Subprogram # 65 Water Hydrants Replacement
Division: Water - General Manager: Wallace, JimFunding: R & R - Water Priority: Routine replacement
Description:
Replace and upgrade obsolete hydrants to meet current safety and operational standards, and to insureinventory parts availability for hydrant repairs.
Justification / Impact:
Replacement is determined and prioritized by: (1) hydrant failures (major damage and/or external leak,)(2) upgrade and replacement of obsolite sub standard hydrants based on (age - safety standards - repairparts availability - cost comparision to replace or repair,) (3) distribution main replacement program, (4)municipal and state reconstruction projects and (5) data gathered from the Hydrant Repair andReconditioning Programs and the Winter Hydrant Inspection Program.
History:
The O & M Hydrant Repair/ Reconditioning Programs and the Hydrant Winter Inspection Programs havebeen in place since the early 60s. These programs insure that our hydrants meet fire protectionstandards and provide direction for our C. I. P. Replacement Program. In recent times the ability toprocure replacement parts for the six hundred and twenty ( 620 ) Matthews Post hydrants ( Vintage late1800s to the late 1940s) has become difficult or impossible. The eight hundred and seventy ( 870 )Darling B-50 hydrants ( vintage early 1950s to early 1960s) require major internal rebuilding. Bothhydrant makes are not traffic model hydrants and fail to have a sheer points to breakaway on impact.This failure results in costly repairs and replacements, and is unsafe in many higway standards (Deadly-Fixed-Objects Regulation).
Origin of the Subprogram:
Our project is focused to replace and upgrade 75 hydrants per year over a twenty year replacementprogram of 1450 hydrants.
Budget Summary:
Budget year Project Budget Year Cost2015 2027 Hydrant Replacement $200,0002016 2177 Hydrant Replacement $200,0002017 2254 Hydrant Replacement $200,0002018 2417 Hydrant Replacement $200,0002019 2505 Water Hydrants Replacement $200,000
Total Cost, All Years: $1,000,000
Previous Years on CIP: AllRelated Projects:
Procurement Issues: Project is performed using District staff, equipment, and materials

297 Capital Expenditures
Foreperson flushing hydrant on 765 Warren Ave, Portland after installing new valve (September
2013)
District Crews repairing leak on Pearl Street in Portland.
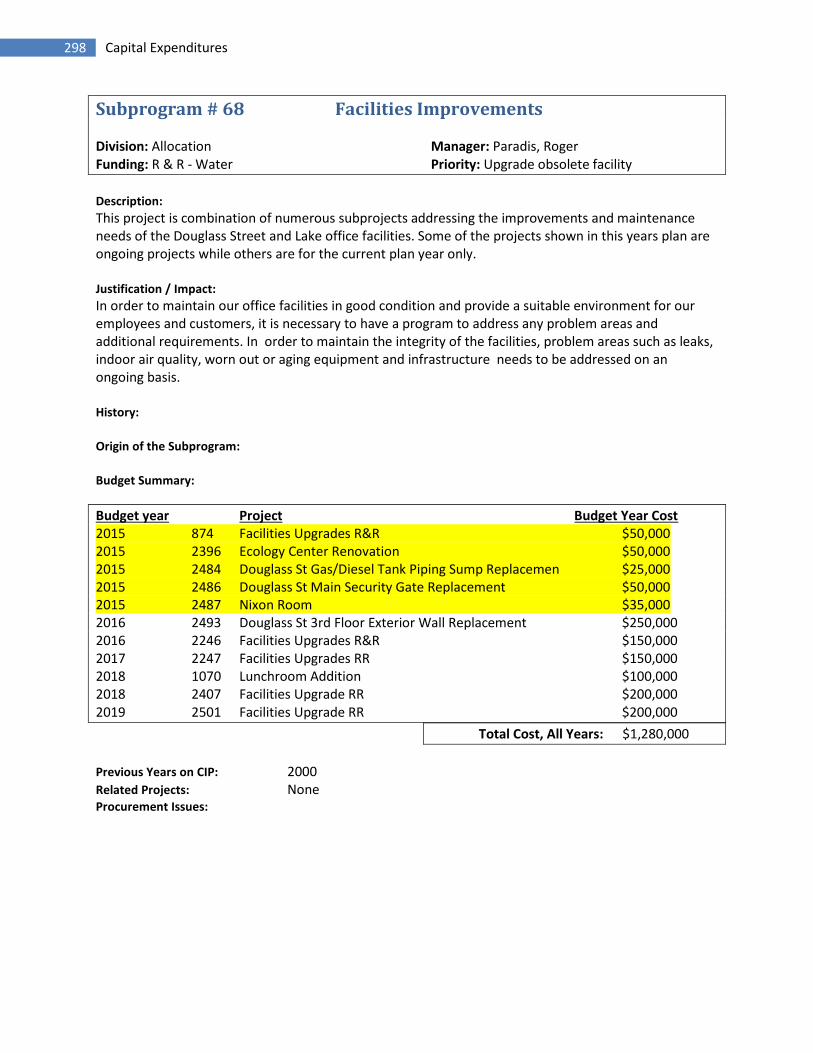
298 Capital Expenditures
Subprogram # 68 Facilities Improvements
Division: Allocation Manager: Paradis, RogerFunding: R & R - Water Priority: Upgrade obsolete facility
Description:
This project is combination of numerous subprojects addressing the improvements and maintenanceneeds of the Douglass Street and Lake office facilities. Some of the projects shown in this years plan areongoing projects while others are for the current plan year only.
Justification / Impact:
In order to maintain our office facilities in good condition and provide a suitable environment for ouremployees and customers, it is necessary to have a program to address any problem areas andadditional requirements. In order to maintain the integrity of the facilities, problem areas such as leaks,indoor air quality, worn out or aging equipment and infrastructure needs to be addressed on anongoing basis.
History:
Origin of the Subprogram:
Budget Summary:
Budget year Project Budget Year Cost2015 874 Facilities Upgrades R&R $50,0002015 2396 Ecology Center Renovation $50,0002015 2484 Douglass St Gas/Diesel Tank Piping Sump Replacemen $25,0002015 2486 Douglass St Main Security Gate Replacement $50,0002015 2487 Nixon Room $35,0002016 2493 Douglass St 3rd Floor Exterior Wall Replacement $250,0002016 2246 Facilities Upgrades R&R $150,0002017 2247 Facilities Upgrades RR $150,0002018 1070 Lunchroom Addition $100,0002018 2407 Facilities Upgrade RR $200,0002019 2501 Facilities Upgrade RR $200,000
Total Cost, All Years: $1,280,000
Previous Years on CIP: 2000Related Projects: NoneProcurement Issues:

299 Capital Expenditures
Subprogram # 70 Portland WW Pump Stations - R&R
Division: Wastewater - Portland Manager: Poulin, CharleneFunding: R & R - Wastewater Priority: Routine replacement
Description:
This program provides for a planned approach to the replacement of obsolete equipment in thePortland wastewater pump stations.This program provides for a planned approach to the replacementof obsolete equipment throughout the Portland Water District's Portland wastewater pump stations.Few improvements have taken place during the 25 years of operation. Pumps have to be upgraded,screens reconsidered and control systems revamped.
Justification / Impact:
The pump stations have reached the end of their useful design life and obsolete equipment must bereplaced. Continued attention to the pump stations will allow for a predictive approach to maintenancewhile ensuring operatonal optimatization and reliability.
History:
This program is based on the Portland Pump Station CPE performed by Wright-Pierce and contemplatesimprovements with funding from the R&R accounts.
Origin of the Subprogram:
Budget Summary:
Budget year Project Budget Year Cost2015 2425 Fore River Pump Station upgrades- Roof replacement $80,0002015 2495 Northeast Pump 3 Shaft Replacement $39,4002015 2496 Northeast Pump Station Crane Replacement $12,0002015 2031 Routine R and R for Pump Stations $75,0002016 2191 Portland WW Pump Stations - R&R $50,0002017 1914 Portland WW Pump Station Routine R&R $50,0002018 2427 Portland WW Pump Stations -R&R $100,0002019 1875 Systems Generator Installation - Portland $50,000
Total Cost, All Years: $456,400
Previous Years on CIP: 2003Related Projects: 420 - Portland WW Pump Station Capital Upgrade Program
Fore River Pump Station – Roof replacement is proposed for 2015 – Project #2425
Bing Maps

300 Capital Expenditures
Subprogram # 110 SCADA /Process Control - Water
Division: Water - General Manager: Richard, EmileFunding: R & R - Water Priority: Upgrade obsolete facility
Description:
The program supports 30 water sites across the District in upgrading and replacing the exitingSupervisory Control and Data Acquisition (SCADA) equipment. The work needed is replacement ofhardware and software to be compatible to the District SCADA standards and provide for increasedautomation of the water systems and treatment. Programmable Logic Controllers (PLC) have beenreplaced across the District to meet the new standards and remove outdated, non-maintainableequipment.
Justification / Impact:
The benefit of this program to increase the automation and reduce the staff hours needed to performroutine activities for the systems and treatment plants across the District.
History:
The District started changing out the system in 2003 by replacing the existing 20 year-old system andinstalling new SCADA equipment where it did not exist. Most systems have been retrofitted or replacedbut more automation of these systems will continue.
Origin of the Subprogram:
Budget year Project Budget Year Cost2015 2455 SLWTF SCADA - Replacement of Servers $30,0002015 2460 SLWTF SCADA PC Hardware Renewal Program $15,0002015 2488 Mackworth Island Controls Upgrade $35,0002016 2174 Miscellaneous Control Projects Upgrade $50,0002016 2461 SLWTF SCADA Server Renewal Program $18,0002017 2250 Miscellaneous Control Project Upgrades $50,0002018 2412 Miscellaneous Control Project Upgrades $50,0002019 1807 Miscellaneous Control Projects Upgrades $50,0002019 2464 Douglass St SCADA PC Renewal Program $5,000
Total Cost, All Years: $303,000

301 Capital Expenditures
Subprogram # 110 SCADA /Process Control - Water
Mackworth Island Disinfection Facility
Proposed project CIP# 110, project 2488 Mackworth Island Control Project

302 Capital Expenditures
Subprogram # 111 Water Main Replacement - R&R
Division: Water - General Manager: Pierce, NedFunding: R & R - Water Priority: Routine replacement
Description:
Renew, replace and upgrade obsolete galvanized water mains with current materials sized for currentand future conditions.
Justification / Impact:
This is a cost saving and water quality improvement process. Mains selected for replacement areprioritized on the basis of water quality complaints including low volumes, leak frequency data, and ageof existing plant.Commitment to Municipal and M.D.O.T. based on street reconstruction, and paving isalso a major selection factor.
History:
Galvanized mains were installed as low cost water supply beginning in the 1900's. At one time over250,000 feet were installed in our system. This relatively inferior material has less life expectancy thancast iron and is subject to rust related water quality and plugging problems. The District has a long termprogram to eliminate all galvanized mains from our system and currently approximately 26,000 feet arestill in service.
Origin of the Subprogram:
The current list of project is determined on the basis of water quality complaints, leak history, andmunicipal or state reconstruction projects by AMAP and Water Services.
Budget Summary:
Budget year Project Budget Year Cost2015 2014 Water Main Replacement- R&R $1,000,0002016 2172 Water Main Replacement- R&R $1,000,0002017 1900 Water Main Replacement- R&R $1,000,0002018 1675 Water Main Replacement- R&R $1,000,0002019 2508 Water Main Replacement- R&R $1,000,000
Total Cost, All Years: $5,000,000
Previous Years on CIP: AllRelated Projects: 43 Cast Iron Main RenewalProcurement Issues: Project will be placed out to bid

303 Capital Expenditures
Falmouth, 83,8%
South Portland,117, 12%
Gorham, 81,8%
Portland, 256,25%
Westbrook , 126,13%
Windham, 84, 8%
Raymond , 3, 0%
Standish, 29, 3%
Scarborough,111, 11%
Cumberland , 48,5%
Cape Elizabeth ,70, 7%
991 - Miles of Water Mains in Town and Cities
83117
81
256
12684
329
111
4870
6 13 17
60
8 1 0 0 0 1 1
66
260
29
597
164
51
0 10
86
1455
Miles of Main in Municipality vs. 100 years and older pipe vs Leaks
miles of main 100 years and older Leaks

304 Capital Expenditures
Subprogram # 122 Water Facilities Renewal and Replacement
Division: Water - General Manager: Wallace, JimFunding: R & R - Water Priority: Routine replacement
Description:
This is an ongoing project designed to maintain and improve water pump stations, treatment facilitiesand related infrastructure. Modifications and upgrades will assure adequate capacity, reliability andsafety of these facilities.
Justification / Impact:
Components of the older pump stations have reach their useful life and obsolete equipment should bereplaced. Replacing this equipment before it fails completely will reduce the amount spent on operatingand maintaining the equipment
History:
This planned renewal and replacement will assist operations in moving toward a goal of performingmore predictive and preventive maintenance instead of emergency.
Budget Summary:
Budget year Project Budget Year Cost2015 2482 SLWTF - Replacement of the Chemical Storage Level $25,0002015 2030 Water Facilities R&R $20,0002015 2458 SLWTF Throttling Valve convert to electric operator $35,0002016 2454 SLWTF Ammonia Storage Tank Replacement $75,0002016 2457 SLWTF Lobby Skylight Rehabilitation $30,0002016 2456 SLWTF HVAC Control System $50,0002016 2378 SLWTF HVAC Controls Replacement $50,0002017 2252 Water Facilities RR $50,0002018 2415 Water Facilities RR $50,0002019 2175 Water Facilities R&R $50,000
Total Cost, All Years: $435,000
Previous Years on CIP: 2007 to Present
Newly replaced chemical feed piping 2014

305 Capital Expenditures
Subprogram # 167 Westbrook Gorham Windham Regional WWTF
Division: Wastewater - Joint Westbrook Manager: Rodriguez, PaulFunding: Deferred Operating Expense/Bonds Priority: Upgrade obsolete facility
Description:
The Westbrook Comprehensive Plant Evaluation (CPE) Program completed in 2001 identified a series ofrecommended system improvements and upgrades to replace inefficient, non-existant, or obsoleteequipment and systems. Many of the items identified are intended to improve plant performance andefficiency. This CPE Upgrade Program represents the phased implementation of that long rangeprogram.
Justification / Impact:
The current facility is over 36 years old and many of the existing systems have reached or exceeded thedesign life of the equipment. Even with the excellent level of maintainance, may of the systems willeventually require replacement. Additionally, the identified programs are designed to provide for moreefficient and cost effective treatment systmes. Regulatory requirements continue to increase and thetechnology required to meet these levels has increased. Achieving these standards through a morereliable, efficient, and cost effective manner is the ultimate goal of this program.
History:
This program is the result of the CPE study performed by Wright-Pierce dated March 2001. The projectschedule presented in the report has been reprioritized by Staff to reflect a detailed 5 year plan, withother work extended beyond that period.
Budget Summary:
Budget year Project Budget Year Cost2015 2343 Westbrook WWTF Secondary Clarifier Evaluation $30,000 OpEx2017 992 Secondary Clarifier Improvements $750,000 Bond2017 1000 Thickened Sludge Storage Tank Upgrade $404,733 Bond
Total Cost, All Years: $1,184,733
Previous Years on CIP: 2001Procurement Issues: Engineering Services will be procured using RFP process. Board of Trustees shall approve
method (phased) and contract for engineering
Westbrook Gorham Windham Wastewater TreatmentFacility - Built in 1978

306 Capital Expenditures
Subprogram # 177 SCADA /Process Control - Wastewater
Division: Wastewater Manager: Richard, EmileFunding: R & R – Wastewater/Bond Priority: Upgrade obsolete facility
Description:
The program supports all 80 wastewater sites across the District in upgrading and replacing the exitingSupervisory Control and Data Acquisition (SCADA) equipment. The work needed is replacement ofhardware and software to be compatible to the District SCADA standards and provide for increasedautomation of wastewater systems and treatment. Programmable Logic Controllers (PLC) have beenreplaced across the District to meet the new standards and remove outdated, non-maintainableequipment. In 2012 the District is proposing to replace one of the remaining older PLCs in the system atthe Westbrook Gorham Regional Wastewater Treatment Facility. Along with changing the hardware acomplete reprogramming of the software will be completed. This PLC change-out will provide increaseinputs for expansion of automation of the WGRWTP consistent with the District’s other 3 treatmentfacilities. Also proposed is the demolition of the East End PLC 5 equipment to complete the change-outof the new PLC installed in 2011.
Justification / Impact:
The benefit of this program to increase the automation and reduce the staff hours needed to performroutine activities for the systems and treatment plants across the District.
History:
The District started changing out the system in 2003 by replacing the existing 20 year-old system acrossthe 6 wastewater communities and installing new SCADA equipment where it did not exist. Mostsystems have been retrofitted or replaced but more automation of these systems will continue.
Budget year Project Budget Year Cost2015 2462 EEWWTP SCADA Server Renewal Program $17,0002015 2465 SCADA System Domain & PI Server Renewal Program $50,0002015 2473 Westbrook WWTF - Global OIT (PanelView) $17,0002015 2474 PI System - Add 1000 new PI Points $11,6312015 2483 SCADA Radio Replacement - Wastewater Network #3 $15,7002015 2485 SCADA System PLC Program Management System $47,3662016 1683 Process Control and SCADA upgrades $50,0002016 2369 High Flow Control Programing $25,0002016 2452 East End WWTF - PLC5 Demolition $135,0002016 2492 Replace Shore Acres Telemetry Repeater $225,400 Bond2016 2512 SCADA System PLC Program Management Sys. – Phase2 $39,5612017 2267 Process Control and SCADA upgrades $50,0002017 2467 Westbrook SCADA Server Renwal Program $19,0002018 2428 Process Control and SCADA upgrades $50,0002019 2463 EEWWTP SCADA PC Renewal Program $17,0002019 2466 Westbrook SCADA PC Renewal Program $6,0002019 2028 Process Control and SCADA upgrades $50,000
Total Cost, All Years: $825,658
Previous Years on CIP: 2003 to presentRelated Projects: 110Procurement Issues:

307 Capital Expenditures
SCADA Screen for Grit Removal process – East End Waste Water Treatment Facility
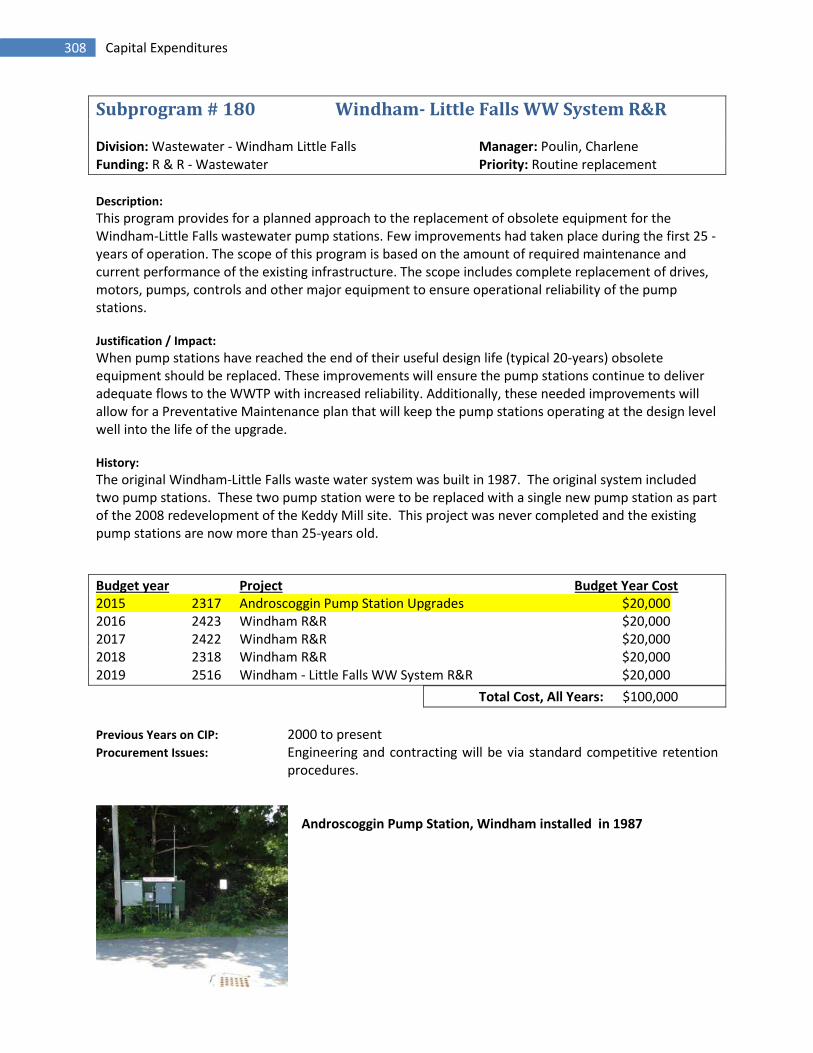
308 Capital Expenditures
Subprogram # 180 Windham- Little Falls WW System R&R
Division: Wastewater - Windham Little Falls Manager: Poulin, CharleneFunding: R & R - Wastewater Priority: Routine replacement
Description:
This program provides for a planned approach to the replacement of obsolete equipment for theWindham-Little Falls wastewater pump stations. Few improvements had taken place during the first 25 -years of operation. The scope of this program is based on the amount of required maintenance andcurrent performance of the existing infrastructure. The scope includes complete replacement of drives,motors, pumps, controls and other major equipment to ensure operational reliability of the pumpstations.
Justification / Impact:
When pump stations have reached the end of their useful design life (typical 20-years) obsoleteequipment should be replaced. These improvements will ensure the pump stations continue to deliveradequate flows to the WWTP with increased reliability. Additionally, these needed improvements willallow for a Preventative Maintenance plan that will keep the pump stations operating at the design levelwell into the life of the upgrade.
History:
The original Windham-Little Falls waste water system was built in 1987. The original system includedtwo pump stations. These two pump station were to be replaced with a single new pump station as partof the 2008 redevelopment of the Keddy Mill site. This project was never completed and the existingpump stations are now more than 25-years old.
Budget year Project Budget Year Cost2015 2317 Androscoggin Pump Station Upgrades $20,0002016 2423 Windham R&R $20,0002017 2422 Windham R&R $20,0002018 2318 Windham R&R $20,0002019 2516 Windham - Little Falls WW System R&R $20,000
Total Cost, All Years: $100,000
Previous Years on CIP: 2000 to presentProcurement Issues: Engineering and contracting will be via standard competitive retention
procedures.
Androscoggin Pump Station, Windham installed in 1987

309 Capital Expenditures
Subprogram # 203 Water Storage Facility Maintenance & Upgrade
Division: Water - General Manager: Johnson, GordonFunding: R & R – Water/Bond Priority: Routine replacement
Description:
This project consists of developing a maintenance program. Maintenance that may be necessaryincludes leak repair, painting, inside liners, base and /or cover needs. Once this work is complete, amulti-year program of maintenance contracts will be let to upgrade individual facilities. In somefacilities, recirculation systems to routinely turn over the water in the tank and / or new altitude valveswill be installed.
Justification / Impact:
Basic maintenance to preserve and prolong the useful life of needed facilities. Prevent water qualityproblems due to corrosion and from water stagnating in the tank.
History:
Several steel standpipes and elevated tanks have been removed over the last decade. Those whichremain will be evaluated for their hydraulic value and water quality impact in the Comprehensive WaterSystem Strategic Plan. Those which are considered to be valuable hydraulic assets to the water systemwill be upgraded via this ongoing program.
Origin of the Subprogram:
Maintenance has been deferred for several years pending completion of a hydraulic study to determinewhich tanks still have hydraulic value.
Budget Summary:
Budget year Project Budget Year Cost2015 2453 Fall Protection for Steel Water Storage Tanks $75,0002016 368 Water Tank Maintenance $25,0002017 1840 Water Storage Tank Maintenance: Gorham Tank $400,000 Bond2017 2256 Water Tank Maintenance $25,000 Bond2018 2420 Water Tank Maintenance $25,0002019 370 Water Tank Maintenance $50,0002019 1839 Improve Water Quality in Gowen Road Tank $50,000
Total Cost, All Years: $650,000
Previous Years on CIP: Since 2000Related Projects: Comprehensive Water System Strategic PlanProcurement Issues: RFP preparation and contract administration will be by District Staff.
Maintenance and repair services will be competitively bid.

310 Capital Expenditures
Subprogram # 203 Water Storage Facility Maintenance & Upgrade
In 2017 the Gorham Tank (below) is schedule to be rehabilitated Project 1840. This will included painting
the inside and outside of the Tank.
Gorham Tank
In 2015 Standish Tank, Steep Falls Tank and Gowen Road Tank are schedule to have upgrades to the fall
protection equipment. Proposed Project # 2453 Fall Protection for Steel Water Storage Tanks-$75,000
Standish Tank - climbing cage
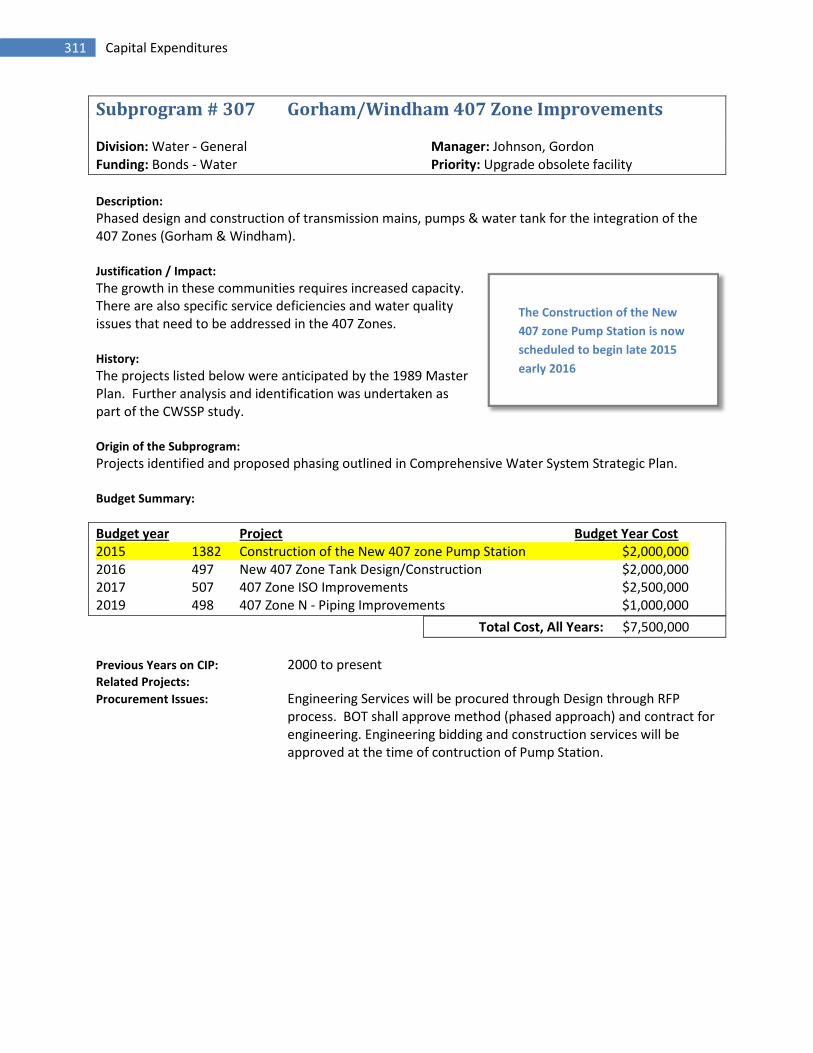
311 Capital Expenditures
Subprogram # 307 Gorham/Windham 407 Zone Improvements
Division: Water - General Manager: Johnson, GordonFunding: Bonds - Water Priority: Upgrade obsolete facility
Description:
Phased design and construction of transmission mains, pumps & water tank for the integration of the407 Zones (Gorham & Windham).
Justification / Impact:
The growth in these communities requires increased capacity.There are also specific service deficiencies and water qualityissues that need to be addressed in the 407 Zones.
History:
The projects listed below were anticipated by the 1989 MasterPlan. Further analysis and identification was undertaken aspart of the CWSSP study.
Origin of the Subprogram:
Projects identified and proposed phasing outlined in Comprehensive Water System Strategic Plan.
Budget Summary:
Budget year Project Budget Year Cost2015 1382 Construction of the New 407 zone Pump Station $2,000,0002016 497 New 407 Zone Tank Design/Construction $2,000,0002017 507 407 Zone ISO Improvements $2,500,0002019 498 407 Zone N - Piping Improvements $1,000,000
Total Cost, All Years: $7,500,000
Previous Years on CIP: 2000 to presentRelated Projects:
Procurement Issues: Engineering Services will be procured through Design through RFPprocess. BOT shall approve method (phased approach) and contract forengineering. Engineering bidding and construction services will beapproved at the time of contruction of Pump Station.
The Construction of the New
407 zone Pump Station is now
scheduled to begin late 2015
early 2016
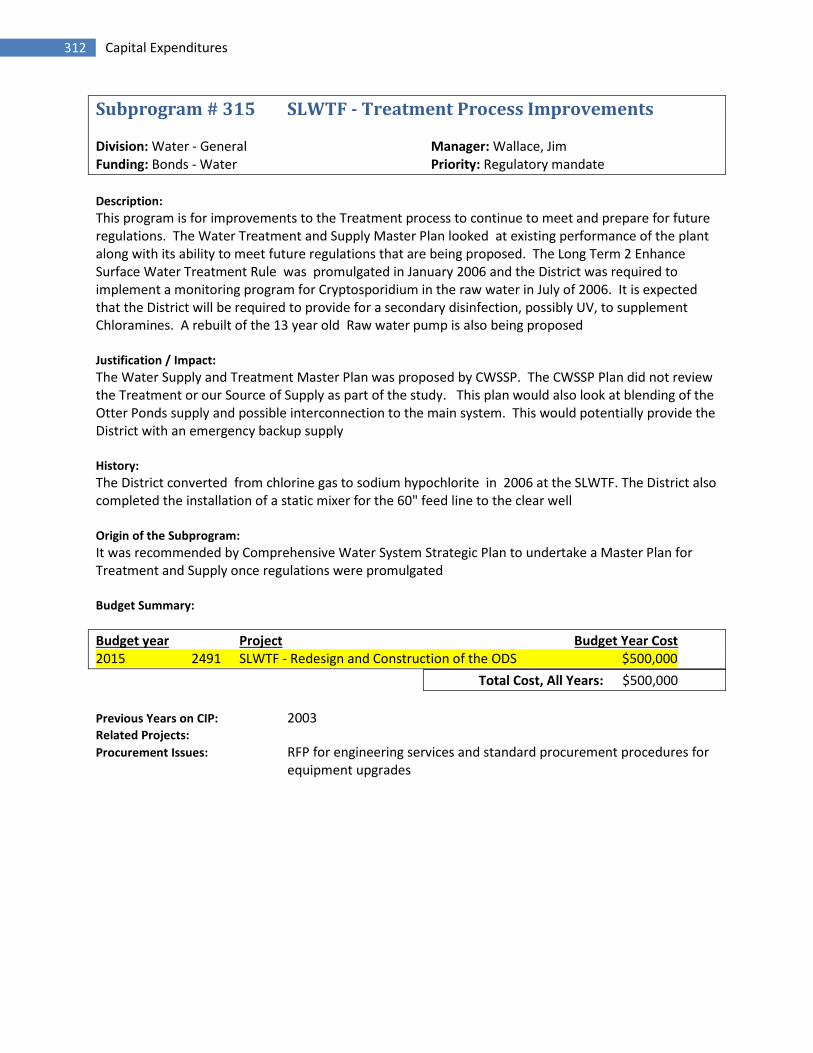
312 Capital Expenditures
Subprogram # 315 SLWTF - Treatment Process Improvements
Division: Water - General Manager: Wallace, JimFunding: Bonds - Water Priority: Regulatory mandate
Description:
This program is for improvements to the Treatment process to continue to meet and prepare for futureregulations. The Water Treatment and Supply Master Plan looked at existing performance of the plantalong with its ability to meet future regulations that are being proposed. The Long Term 2 EnhanceSurface Water Treatment Rule was promulgated in January 2006 and the District was required toimplement a monitoring program for Cryptosporidium in the raw water in July of 2006. It is expectedthat the District will be required to provide for a secondary disinfection, possibly UV, to supplementChloramines. A rebuilt of the 13 year old Raw water pump is also being proposed
Justification / Impact:
The Water Supply and Treatment Master Plan was proposed by CWSSP. The CWSSP Plan did not reviewthe Treatment or our Source of Supply as part of the study. This plan would also look at blending of theOtter Ponds supply and possible interconnection to the main system. This would potentially provide theDistrict with an emergency backup supply
History:
The District converted from chlorine gas to sodium hypochlorite in 2006 at the SLWTF. The District alsocompleted the installation of a static mixer for the 60" feed line to the clear well
Origin of the Subprogram:
It was recommended by Comprehensive Water System Strategic Plan to undertake a Master Plan forTreatment and Supply once regulations were promulgated
Budget Summary:
Budget year Project Budget Year Cost2015 2491 SLWTF - Redesign and Construction of the ODS $500,000
Total Cost, All Years: $500,000
Previous Years on CIP: 2003Related Projects:
Procurement Issues: RFP for engineering services and standard procurement procedures forequipment upgrades

313 Capital Expenditures
Subprogram # 315 SLWTF - Treatment Process Improvements
Joel Anderson, Chief Operator inspecting the newly on-line UV system (March 2014)

314 Capital Expenditures
Subprogram # 326 Vehicle and Equipment Replacement
Division: Allocation Manager: Paradis, RogerFunding: R & R - Water Priority: Routine replacement
Description:
This project is to replace a portion of the District's Vehicle and Equipment fleet each year.This year’s review included the evaluation of all of the vehicles and equipment which have met orexceeded the trade criteria. In reviewing the fleet, the replacement cost is between $4,500,000 and$5,000,000.
Justification / Impact:
The rolling stock and construction equipment fleet are essential to the District's "mission to provide ourcustomers with quality water, wastewater and related environmental services." Maintaining a reliablefleet of vehicles and equipment enables staff to fullfill the mission with safety, efficiency and timeliness.Worker safety, efficient operations and customer satisfaction are the basic benefits of maintaining asound vehicle and equipment inventory.
History:
The Asset Management Departmentt conducts an annual evaluation of major pieces of equipment andvehicles to determine our annual replacement needs. The various trade criteria are also reviewed toassure that they are appropriate. Based on the age and use of the fleet, projections of future annualcosts are included in the five-year plan. These projections are re-reviewed each year to develop aminimum replacement program for the current year. Several major pieces of equipment will need to bereplaced in the next two to four years.
Origin of the Subprogram:
Annual review and replacement of vehicles and equipment is a basic operating need of anygeographically dispersed utility.
Budget year Project Budget Year Cost2015 1894 Annual vehicle and equipment replacement $275,0002016 2162 Annual vehicle and equipment replacement $400,0002017 2245 Annual vehicle and equipment replacement $400,0002018 2413 Annual vehicle and equipment replacement $230,0002018 1834 Vacuum / Valve Turner for A2 Vehicle $60,0002018 1835 Vacuum / Valve Turner for A6 Vehicle $60,0002018 1844 Replacement of the Water Stand-by Pumper $50,0002019 2503 Vehicle and Equipment Replacement $400,000
Total Cost, All Years: $1,875,000
Previous Years on CIP: AllRelated Projects:
Procurement Issues: Specifications are developed and proposals are solicited fromapproximately thirty vehicle and equipment dealers. Purchases aremade on the basis of price and other criteria which lead to lowest lifecycle cost.

315 Capital Expenditures
Subprogram # 407 Cape Elizabeth Pump Stations - Capital
Division: Wastewater - Cape Elizabeth Manager: Rodriguez, PaulFunding: Bonds - Wastewater Priority: Upgrade obsolete facility
Description:
This program is designed to satisfy two needs; upgrading of aging pump stations throughout the CapeNorth and South systems, and to meet a requirement to eliminate combined sewer overflow at theOttawa Road pump station. To do so might require increased line capacity to Family Field pump stationas well as an upgrade to the Family Field pump station. Another combined sewer overflow exists at theSpurwink Avenue pump station. Some modiifcations to that station are likely to handle the excess flowgenerated during periods of very wet weather.
Justification / Impact:
The need to eliminate the CSOs at Ottawa Road and Spurwink is regulatory driven. As the operator ofthese facilities, the Department of Environmental Protection has put the District on a schedule toaddress the illegal overflows. Some elements of the system, especially in North Cape, have been inoperation since the 70's are in need of upgrade. This project allows for the funding of those upgrades.
History:
Past upgrades to pump stations throughout the Cape system have been limited to pump replacements,SCADA upgrades and hardware replacements. This will continue to be the manner in which thesestations get upgraded. The Combined Sewer Overflow issue at Ottawa Road pump station has been onthe back burner for a number of years, while the Spurwink overflow problems became an issue duringthe wet years of 2005 and 2006. The Department wrote into the last license renewal for the South CapeWWTF, a schedule for the elimination of the Spurwink overflows. The District hired Wright Pierce tostudy the problem and come up with a plan to eliminate the overflows. The license states that thereport will be completed by 12/31/07, submitted to the DEP for review and will contain "a scope of workand schedule to eliminate the discharge of untreated wastewater from the influent pump station."
Origin of the Subprogram:
Department of Environmental Protection incorporated the project in the 2006 license.
Budget Summary:
Budget year Project Budget Year Cost2015 2314 Wildwood Pump Station Upgrade $95,0002016 52 Maiden Cove Upgrade to Submersible PS $350,0002016 1360 Family Field Pump Station Upgrade $620,0002018 1867 Peabbles Cove Force Main $125,000PEND 867 Ottawa Rd. WWPS Capacity Upgrade $150,000PEND 2086 Ottawa Road CSO Master Plan- Year 1 Implementation $50,000
Total Cost, All Years: $1,390,000
Previous Years on CIP:Related Projects:Procurement Issues:

316 Capital Expenditures
Subprogram # 408 Water System Redundancy (Looping) andUpsizing Development
Division: Water - General Manager: Spugnardi, RicoFunding: R & R - Water Priority: Routine replacement
Description:
Identify and evaluate areas requiring system redundancy. Design and schedule the installation of loopingthese systems and eliminating critical dead end areas in the Distribution System
Justification / Impact:
The justification, impact, and benefit of this program is a priority system based on, water quality(eliminating dead ends), water availability ( Increased demands through growth and fire flow demands),and improving general District System and Partnering Water System redundancy.
History:
History is based on decreases in fire flows and increased usage demands noted when conductingactivities in these areas such as flushing and temporary shutdown of present supply mains.
Origin of the Subprogram:
The current projects listed are based on increased demand and multiple system redundancy.
Budget Summary:
Budget year Project Budget Year Cost2015 2029 Water main looping and or upsizing for development $50,0002016 2181 Water main looping and or upsizing for development $50,0002017 2257 Water main looping and or upsizing for development $50,0002018 2182 Water main looping and or upsizing for development $50,0002019 2510 Water System Redundancy (Looping) and Upsizing dev $50,000
Total Cost, All Years: $250,000
Previous Years on CIP: noneRelated Projects: 43, 111Procurement Issues: District labor & equipment or low bid contract installation

317 Capital Expenditures
Subprogram # 409 East End WWTF - R&R
Division: Wastewater - Portland Manager: Sloan, SteveFunding: R & R - Wastewater Priority: Routine replacement
Description:
Various systems and equipment will need to replaced and/or modified as the equipment becomesobsolete due to age. This series of projects contemplates replacement of these systems and equipmentthrough the planned use of exsiting R&R funds.
Justification / Impact:
The management of assets requires the continuous replacement and refurbishment of infrastructure asit ages and wears. The current facility is over twenty-five years old and many of the support systemsand equipment are showing their age. Many of these replacements are required to provide continuedservice and to meet regulatory requirements. Other items are intended to maintain the physicalinfrastructure associated with the treatement facilities.
History:
Origin of the Subprogram:
This project has been created in order to provide for a structured and planned utilization of existingR&R.
Budget Summary:
Budget year Project Budget Year Cost2015 1818 EEWWTF - Plant Water System $50,0002015 2153 EEWWTP Effluent Flow Meter Replacement $50,0002015 2397 Dewatering Odor control upgrade $200,0002015 2471 EEWWTF Polymer System for Secondary Settling $80,0002015 2494 EEWWTF - RR $75,0002016 1612 EEWWTF- HVAC Project - Phase 4 $178,0002016 1823 EEWWTF - Primary Basins $75,0002016 1830 EEWWTF - Roadway & Parking Lot Paving $150,0002016 2045 EEWWTF - Process gate Automation $150,0002017 2198 East End Process Clarifier Feed Gate Replacement $50,0002017 1764 EEWTF- HVAC Project - Misc. $350,0002018 1913 EEWWTF - Plant upgrades $350,0002018 2274 EEWWTF Effluent Thermal Heating System $150,0002018 2311 East End Gate Replacements $60,0002019 1614 HVAC Project - Misc. $350,0002019 1613 EEWWTF - HVAC Project - Phase 5 $200,000PEND 2150 EEWWTF - Aeration System blade replacement $150,000
Total Cost, All Years: $2,668,000
Previous Years on CIP: 2004-presentRelated Projects:Procurement Issues:
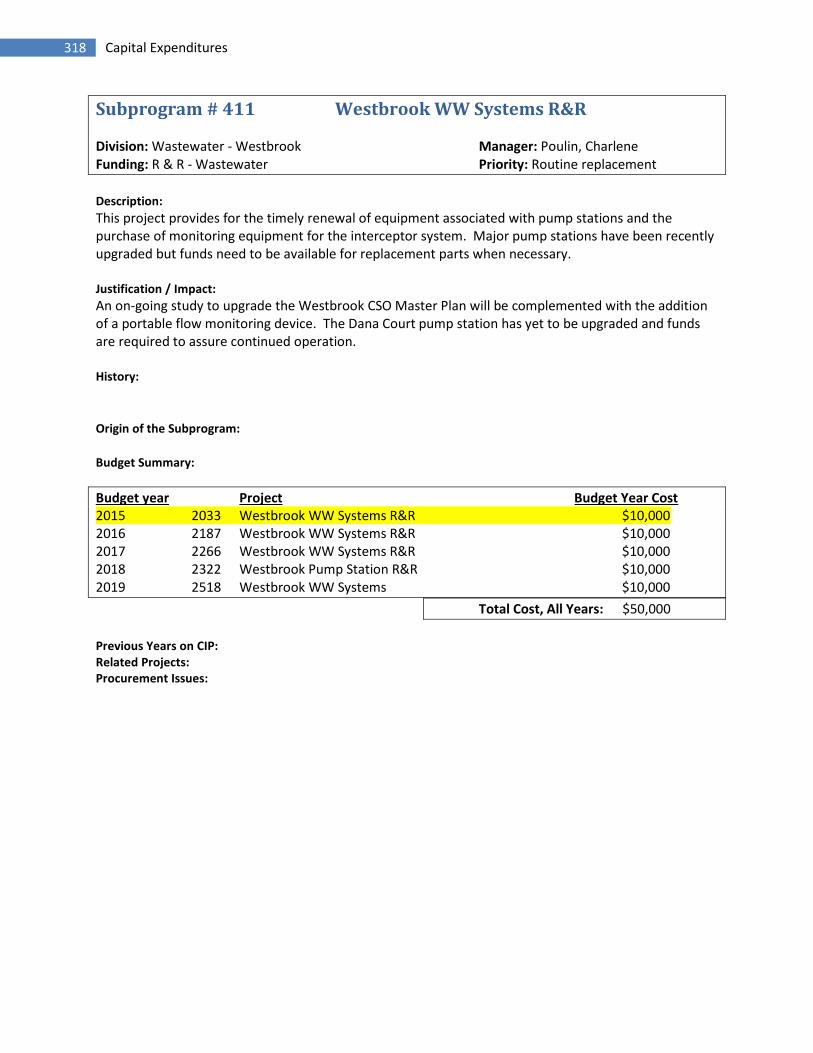
318 Capital Expenditures
Subprogram # 411 Westbrook WW Systems R&R
Division: Wastewater - Westbrook Manager: Poulin, CharleneFunding: R & R - Wastewater Priority: Routine replacement
Description:
This project provides for the timely renewal of equipment associated with pump stations and thepurchase of monitoring equipment for the interceptor system. Major pump stations have been recentlyupgraded but funds need to be available for replacement parts when necessary.
Justification / Impact:
An on-going study to upgrade the Westbrook CSO Master Plan will be complemented with the additionof a portable flow monitoring device. The Dana Court pump station has yet to be upgraded and fundsare required to assure continued operation.
History:
Origin of the Subprogram:
Budget Summary:
Budget year Project Budget Year Cost2015 2033 Westbrook WW Systems R&R $10,0002016 2187 Westbrook WW Systems R&R $10,0002017 2266 Westbrook WW Systems R&R $10,0002018 2322 Westbrook Pump Station R&R $10,0002019 2518 Westbrook WW Systems $10,000
Total Cost, All Years: $50,000
Previous Years on CIP:Related Projects:Procurement Issues:

319 Capital Expenditures
Subprogram # 416 Westbrook/Gorham/Windham WWTF R&R
Division: Wastewater - Joint Westbrook Manager: Waterman, RobertFunding: R & R - Wastewater Priority: Routine replacement
Description:
Various systems and equipment will need to replaced and/or modified as the equipement becomesobsolete due to age. An item has also been included to revise the O&M Manual to reflect these andother changes in the operating systems of the plant over the last 20+ years.
Justification / Impact:
The management of assets requires the continuous replacement and refurbishment of infrastructure asit ages and wears. The current facility is over twenty years old and many of the support systems andequipment are showing their age. Many of these replacements are required to provide continuedservice and to meet regulatory requirements. Other items are intended to maintain the physicalinfrastructure associated with the treatement facilities.
History:
This project was created to provide for a planned use of the R&R funds in meeting the needs of theWestbrook/Gorham WWTF.
Origin of the Subprogram:
This project has been created in order to provide for a structured and planned utilization of existingR&R.
Budget Summary:
Budget year Project Budget Year Cost2015 2034 Routine Renewal and Replacement $50,0002015 2268 Security Upgrades $30,0002015 2477 WGWWTF Sludge Dewatering Pilot Testing $10,0002016 2075 WGWTF - Belt Filter Press rebuild $180,0002017 2265 Routine Renewal and Replacement $50,0002018 2426 Routine Renewal and Replacement $50,0002019 2519 Westbrook/Gorham/Windham WWTF R&R $50,000
Total Cost, All Years: $420,000
Previous Years on CIP:Related Projects:Procurement Issues:

320 Capital Expenditures
Subprogram # 418 Cape Elizabeth WWTF - Capital
Division: Wastewater - Cape Elizabeth Manager: Firmin, ScottFunding: Bonds - Wastewater Priority: Upgrade obsolete facility
Description:
Provide for capital plant upgrades required to continue to meet regulatory and operationalrequirements. The following compliance schedule has been included in the Draft Revision of thePermit: By Dec. 31, 2009 - Submit Phase I fnal design to MEDEP for review, by April 30, 2010 commencePhase I construction, by April 30, 2011 provide progress report to MEDEP, by Sept. 30, 2011 completePhase I upgrades.
Justification / Impact:
Many of the projects will be developed in response of the findings of a study currently being conductedby Wright-Pierce. The study involves increasing the flow throught the treatment plant to help eliminatewet weather plant bypassing issues at the Spurwink influent pump station. Other projects are justifiedas part of the timely upgrading of the treatment facility which has been on line for 20 years without anysubstantial modifications. Control system improvements will allow for off-hour monitoring andresponse as well as assurances that regulatory requirements are consistently met.
History:
The Maine Department of Environmental Protection wrote into the facility's most recent license, arequirement that a study to eliminate the bypassing of flows during periods of wet weather must becompleted by 12/31/08. The requirement calls for a scope of work and a time frame to complete studyrecommendations. At a minimum, upgrades to plant effluent pumping capacity and minor pipingmodifications will be necessary.
Origin of the Subprogram:
The following compliance schedule has been included in the Draft Revision of the Permit: By Dec. 31,2009 - Submit Phase I fnal design to MEDEP for review, by April 30, 2010 commence Phase Iconstruction, by April 30, 2011 provide progress report to MEDEP, by Sept. 30, 2011 complete Phase Iupgrades.
Budget Summary:
Budget year Project Budget Year Cost2015 2304 Security Improvements - Cape Elizabeth WWTF $25,0002015 2394 Cape Elizabeth Effluent Sampling $165,0002015 2451 Cape Elizabeth WWTF - Headworks Gas Alarming $17,5002015 2476 Cape Elizabeth WWTF Alkalinity Feeding System $35,0002016 1911 Cape Elizabeth Treatment Plant - Ph 2 improvements $1,000,000
Total Cost, All Years: $1,242,500
Previous Years on CIP:Related Projects:Procurement Issues:

321 Capital Expenditures
Subprogram # 420 Portland WW Pump Station Capital Upgrade
Division: Wastewater - Portland Manager: Rodriguez, PaulFunding: Bonds - Wastewater Priority: Upgrade obsolete facility
Description:
This project will allow for the complete upgrade of the larger 27 year old Porltand pump stations toensure reliable operation at the required level of service for each of the stations. The projects include arevised approach to complete the required upgrades under a single project rather than a series ofsmaller projects spread over a number of years. The upgrades will provide a complete upgrade to thestations, including the replacement of retired screenings equipment, pumps, support systems, andcontrols.
Justification / Impact:
This upgrade will enusre that equipment operates at required levels of service and will allow for thecontinued preventative maintenance of the critical pump stations. The upgrade is also intended toimprove remote control capabilities of the pump stations allowing for increased remote functionality.
History:
These projects are based upon the original Portland Pump Station CPE. Some additions to the scope(inclusion of additonal VFDs for all pumps to allow for increase redundancy and reliability) have beenmade based upon a more detailed analysis, however, these projects are revision to the approachoriginally identified. Rather than completing a series of 3 or 4 smaller projects at each station, the entireproject will be completed in a single contract at each station. This should result in increased efficienciesassoicated with implementation and management of the projects.
Origin of the Subprogram:
TBA
Budget Summary:
Budget year Project Budget Year Cost2016 2424 Fore River Pump Station upgrades - phases 2,3,4 $2,500,000
Total Cost, All Years: $2,500,000
Previous Years on CIP: NoneRelated Projects: $1.6 million of phase 1 will be bond financed in 2015.Procurement Issues:

322 Capital Expenditures
Subprogram # 421 Wastewater Asset Condition Evaluations
Division: 50 Manager: Firmin, ScottFunding: Deferred Operating Expense Priority: Upgrade obsolete facility
Description:
This subprogram will provide needed engineering evaluation and programming of similar asset classesacross all wastewater treatment plants and critical influent pump stations. Many of the processes havebeen upgraded over the years but systems such as electrcial and HVAC were not priorizted to bereplaced but are critical to the overall operations. Performng enginieering evaluations on these criticalsystems would be first step and developing a long term plan to replace or upgrade these systems tomeet current codes. This project will include a review of update code requirements and provide aplanned and prioritized series of recommended upgrades.
Justification / Impact:
Current systems are original to the existing treatment plants. This project will review the performanceof existing systems, current code requirements, and will provide a recommended schedule and budgetto upgrade or replace these critical systems. The goals are to upgrade these systems to meeting codeand allow for additional capacity to meet the future needs and install energy efficient systems.
Budget Summary:
Budget year Project Budget Year Cost2015 2470 WWTF Electrical System Evaluation $150,0002016 2472 Evaluation of WWTF HVAC Systems $150,000
Total Cost, All Years: $300,000
Previous Years on CIP: NoneRelated Projects:Procurement Issues: RFP for engineering procurement

323 Capital Expenditures
Subprogram # 423 Peaks Island R&R
Division: Wastewater - Peaks Manager: Waterman, RobertFunding: R & R - Wastewater Priority: Routine replacement
Description:
This account will provide for timely routine replacement of equipment at the Peaks Island TreatementPlan and pump stationst.
Justification / Impact:
Physical assests require scheduled maintenance and eventual replacement. This project providesfunding for the efficient and timely replacement of equipment using routine and replacement funds.
History:
This program has been used at most PWD wastewater systems in the past.
Origin of the Subprogram:
Budget Summary:
Budget year Project Budget Year Cost2015 2478 Peaks WWTF Headworks Ventilation System Upgrades $45,0002015 2479 Peaks WWTF Alkalinity Feeding System $35,0002015 2480 Peaks WWTF Influent Valve A $35,0002015 2481 Peaks Island Security Upgrades $20,0002015 2035 Routine Renewal and Replacement $20,0002016 2348 Peaks WWTF Decant Pump Replacement $125,0002016 2344 Peaks WWTF Compressed Air System Replacement $35,0002016 2190 Peaks Island RR $20,0002017 2323 Peaks Island R&R $20,0002018 2324 Peaks Island R&R $20,0002019 2520 Peaks Island R&R $20,000
Total Cost, All Years: $395,000
Previous Years on CIP: 2007 -presentRelated Projects:
Peaks Island Waste Water Treatment Facility

324 Capital Expenditures
Subprogram # 424 Cape Elizabeth WWTF - R&R
Division: Wastewater - Cape Elizabeth Manager: Waterman, RobertFunding: R & R - Wastewater Priority: Routine replacement
Description:
This account will provide for the timely routine replacement of equipment at the Cape South TreatmentPlant. This facility was brought on line in 1988. During that time, the facility has not under gone anyimprovement projects. The polymer system has reached the end of its usefulness and will needupgrading.
Justification / Impact:
Physical assests require scheduled maintenance and eventual replacement. This project providesfunding for the efficient and timely replacement of equipment using routine and replacement funds.Planned upgrades will ultimately lead to improved automation at the facility, allowing for the initiationof process changes from a remote location.
History:
This program has been used at most PWD wastewater systems in the past.
Origin of the Subprogram:
Budget Summary:
Budget year Project Budget Year Cost2015 2489 Spurwink Groundwater Infiltration Mitigation $15,0002015 2032 Routine R&R $10,0002016 2184 Cape Elizabeth WWTF - R&R $20,0002016 2389 Replacement of Heating Boiler at the S.Cape WWTF $50,0002017 2262 Cape Elizabeth WWTF - R&R $20,0002018 2055 WAS/RAS Piping Replacement at CEWWTF $50,0002019 2514 Cape Elizabeth WWTF - R&R $50,000
Total Cost, All Years: $215,000
Previous Years on CIP: 2006 to presentRelated Projects: 418
Spurwink Station, Cape Elizabeth
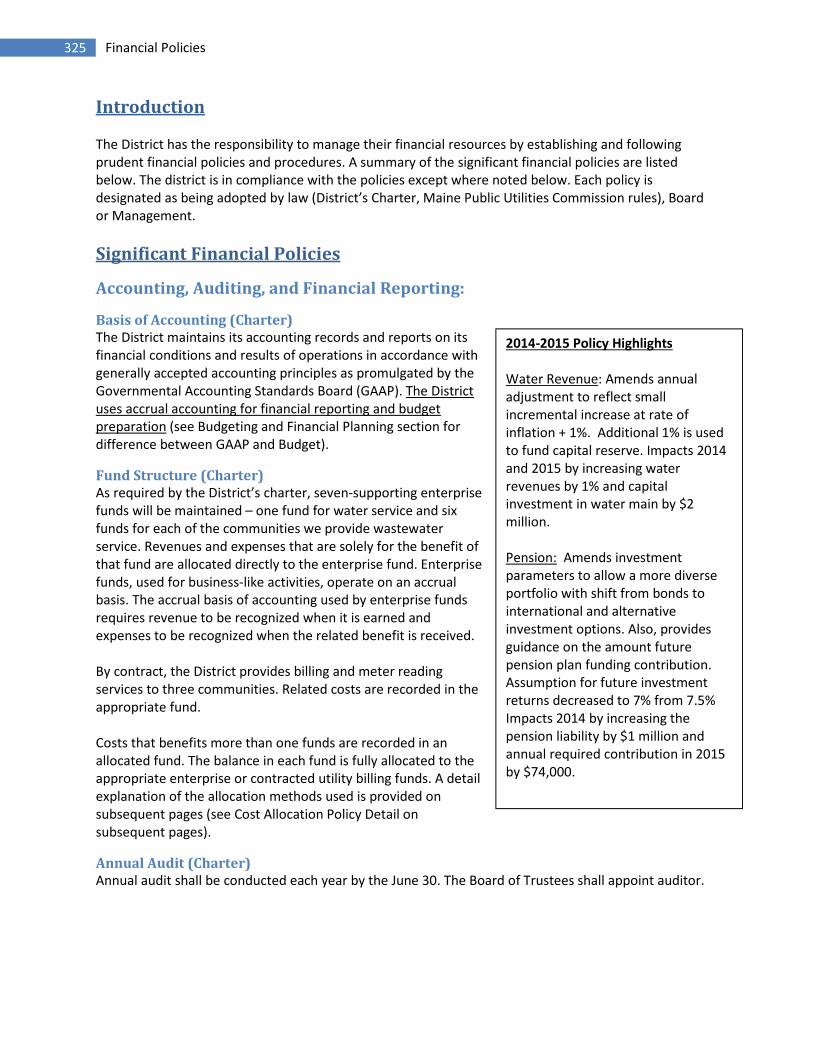
325 Financial Policies
2014-2015 Policy Highlights
Water Revenue: Amends annualadjustment to reflect smallincremental increase at rate ofinflation + 1%. Additional 1% is usedto fund capital reserve. Impacts 2014and 2015 by increasing waterrevenues by 1% and capitalinvestment in water main by $2million.
Pension: Amends investmentparameters to allow a more diverseportfolio with shift from bonds tointernational and alternativeinvestment options. Also, providesguidance on the amount futurepension plan funding contribution.Assumption for future investmentreturns decreased to 7% from 7.5%Impacts 2014 by increasing thepension liability by $1 million andannual required contribution in 2015by $74,000.
Introduction
The District has the responsibility to manage their financial resources by establishing and followingprudent financial policies and procedures. A summary of the significant financial policies are listedbelow. The district is in compliance with the policies except where noted below. Each policy isdesignated as being adopted by law (District’s Charter, Maine Public Utilities Commission rules), Boardor Management.
Significant Financial Policies
Accounting, Auditing, and Financial Reporting:
Basis of Accounting (Charter)The District maintains its accounting records and reports on itsfinancial conditions and results of operations in accordance withgenerally accepted accounting principles as promulgated by theGovernmental Accounting Standards Board (GAAP). The Districtuses accrual accounting for financial reporting and budgetpreparation (see Budgeting and Financial Planning section fordifference between GAAP and Budget).
Fund Structure (Charter)As required by the District’s charter, seven-supporting enterprisefunds will be maintained – one fund for water service and sixfunds for each of the communities we provide wastewaterservice. Revenues and expenses that are solely for the benefit ofthat fund are allocated directly to the enterprise fund. Enterprisefunds, used for business-like activities, operate on an accrualbasis. The accrual basis of accounting used by enterprise fundsrequires revenue to be recognized when it is earned andexpenses to be recognized when the related benefit is received.
By contract, the District provides billing and meter readingservices to three communities. Related costs are recorded in theappropriate fund.
Costs that benefits more than one funds are recorded in anallocated fund. The balance in each fund is fully allocated to theappropriate enterprise or contracted utility billing funds. A detailexplanation of the allocation methods used is provided onsubsequent pages (see Cost Allocation Policy Detail onsubsequent pages).
Annual Audit (Charter)Annual audit shall be conducted each year by the June 30. The Board of Trustees shall appoint auditor.
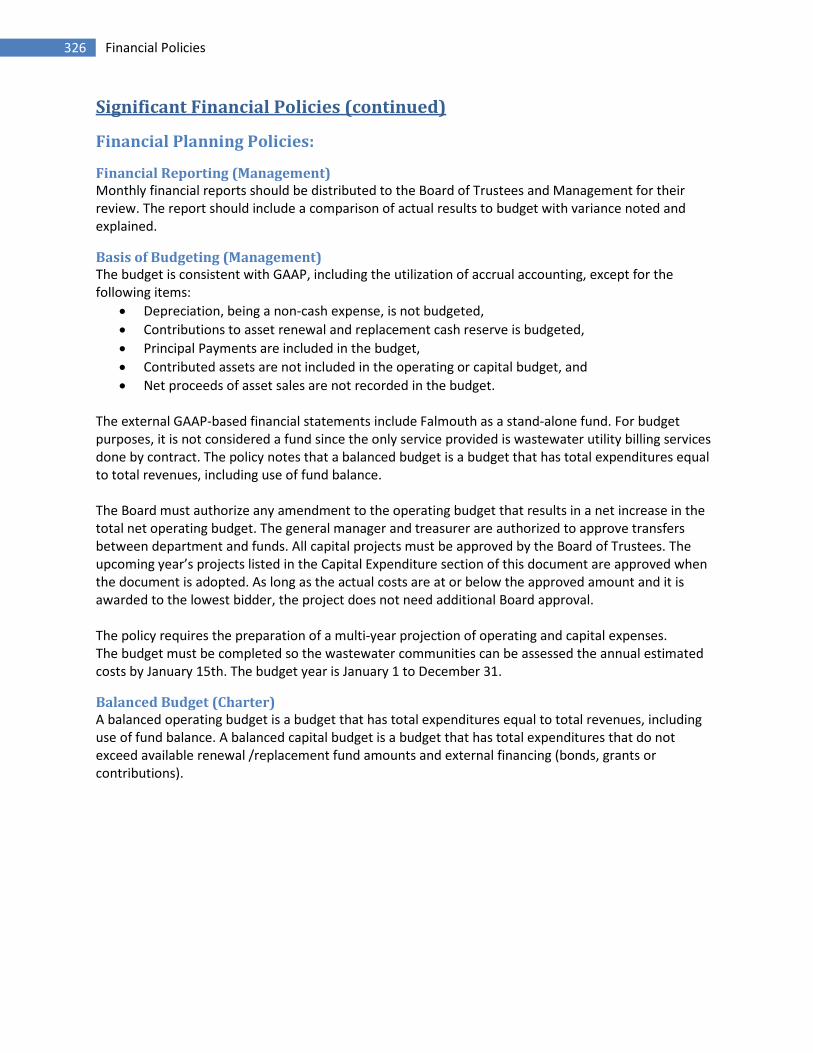
326 Financial Policies
Significant Financial Policies (continued)
Financial Planning Policies:
Financial Reporting (Management)Monthly financial reports should be distributed to the Board of Trustees and Management for theirreview. The report should include a comparison of actual results to budget with variance noted andexplained.
Basis of Budgeting (Management)The budget is consistent with GAAP, including the utilization of accrual accounting, except for thefollowing items:
Depreciation, being a non-cash expense, is not budgeted,
Contributions to asset renewal and replacement cash reserve is budgeted,
Principal Payments are included in the budget,
Contributed assets are not included in the operating or capital budget, and
Net proceeds of asset sales are not recorded in the budget.
The external GAAP-based financial statements include Falmouth as a stand-alone fund. For budgetpurposes, it is not considered a fund since the only service provided is wastewater utility billing servicesdone by contract. The policy notes that a balanced budget is a budget that has total expenditures equalto total revenues, including use of fund balance.
The Board must authorize any amendment to the operating budget that results in a net increase in thetotal net operating budget. The general manager and treasurer are authorized to approve transfersbetween department and funds. All capital projects must be approved by the Board of Trustees. Theupcoming year’s projects listed in the Capital Expenditure section of this document are approved whenthe document is adopted. As long as the actual costs are at or below the approved amount and it isawarded to the lowest bidder, the project does not need additional Board approval.
The policy requires the preparation of a multi-year projection of operating and capital expenses.The budget must be completed so the wastewater communities can be assessed the annual estimatedcosts by January 15th. The budget year is January 1 to December 31.
Balanced Budget (Charter)A balanced operating budget is a budget that has total expenditures equal to total revenues, includinguse of fund balance. A balanced capital budget is a budget that has total expenditures that do notexceed available renewal /replacement fund amounts and external financing (bonds, grants orcontributions).
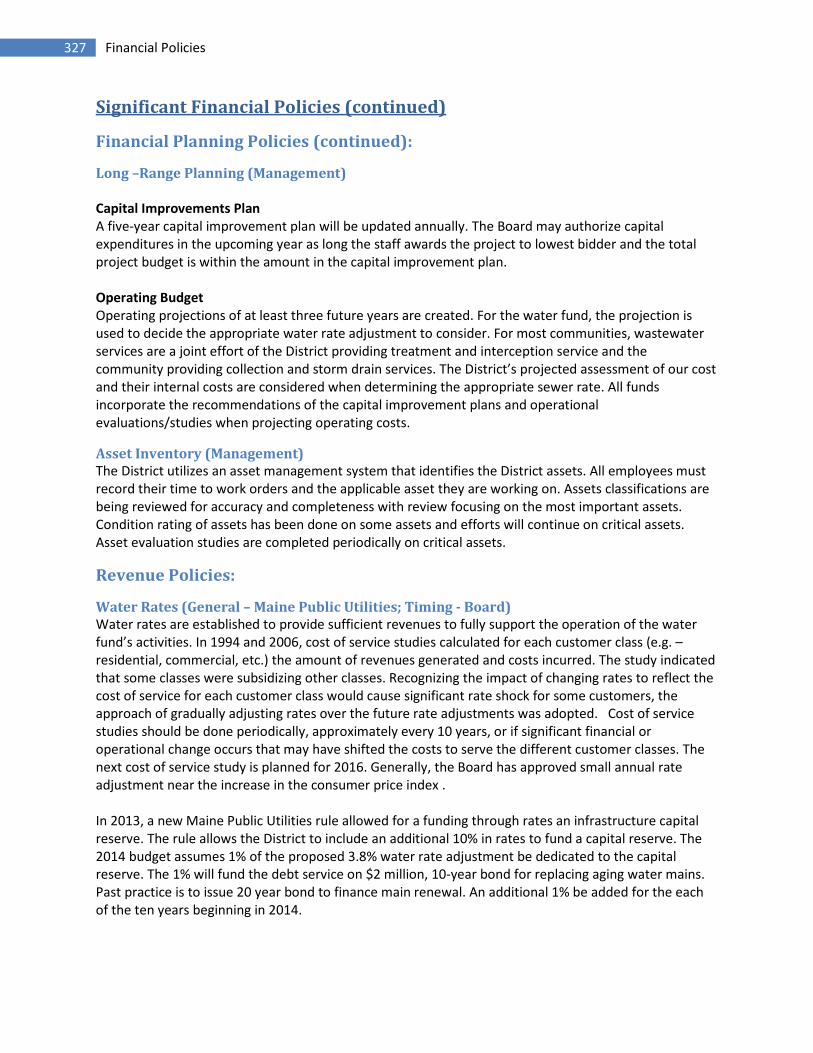
327 Financial Policies
Significant Financial Policies (continued)
Financial Planning Policies (continued):
Long –Range Planning (Management)
Capital Improvements PlanA five-year capital improvement plan will be updated annually. The Board may authorize capitalexpenditures in the upcoming year as long the staff awards the project to lowest bidder and the totalproject budget is within the amount in the capital improvement plan.
Operating BudgetOperating projections of at least three future years are created. For the water fund, the projection isused to decide the appropriate water rate adjustment to consider. For most communities, wastewaterservices are a joint effort of the District providing treatment and interception service and thecommunity providing collection and storm drain services. The District’s projected assessment of our costand their internal costs are considered when determining the appropriate sewer rate. All fundsincorporate the recommendations of the capital improvement plans and operationalevaluations/studies when projecting operating costs.
Asset Inventory (Management)The District utilizes an asset management system that identifies the District assets. All employees mustrecord their time to work orders and the applicable asset they are working on. Assets classifications arebeing reviewed for accuracy and completeness with review focusing on the most important assets.Condition rating of assets has been done on some assets and efforts will continue on critical assets.Asset evaluation studies are completed periodically on critical assets.
Revenue Policies:
Water Rates (General – Maine Public Utilities; Timing - Board)Water rates are established to provide sufficient revenues to fully support the operation of the waterfund’s activities. In 1994 and 2006, cost of service studies calculated for each customer class (e.g. –residential, commercial, etc.) the amount of revenues generated and costs incurred. The study indicatedthat some classes were subsidizing other classes. Recognizing the impact of changing rates to reflect thecost of service for each customer class would cause significant rate shock for some customers, theapproach of gradually adjusting rates over the future rate adjustments was adopted. Cost of servicestudies should be done periodically, approximately every 10 years, or if significant financial oroperational change occurs that may have shifted the costs to serve the different customer classes. Thenext cost of service study is planned for 2016. Generally, the Board has approved small annual rateadjustment near the increase in the consumer price index .
In 2013, a new Maine Public Utilities rule allowed for a funding through rates an infrastructure capitalreserve. The rule allows the District to include an additional 10% in rates to fund a capital reserve. The2014 budget assumes 1% of the proposed 3.8% water rate adjustment be dedicated to the capitalreserve. The 1% will fund the debt service on $2 million, 10-year bond for replacing aging water mains.Past practice is to issue 20 year bond to finance main renewal. An additional 1% be added for the eachof the ten years beginning in 2014.

328 Financial Policies
Significant Financial Policies (continued)
Revenue Policies (continued):
Wastewater Assessment (Charter)Wastewater assessments are established to provide sufficient revenues to support the operation foreach of wastewater funds’ activities. By state law, the municipality must pay the district’s assessment.
Service Fees (General - Maine Public Utilities; Timing - Management)Fees for miscellaneous service should be based on the cost to provide the service. For water relatedfees, the District must file ‘terms and conditions’ (T&C) with the Maine Public Utilities Commission fortheir approval. The T&C includes the fees for any service the District requires customers to obtain fromthe District. The District intends to file updated T&C at least every two years to assure the fees assessedcovers the costs of providing the service. Updated T&C were approved with an effective date of May 1,2014.
Investments (Board)Operating fund investments must be invested with the primary objective, in priority order, of safety,liquidity and yield. Investments should be made in securities that are backed directly or indirectly by thefederal government. Currently, we are in compliance with the policy.
Pension funds’ investments will be primarily invested in a diversified portfolio of equity and debtsecurities within guidelines established in the policy. The policy was revised in 2013 to reduce the bondweight and increase the international equities and alternative weight.
Minimum Target MaximumWeight Weight Weight
US Equities 30% 40% 50%International Equities 10% 25% 30%Bonds 20% 25% 40%Alternatives 0% 10% 15Cash & Equivalents 0% 0% 30%
Use of One-time/Unpredictable Revenue (Board)The District’s Board has established a fund to collect the net proceeds of water land sales. The fund isdedicated to future investment in protecting the watershed land. Unexpected water net income istypically allocated to contingency or rainy day fund. However, the Board considers whether any portionshould be allocated to the watershed land fund. The Board has established a goal of 25% and 15% ofoperating expense for the contingency and watershed land funds, respectively. Unexpected wastewaternet income is retained in the individual funds contingency fund.

329 Financial Policies
Significant Financial Policies (continued)
Expenditure Policies:
Debt (Board)Debt may be issued for capital expenditures only. There is no legal limit for the amount of debt theDistrict can issue. However, the Board has set a maximum target for debt service in any fund to 35% oftotal budget. In addition, operating revenue available for debt service should be at least 125% of theannual debt service. The District is in compliance with the policy with the exception that the Gorhamand Windham wastewater funds are above the 35% limit due to construction of the Little FallsConveyance system in 2009 at the request of the Towns of Windham and Gorham. Debt will not beissued for longer than the useful life of the assets being financed. The average duration of outstandingdebt should be 10 years or less.
Reserve Balances (Board)Each operating fund has a target balance of 25% of annual net operating budget. The Water fundcurrently does not meet the target but is expected to increase its surplus balance to 22.0% by the end of2015. The Wastewater funds meet the operating fund balance target, except for Cape Elizabeth – thefund is projected to be at 22.8%, $30,910 under the target balance, at the end of 2015.
Each fund has a cash reserve fund for the renewal and replacement of fixed assets. The target balancefor the water and wastewater funds are 1% and 3%, respectively, of gross fixed asset costs. The Waterfund meets its goal while the wastewater funds combined are at 95% of the goal. Also, the Water fundhas a target balance of 15% of the annual net operating budget for a watershed land reserve. Currentlythat reserve is at 8.3%.
Capital Expenditures (Board)A capital expenditure is a project with a cost of $10,000 or more and has a useful life greater than threeyears. An exception is made for certain assets annually purchased in bulk that exceed the $10,000amount in a year. For example, individual hydrants, meters and service lines costs less than $10,000 buttotal annual purchases exceed $10,000.
All capital expenditures must be approved by the Board of Trustees. An annual capital improvementplan is reviewed and approved by the Board and provides authorization for capital expenditures as longas the project costs is not exceeded and the lowest bid is accepted. If project cost is anticipated toexceed budget or the lowest bid is not accepted, the Board must specifically authorize. Emergencycapital expenditures must be approved by the General Manager who must inform the Board of theexpenditure.
Purchasing (Board)The policy outlines the requirements for obtaining competitive pricing and the formal bidding processes.It also establishes authorization levels for operating expenses including the requirement that expensesgreater than $50,000 be approved by the Board. Amounts less than $50,000 must be included in theBoard approved budget. We are in compliance with the policy.

330 Financial Policies
Significant Financial Policies (continued)
Expenditure Policies (continued):
Pension Funding Policy (Board)The Board voted to fully fund the District’s defined benefit plan by contributing at least the annualrequired contribution as calculated by the actuary. Because of new accounting rules going into effect in2015, the Board adopted a new pension funding policy effective for 2015. The policy states theDistricts intention to adequately fund the pension plan and contribute at least the actuariallydetermined contribution consistent with assumption used to calculate the pension expense under thenew accounting rule, except to spread out the funding for impact of changes of the benefits negotiatedas part of the three-year union contract over the life of the union contract. The policy states the Districtwill fund $1 million a year, assuming the $1 million is greater than the actuarially determinedcontribution.
Risk Management Policies
Maine Tort Claims Act (State Law)As a public entity, the District's liability for third party tort claims is limited by the provisions of theMaine Tort Claims Act. The Act provides that the District is immune from claims, unless the Act providesa specific exception from immunity. In the District's case, the exception most likely to affect the Districtis one making the District liable for negligent use of machinery and equipment. Should the District beliable for a claim under the provisions of the Act, its liability is capped by the Act at $400,000. Theimmunity provided public entities by the Tort Claims Act help kelps to keep the cost of the District'sinsurance lower, allowing the District to pass this savings to its rate payers.
Property and Liability Insurance (Board)Property and liability insurance is purchased to cover building and personal property losses includinglosses due to flood and earthquakes. Certain liability claims are limited under the Maine Tort Claim Actto $400,000. Board adopted change to limit insurance on claims covered by the Tort Claim Act to the Actlimit.
Safety Program (Management)A full-time safety officer and executive safety team oversee various safety policies including confinedspace entry, electrical safety, ergonomic for video display terminals, fall protection, hazardcommunication and safety commitment policies. A safety incentive policy outlines an employee awardprogram recognizing good safety performance.
Employee Management (Management)A three-person Employee Services department oversees the district’s employee relations managementand practices. Over 60 policies have been created to guide management and employees with one goal ofreducing the District’s risk to losses.
In-House Legal Counsel (Board)In 2006, the Board authorized hiring in-house legal counsel. Legal counsel participate activelyparticipates in overseeing the district’s operation, including reviewing all contracts, and proactivelyidentifying ways to reduce or avoid legal issues.

331 Financial Policies
Cost Allocation Policy Detail
The District has one water fund and six wastewater funds (Cape Elizabeth, Cumberland, Gorham,Portland, Westbrook and Windham). In addition, the District also provides billing and/or meter readingservices to three other municipalities (Falmouth, Scarborough and South Portland).
It is the District’s policy to directly assign expenses to a fund/municipality whenever possible. Howeverthere are some expenses, such as paid time off or work done by administrative personnel, where suchan assignment is not possible. In such cases, an allocation of that cost must be done.
In 1995, the District engaged an outside consultant to review and update its cost allocation process.Since that time, organizational and other changes have necessitated updates and modifications. Thechanges that were made used the guidelines from the 1995 study. The current allocations werereviewed and approved by the District’s current auditors during 2013.
Currently the District uses the following methods to allocate costs:
Customers Served
Direct Labor
General Allocation Percentage
Gross Asset Value
Meter Equivalent Units
Relative Benefits
Square Footage Utilized
A description of each method, the percentages used in the 2015 Budget and the dollars allocated, are ofthe following pages.
Each financial transaction is assigned a cost center number when the transaction is recorded in thefinancial system. The fund number indicates whether it is a ‘direct’ charge to the fund or an ‘indirect’charge that will be allocated. Each department’s costs are broken down into the fund category inOperating Expense section (see pages 136-215). All costs ultimately are assigned to the one of the sevenenterprise funds or three contact billing municipalities.
Fund Description Fund Description10 Allocated to All Direct Funds 56 Gorham Wastewater (Little Falls)20 Water –members 57 Portland Wastewater30 Water –nonmembers 59 South Portland Contacted Billing50 Allocated to All Wastewater Funds 61 Gorham Wastewater (Village)51 Cape Elizabeth Wastewater 62 Westbrook Wastewater53 Cumberland Wastewater 64 Allocated to
Gorham/Westbrook/Windham54 Falmouth Contracted Billing 65 Allocated to Gorham/Windham WW55 Windham Wastewater 66 Portland Wastewater (Peaks Island)

332 Financial Policies
Relation of Functional Units (Departments) to Funds
As expenses are incurred, each department charges a cost center which indicates to what fund theexpenditure belongs. The totals below show how the costs for each department are spread across theorganization. Not surprisingly 98.9% of the costs of the Water Services department are assigned to theWater Fund and 100.0% of the Wastewater Services department costs go the Wastewater funds. Theexpenditures of the remaining departments assign between 60.9% and 74.5% of costs to the WaterFund with the remaining going to the Wastewater funds.
Department Dept Exp Water Cape Eliz Cumber Gorham Portland Westbr Windham Other
Water Services 8,008,811 98.9% 0.1% 0.1% 0.1% 0.4% 0.1% 0.1% 0.2%
Wastewater Services 9,091,655 0.0% 9.0% 6.0% 3.8% 66.2% 13.8% 1.2% 0.0%
Environmental Services 1,899,441 73.4% 1.9% 0.0% 1.1% 17.4% 6.1% 0.1% 0.0%
Engineering Services 4,011,001 74.5% 2.6% 1.2% 2.1% 15.2% 3.8% 0.4% 0.2%
Admistrative Services 5,249,828 60.9% 3.1% 1.7% 2.4% 23.4% 5.6% 0.6% 2.3%
Non-Departmental 361,198 100.0% 0.0% 0.0% 0.0% 0.0% 0.0% 0.0% 0.0%
Departmental Expense 28,621,934
(less) Trans Expense (898,062)
Operating Expense 27,723,872
0% 20% 40% 60% 80% 100%
Non-Departmental
AdminstrativeServices
EngineeringServices
EnvironmentalServices
WastewaterServices
Water Services
Water
Cape Eliz
Cumberland
Gorham
Portland
Westbrook
Windham
Other

333 Financial Policies
Customers Served
This method determines the ratio of customers per fund to the total number of customers served basedon the average total number of water and sewer customers.
The costs for Customer Service have three different allocations (general, billing and meter reading costs)that vary slightly. Falmouth has flat billings for their sewer customers; therefore their general needs arelimited (compared with sewer bills based on usage) and they do not utilize meter reading data. Inaddition, Scarborough does its own billing and payment processing utilizing the District’s meter readingdata, thus they have no general or billing expenses.
Sub-Groups Using Method:
F1 – Customer ServiceH1 – Financial Services (payment processing)
2015 Alloc. %: 2014 Alloc. %:
General BillingMtr
Read Pymts General BillingMtr
Read Pymts
F1 F1 F1 H1 F1 F1 F1 H1
Water 67.29% 67.43% 68.79% 65.79% Water 67.23% 67.47% 68.84% 65.83%
Cape Eliz 2.15% 2.05% 2.05% 2.15% Cape Eliz 2.15% 2.05% 2.05% 2.15%
Cumberland 1.00% 1.00% 1.00% 1.05% Cumberland 1.00% 0.96% 0.96% 1.00%
Falmouth 0.37% 1.72% 0.00% 1.81% Falmouth 0.36% 1.74% 0.00% 1.83%
Gorham 1.54% 1.50% 1.50% 1.57% Gorham 1.54% 1.47% 1.47% 1.54%
Portland 16.04% 15.25% 15.25% 16.03% Portland 16.10% 15.26% 15.26% 16.04%
Scarborough 0.00% 0.00% 0.36% 0.00% Scarborough 0.00% 0.00% 0.37% 0.00%
So Portland 7.36% 7.01% 7.01% 7.36% So Portland 7.39% 7.00% 7.00% 7.36%
Westbrook 4.20% 3.99% 3.99% 4.19% Westbrook 4.18% 4.00% 4.00% 4.20%
Windham 0.05% 0.05% 0.05% 0.05% Windham 0.05% 0.05% 0.05% 0.05%
100.00% 100.00% 100.00% 100.00% 100.00% 100.00% 100.00% 100.00%
Dollars Alloc. : Dollars Alloc. :
General BillingMtr
Read Pymts General BillingMtr
Read Pymts
F1 F1 F1 H1 F1 F1 F1 H1
Water $662,372 $204,550 $48,766 $107,988 Water $569,464 $208,557 $59,690 $101,219
Cape Eliz 21,164 6,219 1,453 3,529 Cape Eliz 18,211 6,337 1,778 3,306
Cumberland 9,844 3,034 709 1,723 Cumberland 8,470 2,967 832 1,538
Falmouth 3,642 5,218 0 2,971 Falmouth 3,049 5,379 0 2,814
Gorham 15,159 4,550 1,063 2,577 Gorham 13,044 4,544 1,275 2,368
Portland 157,891 46,261 10,811 26,312 Portland 136,373 47,170 13,232 24,663
Scarborough 0 0 255 0 Scarborough 0 0 321 0
So Portland 72,449 21,265 4,969 12,081 So Portland 62,596 21,638 6,070 11,317
Westbrook 41,343 12,104 2,829 6,878 Westbrook 35,406 12,364 3,468 6,458
Windham 491 152 35 82 Windham 425 155 43 77
$984,355 $303,352 $70,891 $164,141 $847,038 $309,110 $86,708 $153,758

334 Financial Policies
Direct Labor
This method calculates the ratio of labor dollars directly charged by the area to specific funds.
Sub-Groups Using Method:
B1 – Wastewater AdministrationB3 – East End (Portland) Wastewater TreatmentB4 – Westbrook Regional (including Gorham &Windham), Cape Elizabeth, Peaks Island(Portland) Wastewater Treatment
C1 – Facilities ServicesE3 – New Mains & ConstructionE7 – Instrumentation (general wastewater)L6 – LaboratoryL9 – Water/Wastewater Systems
2015 Allocation %: B1 B3 B4 C1 E7 L6 L9
Water 0.00% 0.00% 0.00% 78.28% 0.00% 37.85% 0.00%
Cape Elizabeth 10.74% 3.11% 17.33% 2.73% 10.74% 4.65% 10.74%
Cumberland 3.13% 0.00% 0.00% 0.42% 3.13% 0.00% 3.13%
Gorham 4.58% 0.62% 8.12% 1.10% 4.58% 2.54% 4.58%
Portland 65.74% 92.11% 20.17% 14.23% 65.74% 40.21% 65.74%
Westbrook 14.25% 4.05% 52.94% 3.17% 14.25% 14.47% 14.25%
Windham 1.56% 0.11% 1.44% 0.07% 1.56% 0.28% 1.56%
100.00% 100.00% 100.00% 100.00% 100.00% 100.00% 100.00%
Dollars Allocated: B1 B3 B4 C1 E7 L6 L9
Water $0 $0 $0 $132,566 $0 $109,197 $0
Cape Elizabeth 18,539 8,329 17,726 4,623 6,249 13,415 53,975
Cumberland 5,403 0 0 711 1,821 0 15,730
Gorham 7,906 1,660 8,306 1,863 2,665 7,328 23,017
Portland 113,479 246,679 20,631 24,098 38,248 116,006 330,384
Westbrook 24,598 10,846 54,151 5,368 8,291 41,746 71,615Windham 2,692 274 1,326 30 1,170 745 6,269
$172,617 $267,809 $102,287 $169,349 $58,181 $288,500 $502,561
2014 Allocation %: B1 B3 B4 C1 E7 L6 L9
Water 0.00% 0.00% 0.00% 71.91% 0.00% 36.26% 0.00%
Cape Elizabeth 11.14% 4.11% 17.62% 2.50% 11.14% 5.00% 11.14%
Cumberland 3.05% 0.00% 0.00% 0.52% 3.05% 0.00% 3.05%
Gorham 5.66% 0.73% 8.55% 1.90% 5.66% 3.00% 5.66%
Portland 63.97% 90.66% 21.34% 18.96% 63.97% 40.70% 63.97%
Westbrook 14.40% 4.38% 51.09% 4.12% 14.40% 14.77% 14.40%
Windham 1.78% 0.12% 1.40% 0.09% 1.78% 0.27% 1.78%
100.00% 100.00% 100.00% 100.00% 100.00% 100.00% 100.00%
Dollars Allocated: B1 B3 B4 C1 E7 L6 L9
Water $0 $0 $0 $92,137 $0 $87,299 $0
Cape Elizabeth 17,956 11,202 19,753 3,203 6,452 12,038 52,061
Cumberland 4,916 0 0 666 1,767 0 14,254
Gorham 9,123 1,990 9,585 2,434 3,278 7,223 26,451
Portland 103,111 247,107 23,923 24,293 37,051 97,989 298,954
Westbrook 23,211 11,938 57,273 5,279 8,340 35,560 67,296Windham 2,869 327 1,569 116 1,031 649 8,319
$161,186 $272,564 $112,103 $128,128 $57,919 $240,758 $467,335

335 Financial Policies
General Allocation Percentage
The ratio is calculated by determining each fund’s operating budget (total expenditures lessother/interest income) as a percentage to the total operating budget.
Sub-Groups Using Method:
E7 – InstrumentationG1 – Information Service
H1 – Financial ServicesI1 – Employee Services
J1 – General Manager’sOffice
2014 Allocation %: E7 G1 H1 I1 J1
Water 54.61% 54.61% 54.61% 54.61% 54.61%
Cape Elizabeth 3.67% 3.67% 3.67% 3.67% 3.67%
Cumberland 2.12% 2.12% 2.12% 2.12% 2.12%
Gorham 2.93% 2.93% 2.93% 2.93% 2.93%
Portland 29.05% 29.05% 29.05% 29.05% 29.05%
Westbrook 6.69% 6.69% 6.69% 6.69% 6.69%
Windham 0.93% 0.93% 0.93% 0.93% 0.93%
100.00% 100.00% 100.00% 100.00% 100.00%
Dollars Allocated: E7 G1 H1 I1 J1
Water $83,866 $533,771 $428,469 $244,322 $786,796
Cape Elizabeth 5,636 35,871 28,795 16,419 52,876
Cumberland 3,256 20,721 16,633 9,485 30,544
Gorham 4,500 28,638 22,989 13,109 42,214
Portland 44,613 283,941 227,926 129,968 418,539
Westbrook 10,274 65,390 52,490 29,931 96,386
Windham 1,428 9,091 7,296 4,161 13,399
$153,573 $977,423 $784,598 $447,395 $1,440,754
2014 Allocation %: E7 G1 H1 I1 J1
Water 54.57% 54.57% 54.57% 54.57% 54.57%
Cape Elizabeth 3.65% 3.65% 3.65% 3.65% 3.65%
Cumberland 1.99% 1.99% 1.99% 1.99% 1.99%
Gorham 3.02% 3.02% 3.02% 3.02% 3.02%
Portland 28.86% 28.86% 28.86% 28.86% 28.86%
Westbrook 6.95% 6.95% 6.95% 6.95% 6.95%
Windham 0.96% 0.96% 0.96% 0.96% 0.96%
100.00% 100.00% 100.00% 100.00% 100.00%
Dollars Allocated: E7 G1 H1 I1 J1
Water $72,934 $536,616 $418,594 $229,896 $764,839
Cape Elizabeth 4,878 35,892 27,998 15,377 51,157
Cumberland 2,660 19,569 15,265 8,384 27,891
Gorham 4,036 29,697 23,166 12,723 42,328
Portland 38,572 283,796 221,378 121,583 404,494
Westbrook 9,289 68,343 53,312 29,279 97,409
Windham 1,283 9,440 7,364 4,044 13,456
$133,652 $983,353 $767,077 $421,286 $1,401,574

336 Financial Policies
Gross Asset Value
The allocation percentage is each fund's gross (fixed) asset value as a ratio to all gross assets. Costsallocated include those that involve all District assets (All) or in some cases only wastewater assets(WW). The same asset values are used in both calculations except that the Water assets are removedfor the wastewater calculations.
Sub-Group Using Method:
E2 – Planning and Design
All WW All WW
Water 63.08% 0.00% Water 62.31% 0.00%
Cape Elizabeth 3.56% 9.65% Cape Elizabeth 3.68% 9.76%
Cumberland 1.75% 4.75% Cumberland 1.81% 4.81%
Falmouth 0.00% 0.00% Falmouth 0.00% 0.00%
Gorham 3.95% 10.71% Gorham 3.94% 10.46%
Portland 22.42% 60.71% Portland 22.76% 60.39%
Westbrook 4.57% 12.37% Westbrook 4.80% 12.73%
Windham 0.67% 1.81% Windham 0.70% 1.85%
100.00% 100.00% 100.00% 100.00%
Dollars Allocated: Dollars Allocated:
All WW All WW
Water $523,256 $0 Water $506,061 $0
Cape Elizabeth 29,531 21,531 Cape Elizabeth 29,888 22,306
Cumberland 14,516 10,598 Cumberland 14,700 10,993
Falmouth 0 0 Falmouth 0 0
Gorham 32,766 23,896 Gorham 31,999 23,906
Portland 185,976 135,457 Portland 184,849 138,020
Westbrook 37,909 27,600 Westbrook 38,984 29,094
Windham 5,557 4,040 Windham 5,685 4,229
$829,511 $223,122 $812,166 $228,548

337 Financial Policies
Meter Equivalent Units
This calculation takes each meter and assigns a weight based on its size to determine a value of meterservice provided to each fund.
Sub-Group Using Method:
A6 – Utility Services (meter service)
2015 Allocation %: 2014 Allocation %:
A6 A6
Water 65.54% Water 65.56%
Cape Elizabeth 1.77% Cape Elizabeth 1.77%
Cumberland 0.88% Cumberland 0.88%
Gorham 1.48% Gorham 1.46%
Portland 17.34% Portland 17.34%
Scarborough 1.14% Scarborough 1.15%
South Portland 7.65% South Portland 7.64%
Westbrook 4.12% Westbrook 4.12%
Windham 0.08% Windham 0.08%
100.00% 100.00%
Dollars Allocated: Dollars Allocated:
A6 A6
Water $92,586 Water $90,842
Cape Elizabeth 2,500 Cape Elizabeth 2,453
Cumberland 1,243 Cumberland 1,219
Gorham 2,091 Gorham 2,023
Portland 24,496 Portland 24,027
Scarborough 1,610 Scarborough 1,593
South Portland 10,807 South Portland 10,586
Westbrook 5,820 Westbrook 5,709
Windham 113 Windham 111
$141,266 $138,563

338 Financial Policies
Relative Benefits
This method of allocation is based upon management's assessment of the benefit received by thedepartments and funds from the areas providing the service. Customer Service (control/dispatch)allocation assumes most work (95%) will involve the Water fund; the remaining dollars are allocated towastewater funds based on the number of pump stations in each community. The Laboratorywastewater split was determined by the number of tests run for each community.
Sub-Groups Using Method:
F1 – Customer Service (control/dispatch center)L6 – Laboratory (general wastewater)
2015 Allocation %: 2014 Allocation %:
F1 L6 F1 L6
Water 95.00% 0.00% Water 95.00% 0.00%
Cape Elizabeth 1.79% 9.30% Cape Elizabeth 1.89% 9.65%
Cumberland 0.94% 0.00% Cumberland 0.90% 0.00%
Gorham 0.81% 3.30% Gorham 0.68% 3.40%
Portland 1.02% 66.93% Portland 1.07% 66.13%
Westbrook 0.18% 19.90% Westbrook 0.19% 20.30%
Windham 0.26% 0.57% Windham 0.27% 0.52%
100.00% 100.00% 100.00% 100.00%
Dollars Allocated: Dollars Allocated:
F1 L6 F1 L6
Water $168,813 $0 Water $206,319 $0
Cape Elizabeth 3,181 20,878 Cape Elizabeth 4,105 24,109
Cumberland 1,670 0 Cumberland 1,955 0
Gorham 1,439 7,408 Gorham 1,477 8,494
Portland 1,813 150,254 Portland 2,324 165,218
Westbrook 320 44,674 Westbrook 413 50,717
Windham 462 1,280 Windham 585 1,300
$177,698 $224,494 $217,178 $249,838

339 Financial Policies
Square Footage Utilized
The costs of the Douglass Street administrative facility are charged to each area based of the squarefootage they occupy. Office space is charged out at a higher rate (five times higher) than warehousespace. The dollars are allocated to the sub-groups.
Overall costs were relatively flat with costs decreasing $26,183 (3.2%)
2015 Allocation %: 2014 Allocation %:
Water Operations Water Operations
A1 - Water Administration 2.67% A1 - Water Administration 2.68%
A2 - Transmission/Distribution 4.56% A2 - Transmission/Distribution 4.56%
A6 - Utility Services 1.41% A6 - Utility Services 1.41%
8.64% 8.65%
Environmental Services Environmental Services
A5 - Water Resources 0.83% A5 - Water Resources 0.83%
0.83% 0.83%
Wastewater Operations Wastewater Operations
B1 - WW Administration 0.83% B1 - WW Administration 0.83%
L9 - Water/WW Systems 4.59% L9 - Water/WW Systems 4.60%
5.42% 5.43%
Engineering Services Engineering Services
C1 - Facility Services 23.54% C1 - Facility Services 23.57%
E2 - Planning & Design 15.09% E2 - Planning & Design 15.89%
E7 - Instrumentation 1.37% E7 - Instrumentation 1.37%
40.00% 40.83%
Administration Administration
F1 - Customer Service 12.10% F1 - Customer Service 11.23%
G1 - Information Services 6.42% G1 - Information Services 6.42%
H1 - Financial Services 8.61% H1 - Financial Services 8.62%
I1 - Employee Services 3.96% I1 - Employee Services 3.96%
J1 - BOT & Senior Management 14.02% J1 - BOT & Senior Management 14.03%
45.11% 44.26%
100.00% 100.00%
Dollars Allocated: Dollars Allocated:
$ $
Water Operations $69,102 Water Operations $66,917
Environmental Services 6,638 Environmental Services 6,421
Wastewater Operations 43,348 Wastewater Operations 42,007
Engineering Services 319,916 Engineering Services 315,863
Administration 360,785 Administration 342,398
$799,789 $773,606

340 Financial Policies
Vehicle Rates
Internal Transportation costs are charges the departments receive for the availability of District ownedvehicles. Each type of vehicle and piece of equipment has an assigned hourly rate. Most vehicles arecharged for 40 hours per week. Charges are either assigned directly to the task or to a “stand-by”account and later allocated. Transportation costs represent the expense of operating the garage andinclude labor, materials, occupancy and depreciation.
Overall costs were up 0.4% with most budget items remaining stable including fuel.
Vehicle Type Rate Active Hours Stand-by Hours Total Hours
Backhoe/Loader <19,501 GVW $40.43 3,016 - 3,016
Backhoe/Loader >=19,500 GVW $46.55 128 - 128
Car $3.84 350 - 350
Compressor $24.50 2,448 - 2,448
Dump Truck < 15,000 GVW $10.33 470 1,610 2,080
Dump Truck >= 40,000 GVW $17.72 3,207 3,033 6,240
Dump Truck 15,001- 40,000 GVW $13.28 1,912 6,408 8,320
Generator/Load Bank $41.66 304 - 304
Misc. Const. Equipment - Forklif t, etc. $28.18 520 - 520
Misc. Trailed Equipment $18.38 226 - 226
Pick-up Truck/SUV - Heavy - 7,501-10,000 GVW $5.02 7,622 9,243 16,865
Pick-up Truck/SUV - Light - < 6,000 GVW $3.84 2,791 3,449 6,240
Pick-up Truck/SUV - Medium - 6,001-7,500 GVW $4.13 12,224 19,526 31,750
Special Purpose - C - Crane, Sludge, etc. $55.13 75 - 75
Special Purpose - D - Jetvac, etc. $73.51 1,220 - 1,220
Utility Truck 10,001 - 14,000 GVW $5.91 4,228 2,012 6,240
Utility Truck 14,001 - 16,000 GVW $6.49 4,377 3,943 8,320
Utility Truck 16,001 - 19,500 GVW $7.08 6,570 4,240 10,810
Utility Truck 6,001 - 10,000 GVW $4.13 7,100 7,460 14,560
Van < 6,000 GVW $3.84 3,565 2,675 6,240
Van 6,001-7,500 GVW $4.13 1,360 720 2,080
Van 7,501-10,000 GVW $5.02 32,480 9,120 41,600
Total Hours 96,193 73,439 169,632
Sub-Group 2014 Budget 2015 Budget $ - Difference % - Difference
A1 - Water Administration $599 $496 ($103) -17.2%
A2 - Transmission/Distribution 553,336 571,827 18,491 3.3%
A3 - Water Treatment 38,002 37,280 (722) -1.9%
A5 - Water Resources 40,856 39,948 (908) -2.2%
A6 - Utility Services 166,372 164,569 (1,803) -1.1%
B1 - WW Administration 0 0 0 #DIV/0!
B3 - Portland (East End) WWTF 86,015 36,222 (49,793) -57.9%
B4 - Westbrook/Cape/Peaks WWTP's 29,833 29,472 (361) -1.2%
C1 - Facility Services 49,813 72,650 22,837 45.8%
E2 - Planning & Design 30,447 31,745 1,298 4.3%
E7 - Instrumentation 26,056 25,175 (881) -3.4%
F1 - Customer Service 17,371 17,189 (182) -1.0%
I1 - Employee Services 762 0 (762) -100.0%
J1 - BOT & Senior Management 0 0 0 #DIV/0!
L6 - Water/WW Laboratory 772 1,199 427 55.4%
L9 - Water/WW Systems 233,473 250,695 17,222 7.4%
$1,273,706 $1,278,467 $4,761 0.4%

341 Financial Policies
Joint Use Facilities – Operations and Maintenance Allocations
The District has two areas where wastewater flows from more than one community are combined.Costs associated with these combinations are allocated by the percentage of the flow contributed byeach community. The areas of combined flow are:
Portland Water District Facilities:
Westbrook Regional – All of the wastewater from Gorham, Westbrook and Windham is treated atWestbrook Regional Wastewater Treatment Facility. In addition, one pump station handles thecombined waste from all three communities. The budget for this area in 2015 is $1,134,864 (up 2.2%).
Little Falls –The Little Falls areas of Gorham and Windham used to be a self-contained system with itsown small treatment facility. Starting in 2008, wastewater from this area was conveyed to theWestbrook Regional Wastewater Treatment Facility. As it is presently constituted, wastewater fromWindham moves into Gorham where it is combined with that community’s flow until it joins with theWestbrook flow at the Westbrook town line. This area’s budget is $53,729 in 2015, up 14.2% ($6,666)due to a new expenditure of $7,000 for CCTV inspection of sewer lines.
Gorham Westbrook Windham Gorham Windham
2011 11.0% 86.7% 2.3% 15.0% 85.0%
2012 13.0% 84.7% 2.3% 15.0% 85.0%
2013 13.0% 84.7% 2.3% 15.0% 85.0%
2014 14.0% 83.7% 2.3% 15.0% 85.0%
2015 13.0% 84.7% 2.3% 20.0% 80.0%
-------- Westbrook Regional -------- ------ Little Falls ------
Contracted Services Facilities:
South Portland – All of the wastewater from the Northern portion of Cape Elizabeth is treated at theSouth Portland Treatment Facility through a contractual agreement. Charges to the District arebudgeted to be $158,026 in 2015 (an increase of $1,754).
Falmouth – All of the wastewater from Cumberland is treated at the Falmouth Treatment Facilitythrough a contractual agreement. This cost is budgeted to be $355,531 in 2015.
Cape Eliz So Portland Cumberland Falmouth Millcreek PS
2011 6.7% 93.3% 24.0% 76.0% 0.0%
2012 6.7% 93.3% 27.0% 73.0% 0.0%
2013 6.7% 93.3% 24.0% 76.0% 40.8%
2014 6.7% 93.3% 24.0% 76.0% 40.8%
2015 6.7% 93.3% 24.0% 76.0% 40.8%
----- South Portland ----- ------------------ Falmouth ------------------
Note: Starting in 2013 Millcreek Pump Station (PS) costs were be allocated to Cumberland at the
specific rate above whereas in prior years it was allocated based on the Cumberland flow ratio.

342 Financial Policies
Joint Use Facilities – Capital Cost Sharing Allocations
The District has two areas where wastewater flows from more than one community are combined.Costs associated with these combinations are allocated by the percentage of the design flowcontributed by each community. The areas of combined flow are:
Portland Water District Facilities:
Westbrook Regional – All of the wastewater from Gorham, Westbrook and Windham is treated atWestbrook Regional Wastewater Treatment Facility. In addition, one pump station handles thecombined waste from all three communities.
System Westbrook Gorham Windham Total Westbrook Gorham Windham
Southside Interceptor above Manhole
60
0.16 1.06 0.12 1.34 12.0% 79.1% 9.0%
Manhole 60 up to and including
Siphon
5.00 1.06 0.12 6.18 81.0% 17.2% 1.9%
Cottage Place Pumping Station &
Force Main
2.12 0.70 0.06 2.88 73.7% 24.3% 2.1%
Westbrook Regional WWTF & Outfall 3.02 1.40 0.12 4.54 66.6% 30.8% 2.6%
--- Millions of Gallons/Day (MGD) --- ----- Flow Percentage -----
Little Falls –The Little Falls areas of Gorham and Windham used to be a self-contained system with itsown small treatment facility. Starting in 2008, wastewater from this area was conveyed to theWestbrook Regional Wastewater Treatment Facility. As it is presently constituted, wastewater fromWindham moves into Gorham where it is combined with that community’s flow until it joins with theWestbrook flow at the Westbrook town line.
Facility Name Gorham Windam Total Gorham Windam
Gray Rd/Mallison St Gravity Sew er 63,500 53,500 117,000 54.3% 45.7%
Mallison St Pump Station (PS)/Flow Meter
(FM)
84,000 100,000 184,000 45.6% 54.4%
Mosher Rd Gravity Sew er 145,000 100,000 245,000 59.2% 40.8%
Little River PS/FM 222,500 100,000 322,500 69.0% 31.0%
Mosher Rd & Cross Country Gravity
Sew er
638,000 100,000 738,000 86.4% 13.6%
Industrial Park Gravity Sew er Upgrade 2,105,000 100,000 2,205,000 95.5% 4.5%
Woodlaw n Ave PS (Tow Path Rd)
effective 2008
- - - 100.0% 0.0%
Fire Station (Route 202) PS - - - 0.0% 100.0%
Androscoggin St PS - - - 0.0% 100.0%
-------- Gallons/Day -------- -- Flow Percent --

343 Financial Policies
Contracted Services Facilities:
South Portland – All of the wastewater from the Northern portion of Cape Elizabeth is treated at theSouth Portland Treatment Facility through a contractual agreement.
Facility Name Cape Eliz So Portland Total Cape Eliz So Portland
Treatment Plant 0.716 8.584 9.300 7.7% 92.3%
Note: In Cape Elizabeth 1/13th of average design flow = 7.7% per Sew er Service Agreement dated 08/11/93.
--- Millions Gallons/Day (MGD) --- ----- Flow Percentage -----
Falmouth – All of the wastewater from Cumberland is treated at the Falmouth Treatment Facilitythrough a contractual agreement.
Facility Name Cumberland Falmouth Total Cumberland Falmouth
Route 88 Interceptor - Tow n
Line to Millcreek PS
1.790 1.007 2.797 64.0% 36.0%
Millcreek PS & Force Main 1.076 1.998 3.074 35.0% 65.0%
Millcreek Interceptor 2.030 1.595 3.625 55.5% 44.5%
Treatment Facility (average
design flow )
0.468 1.092 1.560 30.0% 70.0%
Cumberland Route 1 Sew er
Extension to Johnson Rd PS
0.144 0.490 0.634 22.7% 77.3%
Existing Sew ers & Mains -
Johnson Rd to Millcreek
Interceptors
0.144 0.216 0.360 40.0% 60.0%
Johnson Road PS (gallons
pumped per minute)
100 150 250 40.0% 60.0%
* = Peak flow unless noted otherwise
Millions of Gallons/Day (MGD)* ----- Flow Percentage -----

344 Financial Policies
Defined Pension Plan’s Funding Policy
The Board adopted a funding policy for the District’s Pension Obligation. The District has two plans – anon-bargaining and bargaining unit plan. The plans are now closed to new employees. The graph belowindicates the estimated pension payment outflows, projected investment returns and annualcontributions. The funding policy was adopted in anticipation of the new accounting rule (GASB 68),which goes into effect in 2015.
$(4,000,000)
$(3,000,000)
$(2,000,000)
$(1,000,000)
$-
$1,000,000
$2,000,000
$3,000,000
$4,000,000
20
14
20
18
20
22
20
26
20
30
20
34
20
38
20
42
20
46
20
50
20
54
20
58
20
62
20
66
20
70
20
74
20
78
20
82
20
86
20
90
20
94
20
98
Pension Plans' Future Funding and Obligations
Outflow
Investment Returns
Contribution
Assets as of 7/1/13 $15,982,657
Obligation as of 7/1/13 $20,343,479

345 Appendix
IntroductionThe appendix contains the following:
• Employee Recognition
• Community Connections
• Portland Economic Scorecard – Selected Detail charts
• Water Benchmark Data
• Customer Satisfaction Survey
• Board of Trustees’ Orders and Resolutions
• Glossary
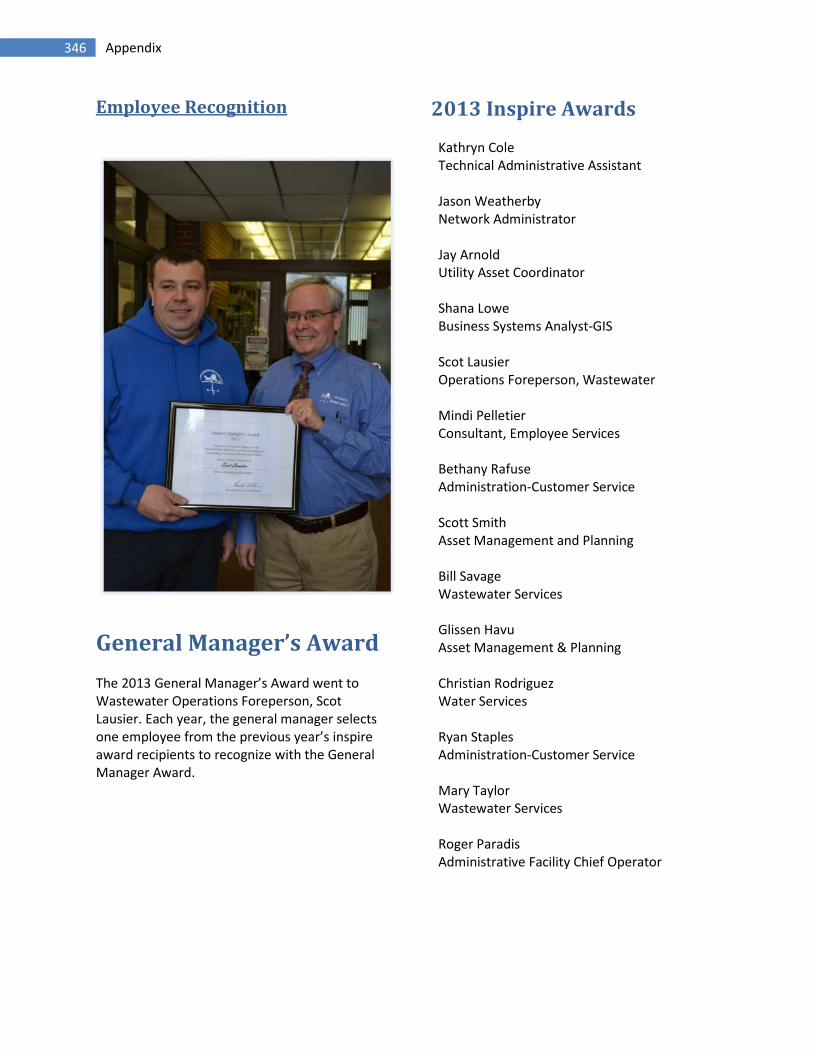
346 Appendix
Employee Recognition
General Manager’s Award
The 2013 General Manager’s Award went toWastewater Operations Foreperson, ScotLausier. Each year, the general manager selectsone employee from the previous year’s inspireaward recipients to recognize with the GeneralManager Award.
2013 Inspire Awards
Kathryn ColeTechnical Administrative Assistant
Jason WeatherbyNetwork Administrator
Jay ArnoldUtility Asset Coordinator
Shana LoweBusiness Systems Analyst-GIS
Scot LausierOperations Foreperson, Wastewater
Mindi PelletierConsultant, Employee Services
Bethany RafuseAdministration-Customer Service
Scott SmithAsset Management and Planning
Bill SavageWastewater Services
Glissen HavuAsset Management & Planning
Christian RodriguezWater Services
Ryan StaplesAdministration-Customer Service
Mary TaylorWastewater Services
Roger ParadisAdministrative Facility Chief Operator
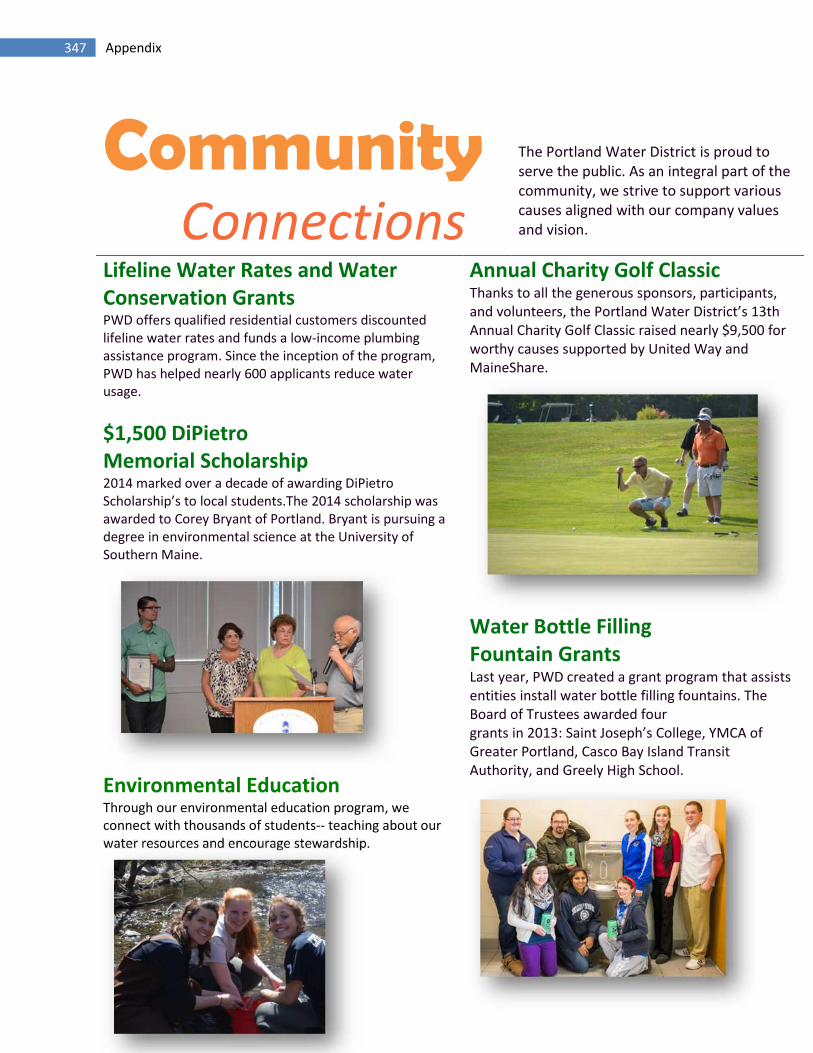
347 Appendix
CommunityConnections
The Portland Water District is proud toserve the public. As an integral part of thecommunity, we strive to support variouscauses aligned with our company valuesand vision.
Lifeline Water Rates and WaterConservation GrantsPWD offers qualified residential customers discountedlifeline water rates and funds a low-income plumbingassistance program. Since the inception of the program,PWD has helped nearly 600 applicants reduce waterusage.
$1,500 DiPietroMemorial Scholarship2014 marked over a decade of awarding DiPietroScholarship’s to local students.The 2014 scholarship wasawarded to Corey Bryant of Portland. Bryant is pursuing adegree in environmental science at the University ofSouthern Maine.
Environmental EducationThrough our environmental education program, weconnect with thousands of students-- teaching about ourwater resources and encourage stewardship.
Annual Charity Golf ClassicThanks to all the generous sponsors, participants,and volunteers, the Portland Water District’s 13thAnnual Charity Golf Classic raised nearly $9,500 forworthy causes supported by United Way andMaineShare.
Water Bottle FillingFountain GrantsLast year, PWD created a grant program that assistsentities install water bottle filling fountains. TheBoard of Trustees awarded fourgrants in 2013: Saint Joseph’s College, YMCA ofGreater Portland, Casco Bay Island TransitAuthority, and Greely High School.

348 Appendix
Portland Economic Scorecard
The Portland Community Chamber issued ‘Portland’s Economic Scorecard 2014’ to help understand howPortland is performing economically. A summary table is in the Introduction. Some of the details arelisted below.
Why is this significance to Portland Water District?Limited employment growth will limit growth in new customers result in any cost interest borne byexisting customers.

349 Appendix
Portland Economic Scorecard (continued)
Why is this significance to Portland Water District?Because relatively more customer retained their jobs, the impact on the District’s ability to collect waterrevenue was less than others. The District did see a reduced level of efforts in dealing with delinquentaccounts in the past year.

350 Appendix
Portland Economic Scorecard (continued)
Why is this significance to Portland Water District?Limited population growth in new customers result in any cost interest borne by existing customers. Likeother areas, the population is also aging. This will most likely cause household size, and thus averagehousehold water consumption, to decline.
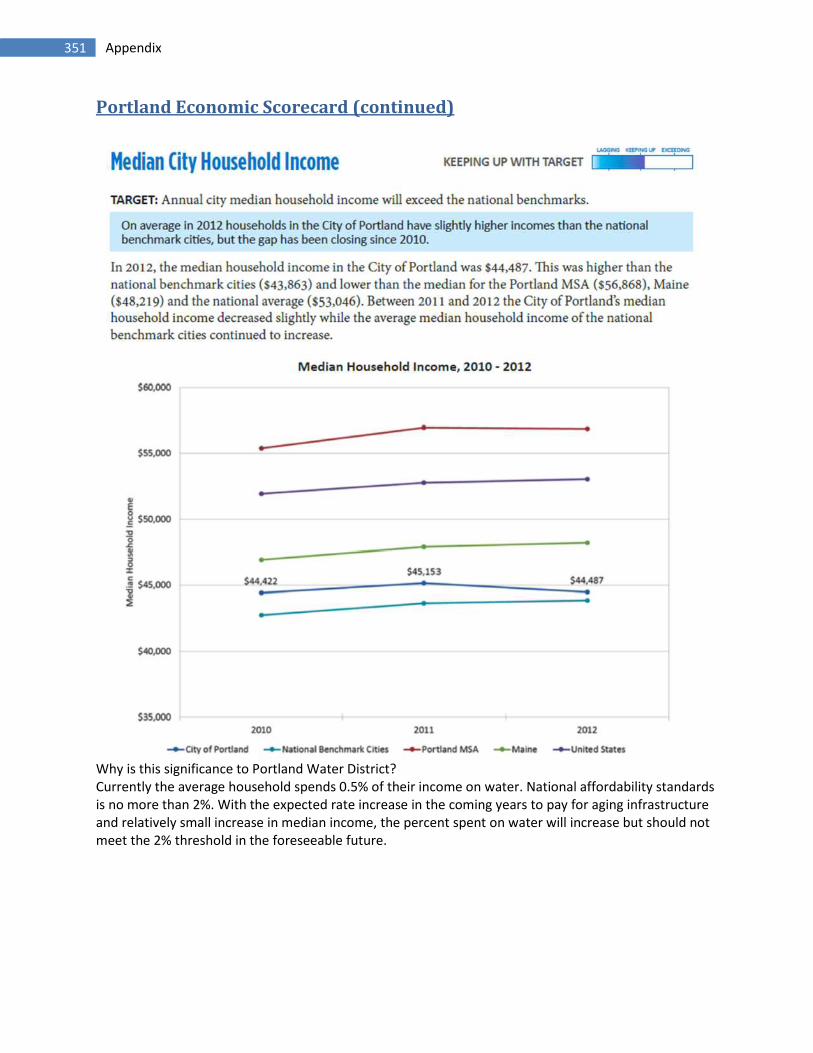
351 Appendix
Portland Economic Scorecard (continued)
Why is this significance to Portland Water District?Currently the average household spends 0.5% of their income on water. National affordability standardsis no more than 2%. With the expected rate increase in the coming years to pay for aging infrastructureand relatively small increase in median income, the percent spent on water will increase but should notmeet the 2% threshold in the foreseeable future.

352 Appendix
Portland Economic Scorecard (continued)
Why is this significance to Portland Water District?High education attainment may allow Portland to continue to perform better economically that otherareas in the State.

353 Appendix
Portland Economic Scorecard (continued)
Why is this significant to Portland Water District?Heating, real estate tax, sewer fees and other housing costs will make customers less able or willing toafford future water rate increases.
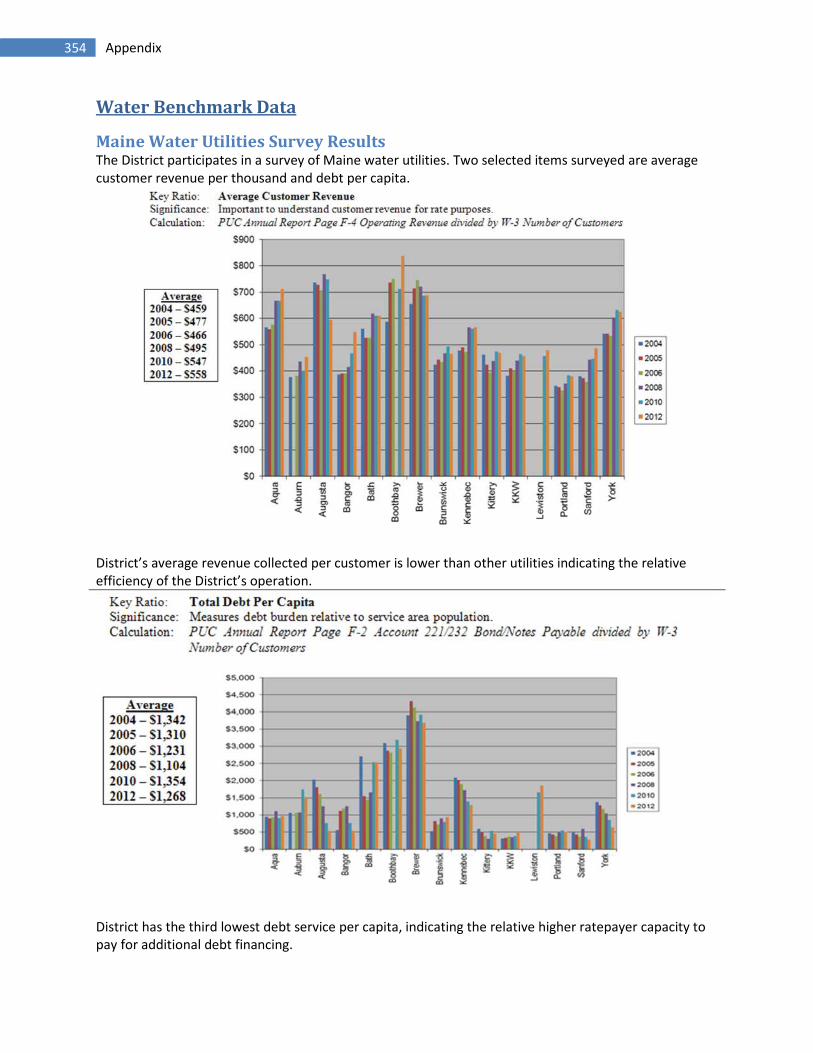
354 Appendix
Water Benchmark Data
Maine Water Utilities Survey ResultsThe District participates in a survey of Maine water utilities. Two selected items surveyed are averagecustomer revenue per thousand and debt per capita.
District’s average revenue collected per customer is lower than other utilities indicating the relativeefficiency of the District’s operation.
District has the third lowest debt service per capita, indicating the relative higher ratepayer capacity topay for additional debt financing.

355 Appendix
Water Benchmark Data (continued)
Water Rates
The District‘s rates are well below the Environment Protection Agency’s affordability standard – waterrates should not exceed 2% of median income. The District’s service territory is a subset of CumberlandCounty and a major reason why Cumberland County’s rates are the lowest in relations to medianincome.
2004 2006 2008 2010 2012 2004 2006 2008 2010 2012
Androscoggin $39,452 $42,126 $43,149 $40,653 $45,699 0.83% 0.00% 1.01% 1.06% 1.02%
Cumberland $50,316 $53,255 $55,558 $52,459 $57,267 0.76% 0.71% 0.74% 0.84% 0.74%
Kennebec $39,430 $41,634 $44,261 $44,668 $46,904 1.54% 1.42% 1.51% 1.47% 1.24%
Penobscot $37,939 $40,188 $42,152 $40,301 $43,601 1.37% 1.41% 1.35% 1.43% 1.42%
Sagadahoc $46,680 $49,278 $51,944 $54,754 $56,865 1.23% 1.30% 1.19% 1.21% 1.27%
York $48,561 $51,121 $53,366 $54,134 $56,552 0.91% 0.82% 0.90% 0.93% 0.90%
Averages $43,730 $46,267 $48,405 $47,828 $51,148 0.95% 0.81% 0.96% 0.99% 0.94%
Portland
Water District $44,064 $46,601 $48,405 $48,123 $47,841 0.68% 0.61% 0.64% 0.65% 0.67%
Maine Median Income (MSHA) 2004-
2012
Water Revenue as % of Annual Median
Household Income
The District’s water rates for a typical household are relatively lower than Massachusetts and Nationalutilities. Since the 2012 survey, the District rates have increased to $323 from $320. The budgetrequests an average increase of 3.8% to $341. Even after the increase, rates will have only increased15.6% since 1998, which is an average increase of 0.9% annually.
$-
$100
$200
$300
$400
$500
$600
1998 2000 2002 2004 2006 2008 2010 2012
Annual Residential Water Bill
(10 HCF or 7,480 Gallons/Month)
Massachusetts
National
Portland Water District

356 Appendix
Customer Satisfaction Survey
A periodic customer satisfaction survey is conducted. The last survey was conducted in 2011. A summaryof the results are below and indicate that overall satisfaction remains high relative to previous surveysand other local utilities. Relatively low sewer scores mostly attributed to including the relatively highand increasing municipal sewer charges on the District’s water bill.
Action items identified that will be implemented in 2014 include a public relation campaign to promotethe ‘value of water’ and continue expanding services provided electronically. The 2015 budget includes$10,000 to conduct an updated survey,
Year Overall WaterService/Quality
Sewer
2011 87% 92% 71%2008 85% 90% 76%2005 88% 89% 78%2002 89% 90% 83%2000 89% 91% 79%1998 NA 85% 74%
40%
60%
80%
100%
2000 2002 2005 2008 2011
PWD Phone Electric Cable Govrnmt

357 Appendix
Proposed Board of Trustees’ Orders and Resolutions
BOARD OF TRUSTEES / AGENDA ITEM SUMMARY
Agenda Items:
Date of Meeting: November 24, 2014
Subject: Proposed Budget Orders
Presented By: Ronald Miller
The Administration and Finance, Operations and Planning Committees reviewed the 2014 Budget andCIP for which they have jurisdiction. Below are the recommended motions to be considered at theregular meeting.
The proposed motion accepts the 2015 budget and authorizes billing the municipalities for wastewaterand billing services.
Order 14-042
ORDERED that the 2015 Budget and Wastewater Assessments as presented by theGeneral Manager are accepted and adopted and shall be filed with the minutes of thismeeting; and pursuant to Section 12 of the District’s Charter, to assess for 2015 theparticipating municipalities for wastewater related costs as follows:
Town of Cape ElizabethTown of CumberlandTown of GorhamCity of PortlandCity of WestbrookTown of Windham
$ 1,412,112731,784
1,106,14810,981,308
2,533,176351,756
and to assess non-participating municipal corporations for billing-related costs asfollows:
Town of FalmouthCity of South PortlandScarborough Sanitary District
$ 15,012192,384
10,620

358 Appendix
The motion accepts the proposed capital improvement plan and authorizes staff to implement the 2014projects within the restrictions stated below and in compliance with the purchasing policy guidelines.
Order 14-043
ORDERED that the 2015 – 2019 Capital Improvement Plan is hereby adopted and theGeneral Manager is authorized to solicit bids or proposals for the year 2015 projects,excepting CIP# 21, project 671; and to authorize the General Manager to awardcontracts for approved projects to the lowest bidder if the bid is within the projectbudget;
BE IT FURTHER ORDERED that the General Manager is authorized to solicit bids orproposals and is authorized to partner with municipalities, MDOT and developers for theyear 2015 for the replacement and extension of water mains, services, valves andhydrants as outlined in the Water Distribution Systems Upgrades Program; and theGeneral Manager is also authorized to enter into contracts and award contracts if thebids or partnering proposals that are within the overall program budget
State law requires water revenue be committed to the treasurer to allow property liens be executed ondelinquent water rate payers.
Order 14-044
ORDERED that all water charges for the Fiscal Year 2015 are hereby committed to theTreasurer of the Portland Water District for collection in support of the appropriationsfor the Water Fund.
Before approving water rate adjustment, staff will provide additional information for the Board’sconsideration. Additionally, if the Board decides a rate adjustment is necessary, public notice will beprovided to all customers and a public hearing will be held.
Order 14-045
ORDERED that the Board of Trustees directs the General Manager and Treasurer toundertake the preliminary steps necessary to prepare a rate adjustment ofapproximately 3.8% for further Board consideration and submittal to the Maine PublicUtilities Commission in 2015.

359 Appendix
In compliance with Internal Revenue Service (IRS) regulation, an intent to borrow motion must beapproved by the Board before expenditures are incurred on a project that may be financed with tax-exempt financing. Resolutions 14-012 to 14-016 are intent to borrow motions for each fund. Before abond is actually authorized or issued, a public hearing will be held. Subsequent to the hearing, the Boardwill consider authorizing the bond.
Resolution 14-012
RESOLVED the Board hereby declares its intent to issue debt to reimburse costsincurred by the District for water fund projects identified in the 2015 CIP. The fullform of the resolution is attached hereto and incorporated herein by reference, andshall be part of the minutes of this meeting.
Resolution 14-013
RESOLVED the Board hereby declares its intent to issue debt to reimburse costsincurred by the District for the Cape Elizabeth wastewater fund projects identified inthe 2015 CIP. The full form of the Resolution is attached hereto and incorporatedherein by reference, and shall be part of the minutes of this meeting.
Resolution 14-014
RESOLVED the Board hereby declares its intent to issue debt to reimburse costs incurredby the District for the Cumberland wastewater fund projects identified in the 2015 CIP.The full form of the Resolution is attached hereto and incorporated herein by referenceand shall be part of the minutes of this meeting.
Resolution 14-015
RESOLVED the Board hereby declares its intent to issue debt to reimburse costsincurred by the District for the Portland wastewater fund projects identified in the2015 CIP. The full form of the Resolution is attached hereto and incorporated hereinby reference, and shall be a part of the minutes of this meeting.
Resolution 14-016
RESOLVED the Board hereby declares its intent to issue debt to reimburse costsincurred by the District for the Westbrook wastewater funds’ projects identified in the2015 CIP. The full form of the Resolution is attached hereto and incorporated hereinby reference, and shall be a part of the minutes of this meeting.

360 Appendix
RESOLUTION 14-012DECLARATION OF OFFICIAL INTENT PURSUANT TO
TREASURY REGULATION §1.150-2(Water Fund)
WHEREAS, the Portland Water District (the “Issuer”) intends to proceed with the projects describedin section 2 below (the “Projects”); and
WHEREAS, the Issuer intends to finance some or all of the costs of the Projects through the issuanceof bonds or notes in anticipation thereof; and
WHEREAS, the Issuer may incur certain of the costs of the Projects prior to the issuance of such notesor bonds and the Issuer expects to be reimbursed from the proceeds thereof; and
WHEREAS, Treasury Regulation §1.150-2 requires that the Issuer declare its official intent toreimburse itself for such expenditures with the proceeds of such notes or bonds.
NOW, THEREFORE, the Issuer does hereby declare its official intent as follows:
1. Declaration of Intent. The Issuer reasonably expects to reimburse itself for expenditures made onthe Projects with the proceeds of bonds or notes in anticipation thereof to be issued by the Issuer tofinance the costs of the Projects in the maximum principal amount of $10,385,000.
2. General Description of Property to which Reimbursement Relates. The following is a reasonablyaccurate general functional description of the type and use of the property with respect to whichreimbursements will be made:
Construction or installation of new water mains, valves, hydrants, services and meters;
Acquisition of vehicles, leak detection and related equipment;
Renovation of various water facilities;
Acquisition and installation of various computer-related equipment; and
Building improvements at the Douglass Street facilities.
Construction of new 407 zone pump station and related infrastructure.
3. Public Availability of Official Intent. This Declaration of Official Intent shall be maintained as a publicrecord of the Issuer.
4. Treasury Regulations. This is a declaration of official intent pursuant to the requirements ofTreasury Regulations § 1.150-2.
5. Authority for Declaration. This declaration is adopted pursuant to the following action of theIssuer: Resolution adopted by the Portland Water District Board of Trustees.

361 Appendix
RESOLUTION 14-013DECLARATION OF OFFICIAL INTENT PURSUANT TO
TREASURY REGULATION §1.150-2(Cape Elizabeth Sewer Fund)
WHEREAS, the Portland Water District (the “Issuer”) intends to proceed with the projects describedin section 2 below (the “Projects”); and
WHEREAS, the Issuer intends to finance some or all of the costs of the Projects through the issuanceof bonds or notes in anticipation thereof; and
WHEREAS, the Issuer may incur certain of the costs of the Projects prior to the issuance of such notesor bonds and the Issuer expects to be reimbursed from the proceeds thereof; and
WHEREAS, Treasury Regulation §1.150-2 requires that the Issuer declare its official intent toreimburse itself for such expenditures with the proceeds of such notes or bonds.
NOW, THEREFORE, the Issuer does hereby declare its official intent as follows:
1. Declaration of Intent. The Issuer reasonably expects to reimburse itself for expenditures made onthe Projects with the proceeds of bonds or notes in anticipation thereof to be issued by the Issuer tofinance the costs of the Projects in the maximum principal amount of $392,500.
2. General Description of Property to which Reimbursement Relates. The following is a reasonablyaccurate general functional description of the type and use of the property located in the Town ofCape Elizabeth with respect to which reimbursements will be made:
Replacement of obsolete assets or installation of new equipment at various pumpstations, including Wildwood, and treatment plant, including security system,effluent sampling, headworks, gas alarm and alkalinity feeding equipment.
3. Public Availability of Official Intent. This Declaration of Official Intent shall be maintained as a publicrecord of the Issuer.
4. Treasury Regulations. This is a declaration of official intent pursuant to the requirements of TreasuryRegulations § 1.150-2.
5. Authority for Declaration. This declaration is adopted pursuant to the following action of the Issuer:Resolution adopted by the Portland Water District Board of Trustees.
362 Appendix
RESOLUTION 14-014DECLARATION OF OFFICIAL INTENT PURSUANT TO
TREASURY REGULATION §1.150-2(Cumberland Sewer Fund)
WHEREAS, the Portland Water District (the “Issuer”) intends to proceed with the projects describedin section 2 below (the “Projects”); and
WHEREAS, the Issuer intends to finance some or all of the costs of the Projects through the issuanceof bonds or notes in anticipation thereof; and
WHEREAS, the Issuer may incur certain of the costs of the Projects prior to the issuance of such notesor bonds and the Issuer expects to be reimbursed from the proceeds thereof; and
WHEREAS, Treasury Regulation §1.150-2 requires that the Issuer declare its official intent toreimburse itself for such expenditures with the proceeds of such notes or bonds.
NOW, THEREFORE, the Issuer does hereby declare its official intent as follows:
1. Declaration of Intent. The Issuer reasonably expects to reimburse itself for expenditures made onthe Projects with the proceeds of bonds or notes in anticipation thereof to be issued by the Issuer tofinance the costs of the Projects in the maximum principal amount of $40,000.
2. General Description of Property to which Reimbursement Relates. The following is a reasonablyaccurate general functional description of the type and use of the property located in the Town ofCumberland with respect to which reimbursements will be made:
Replacement of obsolete assets at various pump stations and
Installation of generator at pump station located on Brookside Road in Cumberland
3. Public Availability of Official Intent. This Declaration of Official Intent shall be maintained as a publicrecord of the Issuer.
4. Treasury Regulations. This is a declaration of official intent pursuant to the requirements of TreasuryRegulations § 1.150-2.
5. Authority for Declaration. This declaration is adopted pursuant to the following action of the Issuer:Resolution adopted by the Portland Water District Board of Trustees.

363 Appendix
RESOLUTION 14-015DECLARATION OF OFFICIAL INTENT PURSUANT TO
TREASURY REGULATION §1.150-2(Portland Sewer Fund)
WHEREAS, the Portland Water District (the “Issuer”) intends to proceed with the projects describedin section 2 below (the “Projects”); and
WHEREAS, the Issuer intends to finance some or all of the costs of the Projects through the issuanceof bonds or notes in anticipation thereof; and
WHEREAS, the Issuer may incur certain of the costs of the Projects prior to the issuance of such notesor bonds and the Issuer expects to be reimbursed from the proceeds thereof; and
WHEREAS, Treasury Regulation §1.150-2 requires that the Issuer declare its official intent toreimburse itself for such expenditures with the proceeds of such notes or bonds.
NOW, THEREFORE, the Issuer does hereby declare its official intent as follows:
1. Declaration of Intent. The Issuer reasonably expects to reimburse itself for expenditures made onthe Projects with the proceeds of bonds or notes in anticipation thereof to be issued by the Issuer tofinance the costs of the Projects in the maximum principal amount of $11,864,000.
2. General Description of Property to which Reimbursement Relates. The following is a reasonablyaccurate general functional description of the type and use of the property located in the City ofPortland with respect to which reimbursements will be made:
Renovation and repair of equipment and facilities at the East End Treatment Plant,including projects related to the aeration system, and plant water system, effluentflow meter, dewatering odor control and polymer systems; and
Renovation and repair of equipment and facilities at the Peaks Island TreatmentPlant, including projects related to the headwork ventilation system , alkalinityfeeding system, influent valve and security system; and
Replacement of equipment and roof at various pump stations, including Fore Riverand Northeast Pump Stations; and
Installation of SCADA/Process control system upgrades at East End and Peaks Islandtreatment plants.
3. Public Availability of Official Intent. This Declaration of Official Intent shall be maintained as a publicrecord of the Issuer.
4. Treasury Regulations. This is a declaration of official intent pursuant to the requirements of TreasuryRegulations § 1.150-2.
5. Authority for Declaration. This declaration is adopted pursuant to the following action of the Issuer:Resolution adopted by the Portland Water District Board of Trustees.

364 Appendix
RESOLUTION 14-016DECLARATION OF OFFICIAL INTENT PURSUANT TO
TREASURY REGULATION §1.150-2(Westbrook Sewer Fund)
WHEREAS, the Portland Water District (the “Issuer”) intends to proceed with the projects describedbelow (the “Projects”); and
WHEREAS, the Issuer intends to finance some or all of the costs of the Projects through the issuanceof bonds or notes in anticipation thereof; and
WHEREAS, the Issuer may incur certain of the costs of the Projects prior to the issuance of such notesor bonds and the Issuer expects to be reimbursed from the proceeds thereof; and
WHEREAS, Treasury Regulation §1.150-2 requires that the Issuer declare its official intent toreimburse itself for such expenditures with the proceeds of such notes or bonds.
NOW, THEREFORE, the Issuer does hereby declare its official intent as follows:
1. Declaration of Intent. The Issuer reasonably expects to reimburse itself for expenditures made onthe Projects with the proceeds of bonds or notes in anticipation thereof to be issued by the Issuer tofinance the costs of the Projects in the maximum principal amount of $ 1,010,000.
2. General Description of Property to which Reimbursement Relates. The following is a reasonablyaccurate general functional description of the type and use of the property located in the City ofWestbrook with respect to which reimbursements will be made:
Replace sewer interceptors on several streets including Brown, North River andReserve Streets.
3. Public Availability of Official Intent. This Declaration of Official Intent shall be maintained as a publicrecord of the Issuer.
4. Treasury Regulations. This is a declaration of official intent pursuant to the requirements of TreasuryRegulations § 1.150-2.
5. Authority for Declaration. This declaration is adopted pursuant to the following action of the Issuer:Resolution adopted by the Portland Water District Board of Trustees.

365 Appendix
Glossary/Acronyms
Term Description
Accurate bill index The ratio of correct read adjustments on accountsto the total of all accounts
Accrual Basis The method of accounting under which revenuesare recorded when they are earned (whether ornot cash is received at that time) and expendituresare recorded when goods and services arereceived (whether or not cash disbursements aremade at the time)
AMaP Asset Management and Planning group, consistingof Engineering and Environmental Departments
Amortization The write-off of costs that has a financial benefitexceeding 1 year but is not a capital expenditure.The write-off period is determined based on anestimate of asset's useful life.
AMR Automated Meter Reading
ARRA American Recovery and Reinvestment Act of 2009.The federal stimulus law that provided federalsubsidies for varies projects in order to boostemployment during a recessionary period.
Asset Information Management system Computerized asset identification system used todocument all asset maintenance schedules /procedures from day of acquisition to disposal.
BOD Biochemistry Oxygen Demand - a measure oforganic material in the influent / effluent of thewastewater system expressed in lbs./ day
Bond A written promise to pay (debt) a specified sum ofmoney (called principal) at a specified future date(called the maturity date(s)) along with periodicinterest payments at a specific percentage ofprincipal (interest rate).
BMP’s Best Management Practices

366 Appendix
Glossary/Acronyms
Capital Expenditure Expenditures for a physical asset that exceeds $5,000and has a useful life of greater than 5 years orextends the useful life of an existing asset for morethan 5 years.
CPE Comprehensive Plant Evaluation
Cross Connection Fees Fees collected for work relating to the inspection ofwater backflow devices.
Cryptosporidium A one cell parasite that originates from the feces ofinfected animals and humans that can causegastrointestinal illness.
CSWWTF Cape South Wastewater Treatment Facility
Customer Activation Fees Fees charged customer if a new billing account needsto be created; typically when a customer moves intoa new home.
Customer Connection Fees Applications fees charged to customers requesting toinstall a new water main, service line or meter.
Customer Penalties Disconnection fees charged to customers for non-payment of services.
CWA Clean Water Act
Deferred Costs Costs that have been incurred for a purpose that hasa beneficial period in excess of one year but does notculminate into a capital expenditure. These costs arenormally written-off to operating expense over theestimated useful life of the item.
DEP Department of Environmental Protection, State ofMaine
Depreciation The write-off of an asset based on the decrease invalue of property over its estimated useful life.
DHHS Department of Health and Human Services
EEWWTF East End Wastewater Treatment Facility

367 Appendix
Glossary/Acronyms
Enterprise Fund A proprietary fund used by governments to accountfor business-type activities. Such a fund isappropriately used for operations that are financedand operated in a manner similar to private businessenterprise where the intent is that the costs befinanced or recovered primarily through user charges.
EPA Environmental Protection Agency, Federal Agency
ERP Emergency Response Plan
FEMA Federal Emergency Management Agency - a federalagency that provides financial assistance afterdeclared national disasters.
Fire Service Outage Index Standard to monitor hydrants returned to servicewithin 3 business days.
Fund An independent fiscal and accounting entity with aself-balancing set of accounts recording cash and /orother resources together with all related liabilities,obligations, reserves, and equities which aresegregated for the purpose of carrying on specificactivities or attaining certain objectives.
Generally Accepted Accounting Principal (GAAP) Uniform minimum standards of, and guidelines for,external financial and reporting. They govern theform and content of basic financial statements of anentity. GAAP encompasses the conventions, rules andprocedures necessary to define accepted accountingpractice at a particular time. The primaryauthoritative statements on the application of GAAPto local governments are Government AccountingStandards Board pronouncements (GASB).
HCF Hundred Cubic Feet- the standard measure used forbilling water usage, 1 HCF is equal to 748 gallons ofwater, 1 cubic foot of water is equal to 7.48 gallons.
Industrial Pretreatment Program A program responsible for permitting and monitoringindustrial sewer customers who discharge significantquantities of non-domestic wastewater to thecollection system to ensure their activities do notimpact our operation or the receiving waters.

368 Appendix
Glossary/Acronyms
Infiltration/Inflow Ground water that enters the sanitary sewer systemthrough infrastructure weaknesses.
Interest from Customers Late fees charged to past due balances. An account isconsidered delinquent after 25 days the bill is mailedcustomers.
ISO Insurance Service Office
IVR Interactive Voice Response
Jobbing Revenue Revenue for work performed by District employeeswhich is billable to outside parties.
LTD Long Term Debt
MDOT Cash Reserve Funds received from Maine Department ofTransportation from sales of land to be reserved forfuture land purchases.
MEANS Main Extension and New Services program
MMBB Maine Municipal Bond Bank
Ozone A gas formed by electrical discharge in air used as anoxidizing, deodorizing and bleaching agent in thepurification of water.
Pentamation Accounting software used by Portland Water District
PI Plant Information - a database used to automaticallycompile performance information on a specific asset.
Project WET Water Education for Teachers program
Proprietary Funds Accounting funds established to separate assets andoperational costs based on the type of system (i.e.Water or Wastewater) or Wastewater municipality.
PS Pump Station
Quasi-municipality Independent government entity as defined by statelaw. It has many of the responsibilities and rights of atypical governmental entity.
369 Appendix
Glossary/Acronyms
R&R Multi-fund Assets Assets utilized by all funds and paid for by allocations tothe funds (i.e. computers, meters, administrative officespace).
Renewal and Replacement Funds A cash reserve created to fund smaller capital projects.
Sanitary Sewer Overflows (SSO) Sewer systems that contain only sanitary flows thatmay discharge directly into water bodies withoutbeing treated.
SLWTF Sebago Lake Water Treatment Facility
SOP Standard operating procedure
Spatial Scheduling Use of the district's geographic information system toschedule customer appointments on a daily basis tobest utilize manpower and vehicle usage.
SRF State Revolving Fund- Maine Municipal Bond Bankprogram for long-term financing
STD Short Term Debt
SU Standard units of measuring Ph with a range of 1 - 14.
Sub-meters Meters installed to measure water that will not bereturned to the sewer system for disposal. This watermay be used for irrigation purposes or other outsideuse and therefore should not be included in thecalculation of wastewater disposal charges.
SWTR standards Surface Water Treatment Rules
TCR samples Total Coliform Rule
10th Percentile Chlorine Residual Minimum residual found in water samplesapproximately 90% of the time.
TIF Tax Increment Finance - a designated municipal fundestablished to fund structural improvements
TPS Pumping Thickened Primary Sludge pumping

370 Appendix
Glossary/Acronyms
Tropic State Index Calculated measure of lake productivity with clear,clean water as the desired result. Range of less than30 to greater than 100 with the lower the number, thebetter the results.
TSS Total Suspended Solids- a measure of suspendedmaterial in the influent / effluent of the wastewatersystem expressed in lbs. / day
Unaccounted for Water Water not measured by metered flow such as fireservice use, main leaks, etc.
Water Outage Index Index of the ratio of customer outage hours/millionhours available. Customer outage hours are computedby taking the # of customers without water servicetimes the number of hours the outage lasts. The hoursavailable is derived by taking the number of customerstimes number days times 24 hours per day.
Watershed A stretch of high land dividing the areas drained bydifferent rivers or river systems into Sebago Lake.
Watershed Reserve PUC allowed reserve of Water revenue to be used forfuture land purchases to protect PWD's watershed.
Weighted average unit price Total cost of a product divided by the total productunits
WIMS Water information management solution (software)
WWTF Wastewater Treatment Facility