portland international jetport
TRANSCRIPT

Portland International JetportFAR Part 150 Update
Part 150 Noise Advisory Committee Meeting10 December 2001
Harris Miller Miller & Hanson IncHarris Miller Miller & Hanson Inc.In association with:
Vanasse Hangen Brustlin, Inc.Simat, Helliesen & Eichner, Inc.Innovative Resource Group, Inc.

http://www.hmmh.com/
What is Federal Aviation Regulation(FAR) Part 150?
• Part 150 UpdateUpdate existing and forecast Noise Exposure MapsEvaluate effectiveness of existing Noise Compatibility Program
• Two principal technical elements:Noise Exposure Map (“NEM”) determined in compliance by the FAA, March 1990Noise Compatibility Program (“NCP”) approved by the FAA, July 1990
http://www.hmmh.com/
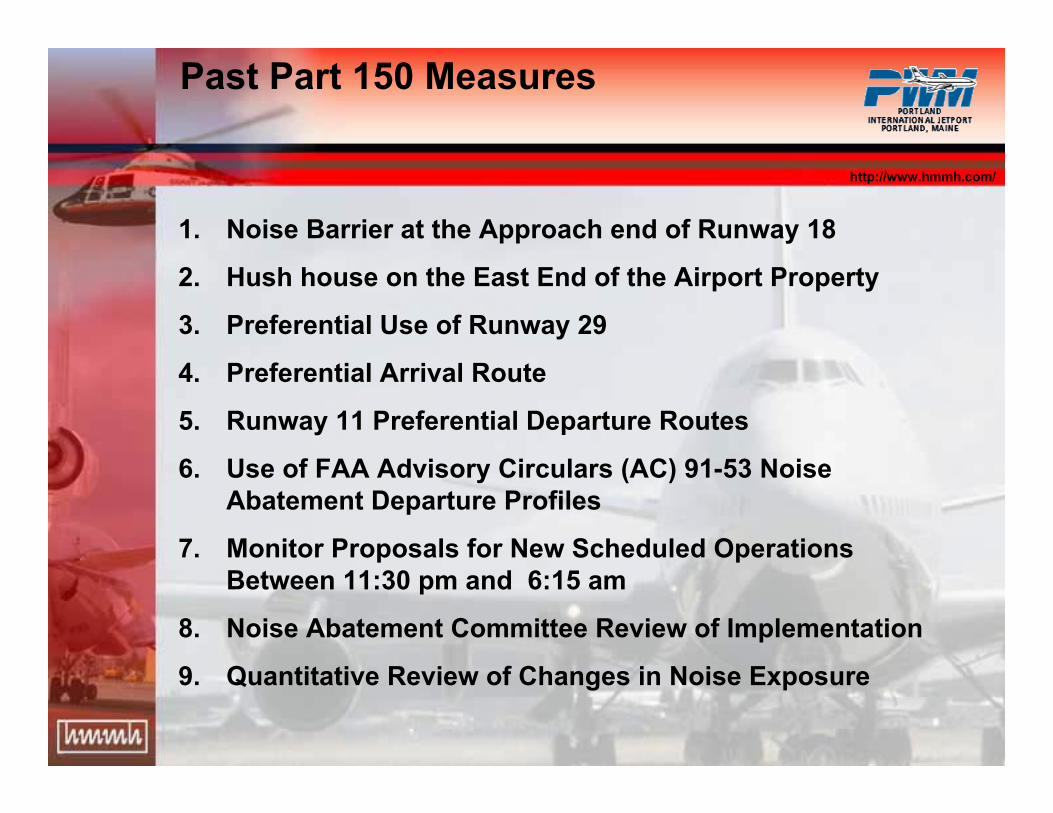
Past Part 150 Measures
1. Noise Barrier at the Approach end of Runway 18
2. Hush house on the East End of the Airport Property
3. Preferential Use of Runway 29
4. Preferential Arrival Route
5. Runway 11 Preferential Departure Routes
6. Use of FAA Advisory Circulars (AC) 91-53 Noise Abatement Departure Profiles
7. Monitor Proposals for New Scheduled Operations Between 11:30 pm and 6:15 am
8. Noise Abatement Committee Review of Implementation
9. Quantitative Review of Changes in Noise Exposure
http://www.hmmh.com/
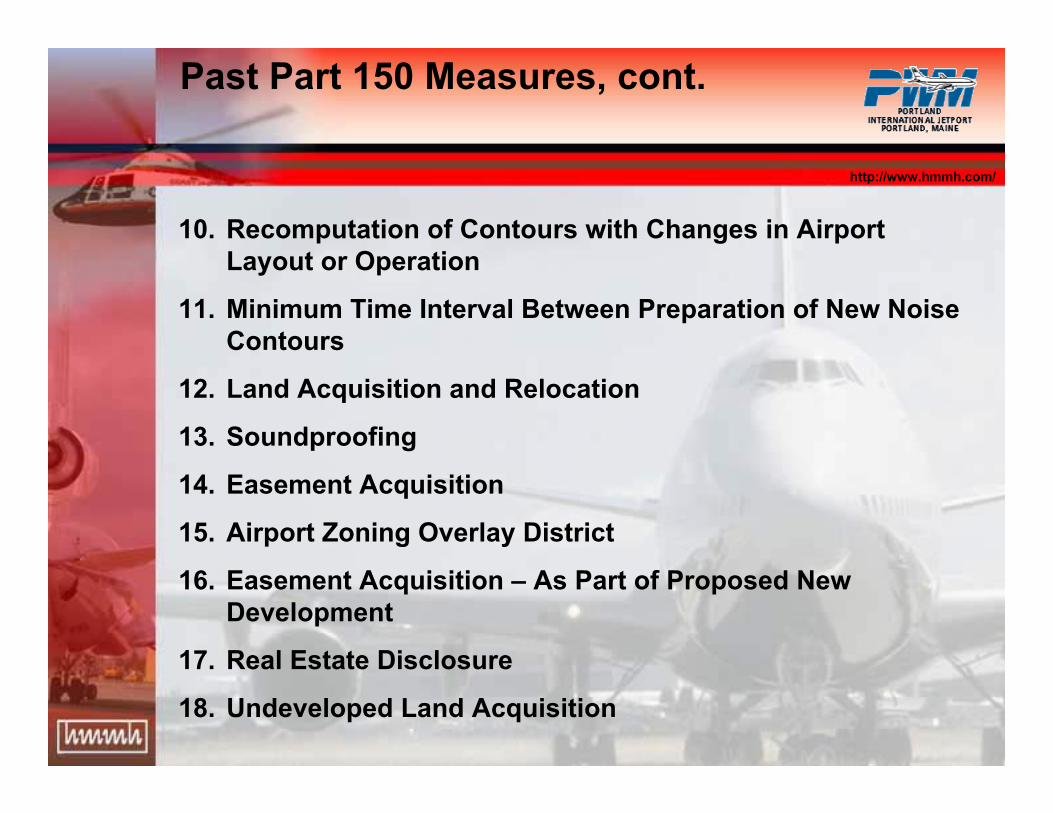
Past Part 150 Measures, cont.
10. Recomputation of Contours with Changes in Airport Layout or Operation
11. Minimum Time Interval Between Preparation of New Noise Contours
12. Land Acquisition and Relocation
13. Soundproofing
14. Easement Acquisition
15. Airport Zoning Overlay District
16. Easement Acquisition – As Part of Proposed New Development
17. Real Estate Disclosure
18. Undeveloped Land Acquisition

http://www.hmmh.com/
Noise Metrics
• Decibel, dB
• A-Weighted Decibel, dBA
• Maximum A-Weighted Sound Level, Lmax
• Sound Exposure Level, SEL
• Equivalent Sound Level, Leq
• Day-Night Average Sound Level, DNL
http://www.hmmh.com/
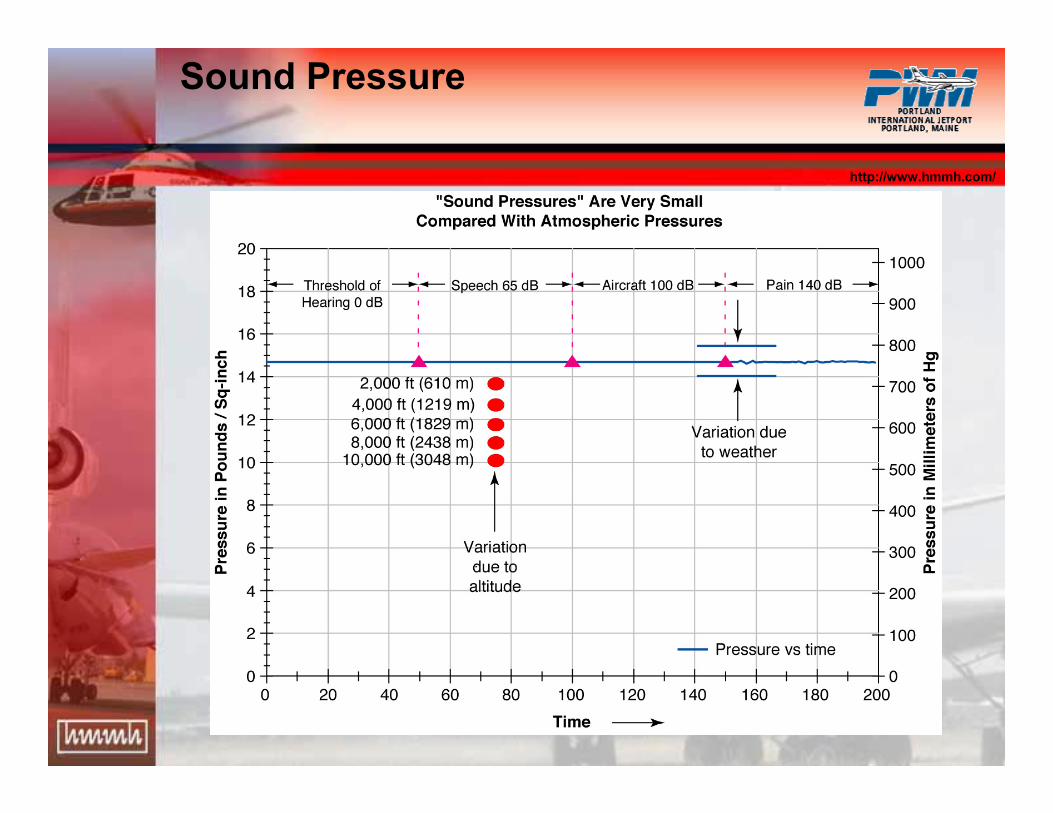
Sound Pressure

http://www.hmmh.com/
Decibel, dB

http://www.hmmh.com/
Source: Harris, Cyril M., editor; Handbook of Acoustical Measurements and Noise Control,(Chapter 5, "Acoustical Measurement Instruments"; Johnson, Daniel L.; Marsh, Alan H.; and Harris,Cyril M.); New York; McGraw-Hill, Inc.; 1991; p. 5.13.
A-Weighted Decibel, dBA
Frequency-Response Characteristics of Various Weighting Networks

http://www.hmmh.com/
Maximum A-Weighted Sound Level,Lmax

http://www.hmmh.com/
Common Environmental Sound Levels,in dBA
Source: HMMH (Aircraft noise levels from FAA Advisory Circular 36-3G)

http://www.hmmh.com/
Sound Exposure Level, SEL
Source: HMMH

http://www.hmmh.com/
Sleep Interference
Source: Federal Interagency Committee on Aviation Noise (FICAN),“Effects of Aviation Noise on Awakenings from Sleep”, June 1997, page 6

http://www.hmmh.com/
Equivalent Sound Level, Leq
Source: HMMH
Example of a One Minute Equivalent Sound Level
http://www.hmmh.com/
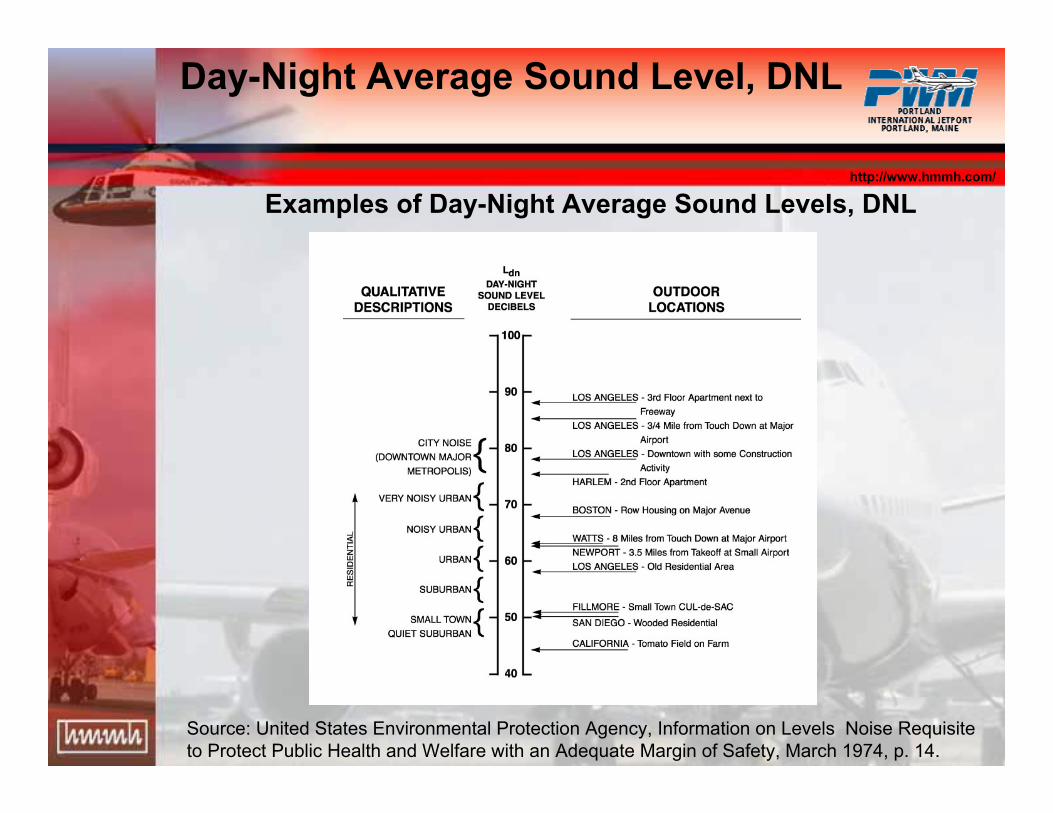
Day-Night Average Sound Level, DNL
Source: United States Environmental Protection Agency, Information on Levels Noise Requisiteto Protect Public Health and Welfare with an Adequate Margin of Safety, March 1974, p. 14.
Examples of Day-Night Average Sound Levels, DNL

http://www.hmmh.com/
Percentage of People Highly Annoyed
Source: Federal Interagency Committee on Noise. "Federal Agency Review of Selected Airport NoiseAnalysis Issues". August 1992. (From data provided by USAF Armstrong Laboratory). pp. 3-6
http://www.hmmh.com/
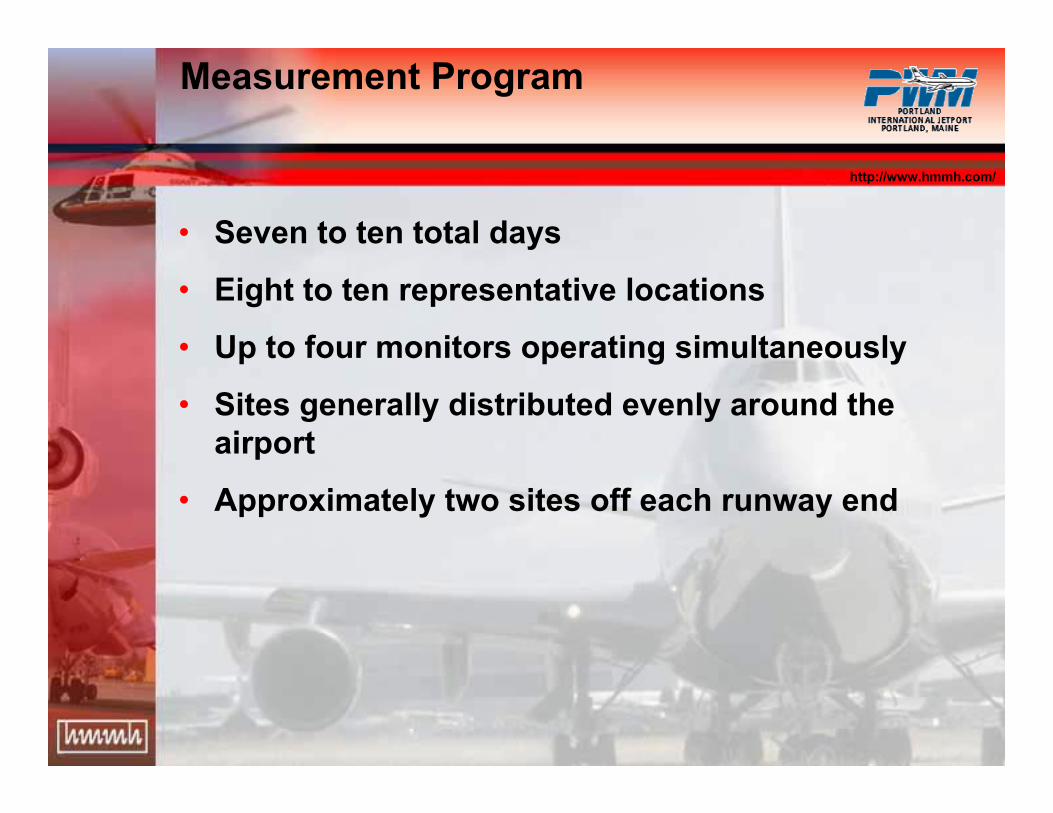
Measurement Program
• Seven to ten total days
• Eight to ten representative locations
• Up to four monitors operating simultaneously
• Sites generally distributed evenly around the airport
• Approximately two sites off each runway end
http://www.hmmh.com/
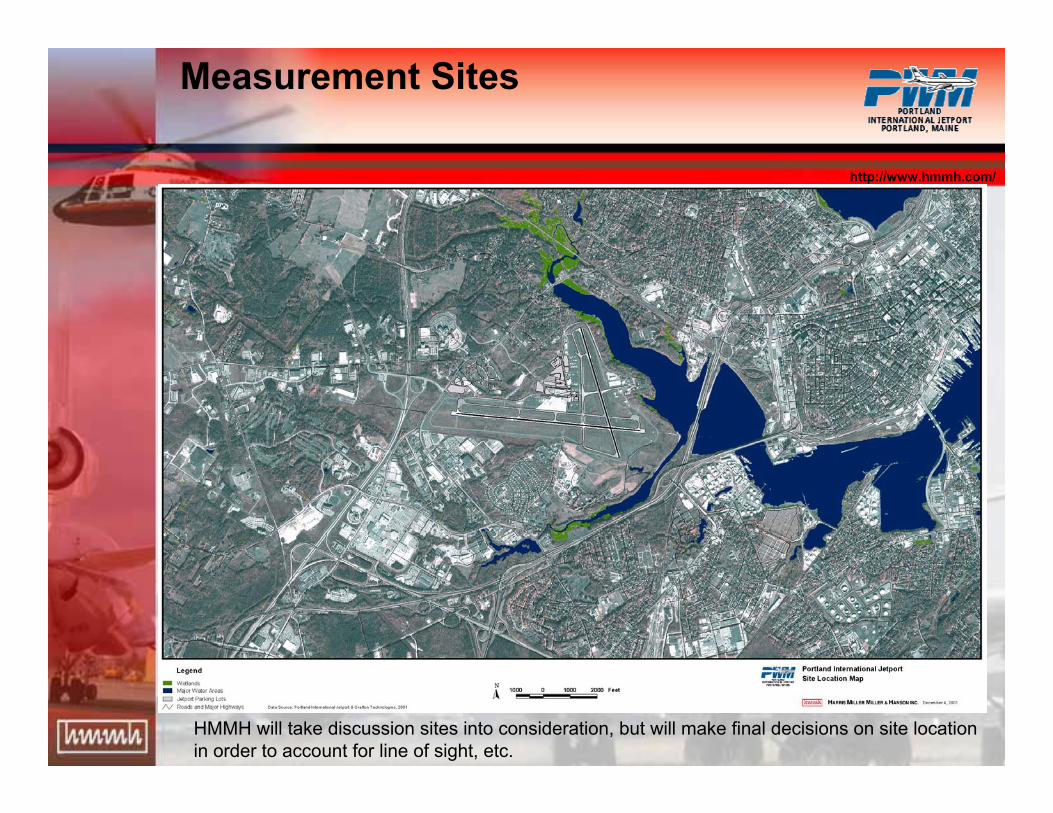
Measurement Sites
HMMH will take discussion sites into consideration, but will make final decisions on site locationin order to account for line of sight, etc.

Portland International Jetport Part 150 Noise Advisory Committee
Meeting 1 December 10, 2001
5:00PM Portland Jetport
Conference Room Introduction and welcome Michael Musca Presentation Bob Miller Question/Answer B.Miller: Was everyone able to access electronic versions of handouts through HMMH’s ftp site? Jerry : Tried two computers and was unsuccessful. What is a hush house? A hush house is a large enclosed building that is acoustically treated with doors that close after an aircraft is pushed inside. Hush houses have exhaust systems and fire suppression systems built into them and are designed to suppress noise during runups, usually maintenance operations that are long in duration and require various power settings. They are multi million dollar buildings. Would a hush house be a possibility for engine runups? Hush houses are more likely to be used in conjunction with a maintenance facility. A noise barrier or berm is more likely for engine runups to test magnetos, which are generally short in duration. In explaination of decibels, could you explain the logarithmic functions of decibels? The presentation will get into explanation of decibels. It will not go into too much depth on logarithmic functions. In using DNL averages, do peaks get eliminated? Later metrics that will be used to supplement DNL will be explained later. Concern expressed that formula used in DNL may create bias against events of most concern, the very noisy, very noticeable events which take place over an extended period of time. Please be aware of that. Recognize that DNL gets at something different by eliminating peaks. DNL is supplemented by additional information. How many decibels can one be exposed to before experiencing hearing loss? Hearing loss is related to noise dose or exposure. People tend to experience a temporary threshold shift after exposure to a noise source. Hearing can be gained back even at levels of 140 dB. The Occupational and Safety and Health Administration (OSHA) sets limits for workers. They cannot be exposed to over 90 dB over a continuous 8-hour shift. The maximum for a 4-hour continuous exposure is 100 dB.
These levels are enough to protect from hearing loss. The community should not be experiencing levels that would cause hearing loss. Committee member noted that the frequency range on the graphic ranged from 20Hz to 20,000Hz (normal audio range). What frequency travels the farthest? Low frequency noise travels the most distance because it is not absorbed as efficiently by the air. Weather also has an effect on distance traveled. Cold air allows noise to pass more efficiently than warm air. A study recently released from Sweden showed that lower frequency noise has more of an impact on hypertension than high frequency. Will you get into that? Any current information we can bring in, we will. The study will involve a very complex set of noises. We will look at what we can do about them. Can you describe in one sentence in lay terms why you will focus on A-weighted decibels? The A-weighted decibel is the best metric that draws close correlation to our reaction to noise, or the loudness of noise. Length of time is important, but is looked at in other metrics. The A-weighted curve includes low frequencies retaining their power over long distances? Yes, however the A-weighted decibel is not always the best for an analysis of start of takeoff when the low rumbling sound travels a long distance. Is the A-weighted filter a mathematical formula applied to the measurement or an actual filter? It is purely a filter. It is an internal electronic filter done by the sound level meter. Where would a speaking voice show up on the Lmax scale? Between 65 dB and 70 dB. A 10 dB increase would translate in to how much of an increase in power? A 10 dB increase is 10 times the power. A 20 dB increase is 100 times the power. The graphic shows a garbage disposal at 3 feet. I am usually right next to it. What is the level there? General rule of thumb, half the distance translates into an increase of 6 dB. Committee member noted that a vacuum cleaner is approximately 70 dB and normal speech is approximately 65 dB. This shows that annoyance makes a difference. Speech provides us with information. The vacuum cleaner does not provide information it is simply noise. This makes the vacuum cleaner more annoying. Committee member noted that the vacuum cleaner is a constant A-weighted noise source. Our hearing gets use to 80 dB, however, when you are in a quiet home at 60 dB and a sudden 80 dB event takes place the impact of that increase of 20 dB is much different (worse) than hearing the vacuum cleaner at a constant 80 dB. Gets into annoyance vs. startle. Aircraft are generally not startling unless a sonic boom is heard or a military aircraft.
Would be interesting to measure a tanker going out of the channel on a foggy day blasting horn every minute as required. This causes startle. Committee member offered a non-startle way of looking at this topic. If you have the TV cranked up while walking around your house, then sit down to watch it, it is too loud so you turn it down. In two minutes, it is too loud again so you turn it down. In another two minutes, it is too loud so you turn it down again. We have to remember that we are talking about the human environment and human perception. What is the purpose of going to Sound Exposure Level (SEL)? SEL deals with the issue of annoyance. Two events may have the same maximum level, but one may have a longer duration, which makes the SEL higher. The higher event is not louder, but may be more annoying. It is also a way of comparing two noise events. Looking at the FICAN Sleep Interference graphic showing percent of people who wake up during different levels of noise events. It shows that 0% of the people in the study woke up to a 105 dB noise event? True. This study is a sampling of people. A committee member noted that it would be interesting if the study addressed REM sleep disturbance rather than awakening because REM sleep is related to how much rest people get. How do people wake up to an alarm clock and sleep through an aircraft event? People become tuned to things that are meaningful to them. An alarm may be just as loud as an aircraft event and some people will awake to the alarm but sleep through the aircraft event. In the last noise study, the noise generated from the aircraft while the wheels were on the ground was filtered. We want to get a sense of the ground noise also. Will you use all sources of aircraft noise in the study? It depends on the measurement site location. The sound level meter cannot tell aircraft noise from truck noise, the human ear can. We prefer to have a person at each site unless we are sure there will be no noise interference from trucks, people, etc. A committee member noted that the metric on the Percent of People Highly Annoyed graphic is DNL and that 55 dB DNL is different from 55 dB. When you say ‘mean population’ (referring to the Percent of People Highly Annoyed graphic) how do you decide where the average population is? Is it done by jurisdiction, by drawing a circle and including the people in it? The average is done by sampling people close to data points where the levels are known to be fairly accurate. Part of the problem in using DNL is exacerbated by measuring at this airport because it is a tourist destination, has varying seasonal operations (high in the summer) and most operations occur between the hours of 5:30 a.m. – 8:30 a.m. and 10:00 p.m. – 1:00 a.m. This is diluted by the DNL measurement and yearly average. It does not account for the high seasonal activity. This is a downfall of DNL. It does not look at timeframes.

Graphic shows percent of people ‘highly annoyed’. What would the percent be if we were talking about people who are just annoyed or people whose blood pressure is affected? Percent would be higher. The standard used was a 5-point scale. Highly annoyed included people who marked one of the top two points on the scale. This shows trends only. Ed Green: Looking ahead, is DNL aircraft noise only or does it include ambient noise levels also? In the study, DNL is only noise caused by aircraft and the study will only look at mitigating aircraft noise. In terms or correlation, data gathering will focus on DNL and correlate it to annoyance levels instead of individual surveying? Yes, we will not use individual surveying. Individual surveying is a very scientific process. Can you look into the lighting on 295 and flight paths associated with it? Highway lights are confused with runway lights. Lighting is outside of a Part 150 study. Flight paths will be looked at. I assumed you delayed monitoring because of an expected increase in flights. Why do you believe that there will not be any significant increase in the levels? The measurements may be different. We don’t want to prejudge. Weather can affect measurements—in cold weather, noise travels more efficiently, but aircraft is also more efficient so the aircraft are farther away than they would be on a hot day. Committee member noted that this is subjective. His experience has been that on foggy, rainy, high humidity days, the noise is louder than a cold, denser day. Makes a big difference in sound level. Single event is much louder in the summer. We want to collect good data. You don’t tend to see significant changes because of the countering effects of the noise traveling more efficiently and the aircraft performing more efficiently. You will see differences in operations. Some committee members expressed an interest in monitoring noise other than aircraft (ambient). Measurements will identify aircraft and other events. We will take the total noise and divide it into aircraft noise and non-aircraft noise. Committee member noted that operation changes may be seasonal rather than related to 9/11. Example, Air Canada canceled two operations but will probably resume in the spring. Northwest replaced DC9’s with Saab 340’s, but the DC9’s will likely return in the spring. Will choice of site be weather sensitive, for example, when the ILS is being used all the time? The ILS particularly impacts one neighborhood. As long as it is representative of operations. HMMH cannot promise the world on measurements. They are limited by time and availability. Cannot continually come up to monitor. We will have people at the monitoring sites to keep logs and match the logs to data. There are constraints and we will try to work within them.

Will radar data be used in modeling to determine tracks? Yes. New software may be available to use for PWM study, but not promised. You said that noise tends to fan out at 45° off to the side of the tail. What causes that and does it tend to spread the noise out more? In general, it is directivity that causes noise to fan out. The noise fans in lobes emanating from the engines. The quietest place to stand in no wind conditions is directly behind the aircraft. The noisiest place is 45° to the side of the tail. Committee member noted the important inputs from the public on noise monitoring locations and recognized that there will likely be second guessing. HMMH reserves the right to make the final selection within a few hundred feet of what the committee for acoustical reasons, line of sight between the aircraft and the microphone, whether the monitor is shielded or not shielded and ambient levels. Will you release results as data is taken in or will you save it until the end of the study? Something in-between. HMMH will take the data back to their office, consolidate it, sort events by group (single engine, 727, regional jet, etc.) and compare it. They will perform some analysis before releasing data. What is the next step? The next step is data collection (operations, radar data, runway use etc.). Then schedule the next meeting possibly late January or early February. Committee member suggested those who want to stay and discuss monitoring locations do so. Noted that neighborhood associations need to come to some consensus as it is likely that only one or two sites, if that, will be chosen per neighborhood. What are the specific requirements for monitoring sites? Reasonable security—lock to a fence or tree, possibly in someone’s backyard, 24-hour access.