portfolio defender
TRANSCRIPT

PORTFOLIO DEFENDER
IIT KHARAGPUR
Contents
1. Abstract ................................................................................................................................................. 3
2. Introduction ........................................................................................................................................... 3
3. Formulation ........................................................................................................................................... 4
4. Solution ................................................................................................................................................. 6
5. Quadratic Programming ........................................................................................................................ 6
Observations ............................................................................................................................................ 6
Interpretation .......................................................................................................................................... 7
6. Mixed-Integer quadratic programming ................................................................................................. 9
Interpretation ........................................................................................................................................ 12
7. Heuristic algorithms ............................................................................................................................ 12
8. Genetic Algorithm .............................................................................................................................. 13
9. Tabu Search ........................................................................................................................................ 16
10. Simulated Annealing ....................................................................................................................... 17
11. Error calculation .............................................................................................................................. 17
Pseudocode ............................................................................................................................................. 17
12. Comparing results ........................................................................................................................... 19
13. Conclusion ...................................................................................................................................... 20
14. References ....................................................................................................................................... 21

1. Abstract
The selection of appropriate assets for investment is necessary and essential component of fund
management. The most common theory in this regard has been given by Markowitz. In
Markowitz’s theory, asset returns follow a multivariate normal distribution. Thus according to
Markowitz’s theory, return on a portfolio of assets can be completely described by the expected
return and the variance (risk). For a given set of assets, the set of portfolios of assets that have
the minimum risk for a given level of return form the efficient frontier. This frontier is also
called Unconstrained efficient frontier (UEF). However, in practicality there are many
constraints while taking these decisions. Some of these real life constraints are
a) Limits on the number of assets to be chosen
b) Upper and lower bounds on the amount invested in those assets
c) Including transaction and other costs in the analysis
The constraints (a) and (b) are called integer constraints. An efficient frontier with these
constraints is called cardinality constrained efficient frontier (CCEF).
2. Introduction
We start with the standard optimization problem and progressively increase the number of
constrains which would make our case similar to a real life portfolio optimization problem.
a) The first case consists of minimizing risk while maximizing return at the same time subject to
a constraint that constituent weights add up to 1.
b) The second case is basically an extension of the first problem subject to additional constraints
like limiting the number of assets to be invested in and applying lower and upper bounds on the
investment in any particular asset.
In either case short selling of assets has been restricted by applying the condition that all the
weights should be greater than 0.
For solving the first problem, we used a quadratic programming optimization technique
wherein we tried to generate the efficient frontier for the unconstrained case. We obtain a

continuous curve in this case but this does not correspond to the actual real life problem of
tactical asset allocation.
For solving the second problem, a mixed integer programming technique was used in
addition to 3 heuristic algorithms. The three algorithms yielded different results and resulted in
different time complexities for the same data sets. We also were careful in our selection of upper
and lower bounds for all the five portfolios. At first we selected the lower bound as 0.01 and
the upper bound as 1, however we find that the upper and the lower bound may be set
according to the risk preference of investors, for example a risk averse investor would be more
interested in diversification and hence would not like to limit his exposure to only a few assets.
In that case we might assign a minimum weight (say 0.01) to each stock out of the basket of
assets. On the other hand we can have another investor who might be very risk- taking and hence
would also not be shy in taking exposure to a single or few assets generating high returns. Taking
these factors into account we might simulate our optimization for a number of such cases and try
to generate the best possible efficient frontier for all such scenarios.
We also notice from our results a small kink for all the data sets in the cardinality constrained
efficient frontier which suggests that our efficient portfolio might contain assets with a similar
return profile thus giving us points of non-differentiability in the frontier.
3. Formulation
Let us define our portfolio as follows:
N is the number of assets to choose from
Ri is the expected return of the ith asset
σij is the covariance between the ith and the jth asset
R* is the desired expected return
0≤wi≤1, wi is the proportion held in each asset and i=0,1,2,3……N
Now the Unconstrained Efficient Frontier is the curve which provides the investor the best
possible return at a given level of risk tolerance. Therefore according to desired risk-tolerance of
the investor, the portfolio manager can desire to choose assets in such a way that his return at
that given risk level is maximum.
This is represented by the following equation:-
Minimize Σσijwiwj

i=0,1,2,3….N
subject to Σri wi = R*
It is generally convenient to solve this equation by introduction of a weighing parameter λ (0≤ λ
≤1).This is also our first objective in the given problem statement and formulation consists of
minimizing risk while maximizing return according to the given equation. This is also known as
the unconstrained case.
Here λ is chosen from 0 to 1 in steps of 1/2000.
The value λ=0 is the boundary condition representing the case where we are maximizing return
and this therefore simply corresponds to choosing the asset with the highest return. On the
other hand the other extremum of λ=1 corresponds to minimizing risk which can be done by
diversification of our portfolio by simply choosing a large number of assets for the given pool.
However the actual challenge to arrive at the most efficient trade-off between risk and return
which corresponds to choosing λ between the two extremes.
The actual and more realistic application of portfolio optimization consists in minimizing this
equation subject to the following additional constraints where the number of assets to be chosen
is finite out of a given pool and there are upper and lower bounds for investment in each asset
These conditions make the above problem more practical and make it a cardinality constrained
efficient frontier problem which we shall choose to call CCEF. This is the second formulation of
the problem statement

Here λ is chosen from 0 to 1 in steps of 1/2000.
4. Solution
We tried several approaches to solve both the cases, part (A) and part (B). For the first case, i.e.
part (A), we used a quadratic programming approach.
5. Quadratic Programming
Here we are given the problem of minimizing risk on an asset while maximizing returns for any
number of given assets. According to the problem given we have run our algorithm on five
different data sets. The rate of return of asset is a random variable with expected value ri. The
problem is to find what fraction wi to invest in each asset i in order to minimize risk, subject to a
specified minimum expected rate of return.
Minimise f(x) = λ Σσijwiwj - (1- λ) Σriwi
Where the constrains are:-
Σwi=1
0≤wi≤1 and i=0, 1, 2, 3…….N
Our objective is to minimize portfolio risk and the formulation is quadratic, and the constraints
are linear, the resulting optimization problem is a quadratic program, or QP.
The plots obtained in MATLAB using quadratic programming are presented as follows:-
We expected to find a continuous curve for the unconstrained case and the plots obtained were in
agreement with our expectation. Using the value of risk and return obtained we generated our
efficient frontier for the unconstrained case. For all the plots λ=0 corresponds to the right hand
side of the graph because at this value our objective function aims to maximize return while λ=1,
corresponds to the left hand side of the graph because at this value we tend to minimize the risk
function.
Observations
1) For the values of risk-return generated for n=31, we observe no significant variation in
values of risk and return upto 6 decimal places for about λ=0.3415.
2) For the values of risk-return generated for n=85, we observe no significant variation in
values of risk and return upto 6 decimal places for about λ=0.1485

3) For the values of risk-return generated for n=89, we observe no significant variation in
values of risk and return upto 6 decimal places for about λ=0.4255
4) For the values of risk-return generated for n=98, we observe no significant variation in
values of risk and return upto 6 decimal places for about λ=0.1075
5) For the values of risk-return generated for n=225, we observe no significant variation in
values of risk and return upto 6 decimal places for about λ=0.1150
Interpretation
We conclude that at low values of the risk-aversion factor λ, the change in return obtained on
changing the values of risk is not much, however as we increase the value of the risk-aversion
factor, we find that change in return per unit variation of risk is greater. Also the continuous
nature of the curve can be attributed to the absence of constraints such as no restriction on the
number of assets and no upper and lower bound on investment.
0
0.002
0.004
0.006
0.008
0.01
0.012
0 0.001 0.002 0.003 0.004 0.005 0.006
Re
turn
Risk
Unconstrained Efficient Frontier (n=31)
0
0.002
0.004
0.006
0.008
0.01
0.012
0 0.0005 0.001 0.0015 0.002 0.0025 0.003
Re
turn
Risk
Unconstrained Efficient Frontier (n=85)

0
0.001
0.002
0.003
0.004
0.005
0.006
0.007
0.008
0.009
0 0.0002 0.0004 0.0006 0.0008 0.001 0.0012 0.0014 0.0016
Re
turn
Risk
Unconstrained Efficient Frontier( n =89)
0
0.001
0.002
0.003
0.004
0.005
0.006
0.007
0.008
0.009
0.01
0 0.0005 0.001 0.0015 0.002 0.0025 0.003 0.0035
Re
turn
Risk
Unconstrained Efficient Frontier (n=98)
0
0.0005
0.001
0.0015
0.002
0.0025
0.003
0.0035
0.004
0.0045
0 0.0002 0.0004 0.0006 0.0008 0.001 0.0012 0.0014 0.0016 0.0018
Re
turn
Risk
Unconstrained Efficient Frontier (n = 225)

6. Mixed-Integer quadratic programming
The ‘quadprog’ solver in MATLAB can solve the simple quadratic programming problem.
However, in case constraints are added such as in formulation (B) quadprog is not useful. The
mixed integer programming MILP solver ‘intlinprog’ does handle discrete constraints.
Minimise λwTQw - rTw
The objective function which we aim to minimize is nonlinear. We have solved the mixed
integer formulation for part (B) using the MATLAB function intlinprog, however this requires
the objective function to be linear. Therefore below we try to transform our problem into a linear
objective function with non-linear constraints. We realize this through the use of a slack variable
z to represent our quadratic term.
Our problem then becomes
Minimise λz – rTw such that wTQw – z ≤ 0, z ≥ 0
As we solve for successive iterations, new linear constraints are introduced, each of these
approximates the non-linear constraints near the current local point. Specifically for z=z0+ λ,
where we assume z0 to be vector which is constant in magnitude .whereas δ is a variable vector
representing the first-order Taylor approximation to the constraint.
wTQw – z = woTQw + 2wo
TQδ – z + O(|δ|2)
Replacing δ by w=w0 gives us:-
wTQw – z = -woTQwo + 2 wo
TQw – z + O(|w-wo|2)
-wkTQwk + 2wk
TQw – z ≤ 0
For every intermediate solution wk, we introduce a new linear constraint in w and z as the linear
part of the expression above.
This now is in a form Aw<b where A=2wTQ, there is a -1 multiplier for the z term and b=
wTQw.
This method of adding new linear constraints to the problem greatly simplifies it.
The plots generated using mixed integer programming as presented as follows:-

0
0.002
0.004
0.006
0.008
0.01
0.012
0 0.0005 0.001 0.0015 0.002 0.0025 0.003 0.0035 0.004 0.0045
Re
turn
Risk
Mixed Integer Programming CCEF (n=31)
0
0.001
0.002
0.003
0.004
0.005
0.006
0.007
0.008
0.009
0.01
0 0.0005 0.001 0.0015 0.002 0.0025 0.003
Re
turn
Risk
Mixed Integer Programming CCEF (n=85)
0
0.001
0.002
0.003
0.004
0.005
0.006
0.007
0.008
0.009
0 0.0002 0.0004 0.0006 0.0008 0.001 0.0012 0.0014
Re
turn
Risk
Mixed Integer Programming CCEF (n=89)

0
0.002
0.004
0.006
0.008
0.01
0 0.0005 0.001 0.0015 0.002 0.0025 0.003
Re
turn
Risk
Mixed Integer Programming CCEF (n=98)
0
0.0005
0.001
0.0015
0.002
0.0025
0.003
0.0035
0.004
0.0045
0 0.0002 0.0004 0.0006 0.0008 0.001 0.0012 0.0014 0.0016
Ret
urn
s
Risk

Interpretation
We observe the graph for the constrained case to be discontinuous at some points. These imply
that there are certain values of the return which any rational investor would not consider as there
will always be points greater in return and lesser in risk at those points. Therefore there will
always be certain portions of the cardinality constrained efficient frontier that will be invisible
(mathematically) to an exact approach based on weighing. However we must realize that
imposition of these practical constraints is what makes our case closer to reality.
7. Heuristic algorithms
Heuristics are used for solving a problem whenever classical approaches turn out to be too slow.
In the field of algorithmic finance where stocks in a portfolio are being changed very rapidly,
getting a solution quickly assumes as much importance as the solution itself. Therefore for
solving the above cardinality constrained problem, we resort to three heuristic algorithms, the
genetic algorithm, the taboo search and the simulated annealing algorithm. The solution
produced by these heurists may not be the best available at hand but they are accurate to a
reasonable degree and can be run on any system without consuming too much space and time,
thus their time complexity is really appreciable. All the heuristics outlined by us use a weighted
formulation because:-
a) Normally solving the weighted formulation leads to some portions of the Cardinality
Constrained Efficient Frontier being invisible and discontinues, however hysteric algorithms
solve this problem as they try to examine many possible solutions and hence it becomes possible
to gain information about such portions.
(b) Attempting to design a computationally elective heuristic that directly addresses the non-
weighted formulation is difficult because in a non-weighted case, the expected return on the
portfolio must be exactly R*.
Another reason that we change our approach for the second part of the problem is that it cannot
be solved by a simple quadratic formulation as it is an example of a mixed-integer programming
problem. The mean percentage error for the heuristic algorithms was below 3% suggesting that
did not have to compromise too much on the accuracy of results. It is also important to use more
than one heuristic and to pool their results before arriving at a conclusion.
8. Genetic Algorithm
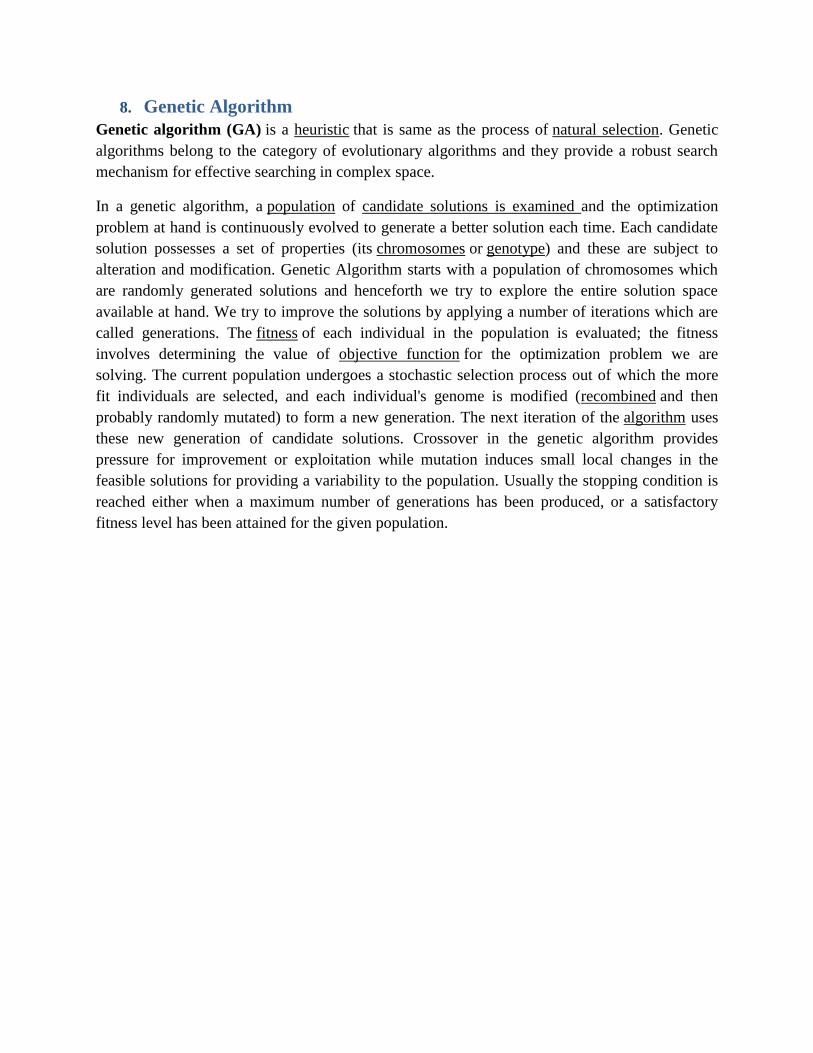
Genetic algorithm (GA) is a heuristic that is same as the process of natural selection. Genetic
algorithms belong to the category of evolutionary algorithms and they provide a robust search
mechanism for effective searching in complex space.
In a genetic algorithm, a population of candidate solutions is examined and the optimization
problem at hand is continuously evolved to generate a better solution each time. Each candidate
solution possesses a set of properties (its chromosomes or genotype) and these are subject to
alteration and modification. Genetic Algorithm starts with a population of chromosomes which
are randomly generated solutions and henceforth we try to explore the entire solution space
available at hand. We try to improve the solutions by applying a number of iterations which are
called generations. The fitness of each individual in the population is evaluated; the fitness
involves determining the value of objective function for the optimization problem we are
solving. The current population undergoes a stochastic selection process out of which the more
fit individuals are selected, and each individual's genome is modified (recombined and then
probably randomly mutated) to form a new generation. The next iteration of the algorithm uses
these new generation of candidate solutions. Crossover in the genetic algorithm provides
pressure for improvement or exploitation while mutation induces small local changes in the
feasible solutions for providing a variability to the population. Usually the stopping condition is
reached either when a maximum number of generations has been produced, or a satisfactory
fitness level has been attained for the given population.

Start
Random Initialization of Population
Fitness Evaluation
Elitism
Selection
Crossover
Mutation
Reshuffle the remaining
Population
Reshuffle
Condition
Reached?
Termination
condition reached? Elitism
Stop
Fitness Evaluation
Yes
No
No
No

0
0.002
0.004
0.006
0.008
0.01
0 0.0005 0.001 0.0015 0.002 0.0025 0.003
Re
turn
Risk
Genetic Algorithm ( n = 31)
0
0.001
0.002
0.003
0.004
0.005
0.006
0.007
0.008
0.009
0 0.0002 0.0004 0.0006 0.0008 0.001 0.0012
Re
turn
Risk
Genetic Algorithm (n=85)
0
0.001
0.002
0.003
0.004
0.005
0.006
0.007
0.008
0 0.0001 0.0002 0.0003 0.0004 0.0005 0.0006 0.0007 0.0008
Re
turn
Risk
Genetic Algorithm (n=89)

9. Tabu Search Tabu search, a metaheuristic search method employs local search methods which are generally used
for mathematical optimization. Local (neighborhood) searches employ a potential solution to a problem
and check its immediate neighbors (that is, solutions which are similar except for few minor details) in the
hope of finding an improved solution. This method uses the concept of an operator called “move” this
operator given a single starting solution generates a number of other solutions which are referred to as the
neighborhood of the starting solution. Local search methods often get stuck in suboptimal regions where
many solutions are deemed to be equally fit. Tabu search improves the performance of local search
techniques by relaxing its basic rule. First, at each step worsening steps are only accepted if no scope of
improvement is there (like when the search encounters a strict local minimum). In addition, inhibitions
(henceforth the term tabu) are employed to discourage the search from returning to previously-visited
solutions. Implementing Tabu search involves use of memory structures that describe the visited solutions
or user-provided sets of rules. A potential solution which we have already visited within a certain short-
term period or which has violated a certain rule, is considered as "tabu" (forbidden) so that
the algorithm does not consider that possibility again
0
0.001
0.002
0.003
0.004
0.005
0.006
0.007
0.008
0.009
0 0.0002 0.0004 0.0006 0.0008 0.001 0.0012
Re
turn
Risk
Genetic Algorithm (n=98)
0
0.001
0.002
0.003
0.004
0.005
0.006
0.007
0.008
0.009
0 0.0002 0.0004 0.0006 0.0008 0.001 0.0012
Re
turn
Risk
Genetic Algorithm (n=225)

10. Simulated Annealing
Simulated annealing (SA) is a probabilistic method which is used for approximating the global
optimum of any given function. More technically, we can also say that it is a metaheuristic to
approximate global optimization for a large search space. It is often used for cases when the
search space is discrete. In problems where finding the precise global optimum is of less
importance than finding an acceptable local optimum in a fixed amount of time, simulated
annealing therefore in such situations can be preferable to alternatives such as brute-force
search or the more popular gradient descent.
11. Error calculation
We calculated the error through the procedure outlined to us by using linear interpolation. For
each direction, we computed the percentage deviation error separately. Then we took the
minimum of these errors and computed the mean, median and standard deviation for our solution
using both mixed integer solver intlinprog and the three heuristic cases. The pseudocode for our
error calculation is as follws:-
Pseudocode uef: file containing weights of each assets for different values of lambda, net return and net risk for
unconstrained case
ccef: file containing weights of each assets for different values of lambda, net return and net risk for
constrained case
error: array of errors for each value of lambda
Begin:
for i = 1 to 2001:
do
initialise x_less_dist
initialise y_less_dist
initialise x_more_dist
initialise y_more_dist
y* = ccef[return] #the net return for ith value of lambda from ccef file
x* = ccef[risk] #the net risk for ith value of lambda from ccef file
for j= 1 to 2001
do
y = uef[return] #the net return for ith value of lambda from uef file
x = uef[risk] #the net risk for ith value of lambda from uef file
if yj < ys then
if y_less_dist > (ys-yj) then:
do
update y_less_dist
update xj
update yj

else
if y_more_dist >(yj-ys) then:
do
update y_more_dist
update xk
update yk
x** = xk + (xj-xk)((y*-yk)/(yj-yk)) #the horizontal error calculated for each value of λ

12. Comparing results
Number of assets Mixed integer GA heuristic
31 Median percentage
error
X 1.304 0.0165
Y 4.68 5.25
Min 1.298 1.35
Mean percentage
error
X 1.269 0.0202
Y 4.21 4.46
Min 1.20 1.45
Standard Deviation X 0.512 621
Y 2.43 4.78
Min 0.472 1.34
85 Median percentage
error
X 2.81 0.0123
Y 22.27 25
Min 2.81 3.878
Mean percentage
error
X 5.98 6.56
Y 34.97 38.89
Min 4.46 5.78
Standard Deviation X 13.06 17.332
Y 33.42 39.09
Min 7.02 9.02
89 Median percentage
error
X 1.12 2.0029
Y 1 2.34
Min 1 1.67
Mean percentage
error
X 4.12 6.0063
Y 1 2.34
Min 0.84 2.3
Standard Deviation X 9.67 11.672
Y 0 1.34
Min 0.27 1.40
98 Median percentage
error
X 1.49 2.0085
Y 11.49 14.67
Min 1.49 3.12
Mean percentage
error
X 5.51 7.0084
Y 16.51 19.45
Min 4.59 6.78
Standard Deviation X 12.16 15.879
Y 14.83 18.12
Min 8.96 10.12
225 Median percentage
error
X 0.73 1.0084
Y 3.36 4.89
Min 0.72 1.21
Mean percentage X 2.96 3.0085

13. Conclusion From our workings, we conclude that for the unconstrained case, a quadratic programming algorithm was
sufficient to generate the optimal solution. It was both accurate and time efficient. The three heuristic
algorithms are more or less similar in terms of the percentage deviation, although genetic algorithm
performed the better of the three. However the results for the mixed integer solver intlinprog using
MATLAB was better in terms of accuracy. But the important point to be kept in mind is that the running
time for the intlinprog solver is very large compared to the heuristic algorithms. In today’s world of
algorithmic trading where millions of dollars are made in seconds, time is as important a factor as
accuracy. Therefore, it depends upon the portfolio manager or the investor as to which parameter he gives
more importance, the runtime of the algorithm or the degree of accuracy. Depending upon this choice, the
optimal solution may be chosen. Another important point to note is that if we vary K, i.e., the number of
assets also here, the results will change.
Hence, the cardinality constrained efficient frontiers bring about a lot of change in the structure of the
algorithm.
error Y 5.85 6.78
Min 0.94 1.24
Standard Deviation X 10.11 71.220
Y 6.64 7
Min 1.21 2

14. References
1http://www.boente.eti.br/fuzzy/ebook-fuzzy-mitchell.pdf
2Fred Glover (1989). "Tabu Search - Part 1". ORSA Journal on Computing 1 (2): 190–206.
doi:10.1287/ijoc.1.3.190
3Kirkpatrick, S.; Gelatt Jr, C. D.; Vecchi, M. P. (1983). "Optimization by Simulated Annealing".
Science 220 (4598): 671–680
4Kennedy, J.; Eberhart, R. (1995). "Particle Swarm Optimization". Proceedings of IEEE
International Conference on Neural Networks.
5http://www.cse.ust.hk/~leichen/courses/comp630p/collection/reference-7-2.pdf
6http://arxiv.org/ftp/cond-mat/papers/0501/0501057.pdf
7http://www.cs.nott.ac.uk/~znzbrbb/publications/portfolio-cec14.pdf
8Speranza MG. A heuristic algorithm for a portfolio optimization model applied to the Milan stock
market.