portfolio construction in the presence of codependence risk
TRANSCRIPT

P I E R R E L A R O C H EB A N Q U E N A T I O N A L E D U C A N A D A
P I E R R E . L A R O C H E @ B N C . C A
B R U N O R É M I L L A R DH E C M O N T R É A L
B R U N O . R E M I L L A R D @ H E C . C A
1 6 M A I 2 0 1 6
Portfolio Construction in the Presence of Codependence Risk
Atelier de résolution de problèmesen Finance et Assurance
Math in Investment Strategies2

A Macro* view at Portfolio Construction:Generalities
On macroeconomic shifts (or Regimes), asset class returns and dependence risk:
Variations in expected inflation, expected growth and aggregate risk aversion greatly influence returns of the main asset classes (Money Market securities, Fixed Income securities, Equities and Commodities)
The dependence between returns of asset classes depends on these variations (see graph next page) from current “regime”
This dependence risk is hence very important in portfolio management… but it is not that well modeled
3
* By « Macro » we mean what many refer to as Financial Macroeconomics

4
InflationSurprises
Up
InflationSurprises
Down
GrowthSurprises
Down
RiskAversion
Rises
RiskAversion
Diminishes
GrowthSurprises
Up
A Macro view at Portfolio Construction:A Simple Market Regime Framework

5
Inflation Surprises Up
Inflation Surprises Down
GrowthSurprises
Down
GrowthSurprises
Up
Best: Commodities2nd: Equities3rd: Money MarketWorst: Bonds
Regime 1
Best: Bonds2nd: Money Market3rd: EquitiesWorst: Commodities
Best: Equities2nd: Bonds3rd: CommoditiesWorst: Money Market
Best: Money Market2nd: Commodities3rd: BondsWorst: Equities
“Equities for recoveries,
Bonds for crises”
A Macro view at Portfolio Construction:A Simple Market Regime Framework
Regime 4Regime 3
Regime 2
6
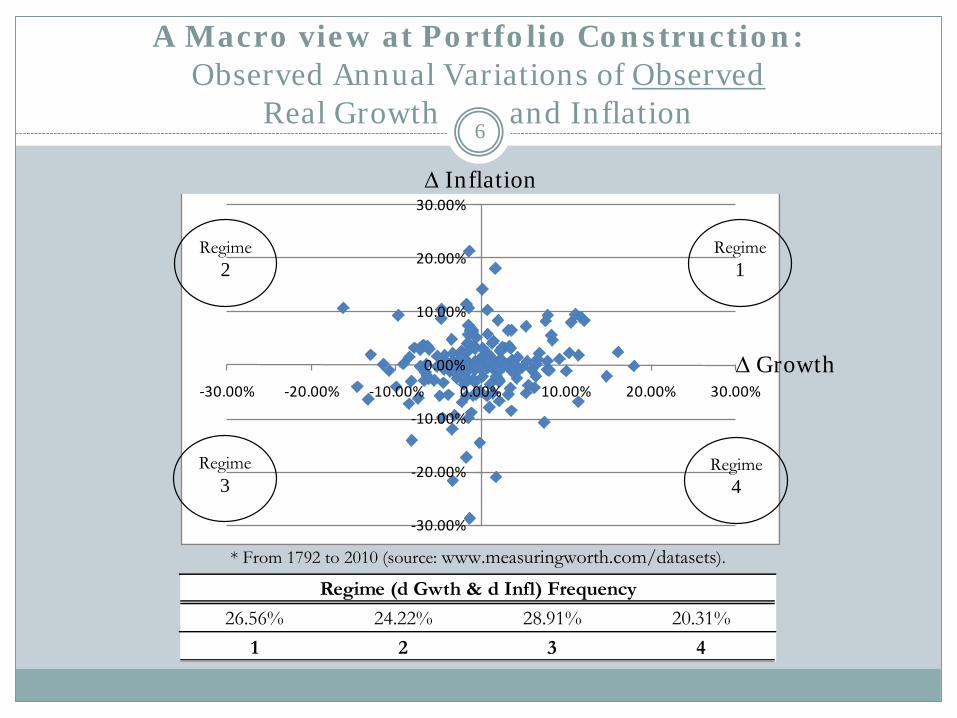
A Macro view at Portfolio Construction:Observed Annual Variations of Observed
Real Growth and Inflation
-30.00%
-20.00%
-10.00%
0.00%
10.00%
20.00%
30.00%
-30.00% -20.00% -10.00% 0.00% 10.00% 20.00% 30.00%
* From 1792 to 2010 (source: www.measuringworth.com/datasets).
Regime 1
Regime 2
Regime 3
Regime 4
∆ Growth
∆ Inflation
26.56% 24.22% 28.91% 20.31%1 2 3 4
Regime (d Gwth & d Infl) Frequency
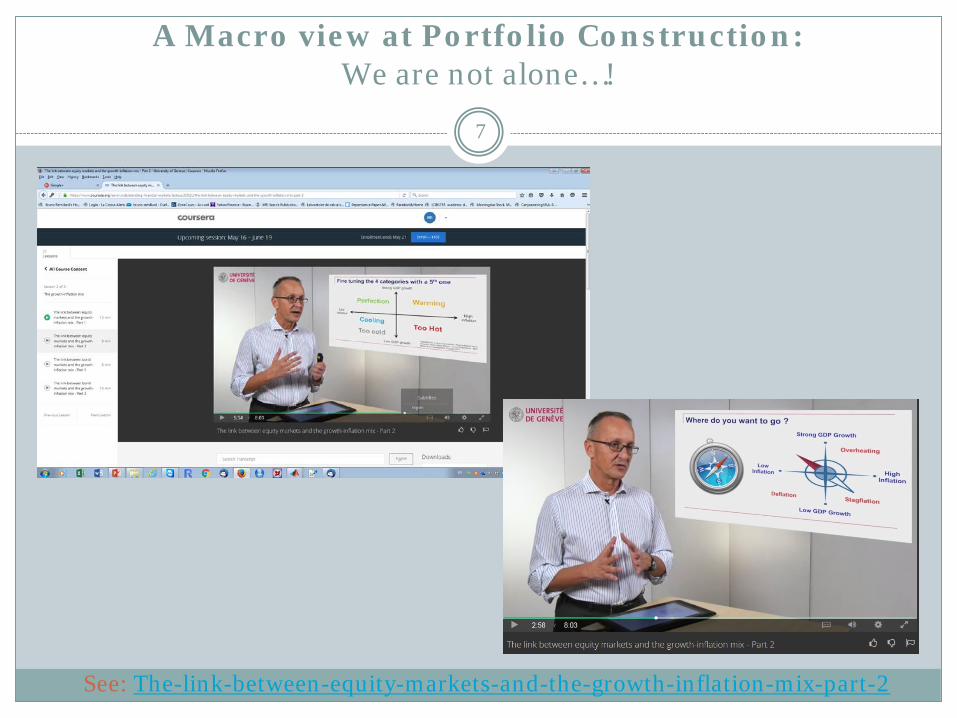
See: The-link-between-equity-markets-and-the-growth-inflation-mix-part-2
7
A Macro view at Portfolio Construction:We are not alone…!

8
A Representation of Codependence risk:Equity Outperformance vs. Bonds
See: The-link-between-equity-markets-and-the-growth-inflation-mix-part-1
9
-0.600
-0.400
-0.200
0.000
0.200
0.400
0.60018
8318
8918
9519
0119
0719
1319
1919
2519
3119
3719
4319
4919
5519
6119
6719
7319
7919
8519
9119
9720
0320
09
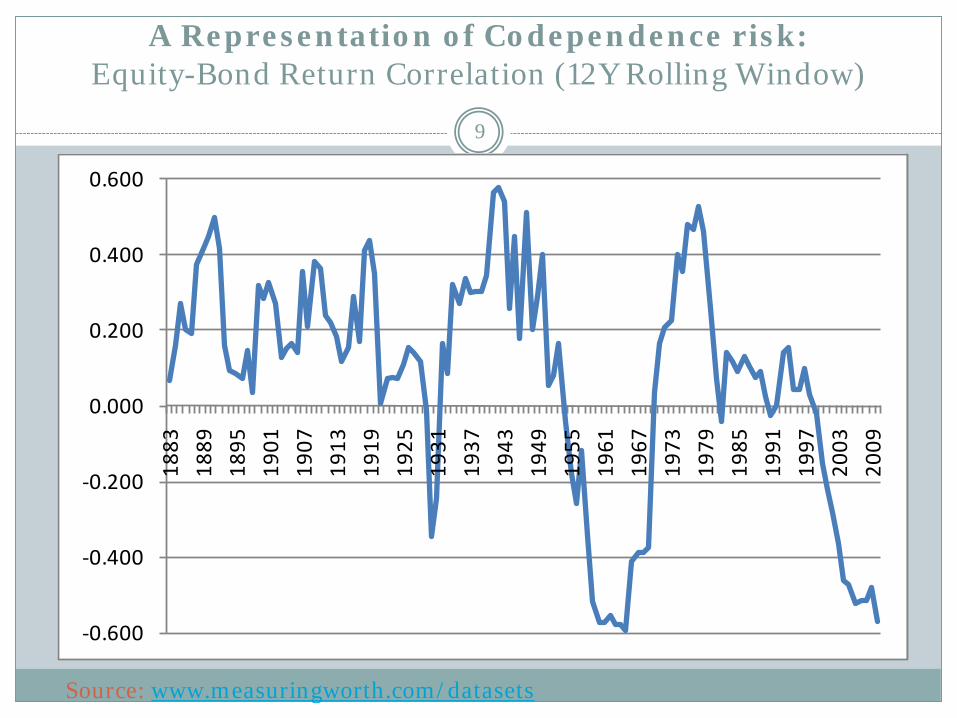
Source: www.measuringworth.com/datasets
A Representation of Codependence risk:Equity-Bond Return Correlation (12Y Rolling Window)
10
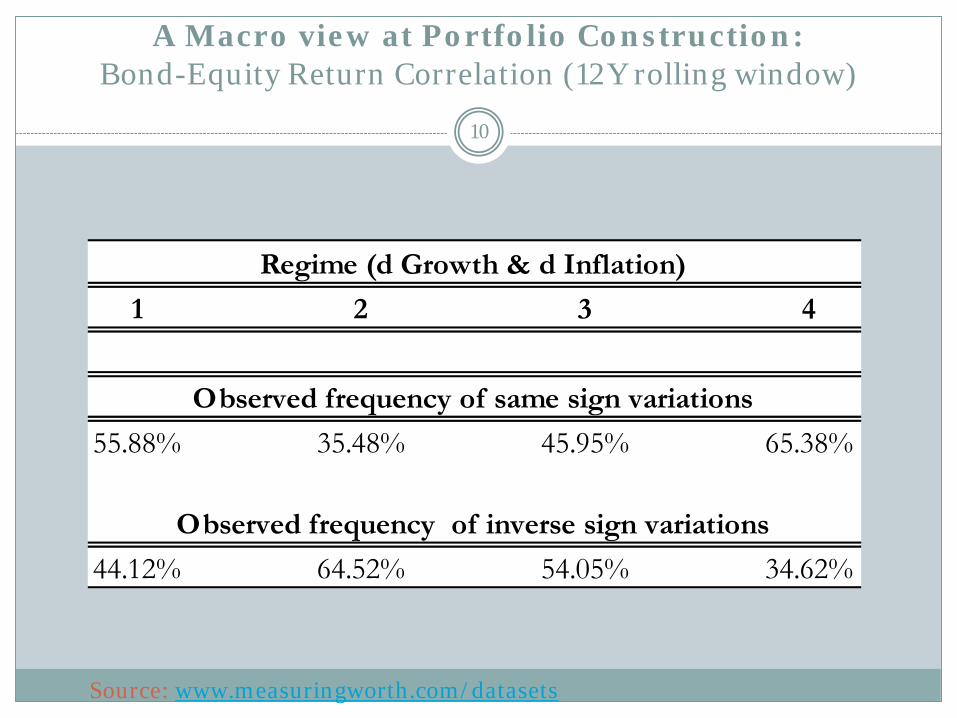
A Macro view at Portfolio Construction:Bond-Equity Return Correlation (12Y rolling window)
1 2 3 4
55.88% 35.48% 45.95% 65.38%
44.12% 64.52% 54.05% 34.62%
Regime (d Growth & d Inflation)
Observed frequency of same sign variations
Observed frequency of inverse sign variations
Source: www.measuringworth.com/datasets
11
A Macro view at Portfolio Construction:Main Challenges
Codependence Risk is significant. Here are the challenges to properly integrate it in Portfolio Construction models:
o Changes in expected inflation and expected growth are difficult to measure, especially over short periods (hence the need of “nowcasting”)
o Aggregate Risk Aversion is an even bigger problem: it is not well defined (hence more difficult to measure as well).
o When one builds a portfolio, she/he must forecast returns, volatility and codependence. The existing literature on the latter is not developed well enough for practical applications
12
o Build correlation models and forecasting techniques that incorporate macroeconomic explanatory variables like inflation, growth, market volatility and measures of aggregate risk aversion, in the context of a stock-bond portfolio construction
o Go beyond correlations by looking at dependence models (e.g. copulas), which provide a more general measure of codependence of asset returns
o Try to apply the findings to the case of a simple Equity-Bond Global Macro hedge fund strategy
o Document the “value added” by the proposed codependence forecasting model
Modeling Codependence Risk:Objectives

Observable data and frequency:
o Government Bond Futures (continuous contracts ; daily)
o Equity Index Futures (continuous contracts ; daily)
o Recorded inflation rate (monthly)
o Recorded growth rate (monthly)
o Risk aversion (daily for market proxies)
13
Modeling Codependence Risk:Variables and Data
There have been attempts to estimate inflation in real time.
See MIT’s Billion Prices Project: http://bpp.mit.edu/
Example: the CNN Fear-and-Greed Index: http://money.cnn.com/data/fear-and-greed/

14
Non-observable data:
o Daily changes in growth expectations
o Daily changes in inflation expectations
The Philadelphia FED’s (quarterly) survey of professional forecasters can be a good proxy:
https://www.philadelphiafed.org/research-and-data/real-time-center/survey-of-professional-forecasters/
Modeling Codependence Risk:Variables and Data

15
Appendix:What is a Global Macro Investment Strategy (GMIS)?
o Invests in all main asset classes
o If restrained to « Long Only », such strategies are often referred to « Tactical Asset Allocation ». Global Macro Hedge Funds go « Long » or « Short »
o Decisions to go Long or Short may be Discretionary (based on the Portfolio Manager’s « documented intuition ») or Systematic (based on mathematical models – no human input except for the design of the strategy)
o Most of the time uses Futures contracts to maintain a high level of liquidity

16
Appendix:Example of a Systematic GMIS portfolio
Bond Futures Exposure (%) Commodity Futures Exposure (%) FX and Equity Futures Exposure (%)US 2YR Note Futures -2.50% Crude Oil Futures -0.40% USD/CAD Futures 0.44%
AU 3YR Bond Futures 4.69% Gas Futures -0.66% USD/GBP Futures -1.03%
US 10YR Note Futures 4.86% Heating Futures 0.67% USD/JPY Futures -0.33%
CAN 10YR Bond Futures 7.52% Gold Futures 0.00% USD/AUD Futures 0.83%
Euro Bund Futures 23.32% Silver Futures 0.00% USD/EUR Futures -1.62%
JPY 10YR Bond Futures 24.35% Soybean Futures 0.91% USD/MXN Futures -2.50%
AU 10YR Bond Futures 6.35% Wheat Futures -0.07% USD/CHF Futures 0.00%
German Schatz -5.05% Copper Futures 0.00%MSCI Emerging Futures -14.36%
English Gilts 4.99% Brent Futures -0.82%S&P 500 Futures 21.59%
Corn Futures -0.84%Euro Stoxx 50 Futures 0.84%
Sugar Futures -0.11%FTSE 100 Futures -2.75%
Nikkei Futures 9.87%
Russells Futures -0.63%
Some references
o Buraschi, A., Porchia, P., Trojani , F. (2010). Correlation Risk and Optimal Portfolio Choice, The Journal of Finance, 65 (1), 393-420.
o Connolly, R., Stivers, C., Sun, L.. (2005). Stock Market Uncertainty and the Stock-Bond Return Relation, The Journal of Financial and Quantitative Analysis, 40(1), 161–194.
o Masih, R. (2012). Regime-Based Asset Allocation, Benefit & Pension Summit, Toronto, April 23-24. http://www.benefitscanada.com/wp-content/uploads/2012/04/DB-SESSION-1-Rumi-Masih.pdf
o Philips, C. B., Walker, D. J., Kiniry, F. M. (2012). Dynamic Correlations: The Implications for Portfolio Construction, Vanguard Research Group Research Paper, April.
o Rankin, E., Idil, M. S. (2014). A Century of Stock-Bond Correlations, Bulletin of the Reserve Bank of Australia, September Quarter, 67-74.
17