portfolio analysis based on the example … · standard deviation of portfolio returns. after him,...
TRANSCRIPT
UTMS Journal of Economics, Vol. 1, No. 1, pp. 39-52, 2010 S. Bogdan, S. Baresa, S. Ivanovic: PORTOFOLIO ANALYSIS BASED ON THE EXAMPLE OF...
39
Preliminary communication Received: 15.04.2010
PORTFOLIO ANALYSIS BASED ON THE EXAMPLE OF ZAGREB STOCK EXCHANGE
Sinisa Bogdan Suzana Baresa Sasa Ivanovic
University of Rijeka, Croatia1
Abstract: In this paper we analyze the portfolio that was selected from the Zagreb Stock Exchange and also try to assess its risks and its future offerings that are relevant in making the decisions about investments. Through the work we will explain the importance of diversification and how the very diversification reduces risk. We will also analyze the systemic risk of individual stocks within the portfolio and the systemic risk of the given portfolio and explain its importance. Through regression analysis we will analyze the securities with the highest and lowest systemic risk and will clarify the results. At the end we will explain the correlation in the selected portfolio and point out the importance of the correlation and diversification itself. Key words: portfolio, diversification, systemic risk, beta, regression analysis.
INTRODUCTION
The very beginning of portfolio analysis was laid by Markowitz. In this paper, we analyze selected portfolio composed of stocks that are listed on the Zagreb Stock Exchange, we comment the results given and explain their significance. Each investment in securities is estimated based on two basic points: the yield and risk, these two items depend on each other.
Without underwriting, it is impossible to acquire yield. There will always be
risk associated with investments, and the yield itself will always be different; real from
1 Sinisa Bogdan, M.A, Assistant,, Suzana Baresa, M.A., Assistant, Sasa Ivanovic, M.Sc., Postgraduate student, Faculty of Tourism and Hospitlity Management in Opatija, University of Rijeka, Croatia.

UTMS Journal of Economics, Vol. 1, No. 1, pp. 39-52, 2010 S. Bogdan, S. Baresa, S. Ivanovic: PORTOFOLIO ANALYSIS BASED ON THE EXAMPLE OF...
40
expected. There are two basic types of business risk: systematic and specific risk. The paper will also deal with evaluation of the systemic and specific risks and factors that significantly affect the very quality of the results. In addition to the assessment of risk we will explain the importance of diversification and correlation bond within the portfolio.
MODERN PORTFOLIO THEORY
Before we briefly explain some of the basics of modern portfolio theory, we will first define the meaning of the term portfolio. The portfolio represents a set of investors’ property. By the decision on the allocation of assets the investor chooses the asset type. Assets can be categorized in many classes such as equity securities, debt securities, real estate, merchandise, etc.
In 1952 Harry Markowitz published an article "Portfolio Selection" and there
he described the composition of optimal portfolio in terms of market uncertainty. Markowitz discovered how to create a frame for the optimal or efficient portfolio, expecting highest possible rate of return for the default risk which is measured as the standard deviation of portfolio returns. After him, in the year 1963 Sharp readjusted Markowitz formula and created a model which is today called Single index model. After these discoveries, fundamental analysis was no longer needed.
According to Markowitz, only one possible combination has the maximum
possible rate of return for each level of risk and that combination is called efficient. The theory itself is based on fundamental assumptions that say that investors have an aversion towards risk and they act rational. The function of utility determines the behaviour of investors, portfolio as a whole is the deciding factor, which means it is collective that makes it, and not individual security. The problems that arise by applying modern portfolio theory to transitional markets such as the Croatian market are: short time of existence of securities on market and insufficiently long time series that are used in calculating the indicators.
THE RISK OF CHANGES IN STOCK PRICES
Risk is defined as the dispersion of the probability distribution of events whose value was anticipated.2 Investors are faced with numerous risks, such as: tax risk, market risk, credit risk, political risks, liquidity risk, exchange rate risk and others.
One of the main motives to buy securities, in our case the stocks is yield. The
yield represents a yield from increase of the share price and yield of dividend payments. Many investors are concerned with estimates of prices of securities calculating, fundamental analysis of individual companies, studying technical analysis, addressing the macroeconomic indicators, reading the news everyday and trying to figure out which direction price movement will take some securities. It takes a good
2 Zoran Ivanovic, Financial Management, the second amended and revised edition, University of Rijeka, Faculty for Tourism and Hotel Management, Opatija, 1996.

UTMS Journal of Economics, Vol. 1, No. 1, pp. 39-52, 2010 S. Bogdan, S. Baresa, S. Ivanovic: PORTOFOLIO ANALYSIS BASED ON THE EXAMPLE OF...
41
knowledge of microeconomics and macroeconomics in order to determine the general location of a company in addition to try to predict future price movements. Investors make decisions themselves between non-risk investments and risk investments, if we are given the opportunity to invest money and achieve risk-free rate of 5% or invest money and pursue a risky rate of 12% then we can conclude that our risk premium in this case is 7%, and on this particular risk premiums investors are planning to make additional profits. Expected return = non-risk rate of return + risk premium. Risk premium is paid to only one risk and that is on the systematic apropos systemic risk which is measured by beta.
Different bonds have different levels of risk; exactly the presence of risk
complicates the selection of securities. In order to successfully manage the risk an investor must be able to measure it, what was a problem in the past, but today thanks to the availability of data is no longer the case.
SYSTEMIC AND SPECIFIC RISK
Systemic risk implies the market risk that is the risk that comes from macroeconomics and cannot be eliminated with diversification. Systemic risk is closely linked to conditions on capital markets, is determined by factors related to its environment in which the securities are located (e.g. events on market such as changes in market interest rates, general recession, natural disasters, wars, political events, economic growth and so significantly affect the entire market regardless of which activities particular value of securities belong to).
Specific risk is also called nonsystematic or diversification risk and is influenced by some specific characteristics of certain companies or certain activities that is all those factors of value which are under the direct control of the company. That risk can be removed by holding assets from different sectors of the economy in diversification portfolio. When you combine a large number of stocks in the portfolio, and sources of risk are independent, the impact of good news will be reflected on individual stocks also the impact of bad news will be reflected on individual stocks, that is what we call the Specific Risk. That diversification of portfolio will be achieved by the elimination of a specific risk, because our portfolio will not depend on one sector such as construction.
In systemic risk emersion of some negative news will affect the entire market
and also on our portfolio. Suppose we want to invest 100 000 HRK in securities. If we invest all our money in only one security as IGH-R-A our yield or loss will depend solely on the movement of share price of the company IGH-R-A, systemic and specific risk (enterprise development, management, the demand for services and products, etc.) will influence on the price of movement of stock. But if you invest the same amount of money in one company instead of in several companies that will alleviate if not completely eliminate the specific risk of our portfolio. It is important to also determine the correlation within the selected stocks, if it is smaller or even negative this indicates that the portfolio is well diversified.

UTMS Journal of Economics, Vol. 1, No. 1, pp. 39-52, 2010 S. Bogdan, S. Baresa, S. Ivanovic: PORTOFOLIO ANALYSIS BASED ON THE EXAMPLE OF...
42
DESCRIPTION OF PORTFOLIO
Securities of which portfolio will be composed are ordinary shares that are listed on the Zagreb Stock Exchange. In selecting stocks for the portfolio, several criteria was combined, among which the most important one was sufficient liquidity of the chosen shares, and long enough time series which was observed (observed time series was from 26.03.2008. till 01.03.2010. which is the total of 106 inputs on the selected stock) weekly returns were observed which were calculated based on closing prices.3 Selected stocks are members of the official index of the Zagreb Stock Exchange CROBEX ® and as such they meet all the criteria which exist for inclusion in the index itself, one of which is the main one that the share was traded more than 90% of the total trading days in the last six months.
In our example we have selected stocks from the sectors of trade, transport and
communications, industry, construction and food industries. The table below shows a list of stocks with the symbol of each issuer and the market where quoted.
Table 1: Selected portfolio
Simbol Issuer Market 1 ATGR-R-A Atlantic grupa d.d. Regular market
2 ATPL-R-A Atlanska plovidba d.d. Official Market
3 DLKV-R-A Dalekovod d.d. Official Market
4 ERNT-R-A Ericsson Nikola Tesla d.d. Regular market
5 HT-R-A HT -hrvatske telekomunikacijed.d. Official Market
6 IGH-R-A Institut IGH d.d. Official Market
7 INA-R-A INA-Industrija nafte d.d. Official Market
8 INGR-R-A INGRA d.d. Official Market
9 JDPL-R-A Jadroplov d.d. Regular market
10 KRAS-R-A Kraš d.d. Regular market
Source: Official website of the Zagreb Stock Exchange (www.zse.hr) ESTIMATION OF EXPECTED PORTFOLIO RETURN When selecting the portfolio investors prefer to decide for those portfolios
with the highest expected return and lowest volatility. In the calculations of expected returns, we will use the observed period of (106) weeks. We will use the arithmetic middle in estimating future returns because it gives us more accurate assessment from the geometric middle of return, which is widely used for measuring than the average of past returns. We use below mentioned formula for calculation of arithmetic middle for return of weekly periods of each stock:
3 Dividends are not included in the yields of shares.
UTMS Journal of Economics, Vol. 1, No. 1, pp. 39-52, 2010 S. Bogdan, S. Baresa, S. Ivanovic: PORTOFOLIO ANALYSIS BASED ON THE EXAMPLE OF...
43
R1n R R R R
Ri= the average return on stock i n = number of periods (106 weeks) Rit= return on equities for the period t The expected rate of return on the portfolio is calculated in a manner that the
expected rate of return on shares multiplied by the stock shares and the values obtained are added together. Every stock is participating, with equal share in the portfolio. Computationally shown:
R w R
= the expected rate of portfolio
wi = proportion of shares and securities in the portfolio m = number of shares in the portfolio Ri= the expected rate of return on shares
DIVERSIFICATION OF PORTFOLIO
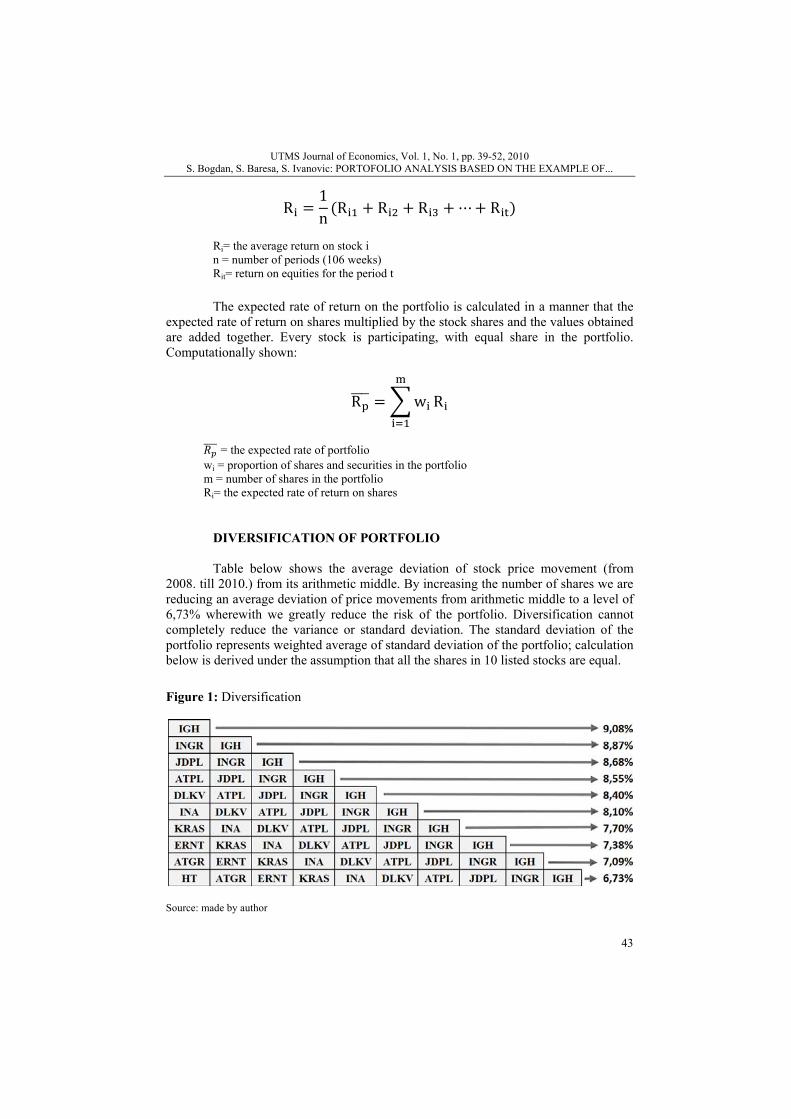
Table below shows the average deviation of stock price movement (from 2008. till 2010.) from its arithmetic middle. By increasing the number of shares we are reducing an average deviation of price movements from arithmetic middle to a level of 6,73% wherewith we greatly reduce the risk of the portfolio. Diversification cannot completely reduce the variance or standard deviation. The standard deviation of the portfolio represents weighted average of standard deviation of the portfolio; calculation below is derived under the assumption that all the shares in 10 listed stocks are equal.
Figure 1: Diversification
Source: made by author

UTMS Journal of Economics, Vol. 1, No. 1, pp. 39-52, 2010 S. Bogdan, S. Baresa, S. Ivanovic: PORTOFOLIO ANALYSIS BASED ON THE EXAMPLE OF...
44
Based on the illustration4 above we see that the standard deviation for each share amounts to 9.08% by further increasing the number of shares, standard deviation gradually decreases, that is by adding securities we decrease the specific risk of the portfolio what can be seen in the decline to a certain limit, after which we cannot reduce with a further diversification5 or further inserting additional shares in the portfolio. When stocks are perfectly correlated diversification has no effect. The most famous saying of diversification is "Don’t put all the eggs into one basket." Proverb advises investors to rather have several different securities, but to invest the entire capital into one single security.
MEASUREMENT OF SYSTEMIC RISK Systemic risk of stocks is measured by the beta coefficient. Beta based on
historic data, shows movement of stocks (stock volatility) compared to index market with which it is being compared to, that is beta shows tendency that individual security variant with the market. When the market is on the rise, the returns of most stocks are also on the rise, and vice versa, but with the help of beta quotient we’ll try to quantify that relationship. The higher beta stock the greater the impact of variation yield of the entire capital market on yields of that stock, i.e. beta measures how systemic risk affects the yield of individual stocks. Possible calculations of beta quotient which can be obtained by including in the formula:
β = 0 indicates that the share does not follow the movement of the index
with which is being compared to β = 1 indicates that the share follows the movement of the index with
which is being compared to β = < 0 indicates that the beta is inverse in relation to an index with which is
being compared to β = >1 indicates a greater risk of the share itself (stocks achieves higher ups
and downs in relation to an index with which it is being compared to, for the obtained value), such shares are also called the aggressive stocks because they rise and fall faster than the market itself
0< β <1 indicates a lower risk of the share itself (share achieves smaller rises and falls in relation to an index with which it is being compared to, for the value obtained), such shares are called defensive stocks.
βcov R , Rσ Rm
Βj = Beta coefficient of stock cov [Rit, Rmt] = covariance of returns on stocks and the market index σ2[Rm] = variance of returns on market portfolio
4 For reasons of convenience in this illustration marks –R –A, that signify regular stock, are not written. 5 We've taken an example of 10 shares, for convenience of easier calculation, thereby the limit has not been achieved in the case of only 10 stocks used.
UTMS Journal of Economics, Vol. 1, No. 1, pp. 39-52, 2010 S. Bogdan, S. Baresa, S. Ivanovic: PORTOFOLIO ANALYSIS BASED ON THE EXAMPLE OF...
45
Beta can be calculated as the covariance of security yield and market indexes in relation to the variance of market index. Investors who want to achieve higher yields than average also have to accept higher risk, and with it the higher the beta coefficient. The biggest deficiency in beta coefficient is that coefficient itself is not constant6. If we could receive constant beta coefficient then we would have pre-planned movement of the stock price in relation to an index for all securities that are in our area of interest. If we have two or more securities that have similar refund we will decide for those securities which have lower volatility compared to the other.
It is important to say also that the amount of beta depends on several factors
that are taken in the calculation, the market index with which we compare (in beta estimates for stocks data can be comparable with the index CROBEX® and CROBEX® 10) for the domestic market by comparing the length of interval7 (daily, weekly, monthly, etc.), by comparing the length of time (we use it to evaluate the data of 1, 2, 3 or more years), return which we calculate (if we use only changes in the price of shares or with the dividend).
PROBLEMS PRESENT IN THE CALCULATION OF BETA COEFFICIENT ON THE CROATIAN MARKET The main problems that occur when calculating the beta coefficient are not
enough liquid stocks. Risk of non liquid is defined as very weak trading which is reflected in low turnover, resulting in individual stock price correction with very small amounts, and stock trading takes place at intervals that can be up to several weeks, or almost no trading in individual securities. If we are to assess systemic risk in a number of shares, the problem could mean just under-trading individual stocks, which brings into question the quality of data. One way to reduce the impact of nonsynchronous trading is to replace the missing data for certain calculations.
The risk of non liquidity can be measured by observing the gap between the
buying and selling price (bid-ask spread). If we compare the stock exchange in year 2008 in relation to the year 2009 we could conclude that the traffic is almost halved, liquidity of four most liquid shares of 2009 (HT, Atlantic voyage, IGH and Dalekovod) have achieved a cumulative turnover bigger than all the other listed shares together, despite poorer liquidity of the Croatian market, trading happened on daily basis for the selected stocks from the portfolio.
CALCULATION OF THE VARIANCE AND STANDARD DEVIATION The calculated variance is a common measure of risk on stocks in the portfolio
theory; it represents the arithmetic middle of square deviation of values of numerical variables from its arithmetic middle. In the group of measures of dispersion variance 6 Tofallis, C. (2008) Investment volatility; a critique of standard beta estimation and a simple way forward. European Journal of Operational Research, Vol 187, Issue 3, pp. 1358-1367 7 The shorter the interval that we are using, the bigger imprecision of beta is possible because of the error that comes due to of lack of liquidity of shares, on financial markets that are not sufficiently developed.

UTMS Journal of Economics, Vol. 1, No. 1, pp. 39-52, 2010 S. Bogdan, S. Baresa, S. Ivanovic: PORTOFOLIO ANALYSIS BASED ON THE EXAMPLE OF...
46
has the same importance as the arithmetic middle in the group of middle values. Risk and standard deviation are directly proportional.8 The formula to calculate the variance of individual stocks is shown below:
σn
n 1r rn
Standard deviation is also calculated as the second positive root of the
variance, and it represents an average deviation of values of the numerical variable from its arithmetic middle. The higher standard deviation, the greater is the possible deviation from the expected rates of return, that is, the lower standard deviation, the greater the likelihood that the actual rate of return will be closer in relation to the expected rate of return, and thus lower risk.
Table 2: Individual analysis of portfolio stocks
Source: Author’s calculation
Values given in the above mentioned table are calculated based on weekly returns for last two years, 106 data is used in the calculation with weekly changes of closing stock prices in the period between 19. March 2008 and 31. March 2010.
Based on the displayed tables we can conclude due to β and σ that the highest
risk has the stock IGH (β = 1, 49 σ = 0.0908), lowest risk based on two previously noted symbols has the stock HT (β = 0.4862 σ = 0.0355). Ri indicator represents the average yield of “i” stock, from a table we can conclude that 80% of the shares from the portfolio make loss. Stock with the highest average yield is HT-a 0.07% share, stock which achieves the highest average loss is a stock INGR-e -1.23%.
The average return is computed by arithmetic middle. Beta portfolio is a
simple weighted average beta of the portfolio, share of all shares are equal. Beta for the selected portfolio would amount β = 1.0735, also the standard deviation for the selected portfolio would amount σ = 0.0673, variance for a selected portfolio would amount σ2
8 Brano Markic, Optimizacija portfolija i evolucijski algoritmi, Informatologia, Vol.41.No.4, 2008, p.266
ATPL ATGR DLKV ERNT HT IGH INA INGR JDPL KRAS
ALPHA 0,0019 0,0029 -0,0006 -0,0008 0,0028 -0,0025 0,0046 -0,0059 -0,0016 0,0003
BETA 1,3670 0,7040 1,3922 0,8142 0,4862 1,4942 1,0125 1,4771 1,4253 0,5624
σ2 0,0067 0,0023 0,0060 0,0026 0,0013 0,0083 0,0044 0,0075 0,0069 0,0028
σ 0,0816 0,0475 0,0777 0,0513 0,0355 0,0908 0,0660 0,0866 0,0831 0,0533
Ri -0,41% -0,01% -0,67% -0,44% 0,07% -0,90% 0,02% -1,23% -0,78% -0,21%

UTMS Journal of Economics, Vol. 1, No. 1, pp. 39-52, 2010 S. Bogdan, S. Baresa, S. Ivanovic: PORTOFOLIO ANALYSIS BASED ON THE EXAMPLE OF...
47
= 0.0049.9 It depends on beta itself how much will individual stock contribute to the risk of the selected portfolio, and accordingly achieving the investors wishes.
REGRESSION ANALYSIS
Using simple regression analysis we will examine the dependence of one
variable on another variable. With model of simple regression statistical relationship is being expressed between the two phenomena presented by the values of numerical variables. The model contains one dependent and one independent variable.10 From the data we will use weekly returns from the last two years of trading individual stocks compared with the official index of the Zagreb Stock Exchange CROBEX®. The variables whose variations are explained with the help of the other variables are termed dependent variables, in our case the dependent variable is the yield of the share price while the weekly yield of CROBEX® represents the independent variable.
The purpose of calculating the regression model is predictive. For the
calculations we took those securities which synchronous equalize in each n-period with the independent variable CROBEX®. Equation for the line of regression line was determined when we have defined the variables α and β. Beta represents the regression coefficient, which tells how the changes in the average yield rate of shares for each unit increase in independent variables. For example, if we change CROBEX® stock index by 2% and beta for selected stock is for example 3 that means that the stocks rate of return will change 6%, that is if change occurs in CROBEX® for 1% then the expected growth rate shares equals to α + β = α + 3% may therefore be higher or lower than 3% depending on the foretoken of α also if you do not reach the change of value of the index, then the expected change in stock price is equal to α.
Regression line itself does not show the actual yields precisely because it lacks
a variable ei that represents the residual specific surprise which is measured by the vertical distance between points on the scatter diagram and regression line.
R α β · R
The above equation represents the regression equation representing the
relationship between yields of security Ri and yield market Rm other variables are segments from αi, beta regression coefficient βi and residual (unexplained yield) of security ei which represents stochastic variable that demonstrates unsystematic influences on dependent variable. The total variability of returns of each security depends on two components, the sensitivity of stock on changes of Rm which is measured with the βi and the variance which is associated with the specific factors of the company which is measured by ei.11
9 Root of this amount should be the standard deviation which is different because the amount obtained is rounded. 10 Ivan Sosic, Statistika, drugo izmijenjeno i dopunjeno izdanje, Sveuciliste u Zagrebu, Skolska knjiga, 2004, p.388-389 11 Zvie Bodie, Alex Kane, Alan J. Marcus, Počela ulaganja, cetvrto izdanje, Zagrebacka skola ekonomije i managementa, Mate, 2006, p. 207
UTMS Journal of Economics, Vol. 1, No. 1, pp. 39-52, 2010 S. Bogdan, S. Baresa, S. Ivanovic: PORTOFOLIO ANALYSIS BASED ON THE EXAMPLE OF...
48
R α β R e If we want to calculate ei the formula would be: Residual variance = actual - predicted amount
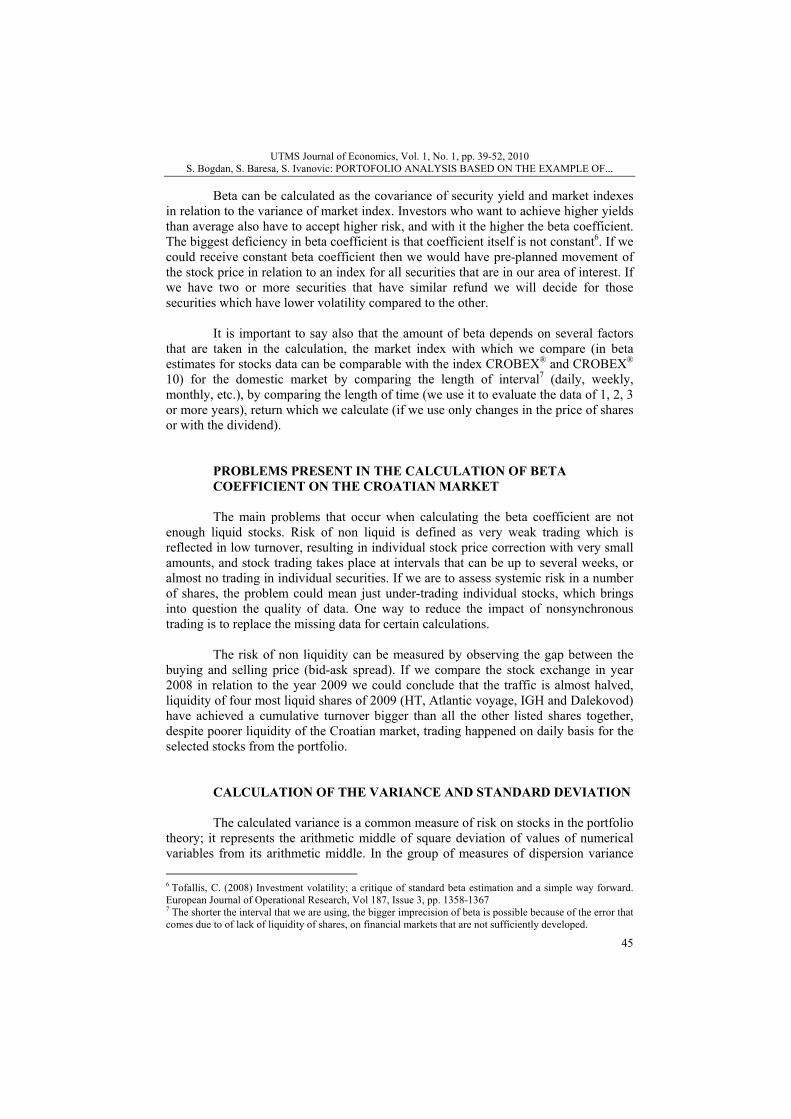
e R α β R e The higher regression coefficient called beta the greater is the impact of
variability CROBEX® on the change in share price. As an example display of the regression equation, we will use the stock with the highest beta and that is IGH β = 1.4942 and the stock with the lowest beta and that is HT stock where β = 0.4862.
Chart 1: Weekly yield of CROBEX® and HT-R-A
Source: authors' calculations
Linear regression analysis was based on weekly returns of the last two years;
the calculation used 106 data with weekly updates of closing stock price during the period from 19 March 2008 till 31 March 2010.
The horizontal coordinate represents the independent variable, or yield of the
market Rm, vertical coordinates showing the dependent variable or yield of the stock HT-R-A. On the above chart we can also notice that the regression line intersects the axis Y on +0,0028 which represents α (alpha) is also an average return on stocks HT-RA when the market return is 0%.
y = 0,4862x + 0,0028
R² = 0,4279
‐15%
‐10%
‐5%
0%
5%
10%
15%
‐25% ‐20% ‐15% ‐10% ‐5% 0% 5% 10% 15%
HT‐R‐A ‐%
prino
sa
Crobex ‐ % prinosa

S. Bog
Iaverage sthe quotireturn var
Chart 2:
Source: Aut
F
on the ginvestmen
T
characterhigher beyield stoc
W
since theopposed tR-A, INGof determvariations
UTMgdan, S. Baresa, S
It can also be systemic risk. ent correlatioriation HT-R-
Weekly yield
thors' calculation
For Chart 2 thgraph represent.
Trend SCL ristics of secueta coefficientcks IGH-R-A
We can concle β = 1.4942.to the telecom
GRA-R-A, HTmination (R2) s in market re
MS Journal of EcS. Ivanovic: PORT
concluded thaMark R2 (coen, for HT-R-A
-A can be expl
ds CROBEX®
n
he same time ents a sample
(Security churities is moret. On the abovwill amount -
lude that the s. Construction
mmunications T-R-A) as sam
is 38% recoturns.
conomics, Vol. 1,TOFOLIO ANAL
at the HT-R-Aefficient of deA it is 0,4279lained by vari
® and IGH-R-A
series was use pair of ret
haracteristic e tilted in relave chart we ca-0.0025 which
share IGH-RAn industry is industry, if w
mples. It is alsovery of varia
, No. 1, pp. 39-52LYSIS BASED O
A share with βetermination) i9 so we can ciations in mark
A
sed as well asturn (Rm, Ri)
line) that isation to Chartan notice, wheh can be seen f
A has the abovmore vulnerae take stocks o important toation IGH-R-
2, 2010 ON THE EXAMP
β (beta) 0,4862is calculated bconclude that ket returns.
s for Chart 1. ) for a fixed
s the directit 1. Cause of
en the market from α.
ve-average syable to systemfrom our porto mention the-A can be ex
PLE OF...
49
2 has below by squaring 18.31% of
Each point d period of
ion of the f that is the yield is 0%
ystemic risk mic risk as tfolio (IGH-e coefficient xplained by

UTMS Journal of Economics, Vol. 1, No. 1, pp. 39-52, 2010 S. Bogdan, S. Baresa, S. Ivanovic: PORTOFOLIO ANALYSIS BASED ON THE EXAMPLE OF...
50
CORRELATION WITHIN A SELECTED PORTFOLIO With the correlation matrix we will try to determine compliance in a variation
of ten selected securities within the portfolio. Table 3: Correlation matrix of portfolio
CROBEX ATPL ATGR DLKV ERNT HT IGH INA INGR JDPL KRAS
CROBEX 1
ATPL 0,8005 1
ATGR 0,7074 0,4218 1
DLKV 0,8562 0,7326 0,5575 1
ERNT 0,7586 0,5875 0,5084 0,6727 1
HT 0,6541 0,3854 0,5775 0,4817 0,4392 1
IGH 0,7856 0,5836 0,6149 0,8426 0,5919 0,3790 1
INA 0,7328 0,4870 0,4894 0,4774 0,5645 0,5474 0,4595 1
INGR 0,8147 0,5943 0,5864 0,8058 0,6120 0,4847 0,8175 0,5264 1
JDPL 0,8189 0,8502 0,4040 0,6895 0,5791 0,3830 0,6222 0,5179 0,6668 1
KRAS 0,5035 0,4395 0,3961 0,5218 0,3598 0,1953 0,4376 0,2753 0,3990 0,3835 1
Source: authors' calculations
Correlation coefficient was measured by the yield ratio of covariance between
the two sections (r1, r2) and standard deviations (σ) yields of two shares.
ρ ,COV r , rσ , σ
Correlation can be defined as a statistical association between two or more
variables. Among stocks with each other and the CROBEX® index correlation can be positive or negative, they are positive when they have the same direction and negative when an increase of one share or index follows the opposite changes in other stocks or indexes. The size of the quotient shows intensity of joint movement of rate of return.
The correlation matrix was calculated based on the time series of 106 data
with weekly updates of closing stock price during the period from 19 March 2008 till 31 March 2010. Chosen stocks were selected from different sectors of construction, transport and communications, industry, etc. The strongest correlation was achieved between Dalekovod and CROBEX®, 0,856, the weakest correlation was achieved between KRAS-R-A and HT-R-A 0.19530.
So in case of increase or decrease of each stock it will lead to rise or fall of the
other stock especially among those where coefficient of correlation is set out more.

UTMS Journal of Economics, Vol. 1, No. 1, pp. 39-52, 2010 S. Bogdan, S. Baresa, S. Ivanovic: PORTOFOLIO ANALYSIS BASED ON THE EXAMPLE OF...
51
With a combination of stocks that have low or negative correlation we reduce risk, especially with the negative correlation where there are conflicting price movements. Low correlation helps diversification, when the correlation is perfectly positive diversification is not effective.
CONCLUSION The basis of any investment is the analysis if we want to achieve gains. With
portfolio analysis, we can evaluate the risk of the portfolio and some of its shares, based on historical data. It is very important that we are aware of very little turnover achieved especially in the past two years on the Zagreb Stock Exchange, which can jeopardize the quality of processed data. On the other hand we must be aware that our market is yet emerging so that the volatility itself is very emphasized which is also characteristic of emerging market. We determined correlation, yields, risks with emphasis on systemic risk of the portfolio and individual stocks.
This article presents the technical analysis of where the main source of
information is historical closing prices of individual stocks on which all the calculations and future predictions are based on. It is important to note when estimating the securities that an investor combines also the fundamental analysis from which the real values of the evaluation of company go.
Fundamental analysis is dictating the long-term future of individual
companies, while technical analysis shows us when the best time to embark on investment and what is the nature of selected stocks due to the aggressiveness of their movement.
Technical analysis has the greatest applicability on the developed markets
where the volume of trading individual stocks is large enough that the investor has a choice what he wants to analyze therewith that he obtains quality data. Thanks to the extremely low liquidity in the domestic market investor or analyst does not have the choice to embark on an analysis of all securities listed on the domestic market, analyze the risks and returns and gain the same high-quality data. Nonsynchronous trading makes a problem during the analysis and finally the selection of the chosen portfolio.
REFERENCES
1. Bodie, Z., Kane, A.& Marcus, A.J. (2006) Pocela ulaganja. 3rd Ed. Zagreb school of Economics and
Management: Mate 2. Markic, B. (2008) Optimizacija portfolija i evolucijski algoritmi, Informatologia, Vol.41.No.4, pp. 266-
275 3. Damodaran, A. (1999) Estimating risk parameters http://pages.stern.nyu.edu/~adamodar/pdfiles/
papers/beta.pdf [accessed 22.03.2010] 4. Diacogiannis, G. & Makri, P. (2008) Estimating betas in thinner markets: The case of the Athens Stock
Exchange. International research Journal of Finance and Economics, Issue 13, pp. 108- 122 5. Ivanovic, Z. (1997) Financijski menadzment. 2nd Ed. Rijeka: Hotelijerski fakultet, Sveuciliste u Rijeci 6. Latkovic, M. (2001) Neishrono trgovanje i proracun beta koeficjenta http://www.phy.hr/~laci
/art/beta.pdf [accessed 17/03/2010]

UTMS Journal of Economics, Vol. 1, No. 1, pp. 39-52, 2010 S. Bogdan, S. Baresa, S. Ivanovic: PORTOFOLIO ANALYSIS BASED ON THE EXAMPLE OF...
52
7. Lie, F., Brooks, & R., Faff, R. (2000) Modelling the equity beta risk of Australian financial sector companies, Australian economic papers, Vol 39, No 3, pp 301-311
8. Markowitz, H. M. (1952) Portfolio selection, Journal of finance, Vol 7, No 1, pp 71-99 9. Scholes, M. and Williams, J. (1977) Estimating betas from nonsynchronous data, Journal of financial
economics 5, Vol. 5, No 3, pp 309-327 10. Sosic, I. (2000) Pregled formula iz statistike. Zagreb: Skolska knjiga 11. Sosic, I. (2004) Primijenjena statistika. Zagreb: Skolska knjiga 12. Tofallis, C. (2008) Investment volatility; a critique of standard beta estimation and a simple way
forward. European Journal of Operational Research, Vol 187, Issue 3, pp. 1358-1367 13. Tucker, A.L., Becker, K.G., Isimbabi, M.J. & Ogden, J.P. (1994) Contemporary Portfolio Theory and
Risk management. United States of America: West publishing company 14. Van Horne, J. C. (1997) Financijsko upravljanje i politika (Financijski menadzment) deveto izdanje,
Zagreb:MATE 15. Viducic, Lj. (2008) Financijski menadzment. Zagreb: RRIF plus d.o.o.