population/square mile - mcleveland.org...population distribution and poverty to better understand...
TRANSCRIPT
Cleveland ENVP U6250.001 POVERTY, INEQUALITY & ENVIRONMENT
Population Distribution and Poverty
To better understand the relationship between poverty, inequality and the environment, let’s
take a look at the geography of population density.
A. What is Population Density?
Density is a ratio of people to land area.1 However, choose a different land area and you'll get
a different ratio. For example, the New York SMSA which includes neighboring areas in New
Jersey, has only some 5000 per square mile, but in 2009 Manhattan itself had 71,506 per square
mile. Nevertheless, we find dramatic patterns.
Population density varies by orders of magnitude around the world. According to a Wiki list
of 239 sovereign states and territories around the world, world population density (land area
excluding Antarctica) is 51 people per square kilometer, or 132 people per square mile. The
densest territory on the list, Macau in China, has 48,000 people per square mile. The city state of
Singapore has 18,000 per square mile. The country of Taiwan has 1656 per square mile. The
Netherlands have 1036. Japan has 873. Brazil has 59. Even further down, Australia has eight.
The United States , with 82 per square mile, is quite low density compared to European let alone
Asian nations, but high density compared to most of Africa or Latin America.
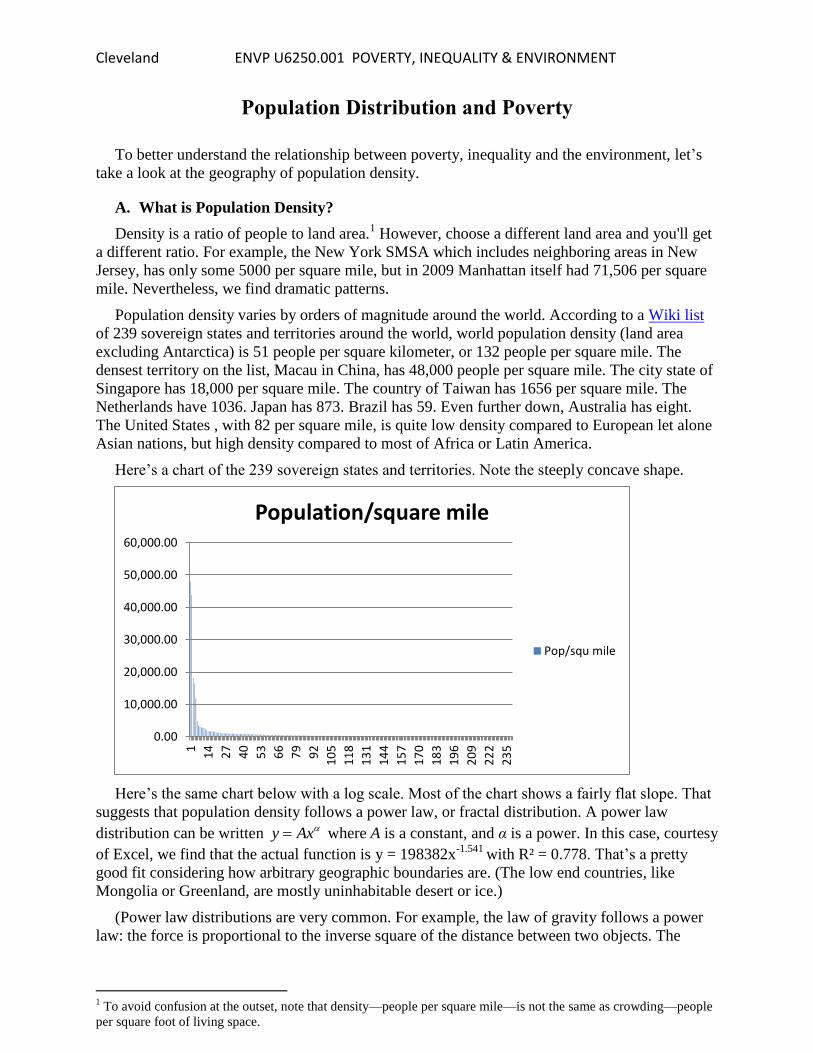
Here’s a chart of the 239 sovereign states and territories. Note the steeply concave shape.
Here’s the same chart below with a log scale. Most of the chart shows a fairly flat slope. That
suggests that population density follows a power law, or fractal distribution. A power law
distribution can be written y Ax where A is a constant, and α is a power. In this case, courtesy
of Excel, we find that the actual function is y = 198382x-1.541
with R² = 0.778. That’s a pretty
good fit considering how arbitrary geographic boundaries are. (The low end countries, like
Mongolia or Greenland, are mostly uninhabitable desert or ice.)
(Power law distributions are very common. For example, the law of gravity follows a power
law: the force is proportional to the inverse square of the distance between two objects. The
1 To avoid confusion at the outset, note that density—people per square mile—is not the same as crowding—people
per square foot of living space.
0.00
10,000.00
20,000.00
30,000.00
40,000.00
50,000.00
60,000.00
1
14
27
40
53
66
79
92
10
5
11
8
13
1
14
4
15
7
17
0
18
3
19
6
20
9
22
2
23
5Population/square mile
Pop/squ mile

Cleveland ENVP U6250.001 POVERTY, INEQUALITY & ENVIRONMENT
2
distributions of wealth and income follow power laws. Power law distributions simply mean that
the same forces operate at different scales.)
Population varies dramatically within nations. Citymayors.com provides statistics on the
largest cities in the world ranked by population density. Heading the list is Mumbai, with 29,650
per square kilometer or 76,790 per square mile. Seoul has 43,000 per square mile. Paris has
9194. The New York standard metropolitan statistical area has 5309. Avignon France has 1295.
Here’s a chart of the 250 largest cities. Again, note the concave shape.
Here’s the same data plotted on a log scale. The slope is flatter and smoother than for nations.
The actual function is with R² = 0.9081.
y = 198382x-1.541 R² = 0.778
0.01
0.10
1.00
10.00
100.00
1,000.00
10,000.00
100,000.00
1,000,000.00
1
16
31
46
61
76
91
10
6
12
1
13
6
15
1
16
6
18
1
19
6
21
1
22
6
Population/square mile
Pop/squ mile
Power (Pop/squ mile)
0
10,000
20,000
30,000
40,000
50,000
60,000
70,000
80,000
90,000
11
22
33
44
55
66
77
88
91
00
11
11
22
13
31
44
15
51
66
17
71
88
19
92
10
22
12
32
24
3
Population Density per sq mile 250 Largest Cities
per sq mile
0.981424566y x

Cleveland ENVP U6250.001 POVERTY, INEQUALITY & ENVIRONMENT
3
The US Census on line provides some great maps of population density in the US. At every
scale, from the level of states to the level of blocks, we find orders of magnitude differences,
indicating power law relationships.
Here is density for the entire US, by state, in 2009. Notice how population follows the coasts.
y = 424566x-0.981 R² = 0.9081
1
10
100
1,000
10,000
100,000
1,000,000
1
13
25
37
49
61
73
85
97
10
9
12
1
13
3
14
5
15
7
16
9
18
1
19
3
20
5
21
7
22
9
24
1
Population Density per sq mile 250 Largest Cities, Log Scale
per sq mile
Power (per sq mile)

Cleveland ENVP U6250.001 POVERTY, INEQUALITY & ENVIRONMENT
4
Here is density for New York State, by county in 2000. Most of the population is in or near
New York City. Density of Manhattan is 66939 in 2000 (more in 2009).
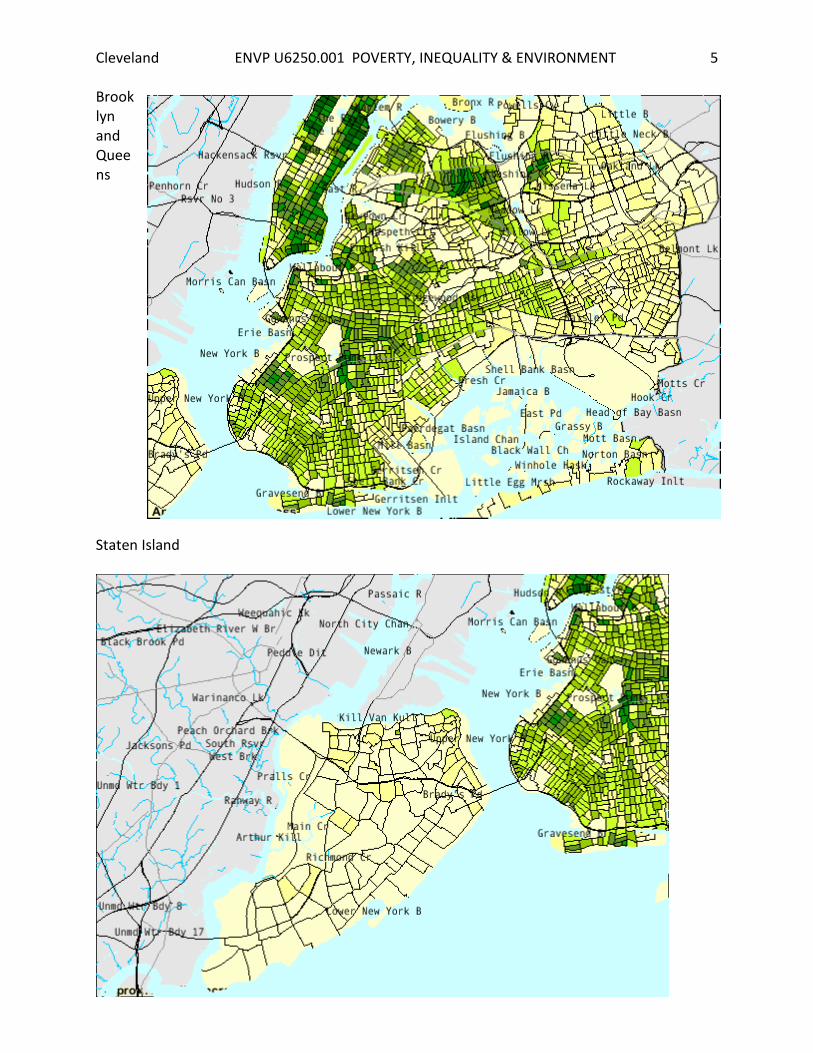
Here is New York City by Census Tract 2000: Manhattan and the Bronx
Cleveland ENVP U6250.001 POVERTY, INEQUALITY & ENVIRONMENT
5
Brooklyn and Queens Staten Island

Cleveland ENVP U6250.001 POVERTY, INEQUALITY & ENVIRONMENT
6
And here is density by block in Manhattan in 2000. You can see that some rich areas on either
side of Central Park show very high density.
Cleveland ENVP U6250.001 POVERTY, INEQUALITY & ENVIRONMENT
7
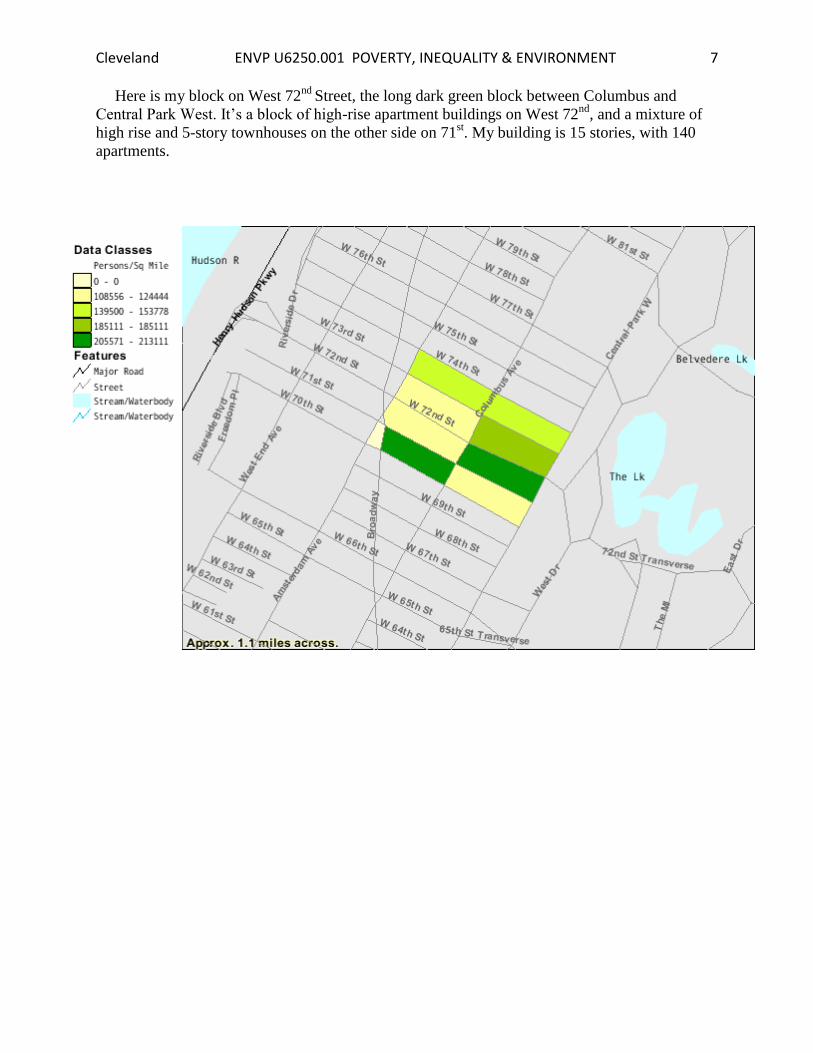
Here is my block on West 72nd
Street, the long dark green block between Columbus and
Central Park West. It’s a block of high-rise apartment buildings on West 72nd
, and a mixture of
high rise and 5-story townhouses on the other side on 71st. My building is 15 stories, with 140
apartments.

Cleveland ENVP U6250.001 POVERTY, INEQUALITY & ENVIRONMENT
8
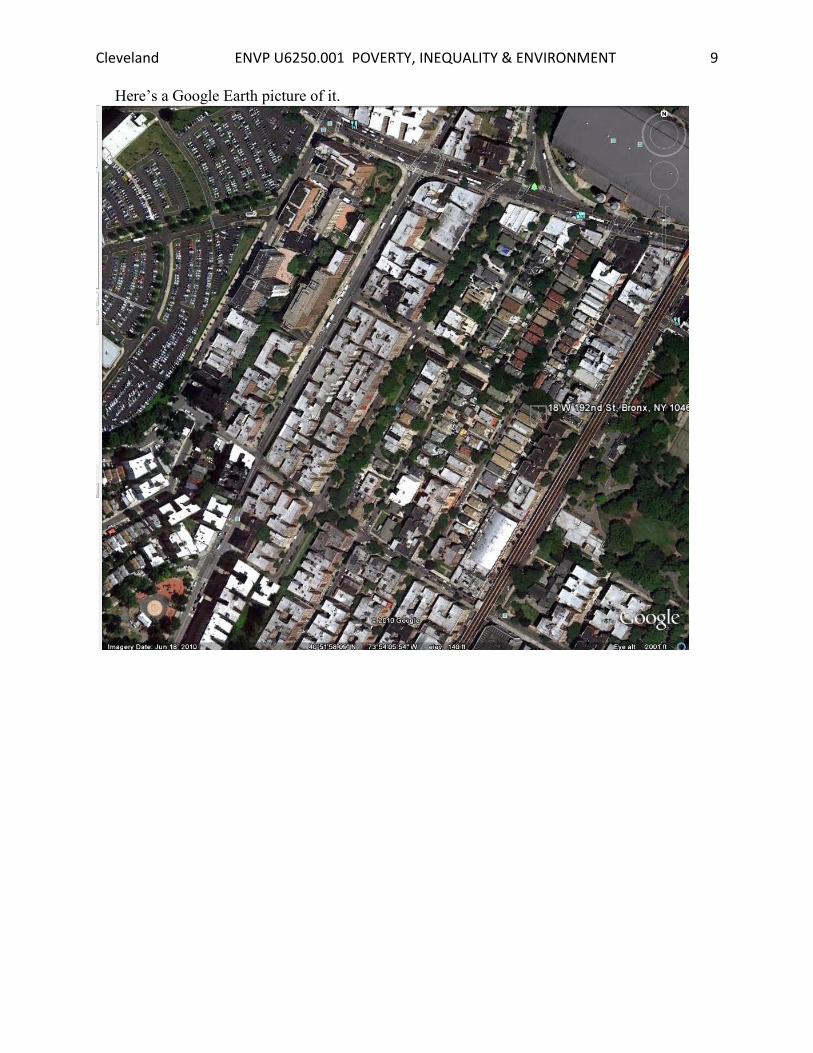
Here is the densest block I found, in the west Bronx, with 317,500 people per square mile.
Cleveland ENVP U6250.001 POVERTY, INEQUALITY & ENVIRONMENT
9
Here’s a Google Earth picture of it.

Cleveland ENVP U6250.001 POVERTY, INEQUALITY & ENVIRONMENT
10
A Paradox: Vacant Lots in New York City

Cleveland ENVP U6250.001 POVERTY, INEQUALITY & ENVIRONMENT
11
B. What Determines Population Density?
The history and resources of a geographical area determine population density. The Americas
are more lightly populated and Europe or Asia because -- after native populations were largely
wiped out -- the Americas were settled more recently by immigrants. People predictably cluster
around high-value natural resources. The most important of these are transportation centers
notably good harbors. New York City was settled around the harbor. Denver was settled around
the rail center.
Even more predictably, people cluster near other people. As Adam Smith observed in the first
chapter of The Wealth of Nations, high productivity arises from cooperation and specialization –
limited by “the extent of the market.” Hence, high density makes for high productivity. It creates
high economic value as reflected in real estate values. It is not a coincidence that the highest land
values and the highest density population in the US are in the same place: New York City.
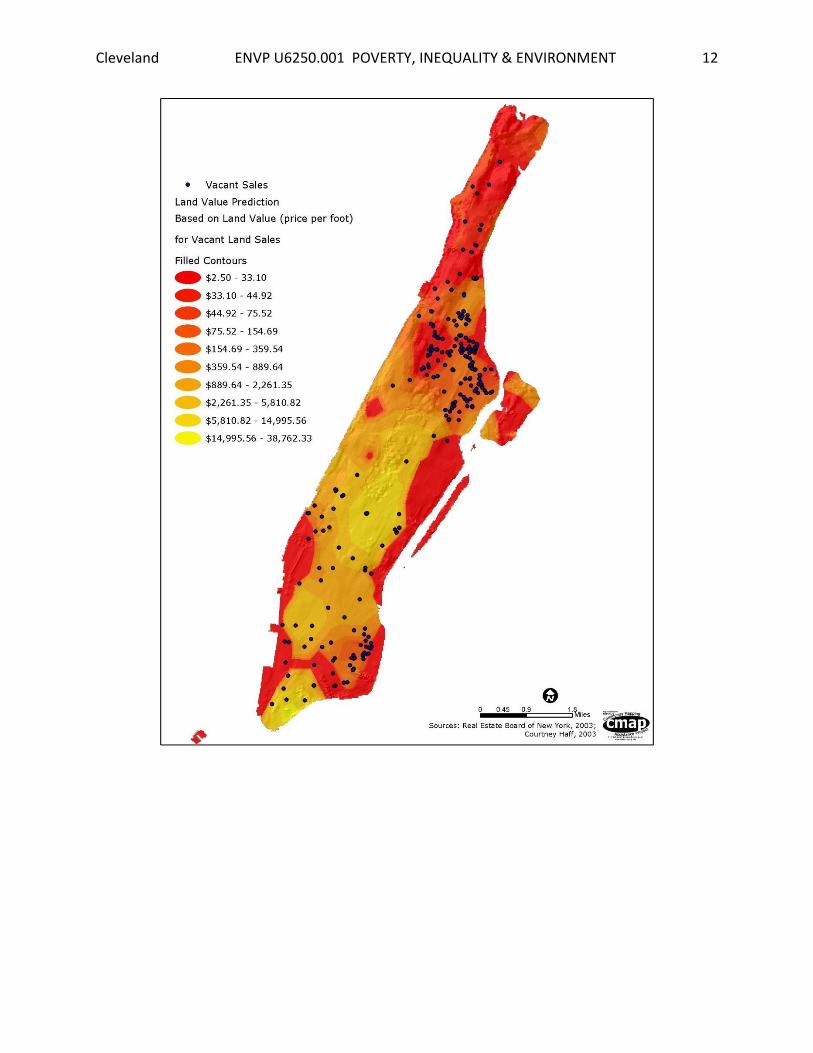
Here’s a 2003 land value map of Manhattan, showing order of magnitude differences over
short distance, ranging from $2.50 a square foot to $38,762 a square foot. The highest values are
in the midtown office area just south of Central Park, and just around Wall Street at the southern
tip.
On the following page is a land value map of Greenwich, CT. Most of the value is in the
downtown area, or a very pricy residential area on the coast.
Cleveland ENVP U6250.001 POVERTY, INEQUALITY & ENVIRONMENT
12

Cleveland ENVP U6250.001 POVERTY, INEQUALITY & ENVIRONMENT
13

Cleveland ENVP U6250.001 POVERTY, INEQUALITY & ENVIRONMENT
14
Here is a map of the Canadian city of Calgary, showing land values in three dimensions,
from
http://www.esri.com/mapmuseum/mapbook_gallery/volume20/images/large/state69_b.jpg
Cleveland ENVP U6250.001 POVERTY, INEQUALITY & ENVIRONMENT
15
C. How does Density Relate to Poverty and Inequality?
As seen above, high density is associated with high wealth and high land values. However in
any geographical location, large or small, there will be some inequality or outright poverty.
There will also be relatively low land values where those poor people live.
The interesting question is whether, on average, inequality is greater in denser, richer areas or
in less dense, poorer areas?
Henry George argued that in a great city like New York, poverty and inequality were greater
than in frontier towns with which he was familiar in California.
But how does inequality in New York City, or New York State, compare with inequality in
other states?
New York is a bad example, because it’s really two states: the New York City SMSA, and a
relatively poor, declining rural hinterland.
On average, lower density areas are both poorer and more unequal. For real poverty, go to
rural Mississippi.
Here are some maps.
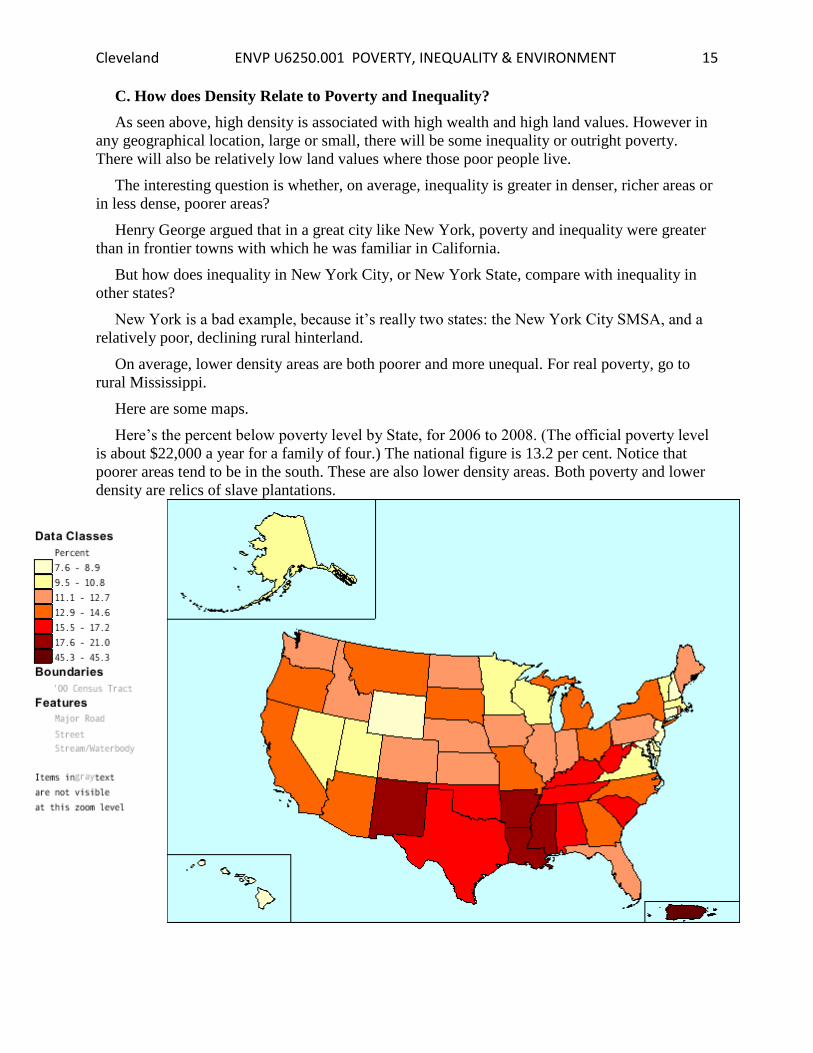
Here’s the percent below poverty level by State, for 2006 to 2008. (The official poverty level
is about $22,000 a year for a family of four.) The national figure is 13.2 per cent. Notice that
poorer areas tend to be in the south. These are also lower density areas. Both poverty and lower
density are relics of slave plantations.

Cleveland ENVP U6250.001 POVERTY, INEQUALITY & ENVIRONMENT
16
Here is the 2000 New York City SMSA map for percent below poverty, by Public Use
Microdata, the smallest areas available for this data. The east Bronx is clearly the poorest area.

Cleveland ENVP U6250.001 POVERTY, INEQUALITY & ENVIRONMENT
17
Here is a closeup:
And
here
again for
comparis
on is the
density
map of
Manhattan
and the
Bronx.
Cleveland ENVP U6250.001 POVERTY, INEQUALITY & ENVIRONMENT
18
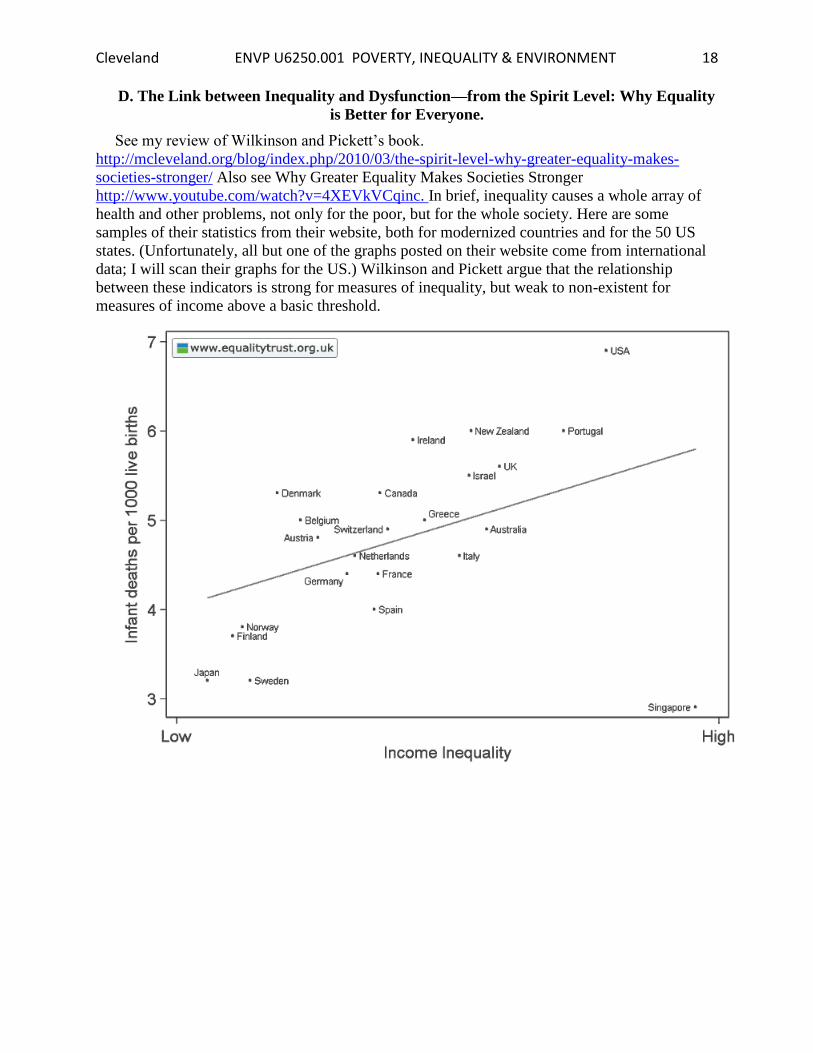
D. The Link between Inequality and Dysfunction—from the Spirit Level: Why Equality
is Better for Everyone.
See my review of Wilkinson and Pickett’s book.
http://mcleveland.org/blog/index.php/2010/03/the-spirit-level-why-greater-equality-makes-
societies-stronger/ Also see Why Greater Equality Makes Societies Stronger
http://www.youtube.com/watch?v=4XEVkVCqinc. In brief, inequality causes a whole array of
health and other problems, not only for the poor, but for the whole society. Here are some
samples of their statistics from their website, both for modernized countries and for the 50 US
states. (Unfortunately, all but one of the graphs posted on their website come from international
data; I will scan their graphs for the US.) Wilkinson and Pickett argue that the relationship
between these indicators is strong for measures of inequality, but weak to non-existent for
measures of income above a basic threshold.

Cleveland ENVP U6250.001 POVERTY, INEQUALITY & ENVIRONMENT
19

Cleveland ENVP U6250.001 POVERTY, INEQUALITY & ENVIRONMENT
20
E. What’s the Relationship between Poverty, Inequality and the Environment?
As seen, population and economic activity has a powerful tendency to cluster geographically.
Any factor that inhibits clustering pushes population and activity out across the landscape. It
creases “sprawl”—urban sprawl, agricultural sprawl, forestry sprawl or mining sprawl.
Density affects the choice of technology—higher density means more labor and capital
intensive and less resource intensive. Factors that lower density encourage more use of natural
resources and less of labor—reducing employment and wages.
What are these density-lowering factors?
1. Public policies that destroy or fail to support urban density and/or subsidize urban sprawl.
The “urban renewal” of the 1950’s and 1960’s was a disaster. Jane Jacobs saved lower
Manhattan from the highways of Robert Moses, but he did great damage elsewhere. Taxes
on buildings and low density zoning discourage infilling; subsidies to roads and utilities
encourage sprawl.
2. Monopoly behavior. Monopolists use resources at low intensity, reduce wages, stifle
innovation, and substitute imports for local manufactures.

Cleveland ENVP U6250.001 POVERTY, INEQUALITY & ENVIRONMENT
21
F. If Density is Such a Good Thing, Why Do So Many People Oppose It?
There are three main reasons people object to density.
1. People confuse density with crowding. Population density is people per square mile.
Crowding is people per square feet of living or working area. Zip code 10021 on the east
side of Manhattan is the richest zip code in the US. It also has very high density but
presumably low crowding, as rich people prefer large apartments. On the other hand rural
shacks in Appalachia may be quite crowded. The desirability or undesirability of
crowding is partly cultural. Middle-class Japanese can live quite comfortably in
apartments that would seem cramped to poor New Yorkers.
2. People assume that density means traffic congestion. But that’s a problem solvable by
higher tolls and parking fees, as London has done. Some of the worst congestion happens
in low-density car-dependent cities like Los Angeles and Atlanta. See Don Shoup’s
article, “Gone Parkin’” posted as NYT_Gone_Parkin_by_Shoup.pdf.
3. People want to keep newcomers out of “their” neighborhoods, especially poorer
newcomers. In effect, they want to act like little monopolists!
The Lincoln Institute of Land Policy has a nice section called Visualizing Density,
http://www.lincolninst.edu/subcenters/visualizing-density/ on how good design can make high
density attractive and efficient.