the historical roots of poverty and inequality in south … african coloureds, 1 the historical...
TRANSCRIPT
South African Coloureds, 1
The Historical Roots of Poverty and Inequality in South Africa:the Coloured Population
Kris Inwood, University of Guelph, CanadaOliver Masakure, Wilfrid Laurier University, Canada
I. The Coloured Population at the End of Apartheid
South Africa, with Botswana, has the world’s largest gap between per capita GDP andperformance on the Human Development Index (UNDP 2007/8, Table 1). Thedivergence of social from economic indicators in South Africa reflects a high level ofeconomic inequality by international standards (UNDP 2007/8, Table 15; Taylor 2000,p.60). Much of the inequality originates with race. For the mid-1990s it is estimated thatrace, by itself, accounted for nearly 40% of all inequality (Taylor 2000, p.62). The samedata show that the poorest one-fifth includes 23% of all Africans and 11% of theColoured population, but only 1% of Indians and Whites.
We are particularly interested in the Coloured population, which during during the 1990sColoureds had a per capita income about one-fifth that of whites – compared to Africansat one-tenth of the white standard (Leibbrandt et al, 2006). Household surveys c2000identify median hourly earnings for Coloureds and Africans in semi-skilled occupationsas being 38% and 41% of the comparable figure for whites; for unskilled labour thecomparison is 50% and 57% (Woolard and Woolard 2007, p. 23). The distribution ofemployment by skill and uneven incidence of unemployment of course aggravate thedisparities. Half the Coloured population in 1995 was below a lower bound poverty linederived from household expenditure surveys (Ozler 2005, Table 1). The comparablefigure for Africans was 68% against 1% for whites. As recently as 2001, in spite of amarked income improvement in the previous five years, one in twenty Coloureds stilllacked access to piped water, 12% lived in informal or ‘traditional dwellings” and 20%had neither flush nor chemical toilets (Leibbrandt et al, 2006).
There is little doubt that economic deprivation has diminished physical well-being. Thewhite population in the 1980s experienced 13 infant deaths 1000 live births in contrast to57 deaths for Coloured births and 68 for Africans (Cameron 2003). Birth weights from a1990 Soweto-Johannesburg study found the mean weight of new-born whites to be 3223grams, against 3079 grams for African infants and 3023 grams for the Coloureds. Post-natal growth accentuated rather than diminished differences by race. Within theColoured population children growing up in a rural community with low socio-economicstatus averaged 5% shorter and 20-25% lighter in weight than coloured children frommore affluent families in the greater Cape Town area (Henneberg and Louw 1998). Thepatterns of variation by race follow through to adulthood. The mean stature for malesoldiers 2000-2005 was 171 cm for Africans, 170.3 cm for Coloureds and 178.4 cm forwhites (Steyn and Smith 2007).
South African Coloureds, 2
Patterns visible at the end of the 20th century reflects a deep history of inequality anddeprivation for Coloureds including four decades of apartheid policies enacted in thewake of the National Party’s 1948 electoral victory. The story of post-war Apartheid inSouth Africa is most often told in black and white. But South African inequality did notbegin in 1948, and the immediate victims of race-based legislation were Coloured asmuch as African. Indeed, to the extent that Africans had already lost legal equalities ornever had them, the 1948 regime change weighed disproportionately on Coloureds.
In this paper we review the historical origins of poverty and inequality in South Africawith a particular interest in the Coloured community. We begin with a brief account ofits origins and identity, followed by evidence of well-being during the late 19th centurymineral revolution and then the experience of political union following 1910. Analysis ofmilitary medical examinations recorded during World War One and World War Two addto the evidence. We conclude by considering the possibility that important as post-1948apartheid undoubtedly was, it is not the principal cause of poverty and inequality amongSouth Africa’s Coloured population today.
II. Origins and Nature of the Coloured Population
Conventionally four groups are recognized within the South African population:Europeans and their largely white descendents, Africans and their largely blackdescendents, Asians or Indians and a fourth group, the Coloured population accountingfor 8-10% of the South African population throughout the 20th century. The latter aremixed race descendents of Europeans who landed at the Cape, slaves of eastern originimported into the Cape and Africans (most of whom were introduced as slaves fromelsewhere on the continent. The Coloured group also includes the Cape Malays,descendents of Muslim slaves brought by the Dutch from the East Indies. The later aredistinguished from the Asians, descendents of Indian indentured labour immigrants to theNatal sugar plantations (Christopher 2002; Deacon 2004; Golding and Joshua 1951;Marais 1939, pp.1-31; Simkins and van Heyningen 1989 p.91).
The complexity of Coloured identity arises from a mixed race genetic composition butalso from social and economic transformations of the 19th century (Adhikari 2005;Marquard 1952; South Africa 1937). The early years of Dutch presence in the Cape sawconsiderable mingling of Europeans with imported slaves and to a lesser extent with localAfricans. During the first two decades 1652-1672 it is estimated that 75% of childrenborn to slave mothers had European fathers (Marquard 1952, p75).1 A significantproportion of mixed-race offspring were raised as Christian and accepted as legitimatemembers of the European community (Ross 1976). Indeed, there was no formalprohibition on marriage between free and slave residents of the Cape until 1685, and evenat that marriage continued to be allowed between Europeans and half-breeds.
The mixing of populations continued through the 18th and 19th centuries. Watson(1970, p. 18) cites an estimate by Marie Kathleen Jeffreys that 15%-30% of all marriages
1. Here Marquard cites H. Sonnabend and Cyril Sofer, "South Africa's Stepchildren: A Study ofMiscegenation" in South African Affairs Pamphlets 16 (1948), 1-32.

South African Coloureds, 3
in 18th century South Africa were mixed.2 The absence of a rigid racial ideology andrace-based social order allowed the continued growth of a mixed race population. Socialfault lines were configured more around religion and, prior to the abolition of slavery,around legal constraints on individual liberty than on race. Coloured or mixed racecommunities in the Cape acquired distinctive identities Marais (1939), but mosthistorians recognize them as having “a social rather than a genetic status” Ross (1976, p.76).
Through the 19th century there continued to be some mixing (marital and non-marital) ofColoureds with whites and, increasingly, with Africans (Marquard 1952 p. 15; Wilson1969, pp. 245-246). A number of missionary schools remained multi-racial; about one-third of white pupils in the Cape Colony c1900 attended mission schools which had nocolour bar (Wilson 1969, p. 261). Indeed, the Cape Colony had a common multi-racialelectoral roll when it acquired representative government in 1852 and full responsiblegovernment in 1872 (although admittedly the wealth requirements for franchiseeffectively limited the number of non-white voters).
Nevertheless, a number of forces were tending to increase racial rigidity. Van Arke,Quispel and Ross (1993, pp. 90-102) note that central authority over individual farmersdiminished following the British assumption of control in the Cape. An increasingreliance on local African (Khosian) labour, at the same time as old methods of labourcontrol were undermined by the passing of the ‘Fiftieth Ordinance’ in 1828 and slaveliberation in 1834, may have fuelled the growth of a colour consciousness (Marquard1952, pp. 10, 75; Van Arke, Quispel and Ross 1993, pp. 90-102ff).3 The diamond andgold booms greatly expanded the white engagement with African labour and, through thesame logic, encouraged the development of colour consciousness to facilitate the controlof labour. Even Coloureds increasingly sought to differentiate themselves from theincoming Africans (Adhikiri 2005).
A potent symbol of the increasingly rigid racial practice is provided by the growth of agovernment-run school system during the closing decades of the 19th century. Schoolingwas compulsory for whites but not for Coloureds or Africans. The rapidly expandinggovernment schools served the white community almost exclusively since the 1860s.Eventually, in 1911, the Appellate Division of the Union Supreme Court formally deniedthe right of certain Coloured children in the Cape to attend European government schoolseven in their own village. As white children gradually switched to government schools,Coloured and African children came to dominate the mission schools which, notcoincidentally, received less state support (Marais 1939, pp. 269-273; Welsh 1969, pp.221-226; Wilson 1969, p.124; Wollheim, 1951 p.95).4
2. On Jeffreys’ work see Distiller and Samuelson, “’Denying the Coloured Mother’” 2005. Marais (1939,p. 282) appears to favour a more conservative estimate.
3. The Fiftieth Ordinance repealed previous pass laws and established the principle of equality among freepeople of all colours.
4. From 1894 to 1909 government expenditure on mission schools increased from 15s.3¾d. to 17s.7d. perpupil. Spending on white students increased from £2.8s.9d per pupil to £3.15s.11d in ‘farm’schools and from £3.5s.0d to £5.13s.6d. in ‘first’ class schools. By 1924 the state subsidy forwhite pupuls was almost three times that of Coloured pupils (Marais, 1939 p.272-273).

South African Coloureds, 4
The diminishing social status of the Coloured population did not end its interminglingwith white society, but the nature of the relationship changed. Coloureds continued tolive side by side with some whites, but they tended to be the poor whites in relativelyunhealthy neighbourhoods (Marquard, 1952, pp. 80). Admittedly, large numbers ofmixed-race South Africans passed as whites in order to avoid the encumbrance of beingidentified with an inferior racial group. Van den Berghe (1965, p. 42) estimates that as ofthe 1960s “anywhere from one-tenth to one-quarter of the persons classified as “White”in the Cape Province are of mixed descent, and that every “old family” from White CapeSociety has genealogical connections with Coloured Families”. Others put the proportionof whites who are of mixed descent much higher.5 Watson (1970, p. 18) argues that thepaucity of Coloureds living in Coloured neighbourhoods with a fair complexion, in itself,suggests that many of those who have been able to pass as white have chosen to do so.
[TABLE 1 HERE]
Thus Coloured people in South Africa, then and now, constitute a complex andheterogeneous community. At any point in the past 200 years they have sharedconsiderable genetic affinity with both Africans and European-descended whites, andpartly for this reason the Coloureds themselves do not have a common genetic identity orsocial origin. Some Coloureds circa 1900 were sixth or seventh generation descendentsof seventeenth-century unions while others were first-generation children of mixed raceunions during the late 19th century. Neither do the Coloureds share a single appearance.Some look more European, while others appear closer to the African (Patterson, 1953 pp.14-21; Golding and Joshua, 1951 p.71; Marais, 1939, pp.1-31). Many have sharedlanguage, religion and culture with the Europeans in spite of being recognized sociallyand legal as a distinct race.6
The Coloured population at the time of Union could be found in all corners of SouthAfrica although by far the largest concentration was in the Cape Colony (Table 1). Aslate as the 1930s nearly 90% of the Coloureds continued to live in the Cape, mainly theWestern Cape. The 1936 census also reveals that about 50% of the Cape Coloureds livedin the rural areas (Marais, 1939 p.266; Patterson 1953 Appendix C p.352). Of course theapparent precision of these census-based estimates is deceptive to the extent ofundercounting (especially in rural and African-dominated areas) and by the constructednature of racial identities.7
In this section of the paper we have characterized in necessarily broad strokes the natureand origins of the Coloured community. The precision of legal identities and censustabulations cannot obscure that the population is socially constructed in a rathercomplicated way. We can recognize, as Robert Ross observes for the 18th century, thatthe identity of the Coloured population is social rather than genetic. The identity and
5. See G. Findlay, Miscegenation (Pretoria: Pretoria News Publishers, 1936) cited by Watson 1970, p. 19and H. Sonnabend and Cyril Sofer, "South Africa's Stepchildren” cited by Marquard 1952.
6. Not surprisingly, the legal status of Coloureds has been complex. Patterson (1953 Appendix I pp 361-363) and Christopher (2002) review the inconsistent definitions over time of a ‘coloured person’.
7. Feinstein (2005, Annex 1, pp.257-259) extrapolates from 1904 to provide annual population by racefrom 1904 to 1996. See also Patterson (1953 Appendix A p.351).

South African Coloureds, 5
status of being Coloured is a product of a historically contingent process as much as itsgenetic composition. We might also recognize the potential importance of the tendencyfor white-looking Coloureds to leave the community in order to pass as whites. If theestimates of large-scale passing into the white community are correct, and if the white-looking racial migrants have been atypical in terms of health, education and income-generating capacity, then at any point during the 19th or 20th century the observedcharacteristics of the Coloured community, ie those who did not pass, reflect the effectsof selective migration not unlike other migration processes.
III. Economic Change and a Sharpening Social Gradient during the NineteenthCentury
Before the discovery of diamonds in 1867 and gold in 1886 most South Africans of allraces outside of Capetown lived in rural and sometimes isolated communities, often inlarge and sparsely populated farms (Wilson, 1971 p.109).8 Port cities were still largelycommercial centres; the dominant classes were merchants, retailers, traders, masons,carpenters (Feinstein, 2005 p.114). Larger towns in the interior were local and regionalcentres for commercial activity, administration and manufacturing. Gold and diamondmining greatly increased the country’s engagement with international markets andhastened industrialization. Population grew most dramatically in the Transvaal. Capitalinvestments in railways, light manufacturing and public works and the growth of a moresophisticated civil service owe a great deal to the mining expansion (Simkins and vanHeyningen, 1985, p.99; Feinstein, 2005, pp. 90-123). Largely autonomous developmentsin the countryside reinforced the pressures for urbanization: rinderpest in the 1890s, thelong drought of 1897, the devastation of the 1899-1902 war the abolition ‘kafir’ farmingin 1913 and a closing of the frontier of inexpensive land (Wilson, 1971 pp .126-127).
The labour market became increasingly segmented. Organizations of white minerssuccessfully pressed for preferential treatment against unskilled workers as early as the1870s. The first formal color bar followed in 1893 (Wilson, 1971; Katz, 1999;Breckenbridge, 1998; Davies, 1976).9 Similar albeit less rigid restrictions were applied toColoured and Asian workers (Feinstein, 2005 p.74). The wages paid to Africans andColoureds were low both in absolute terms and relative to those paid to the whites.Africans in particular were argued to be temporary sojourners in urban areas with a homein rural areas. At the opposite end of the income spectrum, skilled white workersbenefited from an increasing demand for their skills and from the political and legalentrenching of segregation (Davies, 1976; Breckenbridge, 1998; Katz, 1999; Packard,1989; Feinstein, 2005 p.75-78). Wages in mining, railways and the cities were highenough to attract white workers away from farming. This created a demand for non-white labour which was met with coercive recruitment strategies (taxes, land restrictionsand later pass laws) rather than higher wages. 10 The result was considerable wage and
8. Wilson (1971 p.113) notes that only the wealthier white farmers had houses with a front room in whichthe family ate and lived by the day apart from a kitchen and bedrooms.
9. Industrial color bar rules may have improved mine safety but they also protected skilled and unskilledwhite jobs by reducing competition from the growing numbers of relatively skilled proletarianizedor semi- proletarianized Africans and Coloreds (Davies 1976 pp.41-69; Katz 1999 pp.73-97).
10. A mistaken belief that the supply curve of farm labor was backward sloping encouraged the coercivetactics (Feinstein, 2005, p.68-70; Wilson, 1971 p.121).

South African Coloureds, 6
income inequality in spite of a robust demand for labour and increasing per capita income(Houghton, 1980 p.40; Feinstein, 2005 pp3-11).
Wage and income data were not systematically collected until after 1910, and even atthese data pertain largely to white occupations. Nonetheless, evidence of race-basedinequality from individual labor markets is abundant. For example, in 1866 the averagemonthly cash wage for white farm foremen and head shepherd in the Cape Colony was£2.18s. 1d, while non-white servants, cattle herders and shepherds earned 12s.10d permonth (Wilson, 1971 p.158-161). Some non-white workers were paid partly in kind(rations, grazing rights, land or accommodation) or through a tot system that includedpayments in wine and brandy.11 Later, circa 1900, whites in the building industry earneda maximum of 9s a day while Coloured were paid 7s 6d for the same working day(Davies, 1976, p. 68; Feinstein 2005 p. 67l Simkins and Van Heyningen 1989, p.105). Atthe same time Africans and Coloureds in the Witwatersrand mines earned less thanwhites even when employed in skilled jobs normally reserved for whites (Davies, 1976p.69). In the Cape colony, Coloureds employed by the railways were paid less thanwhites doing the same job (Marais 1939, p.265).
Marais argues that by time of the union in 1910, few Coloureds held graded positions inthe Cape Colony civil service because the ‘backward state of their education prior to theunion no doubt rendered but few of them eligible for official appointments’ (Marais1939, p.261-262). After the union, the prospects for obtaining graded positions “weredestroyed by administrative order except one department of the Public Services, Postsand Telegraphs which employed a number of them as postmen, messengers and so on”.
Not surprisingly, economic inequality influenced health outcomes. Admittedly rapidurbanization around the mines and in port cities created a heightened risk of tuberculosis,diarrhea, typhoid and influenza for everyone (Marais 1939, p. 259; Phillips, 1987;Simkins and Van Heyningen, 1985, p99; Swanson, 1985; Packard, 1989; Deacon, 2000p.204; Low-Beer et al., 2004 pp.223-245). Nevertheless, whites found ways to protectthemselves. In the face of increasing health hazards an organized, politically vocalmedical profession contributed to local and national public health reforms (Deacon 1998,2000; Deacon et al (2004). White civil servants formed a medical association, the CivilServants’ Medical Benefit Association, that became compulsory in 1905. Suchorganizations addressed the needs of white public servants and left the nonwhitecommunities without government-sponsored medical support except at governmenthospitals (Verhoef 2006).
African, Coloured and even poor white urban migrants remained at risk as economicpressures and mounting segregationist sentiment pushed them into crowded and adverseliving conditions (Kuper, 1950; Bickford-Smith, 1995; Marais 1939, pp.179-199; vanHeyningen, 1985p.98; Packard, 1989 p.42-43). Popular stereotyping of Africans asdiseased and ‘uncivilized’ reinforced the segregationist sentiment. As early as 1870 fearof cholera, smallpox and plague had led to the segregation of Indians and Africans in
11. The ‘tot’ system was firmly established in the Western Cape during the 1860s. A century later the totsystem was still entrenched in the Western Cape especially in vineyards in spite of criticism fromseveral government commission and church reports (Marais, 1968 p.268; Wilson, 1971 p.162.).

South African Coloureds, 7
Natal and Transvaal (Swanson 1977, 1983, and 1985). Subsequent laws included theTransvaal Law 5 of 1885 (denying Asians an electoral franchise), Public Health Laws of1883 and 1887, the Native Labor Locations Act of 1899, the Native Reserves Act of 1902and the Immigration Restriction Act of 1902 (Freund 2001; Scott 2003 pp.235-259;Mabin and Smit, 1987). Deacon (2000 pp. 203-206) discusses the racialized medicalpractices in the Cape Colony, in particular the Leprosy Repressions Act of 1891 thatreflected a racist stereotyping of the leper as black.
Many municipalities to allocate resources that would improve the health of largely non-white neighbourhoods (Packard 1989, pp. 55-57; Marais 1939, p.258). In some cases,sanitation, refuse collection and water supplies literally stopped at the boundary ofAfrican and Coloured locations. Few locations had sanitation facilities; Coloureds in oneCape Town location had to fetch water from an irrigation furrow after it had passedthrough the town (Marais 1939, p.258). Packard (1989 pp.55-56) observes that theAfrican locations in East London had no latrines; 8,500 residents had to use latrines thatwere outside the location. Some non-white locations on the Rand, such as Ndabeni, weresituated adjacent to rubbish dumps. The medical profession noted that these healthhazards for non-whites created an indirect threat to the white community (Swanson,1983; Deacon et al, 2004). The lack of substantial progress eventually attracted criticismfrom the Tuberculosis Commission of 1914 (Packard, 1989).
Inequities in access to health care reinforced the impact of residential segregation. Mineemployees received greater medical attention than most workers but the Rand minesbefore 1916 made no provision for the medical examination of African workers unlessthey showed signs of illness or severe wasting (Packard, 1989; Marks, 2006). Bycontrast, white mine workers received periodic examinations (and better medicaltreatment if they fell sick). Not surprisingly, although everyone was at risk fromtuberculosis, malaria and other infectious diseases, the burden and incidence of death felldisproportionately on Coloureds and Africans (see Packard, 1989; Marks, 2006). Forexample, the 1901 plague that hit Cape Town killed 34 percent of infected whites against57 percent of infected Coloureds (Mitchell, 1983; Simkins and van Heyningen 1989 p98).The 1918 influenza had similar impact; the crude death rate in Johannesburg was .0027for Africans, .0038 for Coloureds and .0016 for whites; the Cape Town experience wassimilar (Unterhalter 1982, p.620; Phillips 2006, p.596).
Available evidence on life expectancy supports the impression of extreme inequality byrace. Between 1891 and 1906 the life expectancy at birth was 15 years higher for whitesthan for Africans and Coloureds in the Cape Colony (Simkins and Van Heyningen 1985,p.93). In both 1913 and 1939 the crude death rate in Johannesburg was .0009 amongwhites, against .0016 and .0018 for Africans and .0023 and .0015 for Coloureds(combined with Asians in 1913 – see Unterhalter 1982 p. 620).
The infant mortality differential was equally high. Evidence from Cape Colony censusessuggests that between 1891 and 1904, infant mortality per 1000 live births was 150 forwhite children, 304 among blacks, 312 for Coloured boys and 276 for Coloured females(Simkins and Van Heyningen, 1985). In Johannesburg whites infant mortality declinedrapidly from 117 per 1000 live births in 1909, to 90 in 1918 and 51 in 1939 while the

South African Coloureds, 8
Africans and Coloured figure declined from 369 in 1909 and 225 in 1918 to 189 by 1939(Simkins and Van Heyningen; Unterhalter 1982). Of course there was considerableinequality among whites as well (Keegan 1987 pp. 28-29; Phillips 1987; Unterhalter,1982). Unterhalter (1982 p. 631) shows that in 1919 infant mortality for whites was 63per 1000 live births in the affluent northern suburbs of Johannesburg while in workingclass suburbs of Newtown, Mayfair and Fordsburg it was as high as 113. Investigationsinto the ‘poor white’ problem after the 1899-1902 war suggest considerable inequalitybetween poor and middle-class whites (Keegan, 1987).
For all groups, the greatest killers were respiratory diseases (pneumonia, tuberculosis)followed by diarrheal diseases (dysentery, typhoid), hookworm, measles andmalnutrition. Phillips (2006 p.594) argues that ignorance about suitable diet or inability toafford one was a major cause of malnutrition and that unsanitary living conditions werethe principal cause of gastroenteritis, meningitis and scarlet fever in Cape Town’s Jewishcommunity. Tuberculosis was four to six times more prevalent among Coloureds thanEuropeans (Marais 1939, p.259). It declined quickly among whites after 1900, as it did inEurope, but it remained high among Coloureds and Africans until the development ofeffective drugs in the early 1950 (Packard, 1989 p.4, 41).
The average death rate of Africans and Coloureds from diarrheal diseases inJohannesburg from 1903 to 1913 was .00027 against .00022 for whites (Packard, 1989p.57). The relatively small differential reflects the poor state of municipal waste disposalfor everyone before 1920. Subsequently, the differential widened as improved water-borne sanitation reached white but not African and Coloured neighbourhoods (Packard,1989 pp.126-146; Unterhalter, 1982 p.621).
Changes in dietary practices and nutrition may have exacerbated the health of the poor inboth urban and rural areas, although little is known about the pre-1914 diet or cost ofliving.12 Measures to collect regularly and consistently statistics on prices and costs ofliving were not put in place until after the war (South African Year Book No.3, 1919).Afrikaners are thought to have consumed more meat than Africans (Wilson, 1971 p.113)but ‘poor whites’ are known to have suffered malnutrition and poor dietary habits (vanHeyningen, 2004 p.8-10). By the 1920s the problem of diet and nutrition was attractingattention; health officials began to worry a great deal about malnutrition, scurvy, pellagra,rickets and kwashiorkor among Coloureds, Africans and poor whites (Fox, 1934; 1936;Brock and Lasky, 1942; Packard, 1989; Wilson, 1971). Poverty was recognized as thefundamental cause of malnutrition; other influences including population growth, thedisruption of semi-pastoral economy and deterioration of productive capacity of ruralwere recognized (Fox, 1939).
The evidence reviewed above suggests ways in which economic and political changesand racial segregation shaped the disease ecology, mortality and health. Admittedly, thesources are incomplete; they provide little detail of the experience of individuals indifferent cohorts, locations and racial groupings. A paucity of sources rather than a lack
12. The census of 1910 provides data on the costs of living and food prices in major towns of SouthAfrican for 1895, 1900 and 1910 but non-white income data are not available.

South African Coloureds, 9
of ideas or interest limits our ability to analyze the physical well-being of South Africansborn into the globalization and mining-based industrialization of the later 19th century.
IV. From Union to Apartheid, 1910-1948
A clearer picture emerges from sources describing the social status and well-being ofColoureds in the four decades after the Union in 1910. We are fortunate to be able drawupon the report of a 1936 commission on the State of the Cape Coloureds (South Africa1937). This report, which provides the first systematic examination of living conditionsfor the Coloureds, emphasizes the importance of education and tradable skills andanalyzes in some detail the Coloured experience of schooling.
A special curriculum for coloured primary schools had been created in 1923 along thelines of the European schools. This helped to increase enrollments, and yet progress wasslow. From 1931 to 1935 Coloured enrollment in Cape Province Standard One increasedfrom 12,570 to 14,835; Standard Two increased from 10,474 to 12,960; Standard Fiverose from 3,032 to 4,124.13 At each level the number of Coloured students increased, andyet the same data reveals a dramatic attrition from the first to fifth standard. Unlike whitechildren the Coloureds were not compelled to remain in school beyond age 7, and manydid not. In Cape Province only 3% of the Coloured who enrolled into Standard Six madeit into Standard 10 compared to 20% for whites (South Africa 1937, pp.148-151). Notsurprisingly few Coloured schools offered instruction beyond Standard Six.
Even for those who attended school, the absentee rate was higher for Coloured at alllevels, as was the median age of pupil. Again, not surprisingly, performance by Colouredstudents was found to be inferior. A test of conducted among standard three pupilspermits a direct comparison. Coloured students scored worse in all disciplines exceptEnglish spelling.14 The Commission (pp.192-193) interpreted the evidence of Colouredschool performance as a product of poor facilities, lack of teachers and poor teachersalaries rather weak student motivation or innate ability:
The well-known fact might be stressed that the coloured teachers are generally notqualified to the same extent as the average European teacher, and that the trainingof such teachers was initiated at a comparatively recent date. This fact alsoexplains the phenomenon which can hardly be explained in any other way, viz.,that the differences between the two groups are greatest in two of the so-callednon-essential subjects (Geography and Nature Study).
The position of Coloured workers in the labour market mirrors the experience ofschooling. Several legislative interventions during the 1920s protected white workers atthe expense of Africans and Coloureds. Among them were the Industrial Conciliation
13. Similar figures obtain for Transvaal province: Standard 1 enrollment was 933 in 1931 and 1,187 in1935; Standard 2 increased from 685 to 952 and Standard 5 from 239 in 1931 to 360 in 1935.
14. 454 white children and 180 Coloureds had the following average scores: Afrikaans vocabulary 12.4whites and 5.8 for Coloureds; Afrikaans reading 14.8 whites and 8.98 Coloureds; Afrikaansspelling 28 for whites and 24.1 Coloureds; English vocabulary 9.04 whites and 6.4 Coloureds;English Reading 12.3 whites and 10.8 Coloureds; English spelling 29.8 whites and 32.1Coloureds; History 15.1 whites and 11.4 Coloureds; Arithmetic 56.5 whites and 49.2 Coloureds(South Africa 1937 pp. 178-191).
South African Coloureds, 10
Act of 1924, the Wage Act of 1925 and the Mines and Compensation Act of 1926(Houghton 1980 p.154; Goldin 1987; South Africa 1937).15 The Industrial ConciliationAct and the Wage Act prevented competition between whites and Coloureds byrestricting the latter from senior positions in the civil service and public transportationsector.16 In 1921 over 90 percent of Coloured women were unskilled, 87% wereclassified as domestic servants, less than 5 percent were in skilled and semi-skilled jobs.By contrast 15% of Coloured men occupied semi-skilled and skilled occupations. Thelatter were disadvantaged by the legislated protection of white workers.17
The Apprenticeships Act of 1922 and subsequent amendments (1930, 1944) did notimpose an explicit racial discrimination, but it laid down conditions for apprenticeshipwhich made it difficult for Coloureds, Africans and even Asians to quality as skilled andsemi-skilled workers (Houghton 1980). For example the Apprenticeship Act stipulatedthat entry into an apprenticeship required a minimum Standard Six education. In 1927the entire Cape Province had only 785 Coloured pupils enrolled at this level comparedwith 13,128 white children (Goldin 1987).
The ‘White Labour Policy’ and the ‘Civilized Labour policy’ imposed further restrictionson Coloureds, Africans and Asians during the 1920s.18 The proportion of Asiansemployed in Railways and Harbors dropped from 7% in 1916 to 1% in 1936, that ofAfrican from 72% to 59%. The share of Coloureds increased slightly from 10% to 11%,while the whites share of jobs increased as intended from 11% to 29% (South Africa1937, p. 44). The manufacturing sector changed in tandem. By 1932, only 43% of themanufacturing workforce was Coloured, down from 50% in 1924 (Goldin 1987). By1939 Coloured labourers were greatly diminished among the ranks of urban blacksmiths,carpenters, masons, bookmakers, tailors coachmen and painters) and excluded from theexpanding new electrical and metallurgical crafts (Golding, 1987).
Disadvantages in education and the labour market gave rise to profound inequality inphysical well-being. The 1936 Cape Coloured Commission reported birth weights for1763 Coloured and 906 white babies at Cape Town’s Peninsula Maternity Hospital 1933-1936. The average weight at birth for the Coloured was 7lb.0.2oz compared to 7lb.6.7 oz.for the whites (South Africa 1937, pp. 87-89). The Commission considered and rejected
15. The Industrial Conciliation Act of 1956 added two new contentious provisions. The principle of jobreservation set aside certain jobs would be reserved for certain races or a percentage of workers ofa particular race. The principle of enforced racial separation in trade unions banned unregisteredunions and those which were open to both whites and nonwhites.
16. Prior to this legislation very few Coloureds held graded positions in the civil service because ofeducational qualifications and, after the Union, administrative fiat (Marais 1939, pp. 261-263).The Wages Act did not apply to employees in agriculture, to domestic servants and to personswho was covered by the Public or Railways and Harbors services (South Africa 1937, p. 56).
17. Coloureds in commerce were rare. The 1921 census found 3,561 males in commerce insurance andfinance (excluding clerks), 292 males as clerks and draughtsmen. The report of the 1936commission identifies only a few small and struggling shopkeepers. Only 1122 Coloured men and38 women could be found in the civil service (South Africa, 1937, pp.80-82).
18. The latter used differential tariff duties and preferential government contracts to favour firmsemploying a high proportion of ‘civilized labour’ and to replace non-white labour in governmentservice and on the railways.

South African Coloureds, 11
the relatively smaller stature of the Coloured parents as an explanation for the differential(p. 88).
in a general way, there is no data available to indicate that the main stocks fromwhich the Coloured people, as they are found today, sprang and developed did notpossess a good racial heritage from a physical point of view. During theintrauterine life, moreover they possess a certain initial body growth whichindicates future physical possibilities in the adults’.
Rather, the Commission identified deplorable living conditions and chronicundernourishment of the parents as being responsible:
these figures would tend to show that given healthy parents, the newly born childpossesses an initial asset growth and could be expected under normal conditionsto attain good body dimensions and physique at maturity. This expectation is notattained in the large majority of the Coloured people and the figures adduced leddecided support to the view that the result is due at least largely if not wholly, toexposure to poor conditions of environment and under-nourishment of whichthere is ample evidence. … Until these factors have been eliminated, it could bean unproved statement to maintain that the Coloured people are less robust andphysically below the European standard because of the stock from which theyspring. In other words, the general observation of comparative physical inferioritycannot be ascribed to heredity or inferior stock, unless it persists afterenvironmental and nutritional deficiencies have been improved or brought up tothe standard of the European race..
Recognition of poor nutrition among the Coloured population was sufficiently wide-spread during the interwar period that many churches, local authorities and charitableorganizations provided meals to school children especially in winter months (SouthAfrica 1937, p.90). In spite of these efforts the commission found:
by examination, observation and evidence that there is a prevalence of subnormalgrowth and weight, poor musculature, inability to stand up to continued physicalstrain, poor condition of the skin, teeth of poor structure. Many of the schoolchildren are anaemic looking and listless and according to the teachers, there islack of concentration in their school work’.
The Commission went on to identify poverty as a fundamentally important influence onthe physical well-being of Coloureds (p.90-91):
In cases in which purchasing power is lacking, deficiencies in diet are most likelyto occur in first class (animal) proteins and in minerals and vitamins, because ofan insufficient acquirement of dairy produce and green vegetables. ….. In thesecircumstances, the preponderating factor in malnutrition must be looked for inundernourishment among the larger section of the coloured communities and thisis almost exclusively due to poverty … The fact that the coloured people showthrough vital statistics…a lower resistance to disease than the Europeanselsewhere in the Union cannot be ascribed to climatic influences or necessarily tohereditary weaknesses. This lower resistance can be explained as being largelydue to the relatively poor environmental and over-crowded conditions under

South African Coloureds, 12
which the majority live and to the greater degree of undernourishment to whichthey are habitually subjected.
Other sources confirm the impression of poor physical well-being in the Colouredcommunity of the 1920s and 1930s. A Transvaal government enquiry reported in 1934that “among Non-Europeans, the group which seems to suffer the greatest social andeconomic disabilities and hardships is the Coloured. There is appalling poverty amongstthem, far more than amongst the Natives (cited in Fox, 1936, p. 28). Dr. Fox went on toqualify the comparison by identifying significant pockets of extreme malnutritionamongst Africans (chiefly on the reserves), but he did not question the generalcharacterization of the Coloured community.
Writing shortly after the 1937 Commission report Marais cites the view of theGovernment Health Officer that Coloureds were the chief sufferers from tuberculosis.The Health Officer apparently attributes this to overcrowding in unsanitary dwellings.Marais (1939 p.259, note 3) countered that ‘Malnutrition is a more important factor’.
The Cape Nutrition Survey undertaken in 1941 provides further evidence with its findingthat more than three-fifths of all Coloured were malnourished; the corresponding figuresfor Africans, whites at middle-ranked schools and whites at a poor school were 43%,29% and 70% (Brock and Lasky, 1942). The authors of the study suggested that whilethe results for African schoolchildren was unrepresentative of Africans more generally,and the range of outcomes for whites did not permit firm conclusions, the figure forColoureds was reliable. Indeed, an accompanying Social Survey of Cape Townconcluded that from 48% to 58% of urban Coloureds were so poor that they were highlyunlikely to be able to afford adequate nutrition (Brock and Lasky 1942, p. 259).
Partial data from earlier years suggest that the crude death rate among Coloureds was twoto three times greater than for whites and that the Coloured infant mortality rate were twoto four times as great as the white.19 In contrast variation across different classes ofEuropeans was negligible (1936 Commission, p.87). Following publication of its 1937report the South African government began to collect systematic information on vitalevents for the Coloured population. The first two decades of mortality data aresummarized in Table 2 and Table 3. Infant mortality and life expectancy for Colouredsimproved noticeably during the 1940s and 1950s. And yet race differentials also widenedas whites improved at a faster pace than Coloureds. In spite of some gains the relativeposition of Coloured people at mid-century had changed little from the early years of the20th century.
[TABLE 2 HERE][TABLE 3 HERE]
19. For 1935 deaths per 1000 among non-Europeans in Cape Town were 23.7 compared to 10.8 for whites.In Kimberley the rate was 20.1 for Coloureds compared to 12.3 for whites. Port Elizabeth saw23.3 and 9.24. In Pretoria (Transvaal) the rate were 12.8 and 8.6. In Johannesburg Coloureds hada rate of 27.3 compared to 10.4 for whites (South Africa 1937 p.87). Infant mortality rate per1000 for non-Europeans in Cape Town was 146.2 compared to 50.4 for whites. Kimberley’s infantmortality for Coloureds was 139.2 compared to 69.3 for whites. In Port Elizabeth the numberswere 192.1 for Coloureds against 90.7 for whites (South Africa 1937, p.87).

South African Coloureds, 13
V. Evidence of Stature in the South African Forces in World Wars One and Two
Additional evidence of physical well-being is available from the attestation and medicalrecords of men who served in the South African forces of World War One and WorldWar Two. The literature of anthropometric history shows that early life nutrition,deprivation, disease exposure, physical and work environment have an influence onstature or height at all ages. Not surprisingly, stature is correlated with economic growthand general living conditions. Systematic height differences are also identified byoccupation, social status, place of birth and other sources of inequality in the biologicalstandard of living. In general, any characteristic of childhood experience that mightaffect nutrition, disease exposure or energy expenditure has the potential to influenceadult stature or height (Cole 2003; Komlos 1998; Steckel 1995, 2008, 2009).
The literature on other populations suggests that genetic endowment affects adult statureon an individual basis but that, as an average for large groups of people, genes explainvery little if any of mean stature variation between population. Race may matter, but itseffect is more likely to arise from systematic differences in nutrition, living conditions,disease exposure and work than from genetic composition (Margo and Steckel 1982;Bodenhorn 1999; Steckel 1995). The discussion of the previous sections, therefore, leadsus to expect powerful differences in stature by race or colour precisely because nutrition,living conditions etc differed systematically by race.
We attempt to examine these influences using individual data collected from attestationforms and medical examinations of men serving in the South African ExpeditionaryForce (SAEF) 1914-1918 and 1939-1945. These records survive in the South AfricanNational Defence Force Documentation Centre. South African units in the 1914-1918war (WWI) included about 146,000 men, a sizeable enlistment for a country of sixmillion, two-thirds of them native Africans who by and large did not enlist.20 Mostmilitary personnel came from the white community which numbered roughly 1.25million; of these perhaps 350,000 men were of an age and fitness to be able to serve.Hence the military personnel records represent between one-half and one-third of thewhite males available for military service.
We have examined the attestation papers for all WWI personnel whose surname beginswith ‘B’ and all members of the Cape Coloured Regiment (Table 4). This provides about9500 observations encompassing South African-born whites and Coloureds as well asforeign-born who enlisted in South Africa (Table 4). A similar proportion of thepopulation served in WWII. The internal organization of files forces us to sample on adifferent basis for WWII. Here we enter detail from all files found in a random selectionof file boxes. The boxes for Coloured military units hold 70 files on average against 30files in the boxes for white units. We select 25% of boxes for Coloured units and 4$ of
20. 27000 Africans are known to have enlisted in the South African Native Labour Corps during WWI.Surviving records of this unit do not include information about height.
South African Coloureds, 14
the boxes for white units. Data entry is not yet complete for WWII; here we are able toreport on the analysis of 5500 WWII records.21
[TABLE 4 HERE]
Entry into the SAEF is not known to have presupposed a minimum or maximum heightor any other requirement apart from being in good health. Indeed, Figures 1 and 2suggest that that height for both whites and Coloured is close to normally distributed,Nevertheless, because armies elsewhere in the British Empire imposed a minimum heightof 63 inches (Britain, Canada) or 64 inches (New Zealand) it seems prudent to assumethat in South Africa, as elsewhere, those shorter than 63 inches did not enlist at the samerate as taller men. Consequently for much of our analysis we treat the South Africanpersonnel as if they were truncated at the conventional minimum. We examine onlythose who would have stopped growing and not yet begun to shrink noticeably, ie thoseaged 21-49 years.
[FIGURE 1 HERE][FIGURE 2 HERE]
The personal characteristic of interest, stature, is available from most records measured tothe nearest quarter-inch with some heaping the inch and half-inch. Socio-economicdescriptions of individual soldiers included literacy (inferred from signatures),occupation, age at enlistment, place of birth/residence, race, year and month ofenlistment. It is thus possible to assign a year of birth for almost all observations. Wedistinguish in the WWI data three decadal cohorts, those born 1865-1880, 1881-1890 and1891-1900 to reflect the years before gold is discovered and then the rapid industrialtransformation of the 1880s and 18890s. We also have three birth cohorts in the WWIIdata for those born 1890-1909, 1910-1917 and 1918-1929. The proportion of the samplearising from each group is given in Table 5.
[TABLE 5 HERE]
The enlistment records also allow us to identify origin by province and rural/urbanlocality. The birth place for 63% of WWI whites and 42% in WWII is the Cape; about90% of Coloureds in both wars were born in the Cape. Participation in the armed forcesfrom the Transvaal expanded very quickly from WWI to WWII. We distinguish ruralfrom urban birthplaces in each of the four provinces.22 The locational detail permitssome testing of the influence of socio-economic environment during childhood on adulthealth.
21. Also present among the WWII records are a number of personnel files for Africans and for whitewomen, which we will examine when data collection is complete for Coloured and White men.
22. The 1911 census showed that there were 55 towns in South African with inhabitants of 2,000 or morepersons (South Africa Year Book No. 3, 1919). Marais (1968) and Deacon (2004 p. 37) providethe names of towns during the 19th century; for example Deacon identifies 97 populationconcentrations that had a resident doctor.

South African Coloureds, 15
We attempt to capture additional effects of early life household circumstances throughthe proxy of current occupation (which is presumed to reflect father’s occupation due tointergenerational continuity). We allocate the 200 or so occupational titles returned bythe recruits into four broad classifications following the 1910 census, Davies (1989) andCarson (2006).23 Fortunately, the types of jobs recorded in our data are very specific.Highly skilled and merchants are coded as white collar workers. Manufacturing,construction and related trades are classed as skilled workers. The third category offarmers comprises farmers and related jobs. The last group is unskilled or general handsand laborers. Substantial changes in the occupational composition of the white soldiersare visible from WWI to WWII: the proportion of farmers fell markedly and the relativeimportance of the unskilled group increased by an even larger measure. Almost all ofthe Coloureds were skilled or unskilled in both wars; the latter were twice as numerous asthe former. White collar occupations typically required education, while farmers reliedon access to land; Coloureds access to both was greatly limited.
VI. Identifying the Patterns of Inequality in Stature
The plot of height distribution of adult white and Coloured heights by year of birth inFigure 3 illustrates that whites averaged more than two inches taller than Coloureds fromthe 1860s to the 1920s. Coloured stature among the WWI cohorts appears to havedeclined slightly relative to whites after 1885. Whites may have grown slightly tallerrelative to Coloureds again in the post-1900 WWII cohorts. These summary trends makeclear that the disparity in adult stature between whites and Coloureds was not tending todiminish over time. Multivariate estimation of the determinants of stature is needed to toexplore this pattern more finely.
[FIGURE 3 HERE]
The estimations reported in tables 6 and 7 expose competing influences on stature.Columns I and IV in both tables report an analysis of whites and Coloureds jointly. Asingle dummy variable ‘White’ captures the simple effect of being white after allowingfor all other influences. The Column I model includes the late adolescents who are stillgrowing (with dummy variables to capture the growth) while the Column IV modelexamines adults only. The estimated height differential rises from 2.0 to 2.6 inches(column I) or from 2.5 to 2.7 inches (column IV). The enormous height advantage of thewhites is clear, as is the tendency for their advantage to increase from the WWI cohorts(born 1865-1900) to WWII cohorts (born 1890-1925).
Whites and Coloureds are sufficiently different to recommend separate regressions thatdo not constrain the independent variables to have exactly the same influence on bothgroups. Estimating with and without the late adolescents provides useful confirmationthat the pattern of results is qualitatively insensitive to this choice. For simplicity wefocus on the adult-only models reported in columns V and VI of both tables. In Table 6
23. The 1911census listed 428 job types divided into 10 main occupational categories (South Africa .1912.Census of the Union of South Africa 1911.Part V- Occupations of the People pp.448-628). Davies(1976 p.68) provides a long list of skilled, supervisory and less skilled jobs that were reserved forwhites under the 1904 Labor Importation Ordinance used in the South African mines.

South African Coloureds, 16
we see no statistically significant tendency for white stature to change across the WWIcohorts although there is a significant increase in Table 7 from those born before 1910 tothose born 1910-1917. Among Coloureds, a significant decline in WWI data is visiblefrom the 1880s to the 1890s, with no further change in subsequent WWII cohorts. Thedivergence visible in Figure 3 is thus confirmed to arise from two sources, decliningColoured stature in the 1890s and increasing white stature in the war decade.
Comparison of the constant in both tables (again, columns V and VI) allows us tocompare directly the stature of unskilled recruits born in the rural Cape 1881-1890 and1910-1917. For this demographic group the gap in stature increased from 1.8 inches to2.8 inches independently of all other influences.
[TABLE 6 HERE][TABLE 7 HERE]
The co-efficients on provincial identifications confirm that, controlling for all otherfactors, stature was smallest in the Cape and largest in the OFS and Transvaal for WWIwhites at any rate. The Natal-born were tallest amongst WWII whites. Provincialdifferences were less pronounced for Coloureds, although those born in the 19th centuryTransvaal were particularly short. Those born in urban areas were consistently shorter inboth wars and for both racial groups. The height penalty for urban birth is particularlylarge for the whites born after 1890; the coefficient on WWII cohorts was -.62 against -.36 in WWI cohorts.
The pattern of occupational height differentials follows an expected pattern. In bothwars, white farmers and white-collar workers were much taller than the unskilled group.We use the soldier’s occupation as a proxy for father’s occupation and hence of resourceavailability and disease exposure in youth. It is possible, of course, that some of thestrength of the occupational effect reflects reverse causation, ie taller men migrating intohigher status occupation because of the social advantages of height rather than being apure effect of childhood circumstance. Very few Coloured were farmers or in white-collar posts, however a small stature superiority of skilled over unskilled workers isvisible in the WWI data. This effect is still positive for WWII although no longersignificant.
We do not estimate with literacy as an independent variable for three reasons. It is notinteresting for whites because of near-universal literacy. For Coloureds, unfortunately, asignificant proportion of our WWII records do not provide evidence of literacy. Thoserecords which do report signatures, however, suggest a marked increase in literacy amongColoured from 52% of the WWI cohorts to 84% of the WWII cohorts. There is also aninterpretative awkwardness with literacy, which signals childhood in a family withgreater resources but it also may signal a family that invested in education rather thanfood or other contributors to net nutrition. The former suggests a positive correlationbetween height and literacy while the latter suggests a negative correlation. The lattereffect, if it is felt, carries the added complication that literacy and stature are determinedsimultaneously, and yet we have no easy way to implement an appropriate model.

South African Coloureds, 17
We are able to consider one additional influence, that of membership in the DutchReformed church. In itself, of course, church membership has no significance for statureor any other indicator of health outcome. In South Africa during this period, however,the Dutch Reformed church was dominated by white Afrikaners, who are often thought tohave had a meat-dominated ie protein-intensive diet. We turn to church membership as aproxy because we have no other systematic evidence of diet. In fact, white members ofthe Dutch Reformed Church born in the 19th century and serving in WWI were taller.This effect is not visible for Coloured members of the church and the white DutchReformed in WWII.
Because the distribution of white and Afrikaner populations across the four provincesdiffered so much, and the provinces were very different, there is a risk that some race-specific effects may originate from the locational distribution in ways that the regressionmodel cannot easily disentangle. A useful check is to estimate directly on province-specific data. Only the Cape in WWI has a substantial number of both whites andColoureds. We are not looking for the Cape population to follow exactly the SouthAfrican pattern because the particularities of the Cape environment may well producedifferent patterns. At the same time, a strikingly different pattern for which noexplanation is available would reduce confidence in our estimation.
[TABLE 8 HERE]
The results, reported in Table 8, largely confirm the patterns of Table 6 albeit with somedifferences. The simple Coloured height penalty is of a similar magnitude, as is thedecline in stature for Coloureds born in the 1890s. Some effects are more pronounced:the urban penalty is larger, as are the differentials for white farmers and white-collarposts. The small Coloured skill premium and the Dutch Reform effect are no longervisible. Whites born before 1880 appear to have been significantly taller, implying adecline to the 1880s cohort. We consider that the Cape results are broadly similar tothose of all South Africa and that the differences are both interesting and plausible in thesense that possible explanations come to mind. Accordingly, we view the Cape-onlyestimation as enhancing rather than diminishing confidence in the integrity of our SouthAfrica-wide estimation.
VII. A Decomposition of Height Differentials
We are able to decompose the differences in average height for Coloureds and whites,and the differences in mean stature between provinces, into the portion originating withthe different profiles of individual characteristics and the difference shared acrosseveryone in each group. As is well-known this approach allows us to divide the observedaverage height between whites and Coloureds into both explained and unexplainedportions. We begin with the assumption of a linear relationship between the height ofindividual i , iJ , and a vector of some determinants of height during the growth stages,
iW .
iii WJ uba ++= (1)
South African Coloureds, 18
Eq. 1 allows for the possibility that whites and Coloureds differ in their ability to attainthe same height because of variations in socio economic environments. Thus differentvalues of a and b may exist for both whites and Coloureds. If whites and Coloured aredivided into two groups according to their height and the mean of the random error iu iszero for both whites and Coloureds, the discrepancy between average height of whitesand Coloureds can therefore be written as:
.coloredcoloredwhitewhitecoloredwhitecoloredwhite WWJJ bbaa -+-=- (2)
Adding and subtracting coloredwhiteWb on both sides of the Eq.2, yields:
[ ] [ ].coloredwhitewhitecoloredwhitecoloredcoloredwhitecoloredwhite WWWJJ /-+-+-=- bbbaa (3)
Equation 3 is the Oaxaca decomposition (Oaxaca, 1973) which provides a way todisentangle the effects of true discrimination versus ‘justified’ differences. The authorshere seek to focus on the differences between whites and Coloureds and therefore use thedecomposition in Eq. 3 rather than focus on the values of individual coefficient estimates.
The three terms on the right side of Eq.3 show the three sources of potential differences
in mean height between whites and Coloureds. The first term coloredwhite aa - is anydifference in average height that is unrelated to the covariates included in the regression.
The second term [ ],coloredwhitecoloredW bb - captures differences by race in the impact of
particular characteristics. The third term [ ]coloredwhitewhite WW /-b reveals the extent to whicha different set of characteristics for whites and Coloureds, in itself, might affect theaverage height differential. The same can be done for differences between provinces.
[TABLE 9 HERE]
We implement the Blinder Oaxaca decomposition on South Africa-wide WWI adults(combining whites and Coloureds) with Jann’s (2008) module in Stata 10. We report inTable 9 the mean height by group and their differences. The first panel shows thedifferences in height by each province and race. For example the mean height for OrangeFree State is 68.8 inches and that of other provinces 67.3 resulting in a height gap of 1.5inches. Analogously, Transvaal is taller by 1.3 inches, but the difference narrows to 0.84inches for Natal. More importantly, those in the Cape Province are on average shorterthan the rest by 1.5 inches. In the final column we see that whites are taller thanColoureds by 2.6 inches.
The bottom panel in Table 9 reports the decomposition of differentials into the effects ofendowments, estimate co-efficients and their interaction. For example, the first row inthe first column shows that mean increase in height for those in other provinces if theyhad the same environmental conditions and demographic composition (including race) asin Orange Free State. The coefficient -1.10 suggests that differences in endowments

South African Coloureds, 19
between Orange Free State and other provinces account for 0.39 inches of the height gap(1.4-1.01=0.39). The coefficient on white (final column) suggests that unobservedcharacteristics between whites and Coloureds account for about 2.1 inches of the heightdifferences (2.57-0.48=2.09).
The second row for coefficient shows the change in Coloured heights if we apply thewhite coefficient to Coloured characteristics. In order words it shows the unexplainedvariance. It suggests that the mean Coloured height would increase by 2.4 inches ifcoloureds had the unobserved characteristics of whites. The final row is the interactionterm which measures the simultaneous effect of differences in endowments andcoefficients.
We can summarise these results with the observation that Coloureds are shorter in partbecause of having personal characteristics that would reduce anyone’s stature (white orColoured), but this effect represents only a very small share of the overall heightdifferential. Most of the height differential originates with unexplained differences in theimpact of particular characteristics or unexplained differences that are entirelyindependent of the characteristics examined with these data. The large race differentialarises almost entirely from the characteristics and conditions of Coloureds vs whites that,despite our best efforts, we are unable to measure. The discussion in earlier sections ofthe paper makes clear that these differences are unlikely to reflect race in a genetic orbiological sense since the Coloureds shared considerable genetic heritage with the whitesas part of their complex and heterogeneous origins. Rather, race-based incomedisparities, living conditions, nutrition and access to health services during childhood, asdiscussed above, are likely to be responsible.
The decomposition of differentials by province suggests a somewhat different story.Differences in mean stature by province may be viewed as originating to a greater orlesser extent (depending on province) from all three sources: (i) differing endowmentsand composition (ii) unobserved characteristics that influence how the endowments affectstature and (iii) the interaction of the first two influences.
VIII. Interpretation
Clearly, stature is only one aspect of human health. Nevertheless it is significant that wefind no evidence of increasing stature across the cohorts. During the first quarter of the20th century populations in other countries saw the beginnings of a secular increase instature, but apparently not in South Africa. This pattern is consistent with scatteredevidence from other sources. The disease and diet implications of rapid urbanization andaccompanying economic change was no more favourable to the improvement of humanhealth in South Africa than in other environments during the late 19th century and,apparently, less favourable than in many other locations during the early 20th century(Haines 2004; Steckel 1995; Steckel and Haurin 1994). It is not possible at this point todiscriminate among alternate explanatory hypotheses, which might include the healthimplications of mining-based development, the extraordinary speed with which theTransvaal population expanded, a general hardening of social boundaries or, more

South African Coloureds, 20
simply, the fact that whites were already very tall and the particular condition of theColoureds pre-empted significant improvements in health.
Analysis of WWI and WWII enlistment records confirm a sizeable and persistent heightdifferential between whites and Coloureds. This is consistent with the diversity of otherevidence examined in earlier sections of the paper. The smallness of Coloured staturesuggests the possibility of malnutrition and stunting early in life. Indeed, an experienceof stunting followed by some recovery or catch-up would be consistent with the modeststature increase which we observe for Coloureds during their 20s. Nonetheless, anycatch-up beyond the age of 21 was quantitatively very small relative to the enormity ofthe height differential between racial groups. Indeed, there is some evidence across thecohorts of increasing inequality along racial lines in the physical standard of living and anabsolute deterioration in the condition of the Coloureds.
The Coloureds differed not for genetics reason but rather because of increasing social andeconomic isolation from the experience of all but the poorest whites. It is difficult toimagine a race-based group whose identity and experience is so clearly sociallyconstructed rather than being biologically constituted.
The powerful racial divide, whatever its origin, should not distract us from similarities inthe forces that drove country South Africans of different races to the mines and towns andthat shaped their physical well-being. Many sources of non-white impoverishment,proletarianization and adverse social conditions also created a class of whites whoexperienced only slightly better conditions. The problem of the ‘poor whites’ is visible inour data from the strong negative co-efficient for unskilled occupation and also for urbanenvironment. Inequality among whites was marked, just as some Coloureds fared muchbetter than others. It is worth remembering as well the black South Africans who were inthe majority but, unfortunately, not represented in our data. It is unlikely that this poorand marginalized population was able to escape the same adverse health effectsencountered by Coloureds.
The size of occupational differentials makes clear that the social inequality among whiteswas of some significance. The Coloured occupational differentials are somewhat mutedno doubt because of their clustering in a small number of occupations and our own rathersimple classification system. The occupational differentials of course are dwarfed by theeffects of race. Indeed, one measure of the remarkably powerful effect of race is toobserve that by itself race accounts for several times the effect of occupationaldifferentials (which themselves are of some size).
The regional pattern of height penalty implies some interesting possibilities. From theirinitial organization the Transvaal and Orange Free State (OFS) adopted policies that weremore severely discriminatory than in the Cape to Africans, Asians and Coloureds. Anextreme skewing of resources to favour whites is consistent with the provincial dummyvariables among WWI cohorts that show whites in the Transvaal and OFS to be muchtaller and Coloureds much shorter than in the Cape. Interestingly, the white advantage inthe Transvaal disappears among WWII cohorts, perhaps because of growing urbandisamenities as Johannesburg in particular expanded in advance of public health

South African Coloureds, 21
investments. The elimination of the Coloured disadvantage to living in the Transvaal(relative to the Cape) is more difficult to explain.
The large size of urban height penalty undoubtedly this reflects the very fast growth of aworking class population in Johannesburg and other Transvaal towns and cities. TheColoured population remained substantially resident in the Cape and hence was lessexposed to increasing urban disamenities of the Transvaal. Indeed, the Cape-onlyregression suggests that the Coloureds within the Cape experienced little or no urbanpenalty. Presumably this implies either that urban Cape Coloureds lived in sufficientlyprivileged circumstances to offset the usual disadvantages of an urban location or thattheir rural cousins lived in particular straightened circumstances. Both interpretations areplausible, and each may be correct to some extent.
Any discussion of physical well-being must acknowledge the possibility that dietarycustoms and other cultural practice may have been influential. Typically we have no wayto assess the effect of practices for which we have no systematic measure. It is useful toobserve, therefore, the positive correlation between adherence to the Dutch ReformedChurch and stature among WWI cohorts. This is consistent with received understandingsof the Afrikaner diet. However, if there was a stature-expanding Afrikaner diet, it wouldappear to have become less widespread among WWII cohorts, ie after 1900.
IX. Conclusion: Post-1948 Apartheid and the Origins of Poverty and Inequality forSouth Africa’s Coloured Population
We began the paper by noting poverty and its effects within South Africa’s Colouredpopulation today. It would be entirely reasonable to suspect that legislative andadministrative changes introduced by the National Party government elected in 1948contributed to inequality in South Africa during the second half of the 20th century. Theburden of the National Party’s attempt to identify and discriminate by race fellparticularly heavily on the Coloureds.
The Population Registration Act of 1950 created a national racial register and gaveeveryone a racial identity card. Among other objectives this register was designed toprevent non-whites from passing into the white community. Most of those who mighthope to pass in this way were Coloured. The Immorality Act of 1927 had prohibitedunions between Africans and whites but not between Coloureds and whites. Anamendment in 1950 followed by a Prohibition of Mixed Marriages Act outlawed, for thefirst time, marital and non-marital unions between Coloureds and whites (Marquard 1952,pp. 78-79). During the 1950s this legislation was used aggressively to prosecute mixedrace unions and to try many tens of thousands of borderline Coloured-white identity atthe Population Registration Appeal Board Board (Marquard 1960, 2nd ed., pp. 68-69).
Coloureds had held the franchise to vote (admittedly at a high minimum wealth standard)in the Cape since 1853 and in the Union since 1910. Africans were removed from thecommon electoral roll in 1936 but in spite of some creeping inequality Colouredsmaintained the vote and used it effectively through the 1940s in a large number of Capeconstituencies. Legislation first introduced in 1951 eventually cleared substantial

South African Coloureds, 22
constitutional hurdles in 1956 to remove Coloured voters from the common electoral roll.Henceforth Coloureds would not vote in national elections and, within the Cape, theycould vote for only 4 of the 55 representatives (Marquard 1952, pp. 79-80; Villiers 1971).The government made attempts to remove from Coloureds in the Cape the right to voteand to serve on municipal councils (Marquard 1960 2nd ed., p. 71ff).
The Land Act of 1913 had prevented Africans from owing land except in reserves butColoureds and Asians, at least in the Cape, had continued to be able to own land and livefreely until 1950 (Marquard 1952, p. 123). At that point specific residential areas weredesignated off-limits for Coloureds. The Group Areas Development Act of 1955 thengave the national government authority to overrule municipal authorities in order forceproperty sales and aggressively implement systematic spatial segregation.
These and other changes reflect the legislative tip of the administrative iceberg; thesystem of apartheid entrenched in the 1950s by the National Party was systematic andthoroughgoing. The new regime greatly affected all non-whites the most immediateimpact was felt by the Coloured community because it had the most to lose. PreviouslyColoured people “were administered on the European side of the colour line” (Marquard1952, p. 82). That changed between 1950 and 1960 as the status and entitlements of theColoured population changed dramatically for the worse.
The 1950s policy diminished the entitlements of Coloureds and limited their capacity toescape poverty. Nevertheless, our review of the evidence indicates that any post-1948deterioration of Coloured well-being was small relative to the profound inequality andchallenges facing Coloureds as early as the mid-19th century. Of course, the legal, socialand economic consequences of the 1948 election may well have halted tendencies foradvancement that Coloureds otherwise might have enjoyed. At the same time, nothing inthe 1920s and 1930s experience would have given reason to be optimistic for Colouredadvancement, even if the National Party had lost the 1948 election, except insofar asindividuals would have found it easier to pass as white.
References:
M. Adhikari, Not White Enough, Not Black Enough: Racial Identity in the South AfricanColoured Community (Athens University Press: Athens Ohio, 2005).
V. Bickford-Smith, “South African Urban History, Racial Segregation and the UniqueCase of Cape Town”, Journal of Southern African Studies v21 n1 (1995), pp. 63-78.
H. Bodenhorn, “A Troublesome Caste: Height and Nutrition of Antebellum Virginia’sRural Free Blacks” Journal of Economic History (1999), pp. 972-996.
J.F. Brock and J.M. Lasky, “The Findings of the Cape Nutrition Survey”, South AfricanMedical Journal v16 (July 11 1942), pp. 255-260.

South African Coloureds, 23
K. Breckenbridge, “The Allure of Violence: Men, Race and Masculinity on the SouthAfrican Goldmines, 1900-1950”, Journal of Southern African Studies v24n1 (1995), pp.669-693.
Sarah Burgard and Donald Treiman, “Trends and racial differences in infant mortality inSouth Africa”, Social Science and Medicine v62 n5 (2006), pp. 1126-1137.
Noel Cameron, “Physical Growth in a Transitional Economy: the Aftermath of SouthAfrican Apartheid”, Economics and Human Biology v1 n1 (2003), pp. 29-42.
A.J. Christopher, “‘To define the indefinable’: population classification and the census inSouth Africa”, Area v34 n4 (2002), pp. 401-408.
T.J. Cole, “The Secular Trend in Human Physical Growth: A Biological View”,Economics and Human Biology v1 (2003), pp. 161–168.
R. Davies Mining Capital, State and Unskilled white workers in South Africa. Journal ofSouthern African Studies, (1976), pp. 41-69.
Harriet Deacon, “Midwives and Medical Men in the Cape Colony before 1860”, Journalof African History (1998), pp. 271-292.
-----, “Racism and Medical Science in South Africa’s cape Colony in the mid to LateNineteenth Century”, Osiris, 2nd Series 15: Nature and Empire: Science and TheColonial Enterprise (2000), pp. 190-206.
-----, “Introduction: The Cape Doctor in the Nineteenth Century”, in H. Deacon, HPhillips and E. Van Heyningen, eds., The Cape Doctor in the Nineteenth Century: ASocial History (Rodopi: New York, 2004), pp.17-43.
Natasha Distiller and Meg Samuelson, “’Denying the Coloured Mother’: Gender andRace in South Africa”, L'Homme February 2005 and reprinted in Eurozine 2006-03-02.
Charles H. Feinstein. An Economic History of South Africa (CUP: Cambridge, 2005).
B. Freund, “Contrasts in Urban Segregation: A Tale of Two African Cities, Durban(South Africa) and Abidjan (Cote d’Ivoire)” Journal of Southern African Studies v37n3(2001), pp. 527-546.
Fox, F.W. “Diet in Relation to Health in South Africa: Biochemical Aspect”, SouthAfrican Medical Journal v8 (January 13 1934).
-----, “Diet and Health in South Africa: Malnutrition”, South African Medical Journal v10(Jan. 11 1936), pp. 25-36.
-----, “Some Nutritional Problems among the Bantu in South Africa”, South AfricanMedical Journal v13 (February 11 1939).

South African Coloureds, 24
Ian Goldin, Making Race: The Politics and Economics of Coloured Identity in SouthAfrica (London: Longman, 1987).
George Golding and Franklin P. Joshua, “The Coloured Community”, in G.H Calpin, ed.,The South African Way of Life: The Values and Ideals of a Multiracial Society (ColumbiaUniversity Press, New York, 1953), pp.70-78.
Michael Haines, “Growing Incomes, Shrinking People: Can Economic Development BeHazardous to Your Health”, Social Science History v28 (2004), pp. 249-270.
M. Henneberg and G.J. Louw, “Cross-sectional Survey of Growth of Urban and Rural‘Cape Coloured’ Schoolchildren”, American Journal of Human Biology v10 (1998), pp.73-85.
D. H. Houghton, The South African Economy (Cape Town: Oxford University Press,1980, 8th ed).
Ben Jann, A Stata implementation of the Blinder-Oaxaca decomposition, ETH ZurichSociology Working Paper No. 5. Zurich (2008).
E.N. Katz, “Revisiting the Origins of the Industrial Colour Bar in the Witwatersrand GoldMining Industry, 1891-1899”, Journal of Southern African Studies v25 n1 (1999), pp. 73-97.
T.J. Keegan, Rural Transformations in Industrializing South Africa: The SouthernHighveld to 1914 (London: McMillan Press, 1987).
John Komlos, “Shrinking in a Growing Economy? The Mystery of Physical Statureduring the Industrial Revolution” The Journal of Economic History v58 n3 (1998), pp.779-802.
L. Kuper, “White Supremacy is South Africa” The British Journal of Sociology v1 n2(1950), pp. 144-153.
Murray Leibbrandt et al, “Measuring Recent Changes in South African Inequality andPoverty Using 1996 and 2001 Census Data”, pp. 95-143 in Haroon H. Bhorat and R.Kanbur, eds., Poverty and Policy in Post-Apartheid South Africa (Pretoria: HSRC Press,2006.
A. Mabin and D. Smit, “Reconstructing South Africa’s Cities? The Making of UrbanPlanning 1900-2000”, Planning Perspectives v12 (1997), pp. 193-223.
J.S. Marais, The Cape Coloured People: 1652-1937 (Witwatersrand University Press,Johannesburg, 1939).

South African Coloureds, 25
Robert Margo and Richard Steckel, “Heights of American Slaves: New Evidence onNutrition and Health”, Social Science History v6 n4 (1982), pp. 516-538.
Shula Marks, “The Silent Scourge? Silicosis, Respiratory Diseases and Gold Mining inSouth Africa”, Journal of Ethnic and Migration Studies v32 n4 (2006), pp. 569-589.
Leo Marquard, The Peoples and Policies of South Africa (Capetown: Oxford UniversityPress), 1952 2nd ed 1960.
F. Mitchell, “The Plague in Cape Town in 1901 and Its Subsequent Establishment as anEndemic Diseases in South Africa”, South African Medical Journal Special Issue 9(1983), pp. 17-19.
R. Oaxaca, “Male- Female Differentials in Urban Labor Markets”, InternationalEconomic Review v14 n3 (1973), pp. 693-709.
Berk Özler, “Not Separate, Not Equal: Poverty and Inequality in Post-apartheid SouthAfrica”, Economic Development and Cultural Change v55 n3 (2007), pp.487-529.
Sheila Patterson, Colour and Culture in South Africa: A Study of the Status of the CapeColoured People within the Social Structure of the Union of South Africa (London:Routledge and Kegan Paul Limited, 1953).
R.M. Packard, White plague, Black Labor: Tuberculosis and the Political Economy ofHealth and Disease in South Africa (University of California Press: Los Angeles, 1989).
H. Phillips, “The Local State and Public Health Reform in South Africa: Bloemfonteinand the Consequences of the Spanish Flu Epidemic of 1918”, Journal of SouthernAfrican Studies, 13(v13 n2(1987), pp. 210-233.
-----, ‘A Move for the Better’: Changing Health Status among Jewish Immigrants in CapeTown, 1881-1931”. Journal of Ethnic and Migration Studies v32 n4 (2006), pp. 591-601.
Robert Ross, Adam Kok’s Griquas: A Study in the Development of Stratification in SouthAfrica (Cambridge: CUP, 1976).
D. Scott, “‘Creative Destruction’: Early Modernist Planning in the South DurbanIndustrial Zone, South Africa”, Journal of Southern African Studies v29 n1 (2003), pp.235-259.
C. Simkins and E. van Heyningen, “Fertility, Mortality, and Migration in the CapeColony, 1891-1904”, International Journal of African Historical Studies v22 n1 (1989),pp. 79-111.
South Africa, Census of the Union of South Africa 1911 (Pretoria: Government Printer,1912).

South African Coloureds, 26
South Africa, Official Year Book of the Union of South African and of Basutoland,Bechuanaland Protectorate and Swaziland, No.3 (Pretoria: Government Printer, 1919).
South Africa, Report of Commission of Inquiry Regarding the Cape Coloured Populationof the Union (Pretoria: Government Printer, 1937).
South Africa, Bureau of Census and Statistics, Union Statistics for Fifty Years, JubileeIssue 1910-1960 (Pretoria, 1960).
Richard H. Steckel, “Stature and the Standard of Living”, Journal of Economic Literaturev33 n4 (1995), pp. 1903-1940.
-----, “Biological Measures of the Standard of Living”. Journal of Economic Perspectivesv22 (2008), pp. 129–52.
-----, “Heights and Human Welfare: Recent Developments and New Directions”,Explorations in Economic History v46 (2009), pp.1-23.
----- and D. R. Haurin, 1994. Health and Nutrition in the American Midwest: Evidencefrom the Height of National Guardsmen, 1850-1910”, in John Komlos, ed., Stature,Living Standards and Economic Development (Chicago: of Chicago Press, pp. 117-128).
Maryna Steyn and J.R. Smith, “Interpretation of Ante-mortem Stature Estimates in SouthAfricans”, Forensic Science International v171 (1907) n2 pp 97-102.
M.W. Swanson, “The Sanitation Syndrome; Bubonic Plague and Urban Native Policy inthe Cape Colony, 1900-1909”, The Journal of African History v18n3 (1977), pp. 387-410.
-----, “‘The Asiatic Menace’: Creating Segregation in Durban, 1870-1900”, TheInternational Journal of African Historical Studies, v16n3 (1983), pp. 401-421.
-----, “Sanitation Syndrome: Bubonic Plague and Urban Native Policy in the CapeColony, 1900-1909”, in (eds) W. Beinhart and S. Dubow. Segregation and Apartheid inthe Twentieth Century (London: Routledge, 1995), pp.25-42.
Viviene Taylor, South Africa Human Development Report 2000 (United NationsDevelopment Program, 2000).
United Nations Development Program (UNDP), Human Development Report 2007/2008(Houndmills: Palgrave Macmillan, 2007).
B. Unterhalter, “Inequalities in Health and Disease: The Case of Mortality Rates for theCity of Johannesburg, South Africa, 1910-1979”, International Journal of HealthServices, v12 n4 (1982), pp. 617-636.

South African Coloureds, 27
D. van Arke, G.C. Quispel and Robert Ross, “Going Beyond the Pale: On the Roots ofWhite Supremacy” in Robert Ross, ed., Beyond the Pale, Essays on the History ofColonial South Africa (Hanover NE: Wesleyan, 1993), pp69-110.
P.L. van den Berghe, South Africa: A Study in Conflict (Middleton: Wesleyan U Press,1965).
G. Verhoef, “From Friendly Society to Compulsory Medical Aid Association The Historyof Medical Aid Provision in South Africa’s Public Sector, 1905–1970”, Social ScienceHistory v30n4 (2006).
Rene de Villiers, “Afrikaner Nationalism”, pp. 365-423 in The Oxford History of SouthAfrica, vol II (Oxford: Clarendon Press, 1971), ed. Monica Wilson and LeonardThompson.
Graham Watson, Passing for White: a Study of Racial Assimilation in a South AfricanSchool (London: Tavistock, 1970).
D. Welsh, “The Growth of Towns”, pp. 172-243 in The Oxford History of South Africa,vol I (Oxford: Clarendon Press, 1969), ed. Monica Wilson and Leonard Thompson.
Monica Wilson, “Farming 1866-1966”, pp.104-171 in The Oxford History of SouthAfrica, vol I (Oxford: Clarendon Press, 1969), ed. Monica Wilson and LeonardThompson.
-----, “Co-operation and Conflict: The Eastern Cape Frontier” pp. 233-271 in The OxfordHistory of South Africa, vol I (Oxford: Clarendon Press, 1969), ed. Monica Wilson andLeonard Thompson
O. D. Wollheim, “Education in South Africa”, in G.H Calpin, ed., The South African Wayof Life: The Values and Ideals of a Multiracial Society (Columbia University Press: NewYork, 1953), pp. 91-104.
Ingrid Woolard and Chris Woolard, Earnings Inequality in South Africa, 1995-2003(Human Sciences Research Council, 2007).

South African Coloureds, 28
nb – This figure reports those only born in South Africa
inches80.0075.0070.0065.0060.0055.0050.00
Frequency
400
300
200
100
0
Figure 1: Frequency Distribution by Size, WWI, Adult Men, Coloureds
Mean =65.30Std. Dev. =2.519
N =2,046

South African Coloureds, 29
nb – This figure reports those only born in South Africa
inches
80.0075.0070.0065.0060.0055.00
Frequency
500
400
300
200
100
0
Figure 2: Frequency Distribution by Size, WWII, Adult Men, Whites
Mean =68.26Std. Dev. =2.591
N =3,012

South African Coloureds, 30
Figure 3: Mean Stature (inches), White and Coloured Adults, WWI and WWII
nb – This figure reports those only born in South Africa
65
66
67
68
69
70
1860 1880 1900 1920Birth year
White WWI White WWIIColoured WWI Coloured WWII

South African Coloureds, 31
Table 1: Population of South African Provinces, 1865 -1951
Total White African Asian ColouredCape1865 496,381 181,592 ---- ---- ----1875 720,984 236,783 287,639 ---- 196,5621891 1,527,224 376,987 838,136 1,700 310,4011904 2,409,804 579,741 1,424,787 10,242 395,0341911 2,564,965 582,377 1,519,939 7,690 454,9591951 4,427,000 935,000 2,492,000 18,000 982,000
Natal1891 543,913 46,788 455,983 41,142 ----1904 1,108,754 97,109 904,041 101,418 6,6861911 1,194,043 98,114 953,398 133,439 9,0921951 2,414,000 274,000 1,810,000 299,000 18,000
Transvaal1890 ---- 119,128 ---- ---- ----1904 1,269,951 297,277 937,127 11,321 24,2261911 1,686,212 420,562 1,219,845 11,072 34,7331951 4,813,000 1,205,000 3,484,000 49,000 75,000
Orange Free State1880 133,518 61,022 ---- ---- ----1890 207,503 77,716 ---- ---- ----1904 387,315 142,679 225,101 253 19,2821911 528,174 175,189 325,824 108 27,0531951 1,030,000 228,000 774,000 13,000 15,000
Source: South Africa, Census of the Union of South Africa 1911, Part 1 Population andDwellings (1912) and South Africa, Union Statistics for Fifty Years (1960).

South African Coloureds, 32
Table 2: Infant Deaths per 1000 Live Births, White and Coloured South Africans,1937-1958
White Coloured
1937-1939 52 1641940-1944 48 1631945-1949 37 1361950-1954 34 1301955-1958 30 133
1980s 13 571998 14 31
Source: South Africa, Union Statistics for Fifty Years, 1960, B33; Cameron 2003 (for1980s), Burgard and Treiman 2006 (for 1998, from DHS)
Table 3: Life Expectancy at Select Ages, Coloured and White South Africans,1920-1952
males femaleswhite coloured white coloured
expectation of life at birth1935-1937 58.9 40.1 63.1 40.11945-1947 63.8 41.7 68.3 44.01950-1952 64.6 44.8 79.1 47.8expectation of life at age 51935-1937 59.8 50.3 63.3 50.01945-1947 62.3 48.8 66.4 50.91950-1952 62.8 52.2 67.8 55.1expectation of life at age 101935-1937 55.4 46.5 58.9 46.31945-1947 57.7 44.9 61.7 47.01950-1952 58.1 48.1 63.1 51.0
Source: South Africa, Union Statistics for Fifty Years, 1960, B48-49

South African Coloureds, 33
Table 4: Basic Data Description, Military Personnel Records
Description WWI WWIITotal observations 9497 5576Observations foreign born 2281 339All South African born 7216 5236South Africans below 21 years 2149 1593South Africans above 20 years 5069 3643South Africans above 50 years 13 121South Africans 21 to 50 years 5056 3522South Africans 21-50 and >=63’ 268 3473South Africans 21-50 missing height 21 57All South African adult coloreds 1790 1190All South African adult whites 2988 2283All South African sub-adults 2049 1593All Sub-adults missing height 30 15Sub-adults coloreds only 700 257Sub-adults whites only 1319 1335
South African National Defence Force Documentation Centre, South AfricanExpeditionary Force Personnel Records, 1914-1918 and 1939-1945.

South African Coloureds, 34
Table 5: World War One and World War Two Full Sample Descriptive Statistics
White Adults Colored Adults White Sub-Adults
Colored Sub-Adults
MeanWW1
MeanWW2
MeanWW1
MeanWW2
MeanWW1
MeanWW2
MeanWW1
MeanWW2
DependentHeight (Inches) 68.54 68.79 66.11 66.15 67.58 67.8 64.81 65.9
IndependentB 1865 to 1880 0.164 - 0.126 - - - - -B 1881 to 1890± 0.391 - 0.368 - - - - -B 1891 to 1900 0.445 - 0.506 - - - - -B 1890 to 1909 - 0.213 - 0.322 - - - -B 1910 to 1917 - 0.249 - 0.295 - - - -B 1918 to 1929 - 0.440 - 0.281 - - - -
18years - - - 0.338 0.235 0.130 0.27219years± - - - 0.379 0.191 0.379 0.34620years - - - 0.282 0.151 0.491 0.335DutchReformed 0.322 0.091 0.331 0.101Born Cape 0.631 0.416 0.946 0.853 0.576 0.440 0.966 0.853Born Natal 0.091 0.154 0.009 0.034 0.138 0.174 0.009 0.024Born Transvaal 0.185 0.351 0.027 0.089 0.213 0.322 0.023 0.082Born O.F. State± 0.093 0.079 0.018 0.023 0.073 0.063 0.003 0.033Urban 0.551 0.640 0.646 0.508 0.669 0.623 0.723 0.525White Collar 0.287 0.326 0.027 0.008 0.361 0.501 0.034 0.017Skilled 0.281 0.240 0.313 0.302 0.297 0.130 0.271 0.177Unskilled 0.168 0.332 0.636 0.665 0.205 0.301 0.693 0.779Farmers± 0.223 0.102 0.025 0.025 0.138 0.067 0.017 0.028Literate‡ 0.974 0.99 0.515 0.84 0.990 0.98 0.533 1
Notes: ±Variables omitted during estimation to avoid dummy variable trap‡Variable not used in all estimations*All covariates except the dependent variable (inches) are dummy variables.

South African Coloureds, 35
Table 6: Truncated Regression Analysis of White and Coloured Stature, SouthAfricans in WWI
I II III IV V VIAll SouthAfricans
All whites AllColoureds
All adults All whiteadults
Allcolouredadults
1865-1880-0.031(-0.31)
-0.007(-0.06)
-0.176(-1.07)
-0.063(-0.52)
0.022(0.16)
-0.390*(-1.8)
1890-1897-0.176(-2.41)
-0.120(-1.22)
-0.282***(-2.61)
-0.283***(-3.3)
-0.098(-0.92)
-0.629***(-4.74)
18 years-0.406(-1.45)
-0.413(-1.62)
-- -- --
20 years0.108(0.57)
0.142(0.83)
-- --- --
Above 20 years1.168***(7.49)
1.161***(7.92)
-- -- --
Dutch Reformed0.220***(3.01)
0.505***(4.92)
-0.234**(-2.27)
0.294***(3.28)
0.534***(4.8)
-0.269*(-1.83)
Natal0.110(0.76)
0.217(1.35)
0.108(0.24)
0.133(0.81)
0.217(1.23)
0.150(0.25)
Transvaal0.396***(3.73)
0.479***(3.91)
-0.596**(-2.22)
0.467***(3.83)
0.517*(3.92)
-0.926**(-2.21)
Orange free0.563***(4.04)
0.554***(3.48)
0.335(0.93)
0.620***(3.93)
0.603***(3.54)
0.469(1.01)
Urban-0.296***(-4.47)
-0.330***(-3.5)
-0.197**(-2.18)
-0.391***(-4.81)
-0.363***(-3.56)
-0.348***(-2.78)
White Collar0.430***(3.99)
0.395***(2.87)
0.415(1.53)
0.446***(3.5)
0.404***(2.69)
0.519(1.41)
Skilled0.137*(1.75)
-0.001(0.00)
0.221**(2.33)
0.148(1.48)
0.020(0.14)
0.261*(2.01)
Agriculture0.640***(5.72)
0.470***(3.32)
0.663**(2.32)
0.609***(4.67)
0.486***(3.18)
0.464(1.26)
White2.001(23.59)***
-- --- 2.525***(24.19)
--- ---
Constant65.085***(384.18)
68.199***(487.34)
65.205***(356.38)
65.731***(566.17)
68.100***(445.87)
66.272***(443.83)
Sigma2.282***(103.32)
2.429***(76.79)
2.063***(69.14)
2.455***(76.03)
2.509***(65.41)
2.244***(40.39)
N 5338 2948 2390 5055 2928 2127
Notes: t-statistics in parentheses are significant at the ***=1, **=5 and *=10 percent.Standard errors in all the models were estimated using White’s heteroskedastic consistentstandard errors.The omitted age cohort for adults is 1881 to 1890. Omitted age for sub-adults is 19 years.Omitted province is Cape Province and occupation category is unskilled.

South African Coloureds, 36
Table 7: Truncated Regression Analysis of White and Coloured Stature, SouthAfricans in WWII
I II III IV V VIAll SouthAfricans
All whites AllColoureds
All adults All whiteadults
Allcolouredadults
1891_1909-0.338***(-2.64)
-0.277**(-2.13)
-0.415(-1.47)
-0.281***(-2.5)
-0.286**(-2.15)
-0.273(-1.37)
1918_1929-0.021(-0.15)
-0.0700(-0.41)
0.120(0.43)
-0.095(-0.6)
-0.167(-0.9)
0.131(0.47)
18 years0.738***(3.56)
0.909***(3.94)
-0.735*(-1.92)
--- --- ---
20 years0.971***(4.23)
1.180***(4.53)
-0.580(-1.5)
--- --- ---
Over 20 years1.006***(5.00)
1.188***(5.16)
-0.388(-1.17)
--- --- ---
DutchReformed0.211*(1.75)
0.146(1.04)
0.317(1.24)
0.161(1.27)
0.125(0.89)
0.204(0.68)
Natal0.707***(5.12)
0.758***(5.14)
0.192(0.49)
0.663***(3.87)
0.688***(3.73)
0.258(0.55)
Transvaal0.119(1.15)
0.122(1.05)
0.145(0.59)
0.101(0.81)
0.083(0.61)
0.286(0.98)
Orange Free0.096(0.28)
-0.084(-0.22)
0.909*(2.1)
0.439*(1.99)
0.361(1.51)
0.694(1.26)
Urban-0.242**(-2.45)
-0.468***(-3.63)
0.006(0.05)
-0.490***(-4.36)
-0.623***(-4.54)
-0.250***(-1.82)
Whitecollar0.177(1.27)
0.166(1.08)
-0.043(-0.09)
0.407***(2.87)
0.366***(2.41)
-0.386(-0.54)
Skilled0.095(0.8)
-0.033(-0.23)
0.3562*(1.71)
0.1063(0.82)
-0.024(-0.15)
0.352(1.7)
Agriculture0.780***(3.93)
0.756(3.43)
0.389(0.88)
0.674***(3.02)
0.642***(2.64)
0.414(0.76)
White2.648***(20.87)
--- --- 2.657***(18.55)
--- ---
Constant64.865(231.3)
67.589***(207.3)
65.956***(156.19)
66.092(486.7)
68.911***(372.55)
66.053***(379.17)
Sigma3.171***(10.84)
2.976***(11.46)
3.591***(4.89)
2.448***(54.52)
2.490***(50.19)
2.221***(22.88)
N 4126 2982 1144 2707 1896 813
Notes: t-statistics in parentheses are significant at the ***=1, **=5 and *=10 percent.Standard errors in all the models were estimated using White’s heteroskedastic consistentstandard errors.The omitted age cohort for adults is 1910 to 1917. Omitted age for sub-adults is 19 years.Omitted province is Cape Province and occupation category is unskilled.

South African Coloureds, 37
Table 8: Truncated Regression Analysis of White and Coloured Stature, Cape-bornonly in WWI
I II III IV V VIAll Cape All Cape
WhitesAll Cape
ColouredsAll CapeAdults
CapeAdultwhites
CapeAdult
coloureds
1865-1880-0.029(-0.23)
0.512***(2.93)
-0.673***(-3.66)
0.2183(1.49)
0.516***(2.8)
-0.322(-1.41)
1890-1897-0.300***(-3.46)
-0.080(-0.64)
-0.564***(-4.67)
-0.405***(-4.37)
-0.253*(-2.1)
-0.630***(-4.64)
18 years-0.473***(-2.81)
-0.572***(-2.69)
-0.362(-1.24)
-- -- --
20 years0.015(0.11)
0.014(0.06)
0.078(0.4)
--- -- --
Above 20 years0.458***(3.91)
0.344**(2.09)
0.587***(3.54)
-- -- --
Dutch Reformed0.044(0.59)
0.050(0.47)
0.023(0.23)
0.062(0.69)
0.097(0.83)
-0.006(-0.05)
Urban-0.374***(-5.11)
-0.608***(-5.81)
-0.139(-1.37)
-0.482***(-5.6)
-0.670***(-5.99)
-0.169(-1.33)
White Collar0.679***(6.02)
0.6948***(5.05)
0.557*(1.84)
0.580***(4.58)
0.515***(3.43)
0.545(1.5)
Skilled0.214***(2.59)
0.171(1.28)
0.232**(2.2)
0.179*(1.75)
0.022(0.16)
0.308**(2.35)
Agriculture1.025***(8.01)
1.030***(6.68)
0.519*(1.65)
0.918***(6.55)
0.8495***(5.13)
0.483(1.31)
White2.387***(29.74)
--- --- 2.290***(23.18)
--- ---
Constant65.391***(420.00)
67.838***(297.77)
65.374***(310.67)
65.954***(542.87)
68.300***(414.14)
66.106***(424.18)
Sigma2.435***(102.46)
2.474***(72.97)
2.376***(71.93)
2.430***(71.23)
2.493***(59.58)
2.242***(40.22)
N 5249 2662 2587 4694 2599 2095
Notes: t-statistics in parentheses are significant at the ***=1, **=5 and *=10 percent.Standard errors in all the models were estimated using White’s heteroskedastic consistentstandard errors.The omitted age cohort for adults is 1881 to 1890. Omitted age for sub-adults is 19 years.Omitted province is Cape Province and occupation category is unskilled.
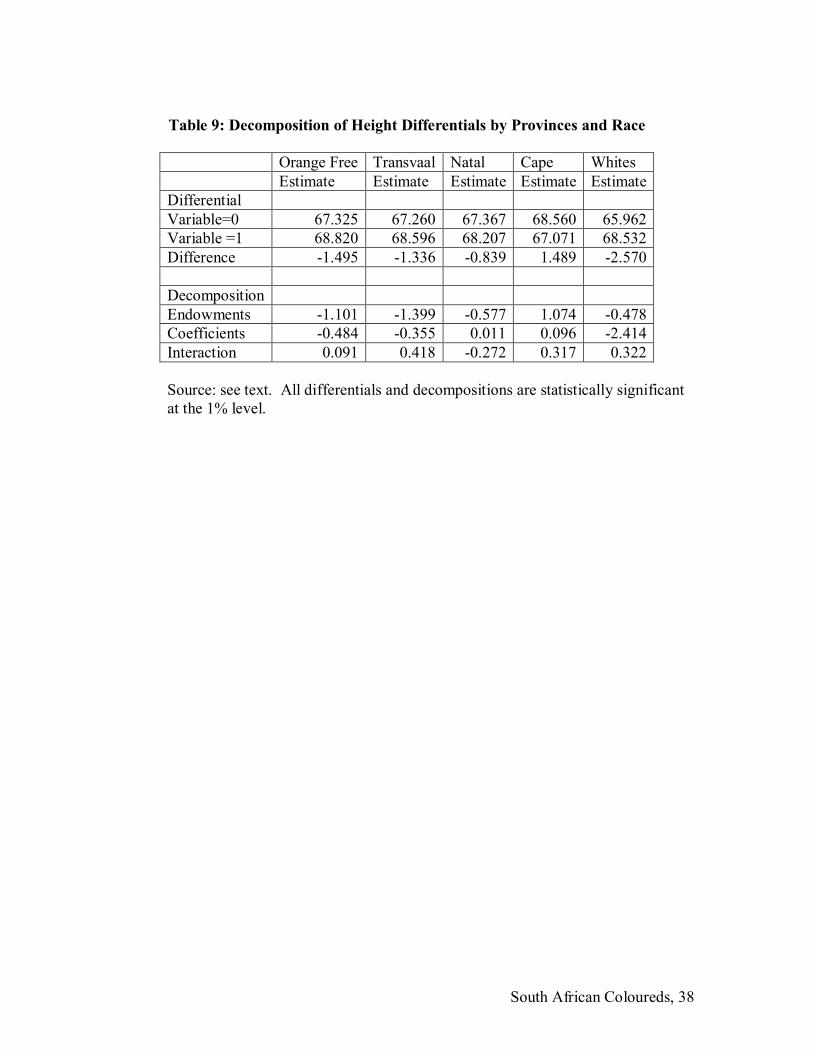
South African Coloureds, 38
Table 9: Decomposition of Height Differentials by Provinces and Race
Orange Free Transvaal Natal Cape WhitesEstimate Estimate Estimate Estimate Estimate
DifferentialVariable=0 67.325 67.260 67.367 68.560 65.962Variable =1 68.820 68.596 68.207 67.071 68.532Difference -1.495 -1.336 -0.839 1.489 -2.570
DecompositionEndowments -1.101 -1.399 -0.577 1.074 -0.478Coefficients -0.484 -0.355 0.011 0.096 -2.414Interaction 0.091 0.418 -0.272 0.317 0.322
Source: see text. All differentials and decompositions are statistically significantat the 1% level.