populationandthefamily injapan · the family, which forms the foundation of societal development,...
TRANSCRIPT

Suppo rted by th oJ npnu Shipbuilding Indu stry Founda tion(Chairman, H.yoichi Sasukuwnt "Population and Development"Series No.9
Population and the Family
in Japan
in troduction and Overvie wby Toshio Kuroda
Popula tion and the Familyby Toshio Kuroda
Trends and Ana lysis of Factors Causin g Changes in t he Familyby Yoichi Okazaki
Family a nd Regional Developmen tby Hiroaki Shi mizu
P opulatio n Agi ng and Familyby Sumiko Uchi no
Forecast of F u ture Ho useho lds a nd Ch anges in Japanese Family Str uctu reby Mak oto Ato
The Japanese Family: Public Opin io n Survey Findingsby Michio Ozaki
February 1989
The Asian Population and DevelopmentAssociation


Population and the Family
in Japan
February 1989
The Asian Population and DevelopmentAssociation

THE ASIAN POPULATION ANUDEVELOPMENT ASSOCIATION,lUB9
Nugutacbc TBR Building, Hill 710
10-2, Nagatacbo z-chome, Chiyoda-ku, Tokyo 100
Telephone: (03)581.'/770
Printed in Tokyo.vlnpnn

Foreword
The family, which forms thefoundation of societal development,global trend.
social organization and is theis beginning to waver. This is a
In advanced countries even the significance of marriage itself,whi.ch is a prerequisite for the formation of the family, is now beingquestioned. In many developing countries there is an increase of peopleleaving the rural community to work in the cities or people going abroadto work as manual laborers. It is well known that this kind ofmigratory behavior is creating social problems.
Japan is no exception. There are cases of fathers or husbandstemporarily moving to another place by themselves for work-relatedreasons. There is a rapid increase of the participation of housewivesin the labor market, an increase of juvenile delinquency, increasingdivorce of the mi.dd Le-' and advanced-aged and single-parent families(especially mother and child families). This has all resulted infundamental questions being raised about the way the family should be.
In particular, the drastic change in the Japanese lifestyle due tothe phenomenally rapid aging of its population, the conspicuous loweringbirthrate and the remarkable improvement of mortality rate are causing adiversification in the composition of and qualitative changes in thefunctions of the family.
The active assimilation by Japan of Western culture since the Meijiera, while at the same time firmly holding on to the influences ofConfucian culture, has formed the distinctive character of Japaneseculture. This report focuses on and tries to shed some light on thefamily, an essential place where the above Japanese culture manifestsitself.
There are some issues which could not be sufficiently dealt withdue to space and time restrictions. I am hoping for further elaborationsome time in the future.
I would like to give my heartfelt thanks to those specialists inthe field who were kind enough to cooperate in the preparation of thisreport.
Lastly, I would like to express my gratitude to the JapanShipbuilding Industry Foundation (Chairman, Mr. Ryoichi Sasakawa) andUNFPA (United Nations Population Fund; Executive Director, Dr. NafisSadik), which greatly supported the production of this report.
February, 1989
Tatsuo TanakaChairmanThe Asian population andDevelopment Association

Table of Contents
Foreword ••••••.•••.•••••••••••••••••••••••••••.••••••••••••••••.••. 1
Chapter 1 Introduction and Overview •••••••••..•••••••••••••••••••• 5
Emerging Issue of Family 7
2. Changes in the Family as it Exists in Japan ..••••••••.••• 7
The Types of the Family Systems •••••••••••••••••••••••••• 18
The Demographic Factors of Family Changes ••••••••••.••••• 16
The Functions of the Family •.....•.......•...•••.•.•••... 20
Population and the Family ••.•••.••.••.....••..........•. 13
15The Debate concerning the BreakdownIntroduction:
of the r-ami 1 y
The Family System and the Social Structure ••••••••••••••• 17
Trends in the Family and Marriage •••••••••••••••••••••••. 21
Chapter 2
1,
2.
3.
4.
5.
6.
Chapter 3 Trends and Analysis of Factors Causing Changes inthe Family •••••••.••••••••••••••••••••••••••••••..•••••• 29
Introduction ••••••••••••••.•••.••••••••••••••.•..•.••••.•••••• 31
1,
2.
3.
4.
Chapter 4
1,
2.
3.
4.
Household and Family .......•.•••.•••••••••............... 31
Changes in the Family Structure •••••••.•••••••••••.•.•••• 34
Regional Differences in Family Structure ••••••••••••••••• 36
Changes in the Head of Household Ratio ••••••••••••••••••• 37
Family and Regional Development ••••••••••.•••••••••••••• 45
Introduction ••••••••••••••••••••••••••••••••••••••••••••• 47
Family and Regional Development: Significance ofthe Study 47
Regional Differences in Family Structure ••••••••••••••••• 48
Family and Regional Development ••••••.••••••••••••••••.•• 50

5. Theories on Japanese Family Structure.................... 51
6. Summary and Conclusion................................... 52
Chapter 5 Population Aging and Family •••••••••.••••••••••••••••••• 59
1. General View of Population Aging •..•.•••••••••.••••••••.• 61
2. Family Types of the Aged ••••••••••••••••••••••••••••••••• 62
3. Family Types of Aged Population by Region •••••••••..•.••• 64
4. Future Prospects ••••••..••••••••••••••••••••••••••.•••••• 65
Chapter 6 Forecast of Future Households and Changes inJapanese Family Structure •••••••.••••••••••••••••••••••. 73
Introduction •••••••••••••••.•••••••••••••••••••••.••••••.••••. 75
1. Net.hod and Summar-y of Forecast ••••••••••••••••••••..•.••• 75
2. Assumptions Regarding Future Households.................. 76
3. Estimate Results 78
Concl usion 80
Chapter 7
L
2.
3.
4.
5.
6.
The Japanese Family: Public Opinion Survey Findings ••••• 85
Introduction 87
Single Life 89
Marriage and Remarriage 91
Divorce 92
Preparations for the Aging Society ••••••••••••••..••••••. 94
Conclusion: The Image and Role of the Family 96

Chapter 1
Introduction and Overview
Toshio Kuroda
Director Emeritus
Population Research Institute
Nihon University

1. Emerging Issue of Family
The importance of re-examining fundamental questions concerning theprecise nature of the family is becoming increasingly emphasized. Sincethe 1960s in the United States and Northern Europe, and since the 1970sin Japan, the family has become a subject of concern not only amongspecialists but among people in all walks of life. Problems such asdivorce, re-marriage, the single-parent family, domestic violence orjuvenile delinquency have caused people to reflect on a commonunderlying factor, namely the family itself.
The family is a universally fundamental unit of society. Its formand structure will vary, however, according to the social and economicstructure of the particular culture and society of which it is a part.
of particular relevance to the study of the family are thecondi tions related to a society I s population and the changes therein.Birth rates, mortality rates, and population migration, and all thesefactors bringing about the rapid population changes have had a profoundimpact on the structure of the family since the Second World War.Nowhere is this more typical than in Japan.
The very existence of a term such as "family demography" or"demography of family" is indicative of the importance of the populationfactor in family study. The sudden drop in the birth rate has givenrise to a sharp decline in the average number of children per family; animproved mortality rate has produced a dramatic increase in the averageexpectation of life which, in turn, has resulted in revolutionary changein life cycles; the accelerating aging of society, has increased thenumber of families composed only of the elderly (elderly couples only,and elderly persons living alone). These are all examples of the impactthat population changes have had on the family.
Of course changes in the family are not based exclusively onpopulation factors. For example, the effect of legal amendmentsabolishing the "Ie" system, introducing the systems of equalizedinheritance of property, cannot be ignored. Also, conspicuouslyelevated living standards produced by high economic growth and highlydeveloped structure of industry, the rich diversity in the types of jobsavailable today, and advancing urbanization, have all wrought changesin attitudes towards marriage and in the structure and function of thefamily.
2. Changes in the Family as it Exists in Japan
Although the subject attracts a great deal of internationalinterest, this book is concerned primarily with the nature and problems
- 7 -

of the family as it exists in Japan. However, shedding light on thechanges in the family in contemporary Japanese society, with its mixtureof Confucian and we st.ern cultural influences, is bound to be highlysignificant for the study of the family in an international context aswell. The present research is also expected to be a useful point ofdeparture for comparative studies with the family system in Korea and inChina, two countries that share Confucian culture with Japan, or forstudying the future evolution of the family system in other Asiancountries.
This book is organized into seven chapters. An introduction andsummary of the material is presented in Chapter One; the other sixchapters each deal with a different topic related to the family inJapan.
Chapter One provides an overview of the entire study. Chapter ~vo
"Population and the Family", while emphasizing research carried out fromthe perspective of family demographic studies, deals with historicalchanges related to the family, especially concerning fundamentalproblems such as types and functions of the family. It also serves as amore detailed introduction to the material covered in the subsequentchapters. The family is the fundamental building block of society andits characteristics vary according to the cul tural dif ferences whichexist between different societies. The nuclear family has come to bethe dominant form in modern society. In recent years, however, changingattitudes towards marriage have even begun to threaten the nuclearfamily system. Although the collapse of the nuclear family is oftenpointed out, neither a substitute nor even the changes suggesting itsemergence are apparent. Nevertheless, it is clear that the family unitis undergoing some kind of change. This change is, however, proceedingin diverse directions. In Singapore and Korea, both of which share astrong Confucian influence, the three-generation extended family is thenorm, while the nuclear family is dominant in China. However, in spiteof the fact that the poli tical systems and the extent of modernizationin Japan and in China are widely divergent, in both countries thenuclear family has developed in the same way. It is this author'searnest wish that more sociological studies on the family and alsointernational comparative research in family demographic studies will becarried out in the future.
Chapter Three deals wi th "Trends and Analysis of Factors CausingChanges in the Family". It begins its examination of changes in thefamily structure by analyzing the increase in the number as well as theshrinking scale of households in post-war Japan, paying specialattention to the disappearance of the "Ie system" as it existed in prewar Japan, and the development of the nuclear family system centeringaround the husband and wi.fe , It also looks at intensified populationmigration, the increasing tendency for the elderly to live separatelyfrom their married children, and the sharp decline in the birth rate inconnection with change of family structure.
- 8 -

The regionality of family structure is a topic examined in thischapter. The proportion of nuclear family-type households for exampleis high in prefectures within the large metropolitan areas and low inprefectures in the northern or north-eastern regions such as Yamagata,Aki t.a, or Fukui. The proportion of persons living alone is highest inTokyo, followed by Kyoto and Kagoshima.
There is, however, very little regional variation among prefecturesin the proportion of nuclear families and persons living alone asindicated by comparisons whi.ch employ the "nuclear family householdproportion" (total of nuclear and persons living alone households as aproportion of all ordinary households) as an index for describing thedegree of modernization in family structure.
There are also some noteworthy changes in the headship rates bydifferent age brackets. Namely, in the last ten years, the headshiprates of young generations like twenties or thirties has exhibited adeclining trend. In the past, their headship rates had been on theincrease and contributed to the increase in the number of households.The recent decline is due mainly to the decreasing trend of proportionof married young men and their increasing tendency to live with theirparents. On the other hand, male headship rates in their sixties andseventies are rising due to an increase in the proportion of marriedmen, a decrease of rates of co-residence with their married children.There is a need for further research as to reasons behind the drop inthe headship rates of younger male persons since 1975.
Chapter Four discusses I1Family and Regional Development ll• An index
used for indicating the regional character of family structure is aratio of the number of nuclear family households composed of personsaged 65 years old and older plus those of 65 years old and older livingalone, to all ordinary households with relatives aged 65 years old andolder. Regions where this value exceeds 50 percent are defined to havea "nuclear family system." while less than 50 percent indicates an"extended family system". Typical of the former are 13 prefecturesincluding Tokyo, Kagoshima, and Ko ch.i , whereas the latter are 34prefectures including Yamagata, Toyama, and Akita.
In planning regional development, the characteristics of a region'sdominant family system should be taken into account. For example,regarding policy to support elderly dependents in a region of extendedfamily type where common residence is the norm, there should be aprovision for welfare assistance to help ease the burden of those familymembers who must look after their aged relatives. In a region ofsocial environment characterized by the nuclear family where living inseparation is dominant, assistance should take the form of constructingfacilities for the use of the elderly.
Finally, this author presents a fundamentally different argumentsabout Japan's family system. According to his analysis there are three
- 9 -

different theories regarding the family in Japan: firstly there is the"homogeneity theory" which states that the traditional extended familycontinues to be the dominant type, secondly there is the "structuralchange theory" whi.ch maintains that the extended family system hascollapsed and been replaced by the nuclear family, and thirdly there isthe theory that both nuclear and extended family systems co-exist. Thesecond of these theories, namely the tltransformation theory II is the mostcommonly held.
Chapter Five considers "Population Aging and Family. n First ofall, she outlines the aging of the Japanese population. It looks at theincreasing number of the elderly, changes in age dependency ratio, thepresent and future situation regarding the aged population, thedeclining trend in the birth rate, and the improvement in the mortalityrate of aged population. It suggests that the aging trend in thepopulation may grow more pronounced in the future.
Next, this chapter deals with the number of households and types offamily where elderly population are contained. In particular, it drawsattention to the possibility that the number of nuclear family of oldcouple and old persons living alone will increase considerably in thefuture.
The number of households and types of family systems of the elderlyare then analyzed by prefectures. Population characteristics of aregion are not only affected by the national aging trends but also bymigration. For this reason, aging of a regional population will varyconsiderably from that of the national population.
The distribution of types and number of elderly households is thusanalyzed in light of such regional characteristics.
One of the author1s important conclusions is that overall aging ofthe population produces the aging of the household structure.
Chapter six is entitled "Projection of Future Households andChanges in Japanese Family Structure". It gives an outline of resultsand methodology employed to arrive at future estimates concerningJapanese households carried out by the Ministry of Health and Welfare1sInstitute of Population Problems in 1987.
These estimates cover the years from 1985 to 2025, describe thechanging situation of households according to the headship rate methodby age and sex, and are based on a detailed analysis of the dramaticchanges in Japanese households since the end of the war.
Refer to the main body of the text for details.
Chapter Seven, the final chapter, presents a part of the results ofthe "National Sample Survey on the Japanese Family" whi.ch was carried
- 10 -

out by the Mainichi Newspaper in cooperation with N'ihon University inApril 1988. This survey is highly significant in terms of the newinformation it offers regarding the Japanese family and household on theverge of transition. Some interesting items covered by the survey isdescribed below.
Seventy-three percent of women in their twenties, and 63 percent ofmen in their thirties, indicate favorable attitude toward the singlelife. Many married people had also considered divorce but decidedagainst it mostly for the sake of their children. Concerning menhelping in the kitchen, 75 percent of total surveyed, and 70 percent ofmen were in favor. Concerning the significance of the home, economic orchild-rearing considerations were secondary to the place of repose orthe personal training of family members. On the other hand, themajority of those surveyed indicated a strong desire to take care oftheir ancestor's tombs. The results of the survey suggest that amixture of traditional and changed attitudes coexist and also signs of achange in value system among the younger generation appear. The surveyillustrates, in other words, the characteristics of the transition whichthe Japanese family is currently undergoing.
Nevertheless, there were no suggestions of an imminent collapse ofthe family, in fact there were even indications of a trend towards acertain conservative stability. As far as support for the elderly wasconcerned, the Japanese model attempts to strike a balance between theWestern model which relies heavily on social assistance, and the Asianmodel which relies exclusively on the family. The state of the familyin Japan, with its rapidly aging population, is a fundamental problem ofthe most profound social and economic implications.
- 11 -


Chapter 2
Population and the Family
Toshio KurodaDirector Emeritus
Population Research Institute
Nihon University


1. Introduction: The Debate concerning the Breakdown of the Family
Recent years have witnessed much emphasis on such pessimistic ideaswith regard to the f ami.Ly system as the disintegration, breekdown , orlatent breakdown of the famlly.l The debate concerning the breakdown ofthe family in the U.S. has been much more intense to the extent thateven the prerequisite of family formation, the institution of marriagehas been called into question. The divorce rate has reached a highlevel of 5 per 1000 inhabitants (1985), which is unprecedented anywherein the world. The cycle of marriage, divorce, separation, re-marriageis a frequent occurrence. Children are passed on to a family, where oneof the parents is unknown to them. In the U.S. there is a social classknown as DINKS (ti , e., Double Income, No Kids). Typically, a couplebelonging to this category are both highly educated and are bothemployed in professional or managerial high-income jobs. But it is saidthat even serious attention has been paid to the reassessment of conceptof lithe bright family" in the context of the marriage confusionoccurring in the u.S. 2
In the U.S. the number of nuclear families decreased in the 1970's,while single-parent families and persons living alone increased by about75% and 60% respectively.3
It can be concluded that this change in the family and householdpatterns, in particular, the rapid increase in the number of singleparent families and persons living alone over a period of 10 years,implies a great change in the home and the family in American society.
Of late, the number of single-parent family households has beenincreasing also in Japan. In the ten year period between 1965 and 1975the rate of increase was low at 9.8% for single-parent father familiesand at 4.6% for single-parent mother families. However, in the decadebetween 1975 and 1985 the former increased sharply to 38.5% and thelatter to 31.8%, indicating that changes in the family structure havebecome more pronounced in recent years in Japan. 4
Even so, these changes are clearly insignificant when compared withthe increase of 75% in single-parent family households that took placein the U.S. in the 1970's.
In the case of Japan, the fact that the proportion of single-parentmother families in single-parent households is overwhelmingly largeappears to indicate the heavy burden borne by women in family problems.As of 1985, 85% of all single-parent households were single-parentmother families. One person households, in which people live alone,increased in Japan from 6,560,000 to 7,890,000 in the ten year periodbetween 1975 and 1985. However, the rate of increase was 20%, beingonly one third of the rate of increase in the U.S. of the 19701s.
- 15 -

However, it is certain that changes are occurring in the smallestsocial unit known as the family, home, household not only in the U.S.but also in Japan.
Is this a trend toward the breakdown of the family system or willit produce on a broad scale a social unit which transcends the family,for example, single living or cohabitation with roommates and partners,which will replace family relationships7 uS
2. The Demographic Factors of Family Changes
The family is an important element of the social structure. In thestudy of human groups, when single individuals are the objects ofobservation, one talks of atomistic observation. This is in oppositionto molecular observation, the term used when the family constitutes theunit group serving as the object of observation. 6 Demography has beenconcentrating on the analysis of the individual as an atomistic unit butit has been noted that groups of molecular units known as families orhouseholds participate in all human activity with the result thatdemographic research in this area has been undertaken actively.
In recent years, the term "demography of the family" or "familydemography" has come to be used and demographic studies of the familyhave produced fruitful results.?
One must say that this has been naturaL This is because familiesare formed generally through marriages and marriages in turn aredirectly affected by the size of population of the marriageable age, ageat marriage, the proportion of married popu Lat.i.on , the birth rate, themortality rate, (life expectancy), population movements, etc. "Thesephenomena which are increased by births, deaths, marriages, and divorceaugmented by individual, and the mobility and out of living arrangementsare the engines of household change. ,,8
One important field in which demography has contributed to thestudy of the fami ly is the development of the concept of "the fami lylife cycle. H The study of the extent and structure of changes in thefamily and household which take place in accordance wi.t.h the phases ofthe family life cycle is relatively recent, as the changes of thisfamily life cycle itself are phenomena wh i.ch occurred only some timeafter World War II.
Sociological and anthropological studies of the family havecontinued and resulted, of course, in a vast quantity of literature.However, they wer-e studies of the family as the smallest social groupand they were not conducted from the demographic point of v.i.ew , Theobject of such studies focused exclusively on family questions such asthe human and socia-psychological relations between various family
- 16 -
members, or on familial functions, especially tensions between parentsand children and family insecurity. It was demography which introducedthe dynamic concept of the life cycle to such sociological studies ofthe family.
The important contribution which family demography has made or isin the process of making through its theoretical research is a series ofstudies concerning the mutual relations between the major changes in thesize and structure of the family and household, and the demographictransition in the process of modernization, industrialization, andurbanization. Research into the trend of recent "nuclearization" of thefamily whi.ch have brought about a significant reduction in the size ofthe household and family and also modern declining birth rate isbeginning to gain importance.
The powerful control of fertility and mortality after World War IIhave substantially reduced the birth and death rates. The decrease inthe birth rate has reduced the average number of children in familiesand the size of the household to a remarkable degree.
At the same time, spectacular improvements in the death rate havebrought about a remarkable increase in the average life expectancy.This has resulted in a drastic change in people I s life style for theduration of their whole lifetime whose starting point is marriage.Moreover, it can be easily seen that factors such as the postponement ofmarriage and the increase of proportion never marrying9, et.c , , havegreatly affected the nature of the family.
3. The Family System and the Social Structure
The family system in a society is formed by the social and economicstructure of this society. However, at the same time, the family systemaffects the structure of the social system. It is thought that both inan interactive process are in an inseparable relation ofinterdependence. However, although the importance of the social systemin providing an explanation of the family life patterns has been widelyrecognized, there is no consensus as to how certain specificcharacteristics of the social organization are linked to certainspecific characteristics of the family system.
The family is a universal system existing in human societies, andit has three major dimensions as follows:
1) The family is formed by kinship relations made up by marriage,succession, or adoption. Although, of course, family life patternsand the contents of kinship relations within these kinship groupsvary from culture to culture, it is an invariable fact that kinshiprelations form the basis of the family.
- 17 -

2) The differences observed in practice' between and within kinshipgroups are characterized by different forms of the family system.
3) Although it is recognized that the family fulfills numerousfunctions, the family system cannot be simply defined by thesefunctions. This is because of the fact that certain functionswhich operate within the family system in some societies, operateoutside the family system in other societies.
4. The Types of the Family Systems
The family system is determined on the basis of several standardswhich apply to the role structure and the structure of the family groupsand households. The family system can be roughly classified into twocategories: the nuclear family (parents and children) and the extendedfamily (a group larger than a nuclear family). The nuclear family, alsoreferred to as the elementary family, individual family, conjugal familyor biological family, is a kinship group formed by the parents andsocially recognized children. The term "marriage f ami.Ly" is used in thesense of the "modern" nuclear family which does not live together withother family members. The concept of nuclear family can also beextended to include the cell of husband, wife and children which form apart of a larger extended family. In such cases, the term "e Lement.a r yfamily" is often used, especially in anthropology.
The term 'ftraditional family" denotes either the traditionalnuclear family or, in some cases, the extended family. The traditionalnuclear family is different from the modern nuclear family in severalrespects. Within a modern nuclear family the right to make decisions,property ownership, duties and privileges are easily determined bymutual relationship between husband and wife, and also parents andchildren. A nuclear family has its own independent residence, and thereare few direct connections with kinship group members other than membersof the family. Also, the individualistic value system forms the basisof it. In a traditional family, kinship relationships by far exceedmari tal links. The rights of decision concerning economic problems andproperty owne r sh i.p extend even to the marriage question and belong ingeneral to the most senior member of the group. Moreover, the attitudeof family members toward work differs in these two systems. To theextent that the traditional family is the basis of the family mode ofproduction, the intra-familial hierarchy within the family determinesdivision of labor within the family. In a society of the modern nuclear'family, in which production is performed in the market economy, the workethic based on initiative, individualism, and self-reliance arestressed. It goes without saying that when the term "nuclear family" isused in this paper, it is used mainly in its modern sense.
As opposed to ,the extended family, which is linked to agricultural
- 18 -

society I the nuclear family is frequently considered an out.qr owt.h ofindustrialization and urban society. For the first time in the world'shistory, in every part of the world, all social systems advance at afaster or slower pace toward the marriage family system andindustrialization. The traditional family system, usually known as theextended, combined family, has been disintegrating. It could perhaps besaid that it is a world-wide family revolution. 10
It has been said that this "modern" nuclear family is favorable togeographic, spatial movements as well as social mobility which ischaracteristic of industrialized society. However, the shift fromagricultural society to the industrial, urban and market economy hasbeen slow, and accordingly the pace of changes in the form of the familysystem has also been slow. As a result, the different types of familysystems can coexist in cases when social and economic changes take placewithin societies at varying pace. The functions of the traditionalfamily are adaptable, at least for some time, to the life of urbanindustrialized society.
The extended family, which has also been called the traditionalfamily, the joint family, or compound family, is a kinship group whichis composed at least of more than one nuclear family, and generallyspeaking, is a group containing different generations. In such cases,they do not necessarily live together in the same households.Generally, common residence is assumed but this is not a necessarycondi tion for the extended family. The important point is that strongkinship relationships and family ties exist independently of the placesof residence of nuclear families which make up groups. The term"modified extended family" has been proposedl l to describe the familywhich, although dispersed spatially, is linked through close mutualrelationships. On the other hand, the extended family living togetherin the same household or homestead is at times distinguished from otherkinds of extended family by use of the term "joint family".
The term "compound family" is applied to a polygynous household orto a family in which the widow/widower remarried and produced offspring.The definitions of household composition are by no means precise; attimes there can also be on overlap. In other words, there aredetermined by the classifications criteria used. These include alsosuch concepts as the simple family household (one generation withchildren), the extended family household (two generations withchildren), the multiple family household (family household consisting oftwo or more generations with lateral conjugal units). There is also theconcept of stem family, used to specify the nuclear family whichincludes one set of grandparents.
The dichotomous distinction between the extended family and thenuclear family is by no means precisely defined. Doubts have been castas to the correctness of the hypothesis that the most common familyform, found in the developing nations and in the pre-industrial European
- 19 -
societies, was indeed the extended family. At present, it is assumedthat the majority of population in pre-industrial European societies andprobably also in the developing nations lived and live in nuclear familyhouseholds. There are as yet no sufficient materials to prove thisassumption but the data obtained in India, Nepal and some regions inEurope seem to support such a view. 1 2
5. The Functions of the Family
Traditionally, the family has been fulfilling several functions,such as economic, reproduction, socialization, recreation, protection,as well as judicial functions. However, the contents of these functionsdiffer not only from culture to culture but also between nuclear andextended family. In extended families, the economic function depends onthe production mode of a family, especially in agricultural society orartisanal occupations. In order to maintain this economic basis andprotect its livelihood, the extended family takes the form of apatriarchal hierarchy, and the inheritance system and transmission ofproperty are necessary means of preserving group solidarity.
The reproductive function is related to the economic function whichsupplies and maintains labor force for the fami ly production system inthe extended family. However, the scale of the extended family ismaintained by social values such as the necessity of producing malechildren to ensure protection to the elderly, or religious rituals. Aslong as the economic function is fulfilled by the production mode of thefamily, important elements of the socialization function are realizedthrough vocational training within the family. The transmission ofreligious and social customs is an important structural element of thesocialization goals. In the absence of the family law, the familyfulfills a judicial function, defining and assigning rights and dutiesobligations within the kin group. Social recognition of children andthe procedures for the formations of marriage, etc., are part of this.The protective functions include care and assistance for the elderly, aswell as psychological and physical protection, etc.
The functions of the nuclear family differ to some extent fromthose of the extended family in their nature and scope. The family andits functions are influenced by social change, modernization, andindustrialization of the market economy. The change in the economicfunctions of the family is especially pronounced. The change in theeconomic functions is linked to the shift away from the domestic mode ofproduction to work outside the family. The economic basis of the familyshifts from the kinship group to the nuclear family. The economicassistance from the kinship group for conjugal family and their childrendecreases. Changes in the economic functions affect also thesocialization functions of a family. As the mode of production becomesseparate from the family, the nuclear family has no longer any necessity
- 20 -
to provide vocational training to its members, such as was the case inthe extended family. This fact in turn weakens the nuclear family'sdependence on the kinship group and makes a further increase in theautonomy of the nuclear family.
The value system of the family becomes more individualistic as amatter of course. The family protective functions in industrialized,urbanized society are partially or completely fulfilled by the state.The socialization functions are supplemented by non-familial activitiesof political organizations and religious groups, while education, too,is taken care of by the public sector. As the family mode of productiondeclines, the training of family members concerning the familyenterprise ceases to be necessary, while, on the other hand, industrialproduction requires the provision of high-level technical training suchas the family cannot provide.
The reproduction function of the family is again different in thenuclear family. As the necessity of having a large family for manpower,the necessity to have many children to provide assistance in old age, aswell as the need to produce numerous offspring in view of high infantmortality decreased, the desire for a large family also declined.Efficient birth control methods also being a factor, the size of thefamily has decreased, and the fertility preferences depends increasinglyon the needs, wishes and decisions of the couple, while the pressurecoming from demands by the kinship group has disappeared. Of course,there are also other factors which operate at the same time. Forexample, factors such as an increase in geographical mobility as aresult of industrialization and diffusion of birth control methods madethe reduction in the size of the family practically possible.
6. Trends in the Family and Marriage
Marriage as a system has tradi tionally been considered to be thebasis of the family. In contrast to this, it has also been thought thatthe family, seen as a by-product of the social organization, has alsoshaped the characteristics of marriage. of course, thesecharacteristics of marriage are substantially different in the case ofthe nuclear and the extended family. However, it cannot be said thatresearch has clarified to what extent the characteristics of marriageare directly determined by the family system, and, likewise, to what;extent the forms of the family and characteristics of marriage aredetermined by their common social environment. However, many studiesindicate that changes in marriage patterns are related to socio-economicand cultural factors. It can be easily understood that the form of thefamily is also affected by changes in marriage patterns.
Generally speaking, a tendency to have a relatively highexpectation toward marriage can be observed in the nuclear family system
- 21 -
but social and family pressure wi.th regard to the unmarried status isclearly weaker in comparison to extended family society. In a societyin which the nuclear family system is wideepr-ead , social pressure withregard to legal marriage is reduced and co-habitation which does notresort to marriage becomes, more or less, a general practice. Even suchcases are often socially accepted and, also, in many cases there is theview that the increase of this kind of cohabitation is related not onlyto the disintegration of the marriage system but also to thedisintegration of the family system.
On the other hand, the increasing tendency in the number ofdivorces is striking in Europe and in the U.S. The number of divorcesstarted increasing after about 1965, the number of divorces at presenthaving doubled since then. Especially, in the United States the numberof divorces is five per 1,000 inhabitants, which is almost four times ashigh as the Japanese figure of 1.3.
Modernized society produced the nuclear family system centered onmarriage. This system was an adaptation of people to modernized societyand it was favorable to the economic development. It was a socialchange which could be called a social revolution. But at present a newchange is taking place in this nuclear family system itself.
First, there is a change in the marriage system which is the basisof nuclear family formation, as well as a change in the people- satti tude toward marriage. In Japan, the age at marriage is alreadyremarkably late even from the international point of view, but in spiteof this, the tendency toward single life is increasing quite sharply inthe young age yroup• For example, 54% women and 42% men approve ofsingle life,l while 89% women and 82% men think that there areadvantages or merits of leading a single life. 1 4 It is not clear towhat extent this trend will influence the proportion never marrying andage at marriage but, at least, the influence resulting in a delayingmarriage furthermore may be inevitable.
It can also be noted that t;.here has been a significant shift awayfrom the traditional form of marriage, namely from arranged marriage"miai" toward love marriage. Some 60% women, and 55% men prefer lovemarriage. These figures are even higher for young people in theiraround twenty at about 70%.15
Secondly, there are the signs of changes wi thin the form of thenuclear family. There is some argument that husband and wife who form anuclear family have become more autonomous or "privatized"16 in theirrelationship in accordance with the development of the wife - s socioeconomic independence.
Such a trend may threaten the stability of family groups throughdivorce, remarriage, cohabitation, etc. It is argued that the family isnot a group known as a family but, from an individual's point of view,
- 22 -

is a group formed at a certain time by some individuals. Therefore,family life is only one of many available life styles to be chosen by anindividuaL 17
Although such a change in the nuclear family does not necessarilylead to the disintegration of the family, it is necessary to note thatit as an important manifestation of the change in the family system.
Likewise, it is considered that comparative research of countrieswith Confucian societies such as China, Korea, and Singapore would beprofitable from the paint of view of the study of the family issue inJapan. Although all these are Confucian societies, the form of thefamily is different with the nuclear family form being dominant in Chinawhile the extended family with married children living together withtheir parents is dominant in Korea and Singapore. 1 8
Comprehensive analysis of the family system based on socialdemographic and family demographic research is greatly desired.
- 23 -
Notes:
1. Seimei Hoken Bunka Senta (ed.), Yamane Tsuneo (survivor), YureugokuGendai Kazoku (Trembling Modern Family, Nihon Hoso Shuppan Kyokai,1984, pp. 198-199; Seimei Hoken Bunka Senta (ed.), Ima no Kazoku,Kore kara no Kazoku (Today's Family, the Family from now on), II.Yamane 'I'auneo, Kazoku to wa Nanika -~ Senzai teki Kazoku Hokai niTsuite (What is the Family -- Latent Disintegration of the Family),Nihon Hoso Shuppan Kyokai 1985, pp. 11~15.
The latent disintegration of the family proposed here by Yamane isdefined as the case when the form of the family is preserved butthe family does no longer function sUfficiently.
2. Kimura Shozaburo: Kazoku no Jidai - Yoroppa to Nihon ~ (The FamilyEra, Europe and Japan, Shincho Sensho, 1985, pp. 212-213.
3. Whi te, Michael J., and Tsui, Amy Ong,: "A Panel Study of FamilyLevel Structural Change," Journal of Marriage and the Family 48(May 1986), p.435.
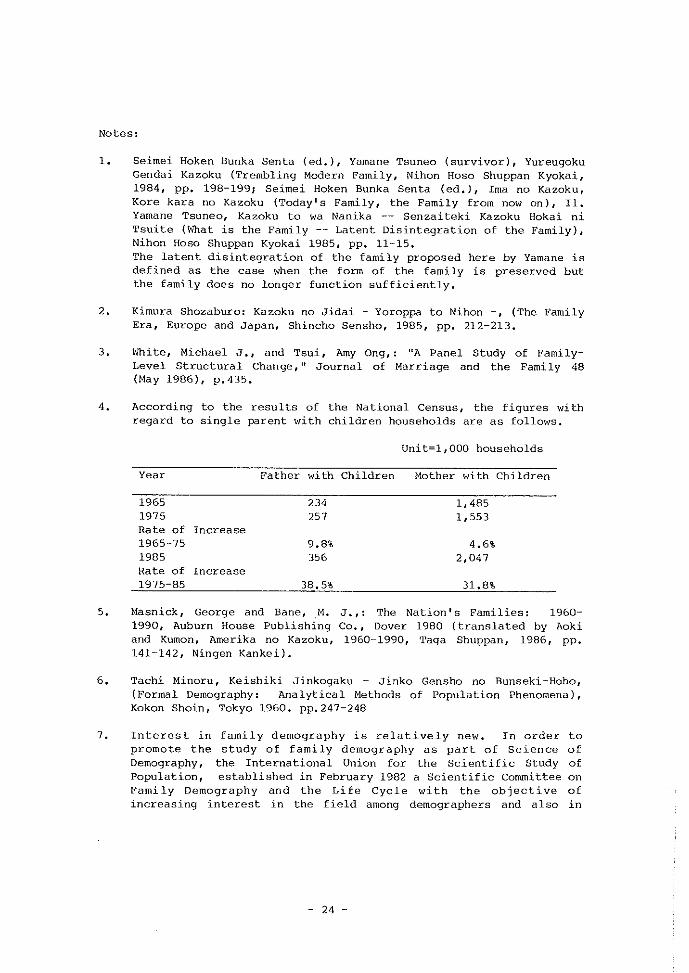
4. According to the results of the National Census, the figures withregard to single parent with children households are as follows.
Unit=l,OOO households
Year Father with Children Mother with Children
1965 234 1,4851975 257 1,553Rate of Increase1965-75 9.8% 4.6%1985 356 2,047Rate of Increase1975-85 38.5% 31.8%
5. Masnick, George and Bane, M. J.,: The Nation's Families: 19601990, Auburn House Publishing Co , , Dover 1980 (translated by Aokiand Kumon, Amerika no Kazoku , 1960~1990, Taga Shuppan, 1986, pp ,141-142, Ningen Kankei).
6. Tachi Minoru, Keishiki Jinkogaku - Jinko Gensho no Buns eki.r-Hoho ,(Formal Demography: Analytica 1 Methods of Population Phenomena),Kokon Shoin, Tokyo 1960. pp.247-248
7. Interest in family demography is relatively new. In order topromote the study of family demography as part of Science ofDemography, the International Union for the Scientific Study ofPopulation, established in February 1982 a Scientific Committee onFamily Demography and the Life Cycle with the objective ofincreasing interest in the field among demographers and also in
- 24 -

response to the rapidly growing interest in various aspects offamily demography. The committee's recent activities include theSeminar on New Forms of Familial Life in MDC' s , held in France.The recent noteworthy literature includes:
Bongaarts, J., (1983), the Formal Demography of Families andHouseholds: an overview, IUSSP Newsletter, No. 17, pp.27-42.
CICRED, (1984) Demography of the Family, Inter-CenterCooperative Research Programme, Project No.2, FinalReport, Paris.
Bongaarts, J., Burch, T., and Wachter, K. (ed.), FamilyDemography -- Methods and their Applications, ClarendonPress, Oxford 1987. There is an introduction to thiswork written by Watanabe Yoshitoshi, Jinko Mondai Kenkyu(Studies of the Problems of Population), Institute ofPopulation Problems, Japan I s Ministry of Health andwel r'are , No. 187, 1988, p. 67
8. White, op. cit., p.435.
9. In demography, based on the view which assumed the anatomicalinfertility of women over 50 years of age, the proportion of womenover 50 who have never been married is called the "proportion ofthose never married II or the "proportion ultimately marrying". Thisproportion never married is high in Europe and the u.s. and low indeveloping nations. For example, the proportion ever married is99.6% in India (1981), Bangladesh 99.1% (1981), China 99.8% (1982),Korea 99.8% (1980). In Japan it is somewhat low at 95.6% (1980).In European countries it is about 93% (1980~1981) and in the u.s.it is 95.4% (1980). However, what should be particularly noted isIreland's proportion of 85.5% (1981) and Finlandls of 89.5% (1980).In Ireland, women over 50 who have never been married constitute asmany as 15%, which has a significant influence on the familypattern distribution (United Nations, First Marriage: Patterns andDeterminants, New York, 1988, Table 5). In Ireland the proportionever married for the age group 45-49 years of age (includingdivorcees, widowers, and wi.dows ) was 65.9% for men and 74.0% forwomen in 1940, 67% for men and 74% for women in 1950. Thisindicates in other words that there was a remarkably high number ofsingle households, namely over 30% for male, 25% for female nevermarried up to the age 45~49. (Goode, N. J., World Revolution andFamily Patterns, the Free Press of Glencoe, London 1963, p. 49Table 11 ~7).
10. Goode, N. J., Changes 1n Fam11y Patterns, 10 The Fam1ly and Change,edited by John N. Edwards, Alfred A. Knopf, N. Y., p.19. Thispaper is a part of Goode's The Family (Anq.l ewood Cliffs, N. J.:Prentice Hall Inc. 1964).
11. Kumagai, F., Modernization and the Family in Japan, Journal of
- 25 -

Family History, vol. 11, No.4, pp. 371-382. China is an exampleof a country where strong family ties are maintained even thoughmembers of the family do not share the same household. Even in thecase when Chinese peasants do not share the same residence withtheir parents and siblings, they frequently live in theneighborhood. As this physical proximity has a strong effect onhousehold ties between relatives, to focus only on the householdwould be to overlook an important aspect of the family relations(Lavely, W. R., and Bohue , Li., Household Structure in Liaoning,Hebei, and Fujian; A Preliminary Survey (presented to theInternational Conference on the One Per Thousand Fertility Survey,Beijing, October 14-18, 1985).
12. Regarding India, see Goode's wor-Ld Revolution and the FamilyPatterns (1963), V Changing Family Patterns in India, pp. 203-269.Regarding pre-industrial Europe, see Hajnal, J., IITwo Kinds ofPreindustrial Household Formation Systems," Population andDevelopment Review, vol. 8, No.3, 1982, pp. 449-494. RegardingChina, see Fei Xiao Ton, (Yokoyama Hiroko, transl.) Seiiku Seido(The Breeding System) - China's Family and Society, TokyoUniversity Press 1985, appendix I Changes in China 1s FamilyStructure, pp. 289-302. Prof. Fei makes clear that, although it isa prevalent but mistaken view that in China the family is veryextended, in fact that is not the case. He reports that extendedfamilies constituted 10% of the total in 1936 and 21% in 1981,while nuclear families constituted 24% in 1936 and 39% in 1981.Distribution by household size as shown in the National Census of1982 wes 16.1% for three-person households, 19.5% for four-personhouseholds, and the figure for the two categories combined was35.6%, while households with over seven persons accounted for notmore than 14.9%. These figures also indicate the overwhelmingnumber of nuclear families (The Department of PopulationStatistics, The National Bureau of Statistics, (ed.), 1982 China'sPopulation Census Data, 1985, 69., Household Size, pp , 474-475).Similarly, according to the 1982 census, two-generation households,the so-called nuclear families account for 67.5%, that is, morethan 2/3 of the total. The average household size has beenremarkably stable at 4.43 persons per household in 1982, 4.30 in1953, and 4.29 in 1964. The proportions of large familiesconsisting of three generations or more stayed at about 20%, havingmaintained the same level for 30 years since the liberation in 1949(Kuroda 'I'oehi.o , Comparative Study of Aging in China and Japan:Project Summary, Study commissioned by the UNFPA, Sino-JapaneseConference on Aging Problems, Background Paper No.1, p. 18).
13. "Public Opinion Survey on the Pami.Ly'", a survey conducted jointlyby Nihon University and Mainichi Shimbun in April 1988 (Some of theresults of this survey wer-e published in the morning edition ofMainichi Shimbun on May 4th, 1988).
- 26 -

14. Institute of Population Problems, Japan I s Ministry of Health andWelfare (ed s L, Outline of the Nation-wide Survey concerning Viewson Marriage of Single People, September 1988.
15. The survey by the Insti tute of Population Problems, Ministry ofHealth and Welfare, cited above.
16. Meguro Yoriko, The Individualizing Family, Keiso Shobo 1987, p. ii.
17. .ib.i.d , , pp , .i i i.r i.v ,
18. Hashimoto Akiko, "Urbanization and Changes in Living Arrangements,l1presented at the Uni ted Nations International Conference on AgingPopulations in the Context of Urbanization, Sendai, Japan, 12-16September 1988, as well as "Urbanization and the Elderly inDeveloping Nations with Aging Populations -- from the report byHashimoto Akiko, the Research Associate at the United NationsUniversity", Asahi Shimbun, morning edition, October 1st, 1988.
- 27 -


Chapter 3
Trends and Analysis of Factors Causing Changes in theFamily
Yoichi Okazaki
Professor
Faculty of Law
Nihon University


Introduction
The family serves as the basis on which our everyday activitiestake place. The family structure changes in response to changes in theeconomic and social environment.
Large families consisting of more than one married couple and theirchildren living together used to be quite common. \'1ith the popularityof modern living environments, many married couples began to liveelusively with their children in so-called "nuc Lear families." Withoutconsidering the social ramifications, the overwhelming trend towardnuclear families continues.
The family cannot be free of the influence of the long-heldtraditions of a society. For this reason, it is difficult to offersimple solutions to problems concerning the family. Also, statisticsalone cannot fully analyze the status of the family, a group of peoplebound together by relationships among each other. As in the case ofpopu.Lat.Lon analysis, however, we need to use statistical data in thestudy of the family in order to analyze various factors and discoverpatterns of change.
The purpose of this chapter, therefore, is to carry out a basicanalysis of the family.
1. Household and Family
As we all know, the concept of family is based on the bloodrelationships among people. It is sometimes difficult, therefore, tocompile family statistics, since not all members of a family live in thesame residence. This is the reason why statistics on the family usuallyapply the concept of llhouseholds" in their compilations.
A household can be defined as "a group of people who live togetheron the same budget, II although a single person can also be regarded as ahousehold. The definition of a household has been expanded in otherways to facilitate statistical surveys of household units.
It is difficult to give an accurate definition of a household. Letus analyze the definition of a household given in the Population Censussurvey.
First, households are classified into "general households" and"institutional households." General households refer to a group ofpeople living together on the same bUdget, a single person living alone,a single lodger or single person living in a company dormitory, and thelike. Single live-in employees are considered to be part of their
- 31 -
employer's household. An institutional household refers to a person ora group of people other than those constituting the general household.They include: (1) students and pupils in dormitories and boardinghouses, (2) patients in hospitals and sanatoriums, (3) occupants ofsocial institutions, (4) residents of barracks of the Self DefenseForces, and (5) inmates of rehabilitation institutions.
Before the 1980 Population Census, households were classified intoordinary households and quasi-households. Ordinary households in thiscase referred to a group of people living together on the same budget,as in the general household mentioned earlier, and single people rentinga house. All other people were classified as quasi-households.
From a statistical [Oint of view, families are classified intodifferent family types, depending on the relationship of the householdmembers to the head of the ordinary household.
A household whose members are related by blood to the head of thefamily is called a "k.inehi.p households. II People living together with afamily but having no blood relationship to the family members, such asemployees and domestic help, are considered to be par-t; of the kinshiphousehold. It should be noted that a "one-couple household" wouldinclude households made up of a married couple, as well as thosehouseholds made up of a married couple with domestic help. A "nonkinship household" refers to households that have more than two members,and consists of a head of family living with people that have no kinshiprelation to the head of the household, such as lodgers, domestic helpand employees.
Finally, "single households" refer to households consisting of asingle person. So depending on the kinship relations of the members tothe head of a family, general households are classified either as a"k.inshLp household," "non-kinship household, 11 or "single household."Kinship households are further broken down into smaller categories. Thebreakdowns are used in the preparation of statistics in order to clarifychanges in family structure. Family structure will be discussed in alater section.
How do the number of households increase? And what is therelationship between the increase in the number of households and thepopulation? Table 1 shows the situation after 1955. The table givesthe figures under "ordinary household" and "qene r-a L hous eho Ld"categories to allow for changes in the definition of a household.However, the pattern of change is almost the same in both categories.
Under the ordinary household category, the number of households in1985 was 36.478 million, and was made up of 117.832 million people. Therate of increase in the number of households is noted in five-yearincrements, starting in 1955. The rate was 13.3% in 1955-1960 and15.5% in 1970-1975, showing more than a 10% growth rate during this
- 32 -

period. In the last 10 years of the survey, from 1975-1980 and 19801985, the rate dipped below 10%.
In spite of some fluctuations in the rate, the growth rate in thenumber of households changed dramatically, compared to the total numberof household members, during the period of 1955-1985. Throughout theentire period of the survey the rate of increase in the number ofhouseholds far exceeded the rate for the number of household members.
In other words, this means that the number of people per household,or the scale of the household, has been decreasing. As can be seen inTable 1, the number grew from 1955-1965, but has leveled off at below 4members per household since 1970. In 1985, the number was 3.22 for anordinary household and 3.14 for a general household.
As can be seen in Table 1, families have become smaller as thenumber of households and the total number of household members haveincreased at a different pace. There are some important factors thatgreatly influenced this phenomenon. Those factors that promoted thegrowth in the number of households include an increase in population(number of persons per household) as well as the division of households.As the noticeable increase in the number of households during 1955-1975indicates, the increase was largely due to the migration of thepopulation, particularly the younger population, to the cities. Anotherfactor, undoubtedly, has been the growing tendency among married couplesto live separately from their parents in nuclear families.
The decrease in the number of children, caused by the decline infertili ty, has also played an important role in the reduction of thescale of households. In the old days, Japanese families used to have anaverage of five children. Simple arithmetic reveals that the number ofpeople per household was at least seven. As the average number ofchildren declined to two after World War II, the average number ofpeople per household dropped to four, consisting of a married couple andtwo children.
Table 2 shows changes in the number of general households accordingto the number of people per household. In this survey, which showsconditions after 1970, the number of households with several members hadalready decreased. Since 1975, the number of households with more thanthree people has increased only slightly. Households w'i th two peopleshowed the largest increase, followed by single households. The largestgroup, in the survey in 1985 among general households, was made up ofhouseholds with four members (23.7%), followed by one (20.8%), two(18.4%), and three (17.9%).
Let us compare the average number of persons per household inJapan, with those in other major industrialized countries (Table 3).Compared to 3.1 persons (1985) in Japan, the figure of the Soviet Unionwas quite high at 4.0 (1979). The figure for Italy was about the same
- 33 -
as in Japan at 3.0 persons (1981).three. This low figure can no doubtof children and the spread of nuclear
2. Changes in the Family structure
Other countries have less thanbe attributed to the small numberfamilies.
It is often said that the Japanese family has undergone dramaticchanges since World War II. The family system based on the IIIe" wasabolished after the war, to give way to a new family system based on themarried couple. This greatly altered the way people regarded the familysystem. Now we will examine how these changes are ref lected in thestatistics.
From a statistical point of view, general households have threeclassifications, as mentioned earlier, depending on the relationship ofthe household I s members to the head of the family. They are kinship,non-kinship and single households. Kinship households are furtherbroken down into nuclear family households and other kinship households.Further refinements are indicated in the statistical chart. The recentstatistics on general households are shown in Table 4. In 1985, generalhouseholds totaled 37.98 million, out of which kinship householdsaccounted for 30.013 million (79.0%), followed by non-kinship householdsat 73,000 (0.2%) and single households at 7.895 million (20.8%).
Kinship households are further broken down into nuclear familyhouseholds and other kinship households depending, in principle, on therelationship between the youngest married couple in the household to theother family members. For this reason, so-called "three-generation,"families consisting of mother and father, their child and his/her spouseand grandchildren are classified under other kinship households. Asshown in Table 4, nuclear family households refer to householdsconsisting of a married couple only, a married couple and children,father and children or mother and children.
Nuclear family households totaled 22.804 million in 1985,accounting for 60.0% of all general households. The largest group inthis category was that of households consisting of a married couple andchildren. Households consisting of a married couple only accounted forabout 23% of all nuclear family households. Households consisting ofmother and children, or father and children, did not account for asignificant percentage. In actual numbers, however, mother and childrenhouseholds totaled 2.047 million, whLch is considered fairly large.Kinship households, other than nuclear family households, numbered 7.209million in 1985, which is 19.0% of all general households. Threegeneration households fall under this category, but their ratio isgradually decreasing.
The number of households made up of different family types has
- 34 -

shown distinct patterns of increase or decease since 1960, as sho\m inTable 5. Nuclear family households increased rapidly at the rate of22.7% during the period between 1960-1965, when migration to the citiesintensified. The rate of growth slowed somewhat after that, to 17.8% in1965-1970, and to 16.3% in 1970-1975. In the years since 1975, the ratedipped to 8.1% in 1975-1980 and 5.6% in 1980-1985. This was due to adecline in both the marriage rate and the division of households causedby the slowing of the population migration. Although the growth ofnuclear family households has currently slowed down, those consisting offather and children or mother and children have increased to over 10%since 1975. The high rate of divorce, and husbands and wives who liveseparately for career reasons, are being cited as reasons for the rapidgrowth.
Single households have also shown a significant increase recently.The number of single households totaled 7.89 million in 1985, an 11.1%increase over five years ago. Of these, single persons who live alonein a house totaled 6.39% million; those living in lodgings anddormi tories owned and managed by compani.ea and the like totaled 1. 28million; and those renting a house numbered 0.22 million. The highestgrowth was seen among single persons living alone in a house, at 18.7%.Single persons living in dormitories and lodgings, on the other hand,have decreased in number.
The pattern of change in households, according to family types,illustrates that more and more people are now living in nuclear familiesor by themselves. It is clear that this trend could have graveconsequences as we edge toward an aging society. This issue will bediscussed in later chapters.
The result of the Population Census showed single householdsconsisting of a member older than 65 under the general householdcategory have increased L9-fold in the decade from 1975, from 0.63million to 1.18 million. Households consisting of a married couple onlyhave also increased by L8 times, from 0.91 million to 1.65 million.The increase in households consisting of a married couple only isexpected to accelerate further as the population continues to age.
Various social supports will be necessary to care for these elderlypeople. On the other hand, households in which aged couples livetogether with their child and his or her spouse, have also increased.Even if the ratio of people living together with their parents were todecrease, the actual number of families taking care of aged people wouldnot decrease significantly. Faced with the problem of caring for theaged at home, these people will be seeking support from society.
- 35 -

3. Regional Differences in Family Structure
The family structure has changed greatly in all parts of Japan andthere are significant regional differences in the pattern of change at agiven po.in t , I wou Ld like to point out the basic differences amongregions here and leave detailed discussions to later chapters.
One index of the family structure is the ratio of nuclear familyhouseholds to total ordinary households (nuclear family householdratio). Table 6 shows ratios for 47 prefectures in Japan. In 1985, thehighest nuclear family household ratio was found in Saitama (70.3%),followed by Kanagawa (69.0%) and Osaka (68.7%). All of theseprefectures are located near big cities. The lowest percentages wererecorded in Yamagata (46.6%), Akita (51. 4%) and Fukui (51. 5%). Locatedconsiderable distances away from big cities, these prefectures relyheavily on farming. While prefectures with a high nuclear familyhousehold ratio are scattered allover Japan, those with a low ratio areconcentrated in the wes t.ez-n , rather than eastern, parts of Japan. 'thesecharacteristics have changed very little since 1960.
Another index of the family structure is the ratio of singlehouseholds to total ordinary households (single household ratio). Theseratios are also shown in Table 6. The highest single household ratioswere recorded in Tokyo (30.4%), Kyoto (21.8%) and Kagoshima (21.6%),followed by Kochi (20.7%) and Osaka (19.2%). The high ratios forKagoshima and Koehi deserve attention. The prefectures of Shiga00.0%), Toyama (10.1%) and Nara 00.7%) had the lowest ratios. Thesingle household ratio was also somewhat lower in eastern Japan comparedto that of wes t.ern Japan.
We have examined regional differences in family structure using twoindices, the nuclear family household ratio and the single householdratio. One reason for the disparity between them is that households inwestern Japan have a high ratio of households consisting of agedpersons, which in turn also have a high ratio of nuclear familyhouseholds (including households consisting of aged couples only) andsingle households (including households consisting of an aged persononly). We must note, therefore, that regional differences in thepopulation migration patterns and everyday customs lie behind theregional differences in family structure.
The nuclear family household ratio and single family ratio can becombined to give an index called the "nucIee r-r f ami.Ly-Lype householdratio.'1 The first two ratios are computed by using the number ofnuclear family households and single family households as numerators,over the denominator of total ordinary households. The nuclear-familytype household ratio is given by adding the number of nuclear familyhouseholds and single households and dividing this by the number ofordinary households. Simply, the nuclear-family-type household ratio
- 36 -

indicates how modernized the structure of families in a given region is.Table 6 shows the situation in 1985 only. After checking the figuressince 1970 to assess the changes during that period, it was found thatthe nuclear-family-type household ratios have increased in all regionsof Japan. The variation coefficiency (standard deviation divided byaverage) of ratios in 46 or 47 prefecture was either 0.103 or 0.104,showing little change in regional differences.
4. Changes in the Head of Household Ratio
The concept of the head of a household plays an important role inthe analysis of households. Population and household surveys arecarried out on the idea that there is one and only one head to a family.The decision on who is the head of the family is left to the familyconcerned.
I explained that the classification of households into family typesdepends on the relationship of the family members to the head of thefamily. It is impossible to make this classification unless the head ofa household is determined. Also, as long as we assure that there isonly one head to a household, then we can find out the number ofhouseholds by counting the number of heads of family. For this reason,the head of household ratio - the ratio of heads of household to thesex-age specific population - becomes a key factor in the futureestimation of the number of households. If a sex-age specificpopulation is given, and the future estimate of a sex-age specific ratioof family head can be established we can then estimate the number ofhouseholds for a given period for both sexes and all ages.
The Population Census and other surveys indicates that the sex-agespecific family head ratio has been relatively stable over the years,although it has shown a somewhat unusual trend recently. Table 7 showsthat head of household ratio for males broken down by marital status.
The overall head of household ratio for young males in their 20sand 30s has declined in the last decade, while that for males in their60s and 70s has risen. In the past, the head of household ratio foryoung males had been increasing every year, and this has helped push upthe number of households. The recent trend is reversed.
In all three marital-status classifications, the head of householdratio is declining among the younger generation in general and risingamong the older generation.
This extraordinary trend seems to have been influenced by factorssuch as the percentage of the married population, the ratio of parentsand children living together and the relationship dynamics of parentsand children living together.
- 37 -

As an insight into this problem, Kiyoshi Hiroshima, in his "FactorsInfluencing the Recent Changes in the Head of Household Rat.i.o'' Lf studyof Population Problems}), No. 182, April 1987), gives an explanation ofthe result of his analysis.
"tl'he most important factor that contributed to the decline of thehead of household ratio among young males is the decrease in thepercentage of the married population. Another important factor is thatmore and more couples are living with parents, bringing down the head ofhousehold ratio in that age group. Families living separately fromparents do little to slow down the decline in the age-specific head ofhousehold ratio.
The rise in the head of household ratio among elderly males, on theother hand, is caused by an overall increase in the population ofmarried people (due to a decline in the mortality rate among females), adecrease in the ratio of elderly males living together with marriedchildren, and a rise in the head of household ratio when living togetherwith their children."
The most important issue here is whether the decline in the child'shead of household ratio and the rise in the parent's head of familyratio are caused by cohabitation of these two generations. The abovementioned article by Hiroshima analyzes that more and more married malesunder 40 are living together with their married fathers. In this case,only a small percentage of the married males under 40 aSSume the role ofhead of household. This is also true when they are living together withtheir father without a spouse or person other than the father.
It was customary in the past for a married male to establish ahousehold and declare himself the head of his household. As more peoplehave begun to live separately from their parents and establish nuclearfamilies, the head of household ratio was expected to rise, at leastamong males. But in the new trend that emerged around 1975, the head ofhousehold ratio among young males was on a downward trend. So far wehave not been able to clearly identify the factors that have caused thisphenomenon.
- 38 -

Table 1 Increase in Population and Number of Households
Household Number of Number of Number of Rate of increase (. )
category households persons in persons per Number of Number of( 1000) households household households persons per
Year (1000 ) householdOrdinaryhousehold
1955 17,540 87,173 4.97 13.3 3.61960 19,871 90,285 4.54 17.2 4.61965 23,280 94,393 4.05 16.3 5.91970 27,071 99,983 3.69 15.5 8.01975 31,271 107,970 3.45 9.1 5.31980 34,106 113,733 3.33 7.0 3.61985 36,478 117,832 3.22
Generalhousehold
1960 22,538 93,419 4.14 15.9 5.219651970 30,297 103,351 3.41 10.9 6.81975 33,596 110,338 3.28 6.6 4.61980 35,824 115,451 3.22 6.0 3.41985 37,980 119,334 3.14
Source: Population Census
- 39 -

Table 2 Number of General Households According to Number of Persons perHousehold
Number of general households ( 1000)1970 1975 1980 1985
Total 30,297 33,596 35,824 37,9801 6,137 6,561 7,105 7,8952 4,184 5,257 6,001 6,9853 5,322 6,259 6,475 6,8134 6,885 8,301 9,070 8,9885 3,907 3,904 3,982 4,2016 2,285 2,037 2,033 1,985
More than 1,577 1,277 1,157 1,1137
Ratio according to number of persons per household (%)
1970 1975 1980 1985Total 100.0 100.0 100.0 100.0
1 20.3 19.5 19.8 20.82 13.8 15.6 16.8 18.43 17.6 18.6 18.1 17.94 22.7 24.7 25.3 23.75 12.9 11.6 11.1 11.16 7.5 6.1 5.7 5.2
More than 5.1 3.7 3.2 2.97
Total123456
More than7
Rate1970-1975
10.96.9
25.617.620.6-0.1
-10.9-19.0
of increase (%)1975-1980
6.68.3
14.23.59.32.0
-0.2-9.4
1980-19856.0
11.116.45.2
-0.95.5
-2.4-3.9
Source: Population Census
- 40 -

Table 3 Size of Households in Major Industrialized Countries
Name of country (year)Japan (1985)Soviet Union (1979)Italy (19S1)U.S.A. (19S0)France (1982)west Germany (1972)England (19S1)Sweden (1980)
Source: UN, Demographic Yearbook
Size of households3.14.03.02.72.72.72.72.3
Table 4 General Households According to Family Type
Unit: 1,000 households(%)
Family type 1975 19S0 19S5Total 33,596 35,824 37,980
(100.0) (100.0) (100.0)A. Kinship household 26,968 28,657 30,013
(SO.3) (SO.O) (79.0)L Nuclear family households 19,980 21,594 22,804
(59.5) (60.3) (60.0)Harried couple only 3,880 4,460 5,212
( H.6) (12.5) (13.7)Harried couple and children 14,290 15,081 15,189
(42.5) (42.1) (40.0)Father and children 257 297 356
(O.S) (O.S) (0.9)Mother and children 1,553 1,756 2,047
(4.6) (4.9) (5.4)2. Other kinship household 6,988 7,063 7,209
(20.S) (19.7) (19.0)B. Non-kinship households 67 62 73
<0.2) (0.2) (0.2)C, Single households 6,561 7,105 7,895
(19,5) (19,S) (20.S)
Source: Population Census
- 41 -

Table 5 Percentage Change in the Number of General Households Accordingto Family Type
Family type 1960 65 65 70 70-75 75 80 80 85Total 10.9 6.6 6.0A. Kinship household 14.2 12.5 12.1 6.3 4.7
1, Nuclear family households 22.7 17.8 16.3 8.1 5.6Married couple only 39.8 29.6 30.6 14.9 16.9Married couple and children 23.6 18.0 14.6 5.5 0.7Father and children -5.7 8.2 1,7 15.6 19.6Mother and children 2.7 0.4 4.2 13.1 16.6
2. Other kinship household -0.7 1.1 1.7 1.1 2.1B. Non-kinship households 18.4 13.7 -33.5 -7.5 18.0C. Single households 6.9 8.3 11.1
Source: Population Census
- 42 -

Table 6 Regional Differences in Family Structure (1985)
Name ofprefectureNational average1. Hokkaido2. Aomori3. Iwat;e4. Miyagi5. Akita6. Yamagata7. Fukushima8. Ibaraki9. Tochigi
10. Gunma11. Saitama12. Chiba13. Tokyo14. Kanagawa15. Niigata16. Toyama17. Ishikawa18. Fukui19. Yamanashi20. Nagano21. Gifu22. Shizuoka23. Aichi24. Hie25. Shiga26. Kyoto27. Osaka28. Hyogo29. Nara30. wakayema31. Tottori32. Shimane33. Okayama34. Hiroshima35. Yamaguchi36. Tokushirna37. Kaqawa
38. Ehime39. Kochi40. Fukuoka41. Saga42. Nagasaki43. Kumamoto44. oita45. Miyazaki46. Kagoshima47. OkinawaSource: Population
Nuclearfamily households
62.566.957.553.255.851,446.654.160.659.062.070.368.259.069.052.151, 753.451,558.856.558.460.564.960.159.760.968.766.965.562.352.552.559.364.062.455.658.962.460.463.956.564.058.359.965.966.766.7
Census
- 43 -
Singlehouseholds
17.518.914.814.817.411,911.013.311.712.312.213.414.230.418.312.110.116.611, 714.813.011,412.915.112.010.021,819.215.510.714.513.714.415.317.817 .115.614.517.420.718.612.315.916.117.316.421,616.9
Nuclear familytype households
80.085.872.368.073.263.357.667.372.371, 274.283.782.489.487.464.361.870.063.273.669.569.873.480.072.169.882.787.982.476.276.766.266.974.681.979.471, 273.479.881.182.668.880.074.477.182.388.383.5
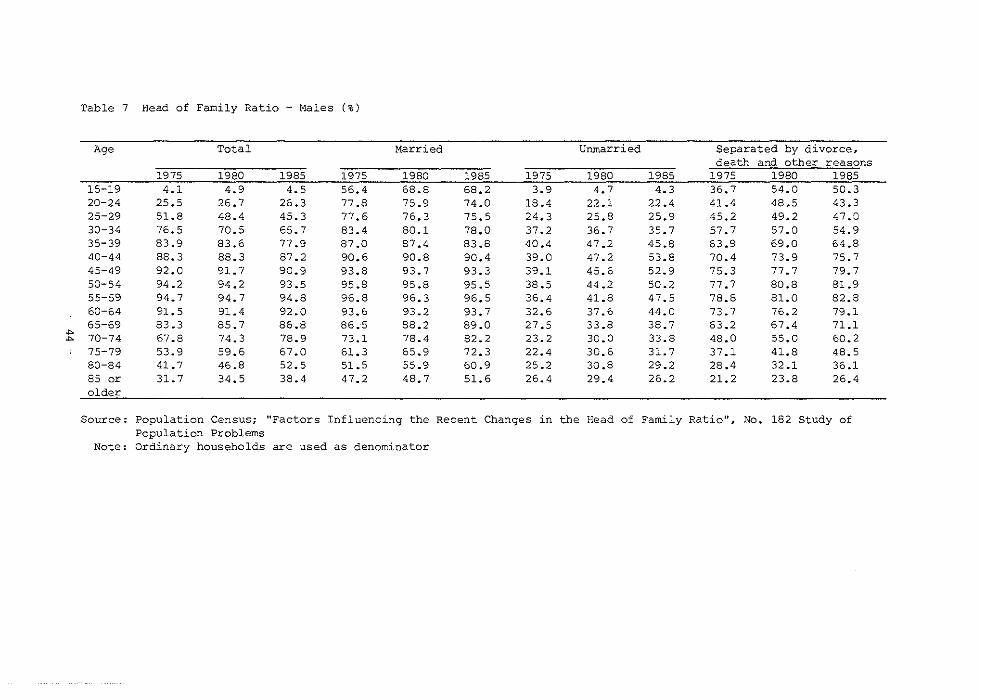
Table 7 Head of Family Ratio - Males (%)
Age Total Married Unmarried Separated by divorce,death and other reasons
1975 1980 1985 1975 1980 1985 1975 1980 1985 1975 1980 198515-19 4.1 4.9 4.5 56.4 68.8 68.2 3.9 4.7 4.3 36.7 54.0 50.320-24 25.5 26.7 26.3 77.8 75.9 74.0 18.4 22.1 22.4 41.4 48.5 43.325-29 51.8 48.4 45.3 77.6 76.3 75.5 24.3 25.8 25.9 45.2 49.2 47.030-34 76.5 70.5 65.7 83.4 80.1 78.0 37.2 36.7 35.7 57.7 57.0 54.935-39 83.9 83.6 77.9 87.0 87.4 83.8 40.4 47~2 45.8 63.9 69.0 64.840-44 88.3 88.3 87.2 90.6 90.8 90.4 39.0 47.2 53.8 70.4 73.9 75.745-49 92.0 91.7 90.9 93.8 93.7 93.3 39.1 45.6 52.9 75.3 77.7 79.750-54 94.2 94.2 93.5 95.8 95.8 95.5 38.5 44.2 50.2 77.7 80.8 81.955-59 94.7 94.7 94.8 96.8 96.3 96.5 36.4 41.8 47.5 78.8 81.0 82.860-64 91.5 91.4 92.0 93.6 93.2 93.7 32.6 37.6 44.0 73.7 76~2 79.165-69 83.3 85.7 86.8 86.5 88.2 89.0 27.5 33.8 38.7 63.2 67.4 71.1
~
70-74 67.8 74.3 78.9 23.2 30.0 33.8 48.0 55.0 60.2~ 73.1 78.4 82.275-79 53.9 59.6 67.0 61. 3 65.9 72.3 22.4 30.6 31. 7 37.1 41.8 48.580-84 41.7 46.8 52.5 51.5 55.9 60.9 25.2 30.8 29.2 28.4 32.1 36.185 or 31.7 34.5 38.4 47.2 48.7 51.6 26.4 29.4 26.2 21.2 23.8 26.4older
Source: Population Census; "Factors Influencing the Recent Changes in the Head of Family Ratio", No~ 182 Study ofPopulation Problems
Note: Ordinary households are used as denominator

Chapter 4
Family and Regional Development
Hiroaki Shimizu
Director
Department of Population Dynamics
Institute of Population Problems
Ministry of Health and Welfare

1. Introduction
In the study of the family and region in Japan, we perhaps havepaid little, if any attention to what Peter Laslett calls the threedogmas. l
According to Laslett, "In Europe and probably in other parts of theworld, it is mistakenly believed that, prior to industrialization,people lived together in large families, in a complex kinship structure."Let us call this idea the large-scale household dogma. A secondmistaken idea is that such groups - always and everywhere have changedover time from large-scale to sma Ll.e-aca Le , and from complex to simple.Let us call this the one-directional dogma. Thirdly, it is mistakenlysupposed that the industrialization or 'modernization I process alwaysentails changes corresponding to the one-directional dogma. \'1e callthis the industrialization dogma .,,2
I believe that we must free ourselves from these dogmas if we areto develop studies that will help improve people1s welfare. This paperexamines the problems of family and region from this viewpoint.
2. Family and Regional Development: Significance of the Study
I would like to reflect on the problem of regional development,based on the idea that the family serves as the basic model giving us aninsight into the regional characteristics.
The family may be thought of as a mirror that reflects the socialstructure of the region. It has been pointed out, for example that lithefamily is the ground which cultivates all social relations, and a mirrorin which all social functions are reflected.,,3 "The sociological studiesof marriage and family must not restrict themselves to attempting tounderstand social phenomena. They should thoroughly investigate,through these phenomena, the large-scale social structure and theprinciples underlying it. Family sociology is the one and onlymagnifier to study the society and its history.,,4 "In socialanthropology, the family is considered basic to the social structure.The family is obviously an important idea in examining society's groupstructure and human relationships. In any given society, thetraditional family system clearly reveal the sociological orientation ofthe society I s members. The process in which modernization erodes thesystem also displays this tendency. So a comparison of sociologicalorientations between societies would be key to understanding the socialstructures inherent in d i f ferent societies." 5
In what context, then, is the word development used?definition holds that development refers to "a process of
- 47 -
One recenta series of

planned, intended actions aimed at improving the welfare of the peopleby developing the economic, social, and cultural aspects of all or partof the society. ,,6
Many discussions have been presented on the ideas of regionaldevelopment and its direction. Here, I would like to introduce someopinions gleaned from the Council on Population Problems 1 reports andstudy meetings. I would also like to touch on the significance ofcontinuing to study on regional development.
In 1963, the Council on Population Problems reported to thegovernment on its views regarding "Regional development items whichrequire special attention, from the viewpoint of resolving populationproblems." The report emphasized that the idea and the ultimate goal ofregional development lay in "improving the true welfare of the people;in other words, of local residents."? Welfare, here "refers to acondition in which individuals are able to fulfill their frees andattain happy lives .,,8
Also, reports by the Board of Inquiry on Regional Economic Problemsand the planning subcommittee of the same Board point out that regionaldevelopment programs of the past have had little comprehensiveunderstanding of regional problems and regional differences. They alsosaid, " a program may be labeled appropriate if upon its implementation,the average needs of residents in each re~ion - i.e., after providingfor regional d i f ferences - are ful filled." The report thus recognizedthat regional differences exist in Japan, and suggest the need fordevelopment policy that considered the culture and thinking unique toeach region.
I would like to approach regional development from the basis ofregional differences in family structure. I believe that this is animportant consideration and one which merits further study.
3. Regional Differences in Family Structure
The family structure here refers to the norm or value systemsconsidered ideal within a given society or family. In other words, itis the structure wh i.ch a people in the society think best. For somesocieties, the ideal is for parents to live together with children andchildren I s spouses; this is the "stem family system, II in which thefamily centers on the parent-child relationship or on the fat.he r-rsonline of succession. 10 In other societies the ideal is for parents andmarried children to live separatel:?:, in "con juqe I family s ys t.em't r i.e.,as couples or as nuclear families. 1
Here, I would like to follow the idea that, II In Japanese society,qualitative and quantitative differences exist is the standards for
- 48 -

family structure. There exists also a specific distribution range foreach standard." 12
Let us consider the regional differences in Japanese familystructure, basing on discussion on the above definitions of familystructure and regional difference.
The study of regional differences in family structure must utilizevast data from past surveys. I have decided to divide regions intothose which are conjugal family system societies and those which arestem system societies, the basis for the division being the ratio ofnuclear-type households (i. e , , nuclear family households plus singlehouseholds) among all households containing at least one member over 65years of age. Regions for which the ratio exceeds 50% were termedconjugal-system societies, the remainder, stem-system societies. 1 3 ForJapan, the 1985 Population Census shows that 13 prefectures are conjugalsystems, these include Kagoshima (71.2%), Tokyo (61.7%) and Kochi(55.9%). The stem family system is found in 34 prefectures, headed byYamagata (22.6%), Toyama (24.9%), and Akita (26.9%).
A close examination reveals that conjugal-family societies aredistributed around metropolitan areas and in the regions of Sanyo,Shikoku and southern Kushu, v...hile stem family system societies arescattered over a wide area in the Tohoku and Hokuriku regions. (seeFig. 1)
What is the relationship between the regional differences in familystructure and regional ideas regarding families and households? The"Demographic Survey on Changes in the Family Life Course and HouseholdStructure" was conducted in 1985 by the Institute of PopulationProblems, Ministry of Health and Welfare.
The survey asked: Il~'le wish to know your opinion about parents andmarried children living together. Various arguments have been expressedon this issue, and we would like to hear yours." The results showedthat, on the whole, the highest preference was for three-generations(grandparents, parents, and married children) to live together (e.g.,"three generations should live together if possible, II Il it is better ifthree generations could live together" 'lit is natural that threegenerations live t.oqet.he r"}, Regional examination showed that nuclearfamilies were preferred in the metropolitan areas, and in Hokkaido,Shikoku, and southern Kyushu (e.g., I would prefer to live in a nuclearfamily; "it is natural to live in a nuclear family," II we should live innuclear families if possible"), while Tohoku and Hokuriku we r-epar-t i.cuLar-Ly in favor of three-generation families. The study furthershowed that the actual regional conditions of families correlatedpresently with these preferences. (see Figs. 2 and 3).
In this section, we have d i scus sed the concept of reg ionaldevelopment, the direction it may take, and the partinence of regional
- 49 -

differences in family structure. Based on this discussion, in the nextsection we will consider the problems associated w.i t.h the family andregional development.
4. Family and Regional Development
In this section, I will address the issue of family and regionaldevelopment based on the relationship be tween the form of residence orfamily structure and support of aged parents suggested by ProfessorKiyomi Morioka. I am addressing this issue because I thought it wouldbe the most important concern in any regional society.
Professor Mor i oka says "When we say a family is living together, itmeans family members actually form one household (and not just in familyregister forms). So, daily contact is the rule in families livingtogether .14 Families whose members live separately but not far awayfrom one another can have contact on a daily basis, but this is notalways possible. They can withhold contact if they wish to because theyare not members of the same household. 1 5 When we say family members areliving far away from one another, we mean the distance between them isso large that family members cannot have contact on a daily basis." 1 6
Professor Morioka also identified three aspects of supporting agedparents. One is economic support (assistance to fulfill a need foreconomic stability) health~related care (assistance to fulfill a need tomaintain good health and to be carried for in case of illness as well asto receive medical treatment free of charge) and emotional support(assistance to fulfill a need to talk with someone to get a sense ofsecurity through human relationships among family members).l?
Based on this formula, Professor Horioka also argues that livingtogether offers the most stability in economic support, health-relatedcare and emotional support, but it falls short with regard to protectingprivacy and avoiding emotional conflict. Family members living close toparents can meet their needs for economic and emotional support just asfully as when living together, if they have the willingness and abilityto do so. However, they may find it difficult to cope with emergencyhealth situations. Living far away from one another would be the bestoption in order to protect privacy and avoid emotional conflict. Sincedaily contact is not pos s i.b Le , even by using telephone and letters,parents I needs for emotional support cannot be met as fully as livingclose by, this living arrangement is also inadequate in meeting parents I
health-related needs (economic support is possible if family members arewilling to provide it). Living far away therefore cannot work well whenit comes to supporting aged parents. 18 (see Fig. 4)
If we apply Professor Morioka's formula explaining the relationshipbetween living arrangements and support of aged parents to cases inJapan, we see a coexistence of "stem family" societies, in which married
- 50 -

children live together with aged parents in principal (Yamagata, Toyama,Akita and other prefectures) and "conjugal family" societies, in whichmarried chi.Idren live separately from aged parents (Kagoshima, Tokyo,Kochi, and other prefectures). Now, let us take Yamagata and Kagoshimaprefectures as examples, and make a comparison between stem familysocieties and conjugal family societies.
The living together form of habitation represented by Yamagataprovides for considerable stable care of aged parents in terms ofeconomic support and health related care. This living arrangement,however, has potential problems in protecting privacy and avoidingemotional conflict. At the same time, the idea that married childrenshould live together to take care of aged parents prevails in householdsconsisti.ng of "aqed people who need various forms of care." In suchcases, the spouse or the daughter-in-law often is burdened with caringfor aged parents. It is not socially acceptable to go against theprevailing logic and put aged parents in a nursing home. These regions,therefore, will need welfare services based on home care; services thathelp spouses or daughters-in-law care for the aged and relieve them ofsome of their burden. In prefectures such as Kagoshima, aged parentsand married children living close by used to be the most popular livingarrangement but it has changed since and living far away from oneanother is gaining ground. Living close by is more effective thanliving together in protecting family members' privacy and avoidingemotional conflict at home. If the family consists of an "aged personneeding care," howeve r , there is not much difference in family members'contact between these two types of living arrangement. Home care wouldnot be suitable since they in principle live separately. In theseregions, therefore, it wi Ll. be necessary to improve the welfare systembased on institutional care. I believe this move will have to befurther promoted for family members living far away from one another.
A reflection on the relationship between living arrangements andsupport of aged parent.s in Japan, as suggested by Professor !>lorioka,indicates that in prefectures such as Yamagata and Kagoshima there willbe dif ferent problems in supporting aged people. If so, diversedevelopment measures which allow for support of the aged will be calledfor. I believe that only by formulating and promoting developmentmeasures sui table for the region in question we can hope improve thewelfare of residents in the region.
5. Theories on Japanese Family Structure
Finally, I would like to touch on where the aforementioned theoryon regional differences in the family structure stands in the previousstudies on the Japanese family.
In Japan, empirical research on the family started in early 1930's.
- 51 -

In about fifty years various debates on the family structure in Japanand its structural changes have been made in many academic disciplines.
First, these seem to be two views on the traditional Japanesefamily structure. One view holds that stem families were the mostdominant traditionally and the other holds that while stem families weredominant, conjugal families also existed concurrently.
Views on the traditional family system and the direction ofstructural change also very. Scholars considering the "e t.em familys ys t.em" most; dominant can be broken down into those who argue the stemfami ly structure has been maintained up to the present C'bomoqene i. tyt.heo r y'") and those who insist that the stem family system has undergonestructural changes to be replaced by the conjugal family system(" structural change theory")
Scholars insisting that stern family and conjugal family systemsexisted concurrently can also be divided on how the system has changedover the years. Some say the two family structures are still maintainedand they reflect regional dif ferences (vhet.e.roqenei. ty t heor y'") , othersbelieve that the conjugal family system has the potential to betransformed into the stem family system. ("structural change theory")(see Table 1)
The structural change theory is believed to be most valid of alltheories on family structure. Only a small number of scholars supportheterogeneity theory.
6. Summary and ConeI usion
There are many ways to conceptualize the Japanese family structureand its structural changes as we have seen so far. This diversitybasically stems from dif fe r ent. understanding of what. the structure oftraditional family was like: whether emphasis is put on changes or thepreserved, traditional aspects.
As regards the relationship between different ways of understandingfamily structure and social/economic changes, "t.ransfo.rmat.i.on theory"holds that the traditional family structure wi.Ll. undergo structuralchanges in response to social and economic changes. "Homogeneitytheory" and "heterogeneity theory", on the other hand, hold that thetraditional family structure has persisted in spite of economic andsocial changes.
I have considered the relationship between the above theories andpromotion of regional development that takes regional dif fe r ence e intoaccount. I felt that subjects (people) who can recognize the uniquevalues inherent in each region (structure of culture and perception =
- 52 -

the way people think and feel) and problems associated with regionaldifferences have to assume the majority before development policies for"improvement of residents, welfare" Can be formulated and promoted,19
I also feel that emergence of subjects or people with heterogeneousviews,20 who are liberated from Peter Laslett's dogmas, may be necessaryin realizing development aimed at improving the welfare of theresidents.
(Note)
1. Laslett, Peter, "The European Household and its History as Viewedfrom Japan." In Osamu Saito (eda Lr Peter Laslett et a I , HistoricalSociology of Family and Populatlon - Study of Cambridge Group,Libroport, 1988, pp. 28 29.
2. Laslett, Peter, Ibid. pp. 28-29
3, Koyama, Takashi, IIStudy of Family structure in Etchu Goka-yamaHida Shirakawa Region (I)," In Research Journal vol. 6, No.Takaoka (Old) High School, 1933, p. 278.
and
2,
4, Halchev, A.SociologicalSh Lnsha , 1967,
in the Soviet Union: AHiromi Teratani), Sagen
5. Nakane, Chie, The Family Structure - A Social AnthrolopologicalAnalysis. The University of Tokyo Press, 1970, p, iii.
6, Iwaki, Sadayuki,Yoshihisa Tanaka1988, pp. 121-122.
"Development", In Sosuke(eds). Encyclopedia of
Mita, AkiraSociOlogy.
Kurihara,Kobunsha,
7. Minister's Secretariat Planning Division. Ni.n i.s t.r-y of Health andWelfare (ed). Citizens' Life and New Industrial City - Report fromPublic Seminar on New Industrial City for Related Prefectures.Printing Bureau, Ministry of Finance, 1964, p. 166
8. Hinister I s Secretariat Planning Division, l<1inistry of Health andWelfare (ed), Ibid p. 157.
9. Minister's Secretariat Planning Division, Hinistry of Health andWelfare (ed). Ibid. p. 159,
10. Nakane, Chie, Ibid. pp. 35-38.
11. Nakane, Chie, Ibid. pp. 35-38.
- 53 -

12. Garno, Masao, Materials on Sociology Lecture III. Keibundo, 1956, p.13.
13. See Shimizu, Hiroaki, Sociology of PopulationSaishobo, 1986, p. 88 on this point.
and Family.
14. Morioka, x.i yorni , "Suppor-t of Aged Parents". Kiyomi Morioka andTakashi Mochizuki. The New Sociology of Family (revised edition).Baifukan, 1987, p. 124.
15. Nor i.oke , Ki.yomi , Ibid. p. 124
16. Morioka, Kiyomi. Ibid. p. 124
17. Morioka, Ki.yomi , Ibid. pp , 121-122.
18. Horioka, Ki.yomi , Ibid. pp, 124-125.
19. I said this because I agree with the statement: "Regionaldevelopment would not serve as a means to realize a welfare statein the true sense unless we adopt the thinking that the subjects aswell as objects of development are people" (Minister's SecretariatPlanning Division, Ministry of Health and Welfare (ed ) , Ibid. p.166.)
20. Professor Nartine Segalene says, "As a system the family had dualforces; to resist or adapt to social changes. The family hassurvived times of economic and social fluctuations as the Europeansociety transformed from an agrarian economy to an industrialsociety. Seen historically from some distance, we can say thefamily as a system - rather than as a (basic unit) of the societyor the last fort for protection against hardship in the society has responded and at the same time resisted to changes in thesoc.i.e t y" (Martine Segalene (translated by Yoko Kataoka, KimikoKimoto, Sonoko Kokuryo, Mizuyo Shibayama, Mineko Suzuki and KayokoFujimoto). Historical Anthropology of the Family. Shinhyoron,1987, p.3)
- 54 -
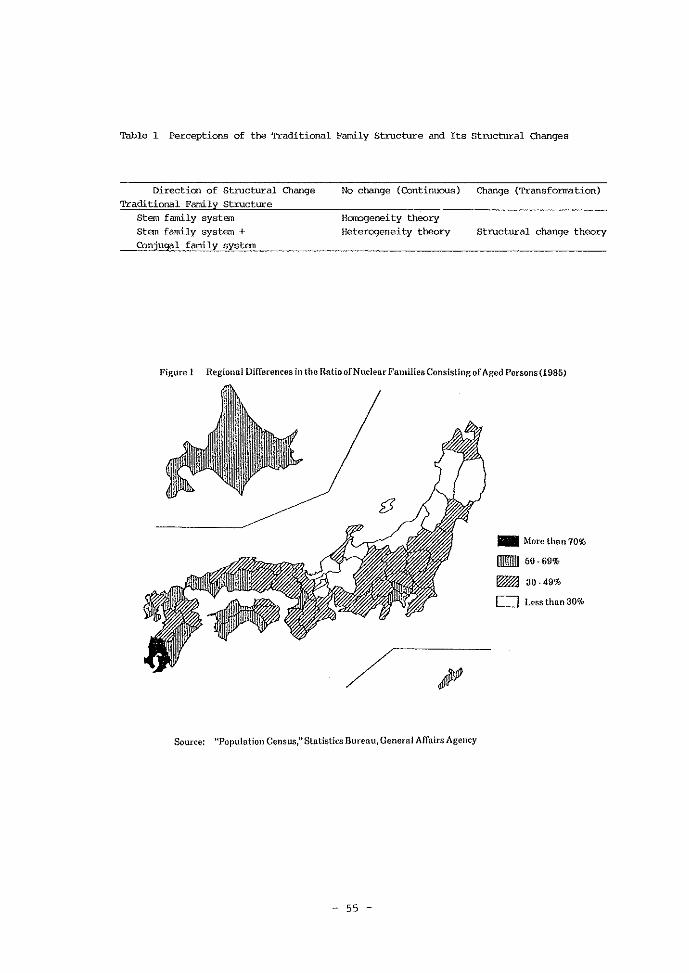
Table 1 Perceptions of the Traditional Family Structure and Its structural Changes
Direction of Structural ChangeTraditional Family structure
Stem family system
Stem family system +Conjugal family system
No change (Continuous)
Hcxrogeneity theoryaetercqenefty theory
Change (Transformation)
structural change theory
Figure I Regional Differences in the Ratio of'Nuclear Fauulies Consistlngof Aged Persons(1985)
/
_ More than 70%
IJIIIIIIIIII 50-69%
I%!ID 30 - 49%
o Less than 30%
Source: "Population Census," Statistics Bureau, General Affairs Agency
- 55 -

Figure 2 Nuclear Family Orientation (1985)
• More than 40%_ 30-40%
o Less than 30%
Source: "Demographic Survey 011 Changes in the Fnrni ly Life Course and Household Structure,"Iusutute of Population Problems, Ministry of Health and Welfare.
Figure 3 Willingness to Live in a Tree-Generation Family{1985}
• More than 50%_ 40-50%
_ 30-40%
o Less than 30%
Source: "Demographic Survey 011 Changes ill the Family Life Course and Household Structure,"Institute of Population Problems, Ministry of Health and Welfare.
- 56 -

Figure 4 Magnitude of Functions and Reverse functions Concerning support; of Aged Parents
according to Living Arrangement
Aspects of suppor-t.
Living arrangementEconanic
SUptDrt
FunctionsBrot.iona l
SUptDrt
Health
related care
Reverse functionsProtection Generationof emotional conflict
of privacy
Living tcqether 0 0 0Living separately
Living close by 0 0 0
Living far away 0 0
large
Medium
&m11
oo
(Source): Kiyomi Morioka and Takashi Hochizuki, '!he New sociology of Family (revised
edition). Ba i.fukan, 1987, p. 125.
- 57 -


Chapter 5
Population Aging and Family
Sumiko UchinoDirector
Department of Population Structure Studies
Institute of Population Problems
Ministry of Health and Welfare

1. General View of Population Aging
Population aging in Japan is progressing more rapidly than in anyot.her developed countries. According to the population projectionsconducted by the Ni ni st.ry of Health and Welfare in 1986, the proportionof the aged population of Japan (65 years and older) is estimated toincrease to 16.3% in year 2000, 20% in 2011, 23% in 2017, and 24% in2040.1)
The proportion of the aged population of Japan in 1985 was 10.3%which was the lowest level comparable to Canada and Australia, but asshown in the above projections it will reach 16.3% in a decade or so,posting the world 1 s highest figure equivalent to Sweden's. Furthermoreit is projected to become 23-24% in the 21st century, surpassing majorwestern countries and have the largest proportion of aged population inthe world.
At this juncture, a few facts regarding population aging in Japanmust be pointed out. First of all, increases in the number of theelderly in the population. In 1980, the aged population of Japan, 65years and older, numbered a little more than 10 million. However,according to the projections this figure will double by 1998 to 20million and triple by 2015. The rate -of increase is too high to beoverlooked.
Secondly, the change in the dependency ratio. 'I'he dependency ratiorepresents the proportion of children and the elderly dependent on theproductive-age population. It is equally important to study trends inthe dependent population as a whole as well as its components tounderstand the burden imposed on society by population problems. Forexample, an increase in the aged population aging will naturally raisethe dependency ratio. However, if the child population declines,accordingly, the total dependency ratio may not be affected. Thebreakdown will show an increase in aged population and a decline inchild population.
In 1985, the total dependency ratio was 46.7% and is projected toincrease to 52.1% at the end of this century, 62.8% in 2010, and 67% in2015. Furthermore, in 1985 there wer-e 48 elderly people to every 100children (aging index), and according to the projections the aging indexwa Ll become 90/100 in 2000 and 108/100 in 2010. As mentioned above,there will be more elderly people than children in early next centuryand the focus of society's attention wi LL be shifted from children tothe elderly.
The third factor is the problem of progressive aging process ofelderly population. Among the aged population, the "old-old" group (75years and older) is expected to increase more rapidly than the "youngold" (65-74 years old). In 1985, 38% of the total aged population was
- 61 -

accounted for by the old-old group, and this figure is expected toincrease to 40% in 2000, 46% in 2010, 52% in 2023, and 57% in 2028. Thefact that more than half of the total aged population wi.Ll. be shared bythe old-old group wi.Ll. have a significant impact on the future socialand economic life.
Table 1 summarizes several indices of the future population aging.The current trend of popuLat.Lon dynamics also needs to be considered atthis point. First, the birth rate statistics show that since 1973 boththe crude birth rate and the total fertility rate have continued todecline and in 1987 the crude birth rate was 11.1 and the totalfertility rate 1.69, the lowest figures ever recorded. The birth rateto date has continued to drop and this suggests the seriousness of theproblem of population aging.
Another point is the decline in the death rate among the agedgroup. As shown in Table 2, in 1980, 1985, and 1987 the death rateshows a definite declining trend. It is also to be noted that even inthe past two years (1985-1987) the death rate in general declined.Again, this means an increasing probability of survival of agedp::>pulation which will leading to the increase in aged population.
In consideration of the declining trends in the birth rate and thedeath rate, population aging may be progressing beyond our projections.Not only will this phenomenon affect our society, but also the presentfamily and household structures.
2. Family Types of the Aged
After the war, Japanese household structures gradually changed.Traditional three-generation households have been on the decline and incontrast nuclear families and single households grew. The quinquennialp::>pulation census during 1970 and 1985 shown on Table 3 indicates thesechanges.
Nuclear family households can be further broken down intohouseholds composed of (a) a couple only and (b) a couple and theirunmarried child(ren). The nuclear family households accounted for 56.7%of the total ordinary households in 1970, 60.3% in 1980, and 60% in1985. Though a slight decline per cent.aqa-wise was recorded in 1985, itis important to note that the actual number of nuclear family householdscontinued to increase (Table 3).
In fact, nuclear families consisting of a couple and theirunmarried child(ren) outnumber those consisting of a couple only. Theformer accounted for 83% of the total nuclear family households in 1970but declined to 77% in 1985 while the latter increased from 17% to 23%dur ing the same period. 'l'h i.s increase is mainly due to the growth of
- 52 -

the aged couple households resulting from progressive population aging.
Furthermore, during the the same period (1970-1985) the number ofnuclear families consisting of a couple and their unmarried childrenrose from 14.21 million to 17.59 million, an increase of approximately3.4 million or 23.8%; while that of nuclear families consisting of acouple only from 2.97 million to 5.21 million, an increase ofapproximately 2.24 million or 75%.
The increase of single households is also not.ewor t.hy , In 1970 thetotal number of single households we s 6.14 million which grew to 7.9million in 1985, an increase of approximately 1.76 million or 29%. Anexamination of census data for five-year periods also shows rapidchanges in the annual average rate of increase (1.34% for 1970-75; 1.61%for 1975-80, 2.13% for 1980-85). Again, this is largely due toprogressive population aging.
It is said that nuclear family households have reached thesaturation point, suggesting a possible decrease. However, actualnumbers still continue to increase, mainly due to the growth of "coupLeon Ly'' households. Therefore, in the consideration of the above, eventhough there will be a slight decrease in nuclear families consisting ofa couple with their unmarried children the increase in the number of"couple onLy" families will augment the total number of nuclear familyhouseholds.
Table 4 shows the general trends in households of the aged. In1975, heads of household who are 65 years and older numbered 3.4 millionwhich rose to 5.23 million in 1985, an increase of approximately 1.8million or 54%. "Couple only" households and single households doubledin a decade from 870,000 to 1.6 million and from 630,000 to 1. 2 millionrespectively.
In reviewing the figures in 'fable 3, the number of "coupl e only"households rose from 3.88 million to 5.21 million in total between 1975and 1985, an approximate increase of 1.33 million or 34%. Howeve r , asmentioned earlier the number of households consisting of couples of 65years and older doubled in a decade and its ratio to the total "coupleonly" households rose from 23% in 1975 to 31% in 1985.
The number of aged people living alone also doubled in ten years(1975-1985). However, it is interesting to note that the number ofsingle households as a whole increased by 1.33 million or 20% during thesame period. The ratio of the aged single to this total singlehouseholds is 10% in 1975 and 15% in 1985.
Therefore, as seen from the projection, this population agingproblem will be reflected in significant changes in the nuclear familyand single households in the future.
- 63 -

3. Family Types of Aged Population by Region
The regional population aging show different characteristics andtrends than that of national population. Other than the aforementionedfertility and mortality, "migration" is another factor to be considered.Many young people leave their home town for big cities or other urbancommunities for various reasons and as a result the elderly people areleft behind, statistically increasing the aged population of therespective region while on the other hand rejuvenating the population ofthe urban cities as a result of im-migration 'of the young.
The retirement system is also another factor which very muchaffects the family structure in regional communities. Therefore thefamily types of the aged in the rural districts are quite complicatedsince many other factors such as the two mentioned above cannot beoverlooked.
The population census conducted in 1985 shows the distribution ofaged households by prefecture, whi Le categorizing them into three types,namely: (a) ordinary households with elderly members, (b) nuclear familyhouseholds composed of elderly members only, and (c) households ofsingle elderly persons. (Figures 1, 2, and 3)
According to the national average based on the census, householdswith elderly members accounted for 24.4% of the total ordinaryhouseholds. The highest rate was recorded for Yamagata Prefecture(38. 3%) and Shimane Prefecture (38.6%). The lowest was recorded forKanagawa Prefecture (16.9%), Tokyo (17.7%), and Saitama Prefecture(18.0%). The figure proves that there are a smaller number ofhouseholds with elderly members in the urban areas such as Tokyo. InShimane and Yamagata Prefectures posting the highest figures, the agedpopu Let.i.on of 65 years and older accounted for 15.3% and 13.4% of thetotal prefectural population respectively. In contrast, in KanagawaPrefecture the percentage of people who are 65 years old and over to itstotal population is 7.48%, corresponding to a low level of thepercentage of ordinary households with elderly members.
On the national average, households of aged couples only accountedfor 17.8% of the total ordinary households. Looking at individualprefectures, Kagoshima Prefecture has the highest ratio (28.9%) followedby Hokkaido (25.8%). On the other hand, it was only 9.0% for YamagataPrefecture. As shown in Figure 2 the Lower- proportions of households ofaged couples only are found in Tohoku, Hokuriku, while major urban areassuch as 'I'okyo (23.0%), Kanaqewa (20.2%), and Osaka (21.3%) and Kyushushowed opposite trends.
The national average ratio of aged single households was 12.7% tototal ordinary households wi.t.h elderly members. Looking at individualprefectures, Kagoshima (28.0%) more than doubles the national average,
- 64 -
followed by Kochi (20.7%). In contrast, figures for Tohoku and Hokurikuwere at the 7-8% level. Western Japan as well as urban areas such asTokyo, Osaka, Kyoto, Hyoqo and wakayama show high percentages rangingfrom 15-16%.
The preceding analysis of family types by region indicatesdiversified family structure. The population aging in Japan, migrationbetween Prefectures, and other complicated regional characteristics offamily types all interrelate. Further research on interrelationshipsamong these factors along with historical trends is needed.
4. Future Prospects
In terms of future trends, the rapid increase in households ofcouples only and single households is anticipated due to populationaging. It is projected that households consisting of couples only whoare 65 years and older will triple in the period of 35 years (1985-2020)and that households of single people who are 65 years and older willincrease to over 3.8 million in 2020 from the present 1.18 million.(Table 5)
The total number of households consisting of couples only and thatof single households are compared with respective households of memberswho are 65 years and older in Table 6. Aged couple households in 1985accounted for 30% of total couple household and is estimated to reach41% in 2000 and 52% in 2025. Likewise, aged single households in 1985accounted for approximately 15% of the total single households and isforecasted to reach 20% in 2000 and 28% in 2025.
Population aging will bring forth the aging of the family andhousehold structure as well. The Japanese population in the 21stcentury will face the increase in aged couples only and aged singlehouseholds. The growth of these two types of households may eventuallylead to the increase of third type, three-generation households (parentchild-grandchild), where the aged parents will be taken care by themarried child's family due to economic or healthy difficulties. Thiswill have a significant impact on household structure as a whole.
(Note) 1. "Population Projections for Japan - 1985-2085", ResearchSeries No. 244, dated February 1, 1987, Institute ofPopulation Problem.
- 65 -

Table 1 Major Indices of Future Population Aging in Japan
Year Population (1,000) Average annual increase Age structure Average Median Ratio of dependent Agingrate (%) (%) age age population ('t.) index
Total 0-14 15-64 65- Total 0-14 15-64 65- 0-14 15-64 65- Total a b
1985 121,049 26,042 82,534 12,472 0.52 -0.34 0.89 3.51 21.51 68.18 10.30 35.68 35.19 46.66 31.55 15.11 47.891990 124,225 23,132 86,274 14,819 0.53 -0.65 0.21 3.98 18.62 69.45 11.93 37.40 37.39 43.99 26.81 17.18 64.061995 127,565 22,387 87,168 18,009 0.56 1.05 -0.21 3.45 17.55 68.33 14.12 38.78 38.76 46.34 25.68 20.66 80.442000 131,192 23,591 86,263 21,338 0.46 1.30 -0.32 2.54 17.98 65.75 16.26 39.78 39.42 52.08 27.35 24.74 90.452005 134,247 25,164 84,888 24,195 0.23 0.11 -0.35 2.30 18.74 63.23 18.02 40.62 40.09 58.15 29.64 28.50 96.152010 135,823 25,301 83,418 27,104 0.02 -1.15 -0.48 2.48 18.63 61.42 19.96 41.52 41.06 62.82 30.33 32.49 107.132015 135,938 23,876 81,419 30,643 -0.09 -1.33 -0.08 0.79 17.56 59.89 22.54 42.39 42.47 66.96 29.32 37.64 128.342020 135,304 22,327 81,097 31,880 -0.10 -0.23 0.00 -0.26 16.50 59.94 23.56 43.03 43.60 66.84 27.53 39.31 142.792025 134,642 22,075 81,102 31,465 -0.09 0.83 -0.26 -0.30 16.40 60.24 23.37 43.29 43.67 66.02 27.22 38.80 142.542030 134,06'1 23,009 80,057 31,001 -0.14 0.77 -0.45 -0.04 17.16 59.71 23.12 43.22 42.84 67.46 28.74 38.72 134.74
0'0' 2035 133,133 23,914 78,278 30,941 -0.22 -0.10 -0.56 0.51 17.% 58.80 23.24 43.04 42.07 70.08 30.55 39.53 129.38
2040 131,646 23,798 76,110 31,738 -0.25 -0.85 -0.08 -0.22 18.08 57.81 24.11 42.93 42.08 72.97 31.27 41.70 133.372045 130,017 22,809 75,824 31,384 -0.21 -0.75 0.16 -0.71 17.54 58.32 24.14 42.95 42.56 71.47 30.08 41.39 137.592050 128,681 21,967 76,433 30,281 -0.15 0.05 0.09 -0.92 17.07 59.40 23.53 42.99 42.86 68.36 28.74 39.62 137.852055 127,704 22,017 76,770 28,917 -0.12 0.64 -0.17 -0.56 17.24 60.12 22.64 42.86 42.49 66.35 28.68 37.67 131.342060 126,947 22,728 76,107 2$,112 -0.12 0.47 -0.36 0.06 17.90 59.95 22.14 42.56 41.68 66.80 29.86 36.94 123.692065 126,215 23,266 74,751 28,199 -0.11 -0.15 -0.27 0.34 18.43 59.23 22.34 42.30 41.25 68.85 3L12 37.72 121.202070 125,518 23,095 73,746 28,677 -0.10 -0.55 0.00 0.01 18.40 58.75 22.85 42.24 41.42 70.20 3L32 38.89 124.172075 124,890 22,466 73,739 28,685 -0.08 -0.36 0.14 -0.43 17.99 59.04 22.97 42.32 41.80 69.37 30.47 38.90 127.682080 124,401 22,066 74,256 28,079 -0.05 0.19 0.06 -0.55 17.74 59.69 22.57 42.37 41.89 67.53 29.72 37.81 127.252085 124,066 22,277 74,473 27,316 17.66 60.03 22.02 42.26 41.51 66.59 29.91 36.68 122.62
Note: (a) Child population (b) Elderly population
Above figures are taken from "population Statistics #251," Institute of Pop..1lation Problems, March 15, 1988; page 67

Table 2 Improvement of Mortality Rate for the Aged
(Per 100,000 population)
Age group 1980 1985 1987 Decrease rate (. )
1985/1980 1987/198565-69 1865.8 1554.0 1410.5 16.7 9.270-74 3297.9 2717.5 2460.2 17 .6 9.575-79 5911.1 4980.5 4422.0 15.7 11. 280- 12968.6 11415.1 10693.4 12.0 6.3
Source: Ministry of Health and Welfare vital Statistics of populationin 1987.
- 67 -
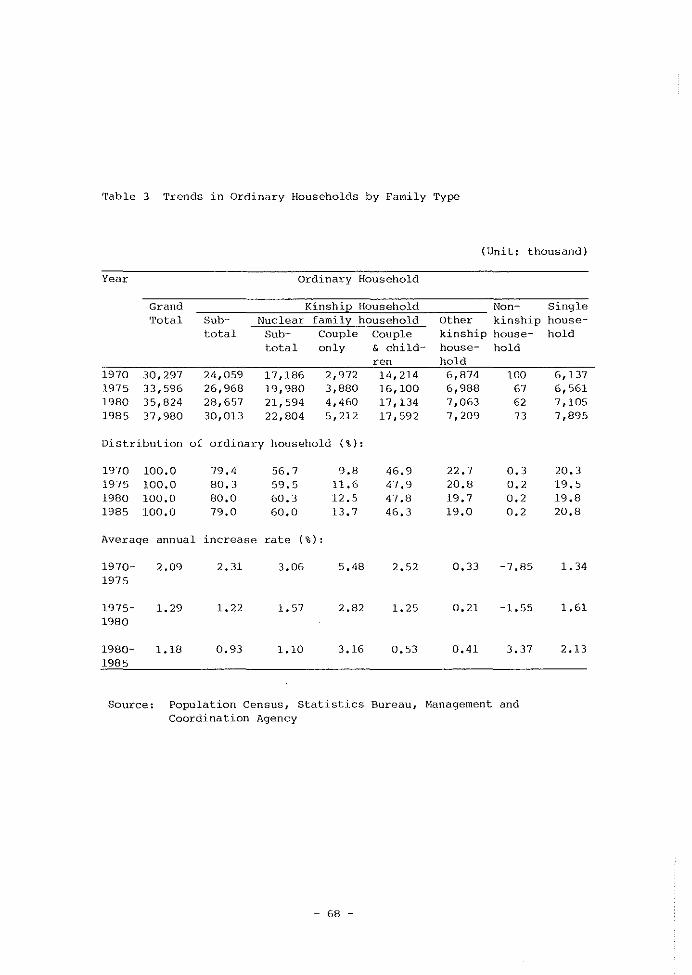
Table 3 Trends in Ordinary Households by Family Type
(Unit: thousand)
Year Ordinary Household
Grand Kinship Household Non SingleTotal Sub Nuclear family household Other kinship house-
total Sub- Couple Couple kinship house- holdtotal only & child- house- hold
ren hold1970 30,297 24,059 17,186 2,972 14,214 6,874 100 6,1371975 33,596 26,968 19,980 3,880 16,100 6,988 67 6,5611980 35,824 28,657 21,594 4,460 17,134 7,063 62 7,1051985 37,980 30,013 22,804 5,212 17,592 7,209 73 7,895
Distribution of ordinary household ( %) :
1970 100.0 79.4 56.7 9.8 46.9 22.7 0.3 20.31975 100.0 80.3 59.5 11.6 47.9 20.8 0.2 19.51980 100.0 80.0 60.3 12.5 47.8 19.7 0.2 19.81985 100.0 79.0 60.0 13.7 46.3 19.0 0.2 20.8
Average annual increase rate (%) :
1970- 2.09 2.31 3.06 5.48 2.52 0.33 -7.85 1.341975
1975- 1.29 1.22 1. 57 2.82 1.25 0.21 -1.55 1.611980
1980- 1.18 0.93 1.10 3.16 0.53 0.41 3.37 2.131985
Source: Population Census, Statistics Bureau, Management andCoordination Agency
- 68 -

'fable 4 Trends in Ordinary Households with a Family Head of 65 Yearsand Older
Year Total household Couple only Single Others1975 3,404 873 630 1,9011980 4,330 1,245 885 2,2001985 5,234 1,597 1,181 2,455
Distribution of each type household ( %) :
1975 100.0 25.6 18.5 55.91980 100.0 28.8 20.4 50.81985 100.0 30.5 22.6 46.9
Average annual increase rate (%) :
1975-1980 4.93 7.37 7.03 2.961980~1985 3.86 5.10 5.94 2.22
Source: population Census, Statistics Bureau, Management andCoordination Agency
Table 5 Projection of Ordinary Households with a Family Head of 65 Yearsand Older
Year198519901995200020052010201520202025
Total household5,2346,2607,8939,610
11,01912,31013,91614,38014,031
Couple only1,5971,9272,4833,1093,6264,0734,6174,7804,638
Single1,1811,4471,8732,3742,8203,2113,6543,8273,791
Others2,4562,8863,5374,1274,5735,0265,6445,7735,603
Source: Population Census, statistics Bureau, Nanaqement; andCoordination Agency
- 69 -

Table 6 Trends in Distribution of Households with Elderly l1embers byFamily Type
(Unit: thousand)
Family type 1985 2000 2025A. Total number of II couple only" 5,212 7,585 8,923
householdB. "Couple only" household (65 years 1,597 3,109 4,638
and older)
B +- A (%) 30.6 41.0 52.0
C. Total number of single household 7,895 11,478 13,638D. Single household (65 years and 1,161 2,374 3,791
older)
D + C (%) 14.7 20.7 27.8
Figure 1 Ratio of'Househnlds with Elderly Membets t 1985)
DlMore than 30%3 20·30%DLess than 20%
- 70 -
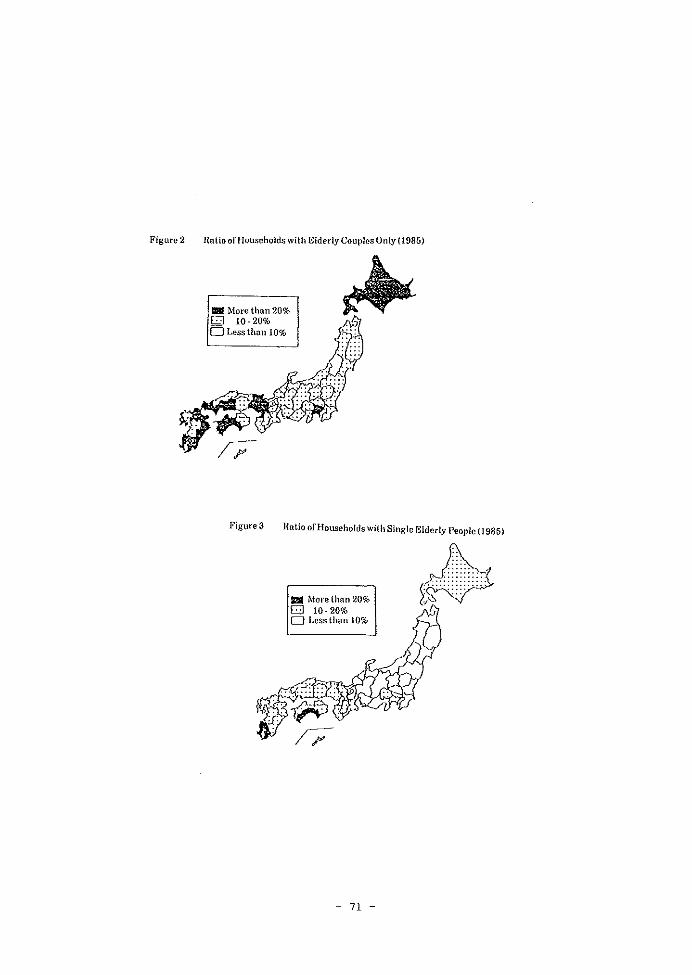
Figure 2 Ratio of Households with Elderly Couples Gnly (1985)
III More than 20%o 10-20%o Less thalllO%
~~ii;?
Figure 3 Ratio of Households with Single Elderly People (1985)
III More than 20%G 10-20%o Less than 10%
- 71 -
r\,-{J~~~~) ..(c;;.Z~;;~(./..";.. oj


Chapter 6
For-ecast of Future Households and Changes in JapaneseFamily Structure
MakotoAlo
Director
Department of Population Policy Studies
Institute of PopulaLion Problems
Ministry of Health and Welfare

Introduction
After the war, the structure of the Japanese family changedgreatly. Especially during the high economic growth period, nuclearfamily households and single households increased significantly, whilethree-generation households (parent-child-grandchild) graduallydeclined, along wi.tb the average number of family members per household.
Today it is said that the growth of the nuclear family household isstagnant, while the decline of three-generation households continues.On the other hand, since 1965, with the ongoing increase in the agingpopulation, aged single and aged couple households continue to q.rove;Furthermore, whi.Le the family formation which determines the size andstructure of a household was relatively stable during the high economicgrowth period, it has not been quite as steady since the middle of the1970s. The decline of the marriage rate, the rise in the proportionsingle, the rise in the average age at first marriages, and the declineof the birth rate have continued up until now.
Many are keen on this subject today both on a personal and publicbasis. It is necessary to grasp these changing trends in terms ofplanning the future administrative services for the public and indeveloping ideas for consumer needs. For this reason a study wasconducted based on four assumptions to be defined here in order toexamine the changing family structure and its formation and how thiswill affect the "family" in the 21st century. The assumptions are basedon the results of a survey conducted by the Institute of PopulationProblem in October 1987, on "Estimation of Future Households."
1. Method and Summary of Forecast
The subject of this forecast is (a) the number of generalhouseholds nat.Lonwide (headship by sex, age, and marital status) and (b)the number of nuclear-family households (couple and couple/child),kinship households, non-kinship households, and single households to thenumber of general households. The forecast period is for forty yearsstarting from October 1, 1985, to the year 2025. The study will beconducted quinquennially.
(1) Outline of the Forecast Method
In order to forecast the number of general households, the headshiprate method wes used. This is a method by which the headship rate ofthe population structure is estimated first, then multiplied by theestimated future population structure to get the number of households.Here population structure means population by sex, age, and maritalstatus.
- 75 ~
Procedures:
a) The future population estimate of the basic figures used inestimating the number of households, was extracted from the "EstimatedNed.i an of the Future Population of Japan" (December 1986 Institute ofPopulation Problems).
b) Estimated population ratios by sex and age (every five years ofage), and that by marital status respectively.
c) Multiplied the two numbers obtained in (b) above to get theestimated future population by sex and age, as well as by maritalstatus.
d) Estimated general household headship rates by sex and age, as wellas by marital status.
e) Nu.lt.i.p.Li.ed the two rates obtained in (d) above to get the estimatedgeneral headship by sex and age, as well as by marital status.
f) Estimated household composition ratios by headship age (every fiveyears of age) and by family type.
g) Multiplied the two ratios obtained in (f) above to get theestimated number of general household headship by age and family type.
(2) Estimate of Population by f1arital Status
In regard to the marital population, a chart showing marital statusstructure was drawn, based on the past population composition by sex,age, and marital status per birth cohort (every five years of age) andcurrent first-marriage rate, divorce rate, death rate, and deuterogamyrate by age. The future population by sex, age, and marital status wasforecast using this chart.
The result of the estimate, in regard to the mi.dd.Le-iadvanced agemale population, shows an increase in the unmarried and divorce ratiosand the decline of the married population and separation by death of theelderly. On the other hand, the mi.dd.l e-iadvenced age female populationshows a decline in separation by death, but an increase in the divorceas well as married ratios.
2. Assumptions Regarding Future Households
Headship rates by sex and age (every five years of age),marital status (hereafter referred to as headship rate) ofhouseholds was sought using the following four assumptions:
- 76 -
and byfuture

(1) Case 1
Assume Tokyo undergoes a typically average household movement inthe future. That is to say, assuming the nation's average headship ratereaches the same level as that of 1985 Tokyo in 20 years (2025) andthereafter by a half-level difference to 1985 level in 2025 and aquarter-level difference in 2045. A curved line was interpolate on therespective graphs (Graphs 1-6) based on actual and an estimate obtainedfrom subject assumption and headship rate from 1990 to 2025 wasdetermined.
(2) Case 2
Assume the average 1985 headship rate of the four major urbancommunities (hereafter referred to as the Big Four) - Tokyo, Kanagawa,Osaka and Hyogo - as a typically average household movement in thefuture. Like Case 1, assuming that the nation I s average headship ratewill reach the same level as that of the Big Four's 1985 average in2025, and thereafter by a half-level difference to 1985 Big Four levelin 2025 and a quarter-level difference in 2045, a curved line wasinterpolated on the respective graphs.
The above assumption is based on several facts. First of all, theratio of nuclear-family type households (nuclear family + singlehousehold) to general households, including the Big Four, is rising, butit is also important to note that the average headship rate of the BigFour in 1965 is close to the same of the nation's average in 1985. Thesame is true with the ratio of nuclear family households to kinshiphouseholds. Secondly, by comparing the same rate with the agedpopulation (65 years and older), the 1985 national average is close tothat of the 1970-1975 average figure of the Big Four. Thirdly, again asimilar phenomenon can be seen in the trend of the headship rate of the20-64-year-old population; that is the 1985 national average is close tothe same of the 1970-1975 average figure of the Big Four. 'I'he averagedata proves that the national growth of nucLeer-ifam.iLy-Lype householdswill reach the same level of the Big Four in a 15-20-year span. Inconsideration of this trend, a 20-year time lag was estimated for thisCase study.
(3) Case 3
In studying the headship rate by time series, a substantial changeis seen in the rate before and after 1975. The decline in the headshiprates of unmarried males and females, as well as middle-aged marriedmales, is especially noticeable. The stagnated population movement, dueto ION-economic growth, the beginning of the eldest son-daughter age,and the sluggish declining rate of three-generation households, accountsfor such trends. A curved line based on the past ten-year phenomenon(1975-1985) was applied and estimated the next 40-year headship rate onthe premise that the declining/rising headship rate will not vary more
- 77 -
than 10%.
(4) Case 4
Assume the headship rate is to be fixed from 1985 onwards.
(5) Estimate of Distribution Coefficient by Family Types
In this estimate, general household were divided into five familytypes, namely: (a) couple households (b) parent + child households, (c)kinship household, (d) non-kinship households, and (e) singlehouseholds. Types (a) through (c) make up the kinship households ofwhich (a) and (b) are the nuclear-family households. The compositionratio by family type of future general households was estimated based onthe four assumptions mentioned above: Case 1 and 2 assume Tokyo and theBig Four as typically average future models, Case 3 assumes the pastten-year trend will continue, and Case 4 assume, the 1985 trend is afixed standard.
3. Estimate Results
(1) Forecast of the Total Number of General Households
'I'he total number of households in Japan grew more rapidly thanexpected after the war and continues to qr-ow, with a record 38 millionhouseholds as of the October 1, 1985, survey. Estimated results,according to Case 2, show the total number of general households willreach 47 million in 2000 and 50 million in 2025 (refer to Graph 1).
Hereafter, the growth rate of total general households will exceedthat of the total population. The qrowt.h rate of the total populationin 2000 is 1.08% to 1985 and 1.11% in 2025, while the same of totalgeneral households is expected to be 1.24% in 2000 and 1.32% in 2025.
Case I show general households will total 50 million households in2000 and 56 million in 2025; according to Case 3 a slightly lower numberis estimated, with 44 million in 2000 and 45 million in 2025. The Case4 estimate is very similar to that of Case 3, as shown on the graph.
(2) Forecast of the Average Number of Persons per Household
The average number of persons per household in Japan declined afterthe war and in 1985 averaged 3.14 people per household. Studying thenumber worldwide, it parallels those of Canada and Australia, and isconsidered relatively high among the developed countries.
In the Case 2 estimate, the average number of persons per householdw.i Ll. continue to decline, with an estimated 2.75 persons per household
- 78 -

in 2000 and 2.62 persons in 2025, whi.ch is the present level of theunited States (see Figure 2). The overall rise in the headship rateforecast accounts for this decline.
Likewise, an increase in the headship rate is forecast in Case 1and the result is a Lower- number in persons per household - 2.60 personsin 2000, and 2.36 persons in 2025. On the other hand, in Case 3, wherea slight change in the headship rate is assumed, the decline is smalland is estimated at 2.92 persons in 2000 and 2.90 persons in 2025.
(3) Forecast of Single Households
As of 1985, number of single householders was 7.9 million, or 20.8%of Japan's total households. According to the Case 2 estimate thenumber of single households wa j L continue to grow, and, as indicated inFigure 3, w.i.Ll. total 11.5 million in 2000 and 13.6 million in 2025. Outof total households, which are expected expand by 1.32 in the next 40years, total single households w.iLl. reach 24.4% in 2000 and 26.4% in2025.
The Case 1 estimate shows the total number of single householdswill grow to 14 million in 2000 and 18.1 million in 2025, while the Case3 estimate forecasts 10.1 million in 2000 and 11.6 million in 2025.
(4) Forecast of Nuclear-Family Households
The number of nuclear-family households grew rapidly after the war,while the share they held among total households grew gradually.However, from 1980 to 1985 their growth was sluggish, with their ratioto total households declining slightly, to 22.8 million, or 60.0% ofJapan's total households as of the 1985 survey.
Case 2 estimates that nuclear-family households will number 30.7million in 2015, and thereafter will decline to 30.5 million in 2025(refer to Figure 4). Afterwards, the rate of growth of nuclear-familyhouseholds and total households will not show much variance.
Case 1 estimates constant growth in nuclear-family households wi.Ll.reach 31.9 million in 2025, but their ratio to total households willdrop to 57.3%. Case estimates that nuclear-family households will reach25.6 million in 2005 and thereafter decline to 24.3 million in 2025, or54.4% of total households.
(5) Forecast of General Households Made up of Householders 65 Yedrs ofAge and Older
Due to the growth of both the aging population and the nuclearfamily, general households with householders 65 yeas of age and older(hereafter referred to as aged households) have grown remarkably. Inthe ten-year period betvJeen 1975-1985, the total number of households
- 79 -
grew by 1.13 times whi.Le aged households qrew by 1.53 times.
Case 2 estimates that such households will grow steadily from 5.2million as of 1985 to 9.6 million in 2000, ultimately reaching 14.0million in 2025 (see Figure 5). The growth of aged households willsurpass that of total households. The growth rate in the total numberof households wi.Ll be 1.24 times larger in 2000 as compared to 1985, and1. 32 times larger in 2025 and the same for the same period for agedhouseholds wi.Ll be 1.84 times larger and 2.68 times larger respectively.Case 1 estimates the number of aged households will be 10.5 million in2000 and 16.7 million in 2025. Case 3 estimates 7.48 million in 2000and 12.4 million in 2025.
{6} Forecasts of Couple and Single Households with Households 65 Yearsof Age and Older
Couple and single households, with householders 65 years of age andolder {hereafter referred to as aged couple/single households} qrew 1.83times to 1.87 times larger in the ten years from 1975 to 1985.
Case 2 estimates a constant qr-owth , from 1.6 million to 1.2 millionhouseholds, respectively, as of 1985 which w.iLl. expand to 3.1 million(1.95 times larger) and 2.4 million (2.01 times larger) in 2000 and 4.6million (2.90 times larger) and 3.8 million (3.21 times larger) in 2025(refer to Figure 6).
Case 1 estimates 3.4 million and 2.6 million householdsrespectively in :WOO, and 5.4 million and 4.4 million in 2025. Case 3estimates 3.16 million and 2.02 million in 2000, and 4.26 million and3.32 million in 2025.
Conclusion
The "family" in Japan is in a period of transition today. Themovement of "family nucleation" is ebbing - with that of the nuclearfamily, the number of persons per household and single households seenas stagnant. Meanwhile, looking at population dynamics, the majorfactor in the composition of family, we see a decline in the marriagerate, a rise in the rate of single persons, remarkable decrease in thebirth rate and a high level in the divorce rate.
In regard to the household movement mentioned above, it should benoted that the Japanese family is basically different from its we s t e rncounterpart in that the parent-child relationship is always the core ofthe family - past, present, and f ut.ure . From this viewpoint, it isforecast that the number of households will grow accordingly inproportion to population expansion and the size of the household.
- 80 -

From the viewpoint of the population-movement situation, singlehouseholds will increase, due to the increase in single persons and thedecreasing number of children per couple, and Western-type couplerelationships will probably prevail. In consideration of this, thegrowth in households will exceed population growth; consequently thesize of households will be smaller. In this chapter, an emphasis wasplaced on the Case 2 estimate results (from the population movementviewpoint), whi.ch predict that the Japanese family 40 years from nowwill be Westernized; hO\'lever, this is looking at the long-term pictureand does not mean that the Japanese family will be suddenly wes tern i.zedin 10 to 15 years.
Finally, from the Case 3 estimate single households made up of agedpersons will increase by 2.8 times the figure reported in the survey 40years from no\'l, to 3.3 million households. Even though three-generationhouseholds will not change much with the aging population, the aged whowi.Ll. be living alone will increase and nuclear families expand evenmore. In consideration of this, as well as other results, the supportof the aged wi LL be a serious problem in the 21st century which willalso affect family structure. 'I'h i.s wi.Ll. become an unavoidable truth tobe faced in Japan's future.
- 81 -

Figure I Trends ill General Households
£0 (Unit: million)
"
; Cas.:2--__
: ~---- Case2: /~ Co,,3
~'~~i~ Case4
)0 '
/ :Actual results i Forecast, .
10
o:~::-::--:~~---c:~~~--n 40 45 50 ~ W 65 10 7S 80 8S 90 9S 100
(liBI) (1000) (lom
Year
Figure 2 Trends in Nnmhm-nf'Persons per Household
{Pet-sons)•. S
'.0
a.S
Case 4 Case 3
~-'-_....-.:.~
Case I.
Actual results i Forecast{ , ,2.S
J.O
,.OL~__--'--------~n 40 4S ~ 5S ~ U 10 lS 80 85 90 9S 100
{I'J8H (1000) (lom
Year
- 82 -

Figure 3 Trends ill Single Households
20(Unit: million)i!
IS
10
Actual results] Forecast,
as 90 9S 100(loB)
Ol'--~~~~~~---~~~--:-
)S 40 4S SO SS(lfR}) ss 10 (l~~)O)ao
Year
Figure 4 Trends in Nuclear Family Households
(Unit: million)JS
Case I
JO
2S
~"---Case2
~10
IS
/./ :
/Actual results 1Forecast( . \
10
O.~~----':-:'c-:",-:---~-:::-c:n (0 4S W ~ ~ " 10 lS 80 8S 90 9S 100
(UU) (000) (loa)
Year
- 83 -

Figure 5 Trends in General Households with Headship
(Unit: million) 65 Years of Age and Older:1O!
Case I
15 Actualresults! Forecast
10
..•.......
Case S
/ ., .
, .
Case2
.....Case 4
10 15 80 85( 10(0)
Year
se S5 100Hom
Figure B Trends in Couple nnd Single Households with Headship 65 Years of Age and Older
Uasa I
(Unit: million)
10
Actualresults
I! Forecast
.,.,.-.. '
Case 2
Case3
........Case4
10 15 800(00)
Year
- 84 -
se SS 100{lOIS}

Chapter 7
The Japanese Family: Public Opinion Survey Findings
MichioOzakiManager
Opinion Research Department
The Muinichi Newspapers


1. Introduction
The Population Problem Research Council of the Mainichi Newspapers(established in 1949) has conducted a "nationwide public-opinion surveyon family planning" every two years since 1950.
This series of surveys contains some questions that are repeated,unchanged, in each survey, in order to assess changes in .Japanese valuesregarding parent-child relationships. For example, "whet; do you thinkabout children taking care of their aged parents?"
Other questions dealing with current topics are also included.However, the main and on-going purpose of the surveys is to reveal cluesto future demographic trends by noting such factors as the number ofchildren Japanese mothers desire, preferred contraception practices, andthe incidence of induced abortions. 'I'h i.s purpose is underlined by thenews p a pe r headlines reporting the results of the past surveys:"Popu Lat.i.on control II (Ls t; survey conducted in 1950), "a.i r t h-cont.ro Lpractices" (2nd survey in 1959), "Bas the population changed? 20 yearsof family planning and the population revolution" (lOth survey in 1969),and "Reduced reproduction has planted its roots" (lSth survey in 1979),and so on.
Clearly, the emphasis of the surveys overlap with the purposes forthe establishment of the Research Counc i L, \'Jhen wor-Ld war II ended inJapan I s defeat, she was deprived of all her overseas colonies. Hersmall land mass, consisting of four major islands, wac overpopulatedwith thousands of repatriates and ex-soldiers. The continuing baby boomof that time accelerated further a rapid increase in popuLat.i.on , Acritical shortage of food and the growing population resulted in famine,and people lived on the verge of starvation. Increasing food productionand improving population control were the two most critical tasks facingthe defeated Japanese.
It may seem arrogant to say that the Research Council wasestablished to fulfill the public responsibility of the newspaper. Butthe problems of population and famine had such a serious impact at thattime that we felt there was a clear need to establish a council toaddress these problems.
However, Japan has achieved a successful "population transition"from being a "hi.qh birth and mor t.a Li.t.y'' society to a 1I1m '1 birth anddee t.h" society. Currently, the Low-bi.r t h trend has taken root.
Japan also has become a world economic power, as a result of thehigh-growth period of the "Golden 60s." She has even overcome two "oilcrises.!! Japan has grown to be a country that wields greatinternational influence and is among the leading nations of the woz Ld ,In the present "Set i.at.i.on Age, II the memories of famine in the post-war
- 87 -

era have faded away.
It is said that "the family is the single most important magnifierthrough which you can see a racial or social structure." ("ThePopulation Encyclopedia," ed.i ted by the Population Problem Council).The transition from Japan's pos t r-wa r society, wher-e people continuouslyfelt the pressure of the population explosion and the threat ofstarvation, to that of the present day, in which it has the secondlargest GNP (gross national product) in the wor-Ld; has brought aboutfundamental changes in the state of the Japanese family.
In the post-war period, under the strong leadership of the U.S., asthe leading member of the occupation army, the democratization ofnational policies was aggressively carried out in various fields.During this process, fundamental amendments of the Civil Law Act we r ealso carried out. These changes were enforced through legalinitiatives. But traditional Japanese familial values, supported by theextended family system of the pre-war period and the teachings ofConfucianism, have not faded away. There is much evidence that suchtraditional values still remain at the center of various aspects ofJapanese social life.
Nevertheless, economic policies aimed at achieving high economicq r o wt h have promoted an increase in the number of nuclear familiesthrough a large-scale population migration from rural to ur-ban areas.In addition, various other factors, such as income growth, highereducational levels, the improvement of the social position of women andtheir large-scale participation in the work force, have changed theJapanese people's way of thinking regarding the family, parent-child andhuaband-wi fe relationships, marriage, and the value of having children.
Such present-day phenomena as the increase in divorce, the'popularity of best sellers dealing w.i t.h single life, cohabitation, andthe emergence of OINKs (Double Income No Kids couples), are notcompatible with traditional familial values although it should beadmi t t.ed that these phenomena tend to be exaggerated. Moz-eover , theJapanese 'population is aging at a pace unmatched by any other country.It is evident that the problems found in any aging society, primarilythe nursing and care of the aged, are having a great impact on thefamily unit in Japan.
In the post-war era, the nwnber of children a family had and how tocontrol their numbers wer-e serious problems for the Japanese family.'1'he number' of children was a critical factor in a family's quality oflife, or even its survival. Little attention was paid to the dynamicsof family structure, such as parent-child and h u s b a n d-iw i f erelationships. In recent years, howeve r , as trend of the low births hasspread widely, the phenomenon of "fem i Ly disruption" is frequentlytalked about. what; is the role of the family in society? The nature ofthe family is being questioned now from various viewpoints.
- 88 -

To see a cross section of the changes in Japanese society throughthe window of the "fami.Ly" ••• this is why we selected liThe family" asthe theme for the 1988 survey. In particular, we had a keen interest inhow Asian and Confucian traditions and the values of the contract-basedsociety of the wes t. are combined in the Japanese family system. Thisarticle will report some major findings from the "nationwide publ i.copinion survey on families," which was conducted by the MainichiNewspapers' Opinion Research Department and conducted among 3,400respondents of 20 years of age or older in April 1988.
2. Single Life
The trends of the times have produced such best sellers as "SingleLife (1986)," written by Takeshi Ebisaka, and "Single Days (1983)," bySaburo Kawamoto. A long time ago, a girl who was "Lef t. on the shelf"was not considered a legitimate member of the society and even wastreated as a disabled person. Now we are living in quite a differentage.
In this year I s survey, the respondents were asked the fo Llowi.nqquestion: "In recent years, there are increasing numbers of young peoplewho live alone without getting married. what. do you think about such alife style?" The results shows that among male respondents, the numberof conS exceeded the number of pros: 42% of the male respondents"approved" of the single life style, whi.Le 54% expressed "disapproval. 1I
By comparison, the majority of the female respondents approved of thesingle life style: 54% approved, while 40% disapproved. Looked at moreclosely, 73% of the total female respondents in their 20s approved ofsingle life, of which 76% of those were unmarried. Among the malerespondents in their 30s, 53% answered that they "can approve" of thesingle life style. (Figure 2)
People of older generations take a more critical attitude.However, as shown by the fact that about half of the respondentsexpressed their approval, the bias against unmarried men and women isdiminishing.
Greater understanding and sympathy with a life style that is freeof the bonds of marriage is greatly affected by the economic andpsychological independence of women , and sexual liberation by parentalinfluence. At the same time, it should not be overlooked that marketsaimed at single people have been established and effectively supportsuch a life style. This is evidenced by the fact that there were morerespondents who approved of single life in urban areas, where there aremany convenience stores which are open 24 hours a day and various otherfood-service facilities. In more rural areas, fewer people expressedapproval of single life. It is hard to judge whi ch appeared first,unmarried people or businesses catering to the needs of unmarried
- 89 -

consumers. Nevertheless, it is evident that the growing number of youngpeople who enjoy their single lives and the businesses and industrieswhich target single people who form a substantial sector of our society,in what could be called a "convenient life style." By comparison, inrural areas where the shortage of marriageable girls is a seriousproblem, about 70' of the respondents expressed disapproval forremaining single.
However, general approval of the single life style, mainly amongyounger generations, does not necessarily reflect their ideas abouttheir own lives and marriages. In this survey, one question asked ofall the single respondents was "At wha t. age do you want to get married?"Answers included "I want to remain single all my life." More than 50%of the male single respondents (52%) and more than 40% of the femalerespondents answer-ed that they want to get married between 25-29 yearsof age. Those who answered "I want to remain single all my life"accounted for only 2% of the male respondents and 8% of the femalerespondents. This reveals the ambivalent feelings of those young peoplewho "want to enjoy single life, but at the same time want to getmarried." This also reflects the deep-rooted Asian philosophy that"everyone should get married once. II As regards the age at which theywant to get married, 15% of all the respondents (both male and female)answered "at any age," 12% answered "between 30 to 34," and 11% said"20-24. It There is a large proportional gap between these answers andthe answer- of "25-29," and this suggests that the idea of "marriageableage" remains clearly defined.
According to the survey conducted by the Hinistry of Health andweLfar-e , the average age for first marriages is 28.3 years of age formen and 25.6 years of age for women, an increase of 1.1 years and 0.7years, respectively, compared to the figures of 10 years ago. Strongersingle-life orientation suggests the development of a trend toward latermarriages. Japan is already seen as a "late-marriage" country in theworld. If the preferred marriage age is getting older, more coupleswill experience difficulty having children due to physical andpsychological conditions. Therefore, it is anticipated that the 10"'.'birth trend will accelerate.
It can be said that the life style of OINKs, who prefer to marryand enjoy life without having children, has developed along the sameline as this life style of unmarried people.
"DINKs voluntarily choose not to have any children and, furthermoremost of them are free from the generally accepted ideas of society, aswell as the compelling force of human relations. In many cases, theyare indifferent to traditional values. For instance, OINKs do not careto buy their own homes as others do, by saving money by having onlythree dishes a meal for the purpose of getting their won houses. If ittakes two and half hours to commute from their homes to their offices,they would rather rent an apartment near their offices. They care more
- 90 -

about traveling and other leisure activities in their desire lead anaffluent life style. If they can only rent a small apartment near theiroffices, they do not mind reducing the amount of furniture they have.For OINKs, having a comfortable living space is more important than anyguilt feelings over disposing of inconvenient." (Izumi Inui, "EditorialMeeting" 1988, 3)
Close attention must be paid to future changes in this new lifestyle which is challenging the accepted cycles of birth, growth,marriage, and child bearing. It is interesting to question whether thisis just a phase among the young, or if it is a powerful enough trend totake root as an enduring social force.
3. Marriage and Remarriage
Among the questions regarding marriage, the respondents we're asked"what; factors do (did) you think important when you get (got) married?"They were asked to answer- the level of significance for each of eightfactors, including educational background, occupation, income, age, etc.
The chart in Figure 3 illustrates the answers of the male andfemale respondents. Income and occupation are the only two factors forwhich the percentage combining "very important" and Himportant lt exceedsthe 50% line (indicated by the dotted line in the middle): 57% forincome and 54% for occupation. Living with or without parents rankedthird <39%). In contrast, inheritance from parents (12%), family status(19%), religion (23%) and education (28%) appeared much less important,compared to the above three factors.
This seems to suggest in general that such practical conditions asincome, occupation, and living wi t.h or without parents carry greaterweight when choosing a future husband or wife.
Expected inheritances and family status, which used to be the mostsignificant conditions in the decision to marry, are no longerconsidered important. As far as these research results are concerned,education and age now are considered less important as qualifications inchoosing future spouses.
Of the male respondents, deciding factors, in order of relativeimportance, are: (1) living with or without parents (38% combining both"very important" and 11 important"), (2) occupation (35%), then (3) ageand income (33% each), In the female respondents, (1) income (78%)comes first, (2) occupation (70%) comes next, and then (3) living wi t.hor without parents <39%). This v Lew of marriage reflects the dry andrational trend of the present society, especially in the case offemales.
- 91 -

Attitudes t.owa.rda remarriage were surveyed because opportunitiesfor remarriage are expected to increase as the aging of the populationadvances. It was expected that there should be a considerabledif fe r ence in views between those of the younger generations in their20s and 30s including singles, and older generations, including thosev...hose spouses have already passed away. To the question lIIf you surviveyour spouse after you are older, do you think you will remarry?", therespondents answered as follows:
I want to find a good person I can remarryI want to remarry if I can find somebodyI want to live by myself if I canI never want to remarryNo answers
4%33%40%20%
3%
Adding the active supporters of remarriage and those v...ho may getremarried according to the availability of prospective candidates, thenumber of respondents who showed posi tive atti tudes t.ov...ards remarriageaccounted for 34% of those surveyed. This is a relatively smallerpercentage than those who expressed completely negative attitudes, orsomewhat negative attitudes (60%). However, it should be noted that oneout of three of the respondents expressed their desire for a secondmarriage, although the degree of approval was somewhat diversified.Based on these results, one may be able to discern the retreat of oldfashioned moral views, as expressed by the saying, "Never marry twomen. n
Taken by age groups, younger generations were found to be morewilling to marry again. The older the generation is, the lower theratio of approval. In the age group of 60 years or older, the malerespondents have more favorable views about second marriages than thefemale respondents. By educational background, the higher the educationthe respondents have, the stronger the expressed desire for remarriage.
4. Divorce
In this survey, we took three approaches toward probing the issueof divorce in spite of the concern that questions regarding divorcemight skew other subjects of the survey. We included this issue becausedivorce is a problem we cannot ignore if we are to correctly assessfamily dynamics, especially the relationship between man and wife. Itwas also expected that such a survey will also aid comparative studiesbetween Japan and Western nations, as \...ell as other Asian countries.The three approaches included: (1) All respondents were asked theirattitudes towards the so-called "Break-up Principle," the ruling by theSupreme Court which admitted claims for divorce caused by a husband whowas responsible for the break-up of the marriage by conducting loveaffairs and other reasons under certain cond'i t i.one r (2) length of the
- 92 -

marriage and the reasons for divorce were asked of those who hadexperienced divorce; and (3) those who are currently married wer-e askedabout their latent desires for a divorce and their reasons for notgetting divorced.
To the question concerning the judgment by the Supreme Court, therespondents answered as follows:
I support the decision because this judgment has provided asolution to ending a mere shell of a marriage which only exists onthe census register. The court decision is in accord with thecurrent trends of the society ••. 38%
I do not agree with the decision because it will helps the spouse,male or female, \'lho is really responsible for the cause of divorce,and makes women's position more disadvantageous ••• 25%
I don't know ••• 32%
No answers and other an swer s , , , 5%
Although one-third of the respondents answered that they did notkno\'l, those who supported the court decision from a realistic viewpointexceeded the number of those who were opposed due to their moralpositions. The Supreme Court's decision per ee is based on the "ActualBreakage Principle," in itself a ground-breaking decision. In addition,the fact that the relative majority of the Japanese people supports thedecision reflects the realistic and practical attitude of the generalpublic toward divorce.
Nevertheless, there seems to be evidence of a "private thought andpublic stance," effect, as exhibited by the fact that we collected lessthan 100 effective answers out of some 2,400 samples to the questionconcerning the length of their marriage and reasons for divorce, when itwas asked of those who had experienced divorce. 'I'he small number ofresponses is incomplete and the sample too small for making effectiveanalysis. This fact alone suggests that the deep-rooted idea of divorceas a shameful deed survives and is still considered a taboo in Japanesesociety.
Those who are currently married were asked whe t.he r he or she hadever desired a divorce. If the respondent answered "yes," he or she wasasked the reasons. Figure 4 shows the results and indicates that oneout of every three married respondents have thought of divorce (adddnqboth "often" and "sometimes").
The Japanese situation is still far removed from that of the U.S.,where one out of every two couples get divorced. Howeve r , one out ofthree married men and women responded thaL they had wanted to get
- 93 -

divorced or still wanted to do so. This seems to reflect the trueconditions among Japanese couples. However, even those who have oftenthought of divorce rarely do get divorced.
Assuming that those who had thought of divorce had actually doneso, 2.4 million people (4%) of all the married people would have beendivorced in Japan. This figure is 7.7 times greater the actual numberof people who divorced in 1987.
A more important questionget divorced. In other words,are broken, there is a greaterdramatically in Japan as well.
is, however,if the tiespossibility
whythatthat
they did notbind couplesdivorce wi.Ll.
actuallytogetherincrease
As shown in Figure 4, "having ch i.Ldr-en" is the reason given mostoften, and surpasses all other reasons. The second most-cited reason isthat they can put up with it one \'lay or another, wi th the third beingthat the situation has improved. This means children are the biggestdeterrent to divorce. Besides affection for the children, Westernsociety generally puts a greater emphasis on independent relationsbetween man and wi.f e than in parent-child relations. By Asian ethicalstandards, on the other hand, strong ties with the children controlhusband-and-wife relations. Such strong relations between parents andchildren w.i.Ll. not change easily. Howeve r , it seems that divorce in themiddle and older age groups, after their children have grown up, willtend to increase in the future.
5. Preparations for the Aging Society
(1) Kitchen Work by Men
During the analysis sessions of the research results, many of theresearchers expressed their impressions that the PR for the agingsociety has been pretty effective. 'l'his effect is described in Figure5, which shows the survey results of opinions about men working in thekitchen in order to reveal the assignment of family roles by sex.
In response to the question "Do you think it is good for men to dok i, tchen \vork?," three out of four respondents answered positively. Asexpected, more than 80% of the female respondents welcomed men workingin the kitchen. On the other hand, among the male respondents, nearly70% (68%) expressed a willingness to do some kitchen wor-k, The reasonsfor their approval were also asked. The largest ratio of respondentssaid that, as the number of wo.rk i.nq women is increasing, it is naturaland necessary for men to provide assistance to their working wi.ve s ,<39%) Those who argued that it is better for men to cook their ownmeals in order to prepare themselves for old age accounted for 31%.This second reason exceeded the other reasons, including the denial of
- 94 -
traditional sexual roles per se {19%} and preparation for maintaining aresidence apart from the family in the future (6%). Those who wereopposed to kitchen work by men were also asked their reasons. Some 60%of these argued that, as men are working outside the home, they shouldnot have to work in the home. However, this answer accounts for only13% of the total respondents, including those who answered affirmativelyregarding men working in the kitchen. According to this survey, it isevident that the basic philosophy of the old family system - that a manworks outside and his wife stays at home to do housework - has alreadybegun to collapse, at least in the society's consciousness.
(2) Property Inheritance
Under the pre-war family system, the "eldest sonls right ofinheri t a nc e" was guaranteed in order to maintain the custom ofprimogeniture. In this survey, the respondents were asked who haspriority in inheriting the parents' property when they die. Those whoanswered "the eldest son" slightly exceeded 10% (12%), whi.Le one out offour answered that "a par-en t ' s property should be evenly shared by allsiblings" (25%). However, almost half of the respondents (48%) answeredthat "the family member who took care of the parent should have theright of inheritance, even though he or she might not be the eldest sonor daughter." Including the percentage of those who answered "anybodywho takes care of aged pa.rent.a" (11%), about 60% of the respondentsconsider taking care of aged parents as a pre-condi tion for inheritance.
These results clearly indicate changes in the characteristics ofproperty inheritance in Japanese society: from "the eldest-soninheritance" of the pre-war period which guaranteed the succession ofthe family, to the "equal allocation of properties" idea based on thenew Civil Law principles, and then to more practical and value-weightedideas of inheritance. It seems that such changes are a kind ofpsychological preparation among the Japanese people as they more towardbecoming part of an aging society.
(3) Living together with Parents
The results of the survey indicate that 53% of the respondentsregarded "Livl.nq wi th the spouse I s parents" as an important criterion inchoosing their future mate, as opposed to 39% of them who considered itimportant. (Figure 3) As a matter of fact, the problem of aging societyis deeply embedded in the issue of whet.her- or not "children should livewith their parents."
In the Western society, living arrangements in which aged coupleslive in a separate home but maintain contact with their children byvisiting each other or by the phone (i.e., Hliving separately withcontact") are common. Traditionally, 111iving together with contact" hasbeen a predominant living arrangement in Japan just as in South Korea,China, and Thailand. However, an examination of recent survey data on
- 95 -

married couples' living arrangements by age group indicates that Japanis somewher-e in-between in terms of the issue of living wi t.h par ent.s ,
The results show that the proportion of married couples living Vliththeir healthy parents VIas 5% for 20-29 year o.Lds , 30% for 30-39 yearo Ld s , 37% for 40-49 year o Lds , 23% for 50-59 year o Lda and 5% for 60-69year o l ds , Although 96% of young couples have their parents alive andweLl , they are less likely to live w.ith their parents. However, thenumber of people living with their parents sharply increases for 40-49year o Ld s who have parents reaching 70 years of age. It seems that apattern has emerged in Japan in which couples live separately when theyare young, and then live together wi th their parents when they becomeold.
An examination of the place of residence where these twogenerations live together indicates that the majority of the respondents(66%) moved into their parents' home. In this type of livingarrangement, sharing of household expenses is an issue of concern. Inmore than half of the cases the children pay most of household expenses.when those respondents who answer-ed ui'le pay more than our parents do"are included the percentage wi.Ll. ri se to 68%. This number implies thatpartly because of housing shortage, there often exists a kind of tacitagreement stating "parents provide housing and children pay the bills."
6. Conclusion: The Image and Hole of the Family
Due to the establishment of the new Constitution and the amendmentsof the Civil La\1S, the pre-war patriarchal family system was abolished.However, our consciousness of the old system and its traditions couldnot completely change all at once. In order to examine how deeply thetraditional v i.ew of family remains entrenched in our society, we usedthe following three issues as litmus tests: (1) the eldest son's duty tosupport his parents, (2) the succession of the family name, and (3) thebequeathing of the family tomb.
The results show that one out of three respondents answered thatthe eldest son is responsible for supporting his parents, while one outof four answered that the family name should be maintained, ifnecessary, by adoption. Furthermore, more than 80% (83%) of therespondents believed that the tombs of their ancestors should bemaintained carefully and bequeathed to descendants. 'rhe s e dataregarding the duty of supporting the parents and sustaining the familyname can be read in t.wo ways: the influence of the old system has beenweakened or rather, it still has a significant impact. 't h einterpretation of these figures depends on the v i ewpoi.nt. of each personwho uses the data. However, it is obvious that the idea of the eldestson's duty to support the parents and the sense of responsibility insustaining the family name remains much stronger in rural areas,
- 96 -

especially in the 'I'ohoku and Hokuriku districts, than in urban areas.By occupation, such attitudes are especially prominent among worke r s inthe agriculture, forestry, and fishery industries. This fact suggeststhe strong survival into the modern day of the old family system thatsupported the agricultural society before the birth of the industrialsociety. Horeover, such traditional senses of value based on the oldfamily system remain stronger among men than women, and the olderrespondents showed a higher ratio of approval for the old system. Thisis probably b e c au s e the old family system was n.o r e convenient andbeneficial to men than women ,
Many specialists suggest that the qr-owi.nq interest in family tombsshown by modern Japanese is not just because of their symbolic value inthe worship of ancestors, but also because of the population migrationfrom rural villages to cities associated with economic development andthe subsequent increase in the number of nuclear families. Today, tombsare valued, not as a chain to connect people with their ancestors in thepast, but as a monument in memory of closer generations, such as one I sparents or grandparents. Together with the social effects of increasingland prices in urban areas, there is a kind of "Tomb Boom" in Japan. Ifthis analysis is correct, the interest in tombs shown by modern Japanesehas stemmed from changes in the makeup of the fami ly.
As such, people's attitudes toward family and the family system areon a course of transition, while retaining some of the traditions of thepast. There are many analysts who see signs of a "family disruption" insuch phenomenon as the increasing pursuit of single life, the DINKs whoget married but do not have any children, and the increase in latermarriages and divorces already pointed out in this article.Nevertheless, based on the responses to the questions in our survey,people's awareness toward the family is largely emotional. As onequestion in the survey asked: "There are various roles the family plays.What do you think is the most important?" The respondents wererequested to choose the one or bJO most significant roles of the family.The respondents' selections concentrated on "a place of rest andcomfort" (56%) and "a place wher-e the family q r-ows by assisting eachother" (55%). Reflecting the Lower- birth and higher income trends,probably, " a place to bear and raise children" (10%) and "e place tosupport economic life" (26%) shared relatively Imler ratios. Does thissuggest that the more people become aware of the crisis in the familysystem, the more strongly they want to protect their homes?
Trying to explain families, gatherings of people, solely by figuresis as difficult as analyzing a man qualitatively. Judging frem ourexperience, however, even though each figure is neither totally correctnor reliable, you can abstract a certain trend or pattern among a groupof people from all the figures as a who Le , This is the fundamental ideabehind our research. when we estimate the voting behavior of qualifiedvoters in preliminary surveys for elections, and other surveysconcerning current topics, the books they read, or people's lives and
- 97 -

their problems, we are a Iways trying to find what is closest to thetruth by using the most scientific method available.
In this survey, an integral analysis of all questions will notnecessarily lead us to consistent results. Rather, the answers aremutually contradictory and even suggest the ambivalent state of theirminds. However, we believe that this fact per se indicates that thevarious aspects of human life are filled with contradictions. Inparticular, this survey clearly illustrates the fact that the Japanesepeople, who live between the Eastern and Western cultures, have combinedand mixed Asian and wes t.e rn senses of value in their 0\\'0 way. Theystrongly long for a free single life on the one hand, yet the Asian ideathat everybody should marry seems to remain strong. \'Ihile one out ofthree has considered divorce at least once, they put up with thesituation because of their children, As regards the problem of livingw.i.t.h or wi.t.hout. parents, the most frequently observed cases are those inwhich they live separately when the parents are young but together afterparents grow older, This is a middle way be tween "living together w.ithcontact" and "living separately with contact. II It can be said that allof these are good examples of the Japanese combination of Asian andWestern ways of living,
Compared with the absolute sense of value based on Christianity, ithas been criticized that such a Japanese mixture of ideas lacksoriginality. However, new merits can be discovered in such Japaneseways of thinking, which may smoothe the frictions between East and the\'lest that often are seen on spaceship Earth. Also, it is possible thatthe merits of the large family system, which is not based on theauthoritarian system of pr-e-war- era but which facilitates an active andlively exchange and cooperation among the generations, can beemphasized. Needless to say, such advantages should never be used as aconvenient excuse for the negligence of an administration whi.ch does nottake all possible measures for the improvement of the nation I s socialwelfare.
- 98 -

figure 1 Changes ill the Coucept.uf'vf'anrily" and Phrases in FashionRatio of nuclear fa miliesto the total numberofhouseholds\%} 50 (i0 61 62 63 (i4
1950 The average life span of the dnpanese womun extendedovorGu years.
"Domestic violence"
"Women's liberation"
"Divorce in the hrune''
"New family""Cohabitation age"
"Unmarried mothers"
"Test-tube babies""Husband living awayfrom futuily due to relocation
on the jnb"
No.nf'births
"The three statuasymuotsin home electric appliances"
"Marry a mnn With a houseand a car but without a mothr-r"
\\
\\\\\\\\)IIIIII
II
//
I
"We are no longer in the POSt-WIH era."
"OINKs""A husbnnd should be heattby nndnway from home"
"Nou.murviage"
Hluoeuum
"Large-sized trash"
"Crmucr vs. Cramer"
First white paperun women published
Tokyo OlympicsEnactment-of the Elderly Welfare Act
Beginning ofagillg soctctv
Post-war genorntinn exceededthe halfofthe total pnp nlntiunFirst negative economic growth after the warOil crtsis Secoudbabyboutn
Second largest GNP In the free wor-ld
Yen's appreciation: $l.00:;:: \'120-\'130The Equal Opportunity Employmnnt. ActWorld's longest average life spanof'the Jnpnnese men nnd women
Enactment of the amended Civil Law Act
1970
1955 "Hnmu" bu.siness boom
1985
1975
1980
19(,0 The Govenullent's lucome-dnublingIncentive Plan
1965
1945 End of the war
No. of births per year 1000 1200 1400 1600 1800 2000220024002600 rtu thousand)
Source: The Mainichi Newspaper, Morning Edition, May 4,1963
- 99 -

Ftgure 2 Opinion Polls: What..du you think nbuut yuung peopleli\'illg atone without gelling married?
Male
IJ
Female
"
!Figures'" %l
"
Affirmative
Total ~48
"
208
Negative
47~
15
Source: The Mainichi Newspaper, Morning Edition, MllY4,1988
- 100 -

Figure 3
(96)
Academicbackground
Occupation
Income
Age
Religion
Living withparents or not
Parent's assets
Family statusand background
Criteria for Selecting a Future Husband or Wife
Nutvary important No response
Not important atall
8
8
Source: The Mainichi Newspaper,Public Opinions Survey (A[lriI1988)
- 101 -
5096

Figure 4 Ifaye you ever thought ofdivorce?
Often Sometimes 3 Other or no response
Reason you did nolgeldivorced (no more than two choices)
Source: The Mainicbi Newspaper,Morning Editiou, May 4, 1988
P:;~;':~~;;;i;:'"~:~:'::' =;;WI32
Call110llllUke a living lM~W~JI3
Fordecency's sake tl}9
Parellts' grief lliMS
Other uuduu response [ill5
84
80
73
75
tFtgures e %)
Source: The Mninichi Newspaper, Morning Edition, May 4,1988
Figure 5 Wbut do you think about men's working in the kitchen?
To'nl IGood 7;"'''' find noo'O'pon"..
20, I ..30, ~I===========;:;;wD40, I
=====5U, L
- 102 -