population modelling of acartia spp. in a water column ... · sudden cooling of the western coastal...
TRANSCRIPT
Biogeosciences, 7, 2247–2259, 2010www.biogeosciences.net/7/2247/2010/doi:10.5194/bg-7-2247-2010© Author(s) 2010. CC Attribution 3.0 License.
Biogeosciences
Population modelling ofAcartia spp. in a water column ecosystemmodel for the South-Eastern Baltic Sea
L. Dzierzbicka-Glowacka1, I. M. Zmijewska2, S. Mudrak2, J. Jakacki1, and A. Lemieszek2
1Institute of Oceanology, Polish Academy of Sciences, Sopot, Poland2Institute of Oceanography, University of Gdansk, Gdynia, Poland
Received: 9 November 2009 – Published in Biogeosciences Discuss.: 5 January 2010Revised: 16 June 2010 – Accepted: 16 July 2010 – Published: 21 July 2010
Abstract. This paper describes numerical simulations ofthe seasonal dynamics ofAcartia spp. in the South-EasternBaltic Sea. The studies were carried out using a structuredzooplankton population model adapted toAcartia spp. Thepopulation model with state variables for eggs, nauplii, fivecopepodites stages and adults was coupled with a marineecosystem model. Four state variables for the carbon cy-cle represent the functional units of phytoplankton, pelagicdetritus, benthic detritus, and bulk zooplankton, which rep-resent all zooplankton other than the structured population.The annual cycle simulated for 2000 under realistic weatherand hydrographic conditions was studied with the coupledecosystem-zooplankton model applied to a water columnin the Gdansk Gulf (South-Eastern Baltic Sea). The verti-cal profiles of selected state variables were compared to thephysical forcing to study differences between bulk and struc-tured zooplankton biomass. The simulated population dy-namics ofAcartiaspp. and zooplankton as one biomass statevariable were compared with observations in the GdanskGulf. Simulated generation times are more affected by tem-perature than food conditions except during the spring phyto-plankton bloom. The numerical studies are a following stepin understanding how the population dynamics of a dominantspecies in the South-Eastern Baltic Sea interact with the en-vironment.
1 Introduction
The Baltic zooplankton is composed of microzooplank-ton, mezozooplankton and macroplankton with characteris-tic ichtyoplankton forms. The most important species in theGdansk Gulf are copepoda:Acartia spp. (i.e.A. bifilosa,
Correspondence to:L. Dzierzbicka-Glowacka([email protected])
A. longiremisand A. tonsa), Temora longicornis, Pseudo-calanus minutus elongatusand Centropages hamatusandcladocera:Bosmina coregoni maritimeandPodon polyphe-moides. Copepoda dominate numerically, while in the warmseason Cladocera are subdominants.P. m. elongatusoccursin great abundance in the Gdansk Deep, it becomes dominantbelow 30 m, and is almost the only representative of meso-zooplankton below the isohaline layer. In 1999 at the GdanskDeep, the predominant species werePseudocalanus minutuselongatusandAcartia longiremis(see Maritime Branch Ma-terials, IMGW 2000).
Copepods are generally considered the most importantcomponent in the marine pelagic ecosystem being grazerson phytoplankton and other protists, and prey for animalsat higher trophic levels (Mauchline, 1998). Feeding studiesof fish larvae by Last (1980) and Wiktor (1990) have shownthatPseudocalanus, Acartia andTemoranauplius and cope-podid stages are important components of the diet of numer-ous species of fish (sprat and herring) in the Baltic Sea andadjacent waters, i.e. the North Sea and also the English Chan-nel, as well as in Scotland, Nova Scotia and Canadian Arcticwaters. Our knowledge of their life parameters (e.g. develop-ment time, growth rate, and egg production) provides funda-mental information on the energy and matter transformationin pelagic food webs.
Most models take into account only nutrients and phy-toplankton (Fransz et al., 1991), probably because of thedifficulty in representing the complex behaviour that existsamong zooplankton species and also among the differentzooplankton development stages. Models having one com-partment for the whole zooplankton community are usefulonly for simulating ecosystem dynamics over the course ofa few days (Wroblewski and Richman, 1987) or for a sta-ble environment, but become meaningless for long periods ifthe environment fluctuates. Although field workers considerpopulation dynamics to be the minimum level of study, zoo-plankton population models are rarely included in ecosystem
Published by Copernicus Publications on behalf of the European Geosciences Union.
2248 L. Dzierzbicka-Glowacka et al.: Population modelling ofAcartiaspp.
models. A study of copepod population dynamics was per-formed, for instance, by Carlotii and several co-workers(Carlotti and Sciandra, 1989; Carlotti and Nival, 1992; Car-lotti and Radach, 1996; Carlotti and Wolf, 1998). This typeof study was carried out forPseudocalanusspp. by Fen-nel (2001), Dzierzbicka-Glowacka (2004, 2005a,b), Stegertet al. (2007), and Moll and Stegert (2007). A similar studyfor Acartiaspp. is presented in this paper.
The copepod model forAcartia spp. was calibrated byDzierzbicka-Glowacka et al. (2009a,b) under the environ-mental conditions typical of the Southern Baltic Sea. Theidea of establishing the combined effect of temperature andfood concentration on the development and growth of thenaupliar stage and copepodid stages (C1, C2, C3, C4, C5 ,C6) of Acartia spp. was presented. In this study the devel-opment time of copepodsAcartia spp. in the changing en-vironmental conditions in the Southern Baltic Sea also wasmodeled. It is important to investigate and identify the crit-ical factors in mathematical models of pelagic communitieswith a high-resolution zooplankton (herbivorous copepods)module as a top-down regulator which may play a signif-icant role in marine ecosystems. The aim of this paper isto run the population model within an ecosystem model tostudy the impact of seasonal variations of food and temper-ature on Acartia spp. biomass in the South-Eastern BalticSea.
2 Materials and methods
2.1 South-Eastern Baltic Sea water column
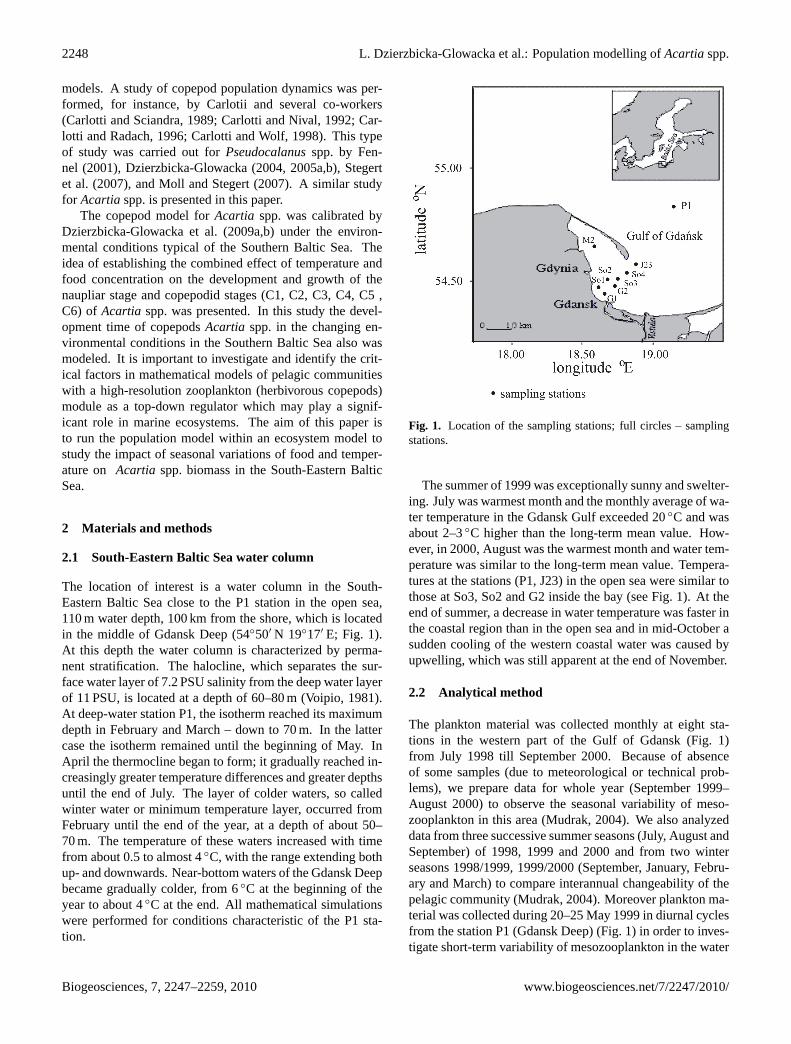
The location of interest is a water column in the South-Eastern Baltic Sea close to the P1 station in the open sea,110 m water depth, 100 km from the shore, which is locatedin the middle of Gdansk Deep (54◦50′ N 19◦17′ E; Fig. 1).At this depth the water column is characterized by perma-nent stratification. The halocline, which separates the sur-face water layer of 7.2 PSU salinity from the deep water layerof 11 PSU, is located at a depth of 60–80 m (Voipio, 1981).At deep-water station P1, the isotherm reached its maximumdepth in February and March – down to 70 m. In the lattercase the isotherm remained until the beginning of May. InApril the thermocline began to form; it gradually reached in-creasingly greater temperature differences and greater depthsuntil the end of July. The layer of colder waters, so calledwinter water or minimum temperature layer, occurred fromFebruary until the end of the year, at a depth of about 50–70 m. The temperature of these waters increased with timefrom about 0.5 to almost 4◦C, with the range extending bothup- and downwards. Near-bottom waters of the Gdansk Deepbecame gradually colder, from 6◦C at the beginning of theyear to about 4◦C at the end. All mathematical simulationswere performed for conditions characteristic of the P1 sta-tion.
Fig. 1. Location of the sampling stations; full circles – samplingstations.
The summer of 1999 was exceptionally sunny and swelter-ing. July was warmest month and the monthly average of wa-ter temperature in the Gdansk Gulf exceeded 20◦C and wasabout 2–3◦C higher than the long-term mean value. How-ever, in 2000, August was the warmest month and water tem-perature was similar to the long-term mean value. Tempera-tures at the stations (P1, J23) in the open sea were similar tothose at So3, So2 and G2 inside the bay (see Fig. 1). At theend of summer, a decrease in water temperature was faster inthe coastal region than in the open sea and in mid-October asudden cooling of the western coastal water was caused byupwelling, which was still apparent at the end of November.
2.2 Analytical method
The plankton material was collected monthly at eight sta-tions in the western part of the Gulf of Gdansk (Fig. 1)from July 1998 till September 2000. Because of absenceof some samples (due to meteorological or technical prob-lems), we prepare data for whole year (September 1999–August 2000) to observe the seasonal variability of meso-zooplankton in this area (Mudrak, 2004). We also analyzeddata from three successive summer seasons (July, August andSeptember) of 1998, 1999 and 2000 and from two winterseasons 1998/1999, 1999/2000 (September, January, Febru-ary and March) to compare interannual changeability of thepelagic community (Mudrak, 2004). Moreover plankton ma-terial was collected during 20–25 May 1999 in diurnal cyclesfrom the station P1 (Gdansk Deep) (Fig. 1) in order to inves-tigate short-term variability of mesozooplankton in the water
Biogeosciences, 7, 2247–2259, 2010 www.biogeosciences.net/7/2247/2010/
L. Dzierzbicka-Glowacka et al.: Population modelling ofAcartiaspp. 2249
column (Mudrak, 2004). Hauls were made using a closingCopenhagen net (50 cm diameter, 100 µm mesh size) fromthe water column, which was divided into several layers. Atshallow stations not exceeding 10 m in depth (M2, So1, So2,G1, G2), net hauls were done from the bottom to the seasurface, while at deeper stations 10m water layers were sam-pled separately (So3, So4, J23) (Fig. 1). At P1 station therewere layers: 10–0 m, 20–10 m, 30–20 m, 50–30 m, 70–50 m,95–70 m. The biological material collected was preservedwith 4% formaldehyde and every single sample was preparedand analyzed according to HELCOM standard methods inthe laboratory (www.helcom.fi). Abundance (in ind. m−3)and biomass (in mgw.w m−3) for selected species are givenby Mudrak (2004). Holoplanktonic organism were deter-mined to the genus or the species, Copepoda nauplii weredetermined to the species even though this was done rarelyin other studies. Due to considerable similarities betweenyoung forms within the genusAcartia, species differentia-tion was only performed on adult forms (Mudrak, 2004). ThespeciesAcartia bifilosawas recorded in all samples while thethermophilousA. tonsaappeared from May until Novemberand the psychrophilicA. longiremiswas encountered fromNovember until June (Mudrak andZmijewska 2007).
2.3 The ecosystem model structure
Recently, Dzierzbicka-Glowacka (2005b, 2006) developed aone-dimensional, ecosystem, upper layer model: 1-D CEMCoupled Ecosystem Model. This ecosystem model supple-mented with the population dynamics submodel for cope-pods and a component for pelagic detritus was used to studythe dynamics ofPseudocalasus minutus elongatusin theSouthern Baltic Sea (Dzierzbicka-Glowacka, 2005a,b). The1-D CEM model reduced to a 1-D POC Particulate Or-ganic Carbon Model with an equation for dead organic mat-ter (pelagic detritus) is presented in Dzierzbicka-Glowackaet al. (2010). The 1-D POC model is an ecosystem modelable to simulate biogeochemical processes in the physicalenvironment. The particulate organic carbon (POC) concen-tration was determined as the sum of phytoplankton and zoo-plankton biomasses and pelagic detritus concentrations.
The marine ecosystem model consists of a set of equa-tions. These are all of the general form, i.e. equations of thediffusion type including the functions of gains and losses,expressing change in the pelagic variables. The temporalchanges in the phytoplankton biomass are caused by primaryproduction, excretion, mortality, grazing by zooplankton andsinking. The zooplankton biomass is affected by ingestion,excretion, faecal production, mortality, and carnivorous graz-ing. The changes in the pelagic detritus concentration are de-termined by input of: dead phytoplankton and zooplankton,natural mortality of predators, faecal pellets, and sinks: sed-imentation, zooplankton grazing and decomposition. In thismodel nutrients are represented by two components: total in-organic nitrogen (NO−3 +NO−
2 +NH+
4 ) and phosphate (PO3−
4 ).
Silica is not included, as it is not a critical parameter for theprimary production, yet. In this paper bacteria were not ex-plicitly simulated. Their activity only appeared implicitly inthe parameterizations of the remineralization terms. Benthicdetritus accumulated by sinking out of the water column, itwas regenerated by bacterial action, and the resulting nutri-ents move upwards by turbulent diffusion. Bacteria will beconsidered in our next studies in which the dissolved organiccarbon DOC will be modeled.
The different sinks and sources for 1-D POC model are puttogether in Table 1 in Dzierzbicka-Glowacka et al. (2010),while the mathematical formulation for biogeochemical pro-cesses in the model is presented in Appendix A–C inDzierzbicka-Glowacka (2005b) and Dzierzbicka-Glowackaet al. (2010). Results obtained by Dzierzbicka-Glowackaet al. (2010) indicated that the 1-D POC model might be auseful tool for actual carbon cycle and pelagic variables in-vestigations and prediction of theirs changes. Calibration ofthe model and comparison of model results with measure-ments for temperature and the phytoplankton biomass andnutrients concentration in 1995–2000 are given in a paperDzierzbicka-Glowacka et al. (2010). With respect to all theparameters, the correlations of the observed regularities de-creased from the surface to the bottom. The correlationsfor the layers from the surface down to 50 m for NutrP andto 60 m for NutrN were quite good (>0.7) during late win-ter and autumn and down to 40 m (>0.6) in summer. Thesimulated phytoplankton biomass was compared with thoseand chlorophyll-a concentration measured in the 10 m layeras average value including carbon to chlorophyll a ratio inphytoplankton in the Gdansk Gulf in the 0–15 m layer af-ter Witek (1993). The simulation of phytoplankton was theweakest, despite a correlation coefficient of 0.61. The con-sistency of the calculated values with those measured in thevertical distribution was particularly good with regard to tem-perature. This results also testifies to the fact that the envi-ronmental conditions did not change radically and that theapplied various processes were regular. As well comparisonof measured and modeled POC (POC = Phyt + Zoop + De-trP) and pelagic variables Phyt and Zoop concentrations in2007 confirm appropriate functioning of the model (Fig. 2).
The flow field and water temperature used as the inputsin the ecosystem model, were reproduced by the 3-D hydro-dynamical model IOPAS-POPCICE, which is now runningfor the period 1960–2000 (see project ECOOP IP WP10).The model was forced using daily-averaged reanalysis andoperational atmospheric data (ERA-40) that were derivedfrom the European Centre for Medium-range Weather Fore-cast (ECMWF). The interpolated output of the hydrodynam-ical model was used as the input in the ecosystem+copepodmodel, since in the simulated area the dynamical character-istics remain almost unchanged in a horizontal plane in com-parison to vertical changes. Hence, the magnitudes of the lat-eral import/export are lower, and the above assumption canbe made.
www.biogeosciences.net/7/2247/2010/ Biogeosciences, 7, 2247–2259, 2010

2250 L. Dzierzbicka-Glowacka et al.: Population modelling ofAcartiaspp.
Table 1. Parameter values forAcartia spp. in the presented model. Source: (1) Ambler (1985), (2) Dzierzbicka-Glowacka et al. (2009), (3)Norrbin (1996), (4) Stegert et al. (2007), (5) in this paper and (6) see Fig. 3 in this paper.
Symbol Value Parameter Source
Foodo 10 mg C m−3 (N3–6,C1–2) minimal threshold food concentration (2)20 mg C m−3 (C3–6)
KFood 28 mg C m−3 (N3–N6) half-saturation constant (2)70 mg C m−3 (C1–C6)
K1 1.3 power coefficient (5)K2 4 (N3–6, C1–6) power coefficient (4)
6 (eggs-N2)na 0.7 assimilation efficiency (2)nf 0.3 egestion (2)ne 0.3 active metabolism (2)nw 0.2 d−1 (N1–N2) basic metabolism (5)
0.04 d−1 (N3–6, C1–6)pPhyt 0.6 preference phytoplankton (5)pZoop 0.15 preference microzooplankton (5)pDetr 0.25 preference small detritus (5)Q10 2.6 parameter ingestion (6)t1 0.239 temperature coefficient (6)t2 1.1 temperature coefficient (6)To 18◦C reference temperature (5)t3 0.6 slope factor (5)Wegg 0.0305 µg C egg−1 weight of egg (1)X 0.5 sex ratio (5)αe −8.701 temperature coefficient (3)a 1008 population specific constant (3)b −2.05 slope of the lineDe, (3)
Fig. 2. Modeled POC seasonality presented against background of Phyt, Zoop and DetrP and in situ measured POC concentrations in thesurface layer; solid line – POC, dashed line – phytoplankton, dash-dotted line – zooplankton, dotted line – pelagic detritus, full circles –data of POC from 2007, open circles – data of POC from 2008 (Dzierzbicka-Glowacka et al., 2010), open square – data of POC from 2001(Burska et al., 2005). The same scale for all the variables (mg C m−3).
2.4 Copepod model forAcartia spp.
The copepod model (Dzierzbicka-Glowacka, 2009a) in-cludes here the rate of transfer from stagei to the next (i+1).It consists of sixteen state variables with massesWi and
numbersZi for each of eight model stage, grouping stages to:the non feeding stages and eggs are represented by the stage– eggs−N2, following are the naupliar stages−N3−N6, thenfive copepodite stages – C1, C2, C3, C4, C5 and finally theadult stage – C6. For the each of eight model stage, mass
Biogeosciences, 7, 2247–2259, 2010 www.biogeosciences.net/7/2247/2010/
L. Dzierzbicka-Glowacka et al.: Population modelling ofAcartiaspp. 2251
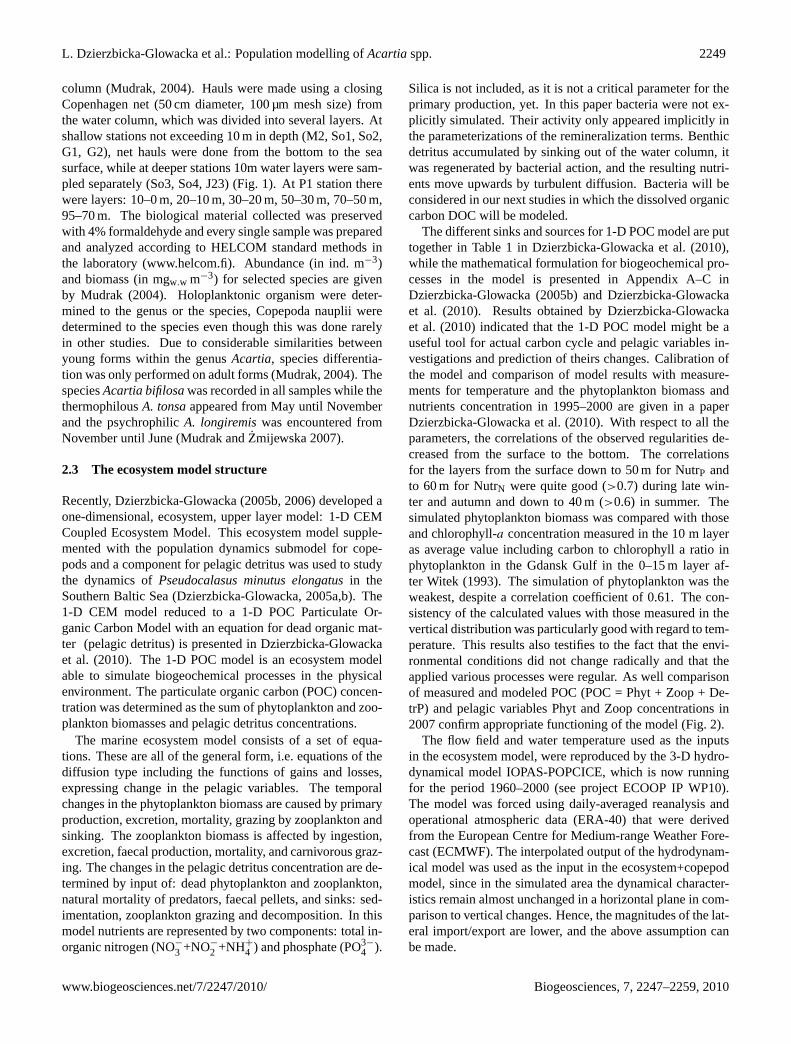
Fig. 3. Diagrams of three parameters (Food,T , W ) used in the copepod model for physiological process rates: ingestion rate depending onfood availability – solid line,(A), temperature – dashed, (A) – and weight – solid line,(B) – and transfer depending on weight – dashed, (B).
Wi and numberZi were calculated. The parameter valuesfor Acartiaspp. used in the presented model are given in Ta-ble 1.
The changes in the stage-specific mean biomass, whichis the algebraic sum of the products of the masses,Wi , andnumbers,Zi , of Acartia spp. for each of the model stages,are controlled by ingestion, egestion, metabolism, mortal-ity, predation and transfer. Both processes, ingestion andtransfer, depend on individual weights in successive stagesusing critical moulting masses,Cm, as described by Car-lotti and Sciandra (1989). In this paper, the critical moult-
ing mass is obtained by:Cm=
(Ck+
√2Cr
)/(1+
√2), as-
suming that the half saturation value is equalCh=2Cm−Cr
(Moll and Stegert, 2007), which ensures that ingestion is notreduced before transfer starts and that the functionf mi de-scribing the limitation of ingestion rate as molting weightis f mi(Ch)=0.5 (Fig. 3b). The transfer rate TRNi fromstagei to the nexti+1 is given by a sigmoidal function de-pending on theWi andCm with a reference weight,Cr , asa threshold mass, below which no transfer takes place andTRNi(Cm)=0.5 (Fig. 3b). This was not included in pre-vious versions of the model (Dzierzbicka-Glowacka, 2005;Dzierzbicka-Glowacka et al., 2009a). The referenceCr andcritical Ck masses are defined for each stage. The values ofCr andCk derived from literature data (Ciszewski and Witek,1977), were used for the weight-dependent function of inges-tion.
The ingestion rate INGi for specific developmental stagesis dependent firstly on the maximum ingestion rate, secondlyon available food Foodj (Fig. 3a), thirdly on temperatureT , following a constantQ10(2.6) law (Fig. 3a) applicableto the temperature range of 5–18◦C and fourthly on indi-vidual weight usingCm by the functionf mi (Fig. 3b). Q10was used to estimate thet2 coefficient; consequently, the pa-rametert2 had a value of 1.1. Coefficientt1 was calculatedso thatfte was equal to 1 at 15◦C and, therefore,t1 wasequal to 0.239. Coefficientst1 and t2 were identical for allstages. Additionally, a parabolic threshold functionft2 (withTo=18◦C, t3=0.6 andK1=1.3) realizes a decrease at highertemperatures as a result of physiological depression. So,growth follows an exponential curve up to the optimal tem-perature of∼18◦C and decreases for higher temperatures.Moulting to the next stage occurs when the critical moult-ing weight has been reached. During the molting process asmall proportion of the weight is lost (Carlotti and Wolf,1998). The food concentration Foodj (equalingpPhyt=60%of phytoplankton biomass,pZoop=15% of microzooplanktonbiomass andpDetrP=25% of pelagic detritus concentration)for each stagei in this study is included:
INGi=
3∑j=1
INGi,jf te f mi Wipj (1)
with INGi,j=fmax,i
{1−exp
(−(Foodj−Foodo)
kFood
)}and
∑pj = 1.
www.biogeosciences.net/7/2247/2010/ Biogeosciences, 7, 2247–2259, 2010

2252 L. Dzierzbicka-Glowacka et al.: Population modelling ofAcartiaspp.
The ingested food is portioned into growth and metaboliclosses of respiration, excretion, and egestion and addition-ally for the population in moulting and reproduction.
The assimilation rate of 70% is generally considered asrepresentative for copepods; hence the percentage of inges-tion egested as fecal material, which immediately enter thedetritus pool is 30%. Nauplii N1 and N2, which do not feed,are assumed to consume 20% of their weight per day for ba-sic metabolism. For nauplii from N3 to N6, copepodites andadults, were assigned a minimum respiration rate of 4% oftheir weight per day, to which was added a respiration rateequal to 30% of the ingestion rate for active metabolism (seeDzierzbicka-Glowacka et al., 2009a). The ingestion rate de-creases as weight reaches the critical weight of molt, becausegrowth is limited by the exoskeleton. Here, it is assumed thatthe ingestion in one stage follows a negative parabolic func-tion fmi when the weight exceeds the critical molting weightof stagei. Such a limitation does not occur in adults forwhich reproduction limits weight increase (see Carlotti andSciandra, 1989).
In this study, the hypothesis that the food-saturated rate ofproduction of egg matter is equivalent to the maximal spe-cific growth rate of copepods was used for calculation ofthe number of eggs produced by each female during one day(Sekiguchi et al., 1980; McLaren and Leonard, 1995). Theegg production rate was obtained as a function of growthrate, i.e. by multiplying exp GROWTH−1 by Wfemale/Wegg,assuming the growth rate to be that of the naupliar stage(Dzierzbicka-Glowacka et al., 2009b) and including herea transfer from adults to eggs. The number of juvenilesis defined on the assumption that eggs are released by theadult female throughout some time span,J . The periodof egg production for females ofAcartia bifilosa from theSouth-Eastern Baltic Sea varied with temperature from about14 days at 20◦C up to about 1 month at 7◦C (Ciszewskiand Witek, 1977). The efficiency term,X(=50%), was theconversion of biomass increase by the adult population intoeggs, including the wasted growth in males. In this studythe weight of an eggWeggwas taken to be 0.0305 µg C egg−1
for Acartia (Ambler, 1985). In the present study, the embry-onic durationDe is estimated after Norrbin (1996) forA. lon-giremiswhich is similar toDe of A. clausi(McLaren, 1978).Hence, the parameters of Belehradek’s function a andαe
were determined asa=1008 andαe=−8.701, wherea is apopulation specific constant, andαe is related to the normaltemperature regime for the species.
The mortality ofAcartia tonsain the southern Baltic Sea,ca. 7% in winter, 5% in autumn, and negligible in summerand spring (ca. 1%) was found by Schmidt et al. (1998).We use the above value forAcartia spp. Here the migrationprocess, only for copepodids in the vegetation season, wasdescribed in a day-night cycle (see Dzierzbicka-Głowacka,1994; Dzierzbicka-Głowacka et al., 2006) according to thedata given by Mudrak (2004).
In the Calanoida, dormancy occurs either in the embryonicstage (resting eggs) or in the copepodid stage. In coastal andfresh waters, dormancy is expressed by benthic resting eggs;in the deep oceanic waters many species over-winter as adormant copepodid stage (C4/5) that descends to the depths.Diapause as well as quiescence occurs, although the type ofdormancy has not been determined in all studies. The studyconducted by Katajisto (2006) in northern Baltic Sea, whereAcartia bifilosais the most abundant species of the pelagicmesozooplankton community, provides thatA. bifilosapro-duces only one type of egg – subitaneous eggs (Viitasalo,1992; Katajisto, 2006). In this paper, the dormancy of themodeled stages was not included in the calculations. Thesimulation starts with over-wintering adults.
3 Results
This model described above was used in the numerical simu-lations of the seasonal dynamics ofAcartiaspp. in the South-Eastern Baltic Sea (Gdansk Deep). The simulation was car-ried out for 2000, when observations from several monthsincluding winter values, were available. The correlation ofphysical forcing and biological response of the main ecosys-tem state variables is shown in Fig. 4.
Modeled temperature fields resulting from the physicalmodel (as the output) (Fig. 4a) were used for the biogeo-chemical processes calculation. The simulated temperaturebegan to increase at the end of March after day 88 andreached∼18◦C in August. At the same time (March), verti-cal diffusion decreased (Fig. 4b). This led to thermal stratifi-cation, causing a high gradient within 30–40 m for most statevariables. This stratification broke in September/October(day 273) with increasing vertical exchange. The destructionof the thermocline started in the late autumn. The depths ofthe upper layer, which were determined by the mixing inten-sity in the water column, showed that strong gradients in thenutrient concentration develop (Fig. 4c and d). The springbloom in 2000 was triggered in mid-March, most likely. Thebloom was initiated by the heating event and the extremelylow winds. The end of permanent overturning of the watercolumn in mid-March was the main cause that allowed thephytoplankton to start growing. The phytoplankton biomassreflected the nutrient availability, showing a strong nutrient-depleting spring bloom. The phytoplankton biomass was thehighest in the surface layers and reached maximum in mid-April (day 101) with a peak of 450 mg C m−3. Correlatedwith the phytoplankton bloom, nutrient depletion began andlimited plankton growth. The phytoplankton biomass waslow in summer (July and August) most likely as a result offaster depletion of nutrients and the phytoplankton grazingby zooplankton.
The development of zooplankton followed the develop-ment of both phytoplankton and pelagic detritus. The start ofthe zooplankton increase took place in May, about six weeks
Biogeosciences, 7, 2247–2259, 2010 www.biogeosciences.net/7/2247/2010/

L. Dzierzbicka-Glowacka et al.: Population modelling ofAcartiaspp. 2253
Fig. 4. Model results for physical and biological state variables.
after the beginning of the spring bloom. Biomass of zoo-plankton was characterized by the occurrence of two biomasspeaks in a year, the main one – at the turn of June and July(ca. 160 mg C m−3), and a smaller one, in August/September(ca. 100 mg C m−3), (Fig. 4f). Pelagic detritus (Fig. 4g)was abundant mainly when the phytoplankton concentra-tion exceeded 200 mg C m−3, and its maximum concentra-tion (ca. 590 mg C m−3) was in the near surface layers. De-tritus served as a zooplankton food source within the wholecolumn during spring and autumn and was sinking throughthe water column supplying material to the bottom detrituspool. In early autumn a certain increase in phytoplanktonbiomass took place. It might have been related to an increasein the concentration of nutrients resulting from deeper mix-ing of the water column. The vegetation season ended inDecember, when the biomass of phytoplankton dropped tothe starting level from January–February.
3.1 Acartia spp.
The vertical distributions shown in Fig. 5 demonstrate theannual biomass profiles for the selected state variables repre-sentingAcartiaspp. stage dynamics. The four state variablesfor eggs: N2, naupliar stage, N3–N6, copepodite stage, C1–C5 (including five copepodite stages together) and finally theadult stage, C6 are presented. First, eggs occurred at theend of March according to the phytoplankton spring bloomand increasing temperature.
Several generation peaks within the stage biomass vari-ables can be observed during the development period ofAcartia spp. throughout the year. The development assem-bles in the column water – mainly in the euphotic layer,where food – a mixture of phytoplankton, microzooplank-ton and small pelagic detritus – is available but also extendsbeyond the thermocline due to ingestion of dead organic mat-ter. The highest proportion of all the developmental stages isfound above the thermocline. In June a thermocline devel-oped at a depth of 30 m; the temperature in the surface layerincreased from 13◦C in June to 17◦C in July and 18.5◦Cin August, before cooling started. In November the thermo-cline was destroyed. During the same time, most of the to-tal biomass ofAcartia spp., as the sum over four state vari-ables, non-feeding, naupliar, copepodite and adult stages, isobserved.
Figure 6 presents the simulated stage biomasses,which are the algebraic sum of the products of the weights,Wi , and numbers,Zi , of each stage, as vertical mean val-ues and also the number ofAcartia spp. generations in theSouth-Eastern Baltic Sea (Gdansk Deep) is illustrated. Thesimulation starts with over wintering copepodtes C4 and C5and adults. The small maxima occurring in the distribution ofthe eggs−N2 stage are the result of a brood by successive fe-males causing their numbers to increase. The strong increasein an available food concentration – mainly of phytoplank-ton biomass, in the spring bloom begins egg production.
www.biogeosciences.net/7/2247/2010/ Biogeosciences, 7, 2247–2259, 2010

2254 L. Dzierzbicka-Glowacka et al.: Population modelling ofAcartiaspp.
Fig. 5. Simulated annual profiles of fourAcartiaspp. groups repre-senting: biomasses of eggs, nauplii, copepodites and adults and oftotal biomass ofAcartiaspp. (mg C m−3).
The hatching time at 4–6◦C is 20 d. Five complete dis-tinct generations, from eggs to adults, developed through-out the year, the first beginning in mid-March. The stageduration for the first generation is 65 d. The developmenttime of all the model stages was obtained by equation (4)given in Dzierzbicka-Glowacka at el. (2009a). During de-velopment of the second generation (51 d), surface tempera-ture increases from 8 to 15◦C causing accelerated growth,while a drop in food concentration causes a retard. Thethird generation starts in the first half of July (day 191) andtakes 47 d to complete as a result of the low food concen-tration (ca. 70 mg C m−3 in the upper 20 m layer) and thehigh surface temperature (15–18.5◦C). The total develop-ment time for the next generation is the shortest and as-sumes the value of 45 d similar to that of the third gener-ation. During the fourth generation, temperature is lower,
Fig. 6. SimulatedAcartia spp. generations(A) vertical meanbiomasses of eggs, nauplii, copepodites and adults (mg C m−3),(B) total biomass as vertical mean concentrations.
with a mean of ca 2.5◦C, than during the previous genera-tion but the food supply concentration is higher, mean valueof Food = 120 mg C m−3 in the 50 m water column. This isequal to the surface value as a result of vertical mixing. In-dividuals of the fifth generation (day 283) are produced inthe first half of October and reach adulthood at the end ofthe numerical simulation when there is a lack of food and adecrease in temperature.
The distribution shown in Fig. 6b presents the verticalmean total biomass, which is the algebraic sum of the verticalmean biomasses of all stages. The total biomass ofAcartiaspp. is characterized by one main biomass peak at the end ofAugust, and two smaller peaks. The first is slightly smaller,occurring during in the first half of July and the second smallpeak occurs in mid-October. The peak of biomass in Au-gust (ca. 15 mg C m−3) is mainly due to the high biomassof copepodites and adults of the third generation and thehigh egg production as a result of the very high numbers ofadults of the previous generation. The high reproduction isa result of high temperature at this time. The smaller peaksof biomass (ca. 11 mg C m−3 and 5 mg C m−3, respectively)also are mainly due to the high biomass of copepodites andadults of the 2nd and 4th generations and the high egg pro-duction of the 1st and 3rd generations, respectively. How-ever, the nauplii biomass of successive generations influencethe peaks of the total biomass at the beginning of the growth.
The phytoplankton peak in September–October permits anew growth period for the 4th generation and females of this
Biogeosciences, 7, 2247–2259, 2010 www.biogeosciences.net/7/2247/2010/

L. Dzierzbicka-Glowacka et al.: Population modelling ofAcartiaspp. 2255
Table 2. Total biomass ofAcartia spp. (in mgw.w. m−3) as monthly averages in the surface (0–20 m) layer in the summer season (July,August, September) in 1998, 1999 and 2000 from the eight stations in the Gdansk Gulf (see Mudrak, 2004).
Total biomass ofAcartiaspp. (in mgw.w. m−3)
station July 1998/1999/2000 August 1998/1999/2000 September 1998/1999/2000
J23 30/20/50 80/8/450 30/30/35So1 65/70/160 10/70/50 20/60/10So2 10/45/40 10/40/120 70/30/50So3 15/70/60 15/20/100 25/5/10So4 20/270/40 50/10/40 5/5/15G1 5/300/90 20/80/400 20/60/10G2 5/130/50 15/60/380 10/20/5M2 10/40/- 15/20/30 10/40/20
generation produce relatively small eggs to give a 5th gener-ation in October–November.
3.2 Experimental data
The structure of mezozooplankton in the Gdansk Gulf in2000 mainly consisted of four taxa: copepoda, cladocera , ro-tatoria and meroplankton; but in summer, biomass of clado-cera was three times as high as copepod biomass (Mudrak,2004). The predominant species wereAcartia bifilosadur-ing the entire year andBosmina coregoni maritimein sum-mer (Mudrak, 2004).
In the Gdansk Gulf, cladocera only occurs from May toAugust; the other three taxa of mezozooplankton: copepoda,rotatoria and meroplankton in 1999 and 2000 occurred indifferent proportions during the whole year. From Septem-ber to April, copepods dominated assuming 75–96% of totalbiomass mezozooplankton. In the period from May to Au-gust, the dominant groups were: in May – rotatoria (56%),June – cladocera (53%), July – copepoda (77%) and in Au-gust – cladocera (66%) (Mudrak, 2004). Proportional partic-ipation of copepoda in mezozooplankton, outside the domi-nant month, was not large – from 20% in June (min) to 32%in August (see Fig. 7). Copepoda accounted for 24% of totalmezozooplankton biomass in the entire area of Gdansk Gulf,and exceeded 50% in the region of Puck Lagoon (M2) only.
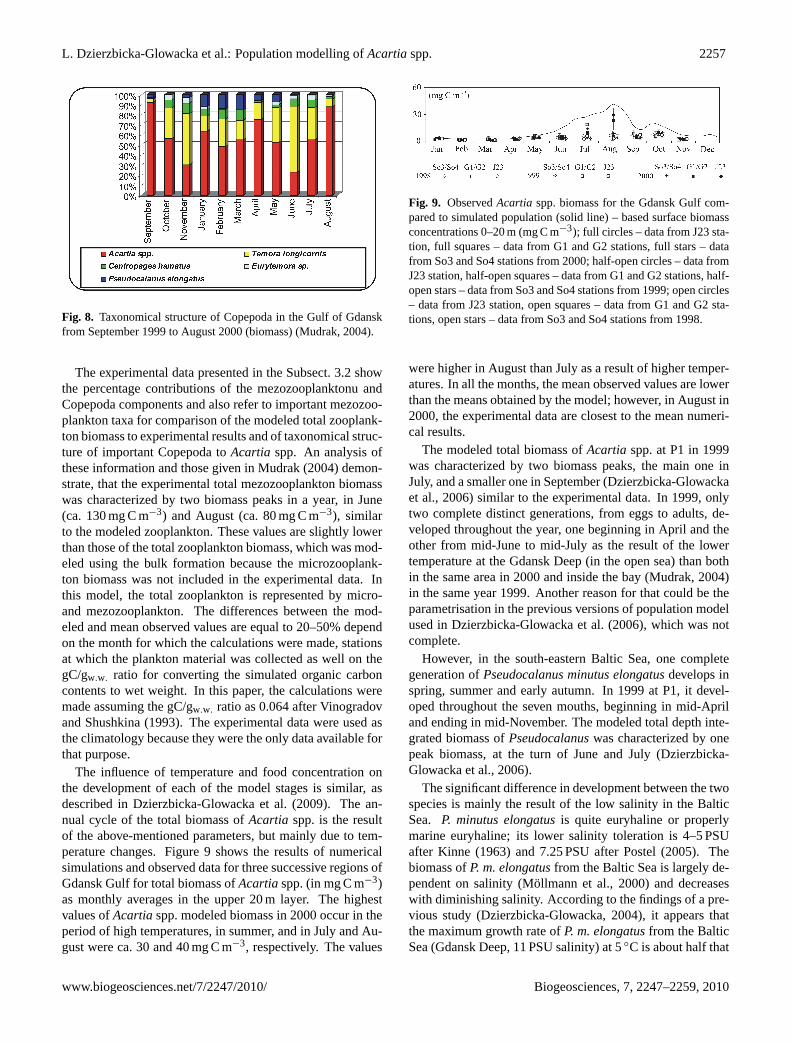
The dominant part on score of copepoda biomass with ex-ception in November and June playedAcartia spp. Theyreached a maximum (98%) in September and minimum(23%) in June. However, in months of copepoda dynamic de-velopment, this participation reduces overbalance ofTemoralongicornis (in November – 52% and June – 66%) and ina less degree,Centropages hamatus(11%) andEurytemorasp. (5%) in the coastal waters andPseudocalanus minutuselongatus(15%) in the deep regions of the Gdansk Gulf (seeFig. 8).
The monthly averages ofAcartiaspp. biomass (in mgw.w.
m−3) in the summer season (July, August, September) in
1998, 1999 and 2000 from the eight stations in the GdanskGulf (see Fig. 9) are given in Table 2. Analysis of the dataset and in Mudrak (2004) showed that mesozooplanktonconcentration varied characteristically, being dependent onabiotic indicators of the environment.
In 2000 at the all stations, biomass ofAcartia spp. wasrelatively high. The highest values occurred in Augustat J23 (ca. 450 mgw.w. m−3), G1 (ca. 400 mgw.w. m−3) andG2 (ca. 380 mgw.w. m−3), whereas in 1999, the highestbiomass occurred in July at the all stations, i.e. at So4(ca. 270 mgw.w. m−3) and G1 (ca. 300 mgw.w. m−3). How-ever, in 1998 at the all stations, biomass ofAcartia spp. wasrelatively low. The highest values were noted in July atSo1 (ca. 65 mgw.w. m−3), August at J23 (ca. 80 mgw.w. m−3)and in September at So2 (ca. 70 mgw.w. m−3) – see Fig. 9(biomass in mg C m−3). At the stagnation time, biomassof Acartia spp. was from 1–3 mgw.w m−3 in February, 3–5 mgw.w m−3 in March to 4–6 mgw.w m−3 in November.During May 1999 in the Gdansk Deep, the vertical dis-tributions of observed biomass in diurnal cycles were dif-ferent, i.e. 0.02–1 mg C m−3 in the upper layer and 0.03–0.55 mg C m−3 in the lower layer forAcartia spp. The av-erage value of the biomass in the whole column water at thistime was 0.395 mg C m−3 for Acartiaspp.
4 Discussion
The simulation provided the development of four zooplank-ton model stages (Fig. 6) and additionally the total biomassas summed over all stages. The total biomass ofAcartiaspp. is compared to the total zooplankton biomass, whichwas modeled using the bulk formation. The simulationsshow the general variations in investigated populations withtime (Fig. 5). The results show significant changes in phy-toplankton biomass distribution, which took place in an areawhere there was a considerable increase in primary produc-tion. During the spring bloom, there is a substantial growth
www.biogeosciences.net/7/2247/2010/ Biogeosciences, 7, 2247–2259, 2010

2256 L. Dzierzbicka-Glowacka et al.: Population modelling ofAcartiaspp.
Fig. 7. Seasonal variability of biomass structure of zooplankton in the Gulf of Gdansk from September 1999 to August 2000 (blue – monthsof stagnancy period) (Mudrak, 2004).
in phytoplankton biomass and then in pelagic detritus con-centration, which thereafter fall as a result of the increase inzooplankton (Fig. 4f) andAcartia spp. (Fig. 5) biomasses.The growth of the total zooplankton biomass mostly dependon food. Generally speaking, the numbers of zooplanktonin the upper layer are the highest, when the algal biomassand pelagic detritus concentrations there are large. However,the later increase inAcartia spp. is caused by the increase in
biomass of successive stages. This situation led to the sub-stantial growth in the total biomass ofAcartia spp., which isthe algebraic sum of the products of weightsWi and num-bersZi for modeled stages (ZAcartia=
∑i=stages
WiZi). These
small maxima occurring in the distributionZAcartia are theresult mainly of egg production by each adult causing theirnumbersZi to increase.
Biogeosciences, 7, 2247–2259, 2010 www.biogeosciences.net/7/2247/2010/
L. Dzierzbicka-Glowacka et al.: Population modelling ofAcartiaspp. 2257
Fig. 8. Taxonomical structure of Copepoda in the Gulf of Gdanskfrom September 1999 to August 2000 (biomass) (Mudrak, 2004).
The experimental data presented in the Subsect. 3.2 showthe percentage contributions of the mezozooplanktonu andCopepoda components and also refer to important mezozoo-plankton taxa for comparison of the modeled total zooplank-ton biomass to experimental results and of taxonomical struc-ture of important Copepoda toAcartia spp. An analysis ofthese information and those given in Mudrak (2004) demon-strate, that the experimental total mezozooplankton biomasswas characterized by two biomass peaks in a year, in June(ca. 130 mg C m−3) and August (ca. 80 mg C m−3), similarto the modeled zooplankton. These values are slightly lowerthan those of the total zooplankton biomass, which was mod-eled using the bulk formation because the microzooplank-ton biomass was not included in the experimental data. Inthis model, the total zooplankton is represented by micro-and mezozooplankton. The differences between the mod-eled and mean observed values are equal to 20–50% dependon the month for which the calculations were made, stationsat which the plankton material was collected as well on thegC/gw.w. ratio for converting the simulated organic carboncontents to wet weight. In this paper, the calculations weremade assuming the gC/gw.w. ratio as 0.064 after Vinogradovand Shushkina (1993). The experimental data were used asthe climatology because they were the only data available forthat purpose.
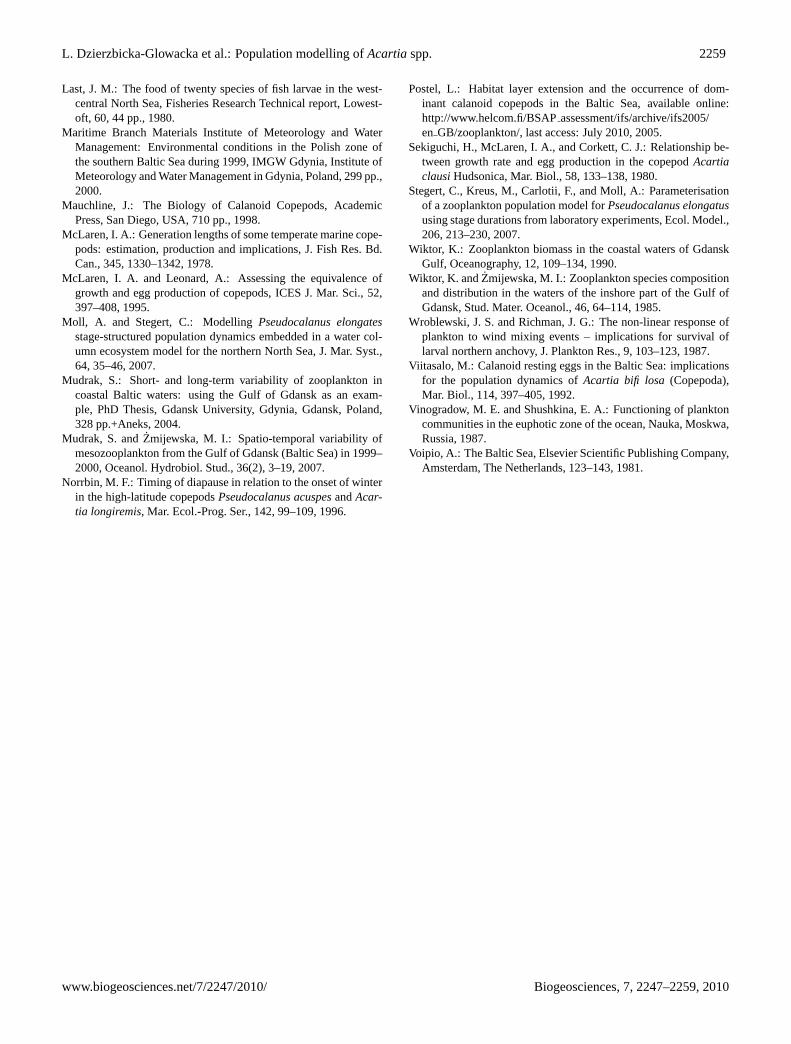
The influence of temperature and food concentration onthe development of each of the model stages is similar, asdescribed in Dzierzbicka-Glowacka et al. (2009). The an-nual cycle of the total biomass ofAcartia spp. is the resultof the above-mentioned parameters, but mainly due to tem-perature changes. Figure 9 shows the results of numericalsimulations and observed data for three successive regions ofGdansk Gulf for total biomass ofAcartiaspp. (in mg C m−3)as monthly averages in the upper 20 m layer. The highestvalues ofAcartiaspp. modeled biomass in 2000 occur in theperiod of high temperatures, in summer, and in July and Au-gust were ca. 30 and 40 mg C m−3, respectively. The values
Fig. 9. ObservedAcartia spp. biomass for the Gdansk Gulf com-pared to simulated population (solid line) – based surface biomassconcentrations 0–20 m (mg C m−3); full circles – data from J23 sta-tion, full squares – data from G1 and G2 stations, full stars – datafrom So3 and So4 stations from 2000; half-open circles – data fromJ23 station, half-open squares – data from G1 and G2 stations, half-open stars – data from So3 and So4 stations from 1999; open circles– data from J23 station, open squares – data from G1 and G2 sta-tions, open stars – data from So3 and So4 stations from 1998.
were higher in August than July as a result of higher temper-atures. In all the months, the mean observed values are lowerthan the means obtained by the model; however, in August in2000, the experimental data are closest to the mean numeri-cal results.
The modeled total biomass ofAcartia spp. at P1 in 1999was characterized by two biomass peaks, the main one inJuly, and a smaller one in September (Dzierzbicka-Glowackaet al., 2006) similar to the experimental data. In 1999, onlytwo complete distinct generations, from eggs to adults, de-veloped throughout the year, one beginning in April and theother from mid-June to mid-July as the result of the lowertemperature at the Gdansk Deep (in the open sea) than bothin the same area in 2000 and inside the bay (Mudrak, 2004)in the same year 1999. Another reason for that could be theparametrisation in the previous versions of population modelused in Dzierzbicka-Glowacka et al. (2006), which was notcomplete.
However, in the south-eastern Baltic Sea, one completegeneration ofPseudocalanus minutus elongatusdevelops inspring, summer and early autumn. In 1999 at P1, it devel-oped throughout the seven mouths, beginning in mid-Apriland ending in mid-November. The modeled total depth inte-grated biomass ofPseudocalanuswas characterized by onepeak biomass, at the turn of June and July (Dzierzbicka-Glowacka et al., 2006).
The significant difference in development between the twospecies is mainly the result of the low salinity in the BalticSea. P. minutus elongatusis quite euryhaline or properlymarine euryhaline; its lower salinity toleration is 4–5 PSUafter Kinne (1963) and 7.25 PSU after Postel (2005). Thebiomass ofP. m. elongatusfrom the Baltic Sea is largely de-pendent on salinity (Mollmann et al., 2000) and decreaseswith diminishing salinity. According to the findings of a pre-vious study (Dzierzbicka-Glowacka, 2004), it appears thatthe maximum growth rate ofP. m. elongatusfrom the BalticSea (Gdansk Deep, 11 PSU salinity) at 5◦C is about half that
www.biogeosciences.net/7/2247/2010/ Biogeosciences, 7, 2247–2259, 2010

2258 L. Dzierzbicka-Glowacka et al.: Population modelling ofAcartiaspp.
of P. elongatusfrom the North Sea for small copepods, but isabout three times lower for the largest ones.
Shallow coastal waters, particularly in sheltered bays andnear river mouths, fertilized by the influence of rivers andorganic pollutants entering the sea, are the areas richest inzooplankton in the Southern Baltic Sea (Chojnacki and An-tonczak, 2008). The water temperature is lower in the coastalregion than in the open sea when upwelling appears. In sucha case, higher temperature and salinity of water at the GdanskDeep (in the open sea) are more favourable conditions for de-velopment of copepods, mainly ofPseudocalanus m. elonga-tus. Hence, the Gdansk Gulf area partly is representative ofthe south-eastern Baltic Sea but contrary to the Gdansk Deep,in context of the ecological shifts already documented in thearea except euryhaline species, which development is largelydependent on salinity asPseudocalanus m. elongatus.
The next step in our modeling work is to run the popula-tion model within an ecosystem model to study the impactof seasonal variations of food and temperature onT. longi-cornisbiomass in the South-Eastern Baltic Sea. Most of thecoefficients used in the model will be taken from the liter-ature, containing values from various published studies andparameters derived for similar species. This approach is pos-sible, because the species is not much sensitive to the differ-ences in the salinity, similarly as some speciesAcartia butcontrary toPseudocalanus minutus elongatus. Developmentand growth ofTemora longicornisusing the duration of eachof the model stages was calculated in another study (whichhas been submitted as a separate paper), as a function of bothfood concentration from 25 mg C m−3 to excess and temper-ature in the 5–20◦C range from laboratory experiments afterKlein Breteler and Gonzalez (Klein Breteler and Gonzalez,1986).
Also, a following step in our modeling work is to addinto the model several species of calanoid copepods (Pseu-docalanus m. elongatus, Acartia spp. andTemora longi-cornis) presenting contrasted life-cycle strategies and com-pare their respective population dynamics, and the benefits(and/or drawbacks) of trading the bulk zooplankton for amore detailed and complex zooplankton community (e.g. Jiet al., 2009). As well, we intend to study the impact of cli-mate changes on the development of the investigated cope-pods in the South-Eastern Baltic Sea through the impact ofseasonal variations of food, temperature and salinity withinthe next few decades. This has not yet been investigated andthe response of the marine ecosystem is unknown. The nu-merical models are actually one of the most efficient way tointegrate and summarize large amount of observation datacollected through much money, effort and patience, as wellas generating new knowledge about the subject of the study.
Acknowledgements.This research was carried out in supportof a grant of the Polish State Committee of Scientific Research(No NN306 353239).
Edited by: F. Chai
References
Ambler, J. W.: Seasonal factors affecting egg production and viabil-ity of eggs ofAcartia tonsaDana, from East Lagoon, Galveston,Texas, Estuar. Coast. Shelf S., 20, 743–760, 1985.
Carlotti, F. and Sciandra, A.: Population dynamics model ofEuter-pina acutifrons(Copepoda: Harpacticoida) couplong individualgrowth and larval development, Mar. Ecol.-Prog. Ser., 56, 225–242, 1989.
Carlotti, F. and Nival, P.: Model of copepod growth and develop-ment: moulting and mortality in relation to physiological pro-cesses during an individual moult cycle, Mar. Ecol.-Prog. Ser.,84, 219–233, 1992.
Carlotti, F. and Radach, G.: Seasonal dynamics of phytoplanktonandCalanus finmarchicusin the North Sea as revealed by a cou-pled one-dimensional model, Limnol. Oceanogr., 41(3), 522–539, 1996.
Carlotti, F. and Wolf, K. U.: A Lagrangian ensemble model ofCalanus finmarchicuscoupled with a 1-D ecosystem model,Fish. Oceanogr., 7(3/4), 191–204, 1998.
Chojnacki, J. C. and Antonczak, E.: Seasonal changes in the ner-itic zone mezozooplankton of Pomeranian Bay in 2000, avail-able online:http://www.ejpau.media.pl/volume11/issue4/art-29.html, last access: July 2010, EJPAU 11(4), 29, 2008.
Ciszewski, P. and Witek, Z.: Production of older stages of copepodsAcartia bifilosaGiesb. andPseudocalanus elongatusBoeck inGdansk Bay, Pol. Arch. Hydrobiol., 24, 449–459, 1977.
Dzierzbicka-Glowacka, L.: Growth and development of copepoditestages ofPseudocalanusspp., J. Plankton Res., 26, 49–60,2004a.
Dzierzbicka-Glowacka, L.: A numerical investigation of phyto-plankton andPseudocalanus elongatusdynamics in the springbloom time in the Gdansk Gulf, J. Mar. Syst., 53, 19–36, 2005a.
Dzierzbicka-Glowacka, L.: Modelling the seasonal dynamics ofmarine plankton in southern Baltic Sea, Part 1: A CoupledEcosystem Model, Oceanologia, 47(4), 591–619, 2005b.
Dzierzbicka-Glowacka, L.: Modelling the seasonal dynamics ofmarine plankton in the southern Baltic Sea, Part 2: Numericalsimulations, Oceanologia, 48(1), 41–71, 2006.
Dzierzbicka-Glowacka, L., Lemieszek, A., andZmijewska, I. M.:Parameterization of a population model forAcartia spp. in thesouthern Baltic Sea, Part 1: Development time, Oceanologia,51(2), 165–184, 2009a.
Dzierzbicka-Glowacka, L., Lemieszek, A., andZmijewska, I. M.:Parameterization of a population model forAcartia spp. in thesouthern Baltic Sea, Part 2: Egg production, Oceanologia, 51(2),185–201, 2009b.
Dzierzbicka-Glowacka, L., Kulinski K., Maciejewska, A. andPempkowiak J.: Particulate Organic carbon in the southern BalicSea, Numerical simulations and experimental data, Oceanologia,submitted, 2010.
Fennel, W.: Modeling of copepods with links to circulation model,J. Plankton Res., 23, 1217–1232, 2001.
Fransz, H. G., Colebrook, J. M., Gamble, J. C., and Krause, M.:The zooplankton of the North Sea, Neth. J. Sea Res., 28(1/2),1–52, 1991.
Katajisto, T.: Benthic resting eggs in the life cycles of calanoidcopepods in the northern Baltic Sea, Walter and Andree de Not-tbeck Foundation Scientific Rep. No. 29, Helsinki, Finland, 1–46, 2006.
Biogeosciences, 7, 2247–2259, 2010 www.biogeosciences.net/7/2247/2010/
L. Dzierzbicka-Glowacka et al.: Population modelling ofAcartiaspp. 2259
Last, J. M.: The food of twenty species of fish larvae in the west-central North Sea, Fisheries Research Technical report, Lowest-oft, 60, 44 pp., 1980.
Maritime Branch Materials Institute of Meteorology and WaterManagement: Environmental conditions in the Polish zone ofthe southern Baltic Sea during 1999, IMGW Gdynia, Institute ofMeteorology and Water Management in Gdynia, Poland, 299 pp.,2000.
Mauchline, J.: The Biology of Calanoid Copepods, AcademicPress, San Diego, USA, 710 pp., 1998.
McLaren, I. A.: Generation lengths of some temperate marine cope-pods: estimation, production and implications, J. Fish Res. Bd.Can., 345, 1330–1342, 1978.
McLaren, I. A. and Leonard, A.: Assessing the equivalence ofgrowth and egg production of copepods, ICES J. Mar. Sci., 52,397–408, 1995.
Moll, A. and Stegert, C.: ModellingPseudocalanus elongatesstage-structured population dynamics embedded in a water col-umn ecosystem model for the northern North Sea, J. Mar. Syst.,64, 35–46, 2007.
Mudrak, S.: Short- and long-term variability of zooplankton incoastal Baltic waters: using the Gulf of Gdansk as an exam-ple, PhD Thesis, Gdansk University, Gdynia, Gdansk, Poland,328 pp.+Aneks, 2004.
Mudrak, S. andZmijewska, M. I.: Spatio-temporal variability ofmesozooplankton from the Gulf of Gdansk (Baltic Sea) in 1999–2000, Oceanol. Hydrobiol. Stud., 36(2), 3–19, 2007.
Norrbin, M. F.: Timing of diapause in relation to the onset of winterin the high-latitude copepodsPseudocalanus acuspesandAcar-tia longiremis, Mar. Ecol.-Prog. Ser., 142, 99–109, 1996.
Postel, L.: Habitat layer extension and the occurrence of dom-inant calanoid copepods in the Baltic Sea, available online:http://www.helcom.fi/BSAPassessment/ifs/archive/ifs2005/en GB/zooplankton/, last access: July 2010, 2005.
Sekiguchi, H., McLaren, I. A., and Corkett, C. J.: Relationship be-tween growth rate and egg production in the copepodAcartiaclausiHudsonica, Mar. Biol., 58, 133–138, 1980.
Stegert, C., Kreus, M., Carlotii, F., and Moll, A.: Parameterisationof a zooplankton population model forPseudocalanus elongatususing stage durations from laboratory experiments, Ecol. Model.,206, 213–230, 2007.
Wiktor, K.: Zooplankton biomass in the coastal waters of GdanskGulf, Oceanography, 12, 109–134, 1990.
Wiktor, K. andZmijewska, M. I.: Zooplankton species compositionand distribution in the waters of the inshore part of the Gulf ofGdansk, Stud. Mater. Oceanol., 46, 64–114, 1985.
Wroblewski, J. S. and Richman, J. G.: The non-linear response ofplankton to wind mixing events – implications for survival oflarval northern anchovy, J. Plankton Res., 9, 103–123, 1987.
Viitasalo, M.: Calanoid resting eggs in the Baltic Sea: implicationsfor the population dynamics ofAcartia bifi losa (Copepoda),Mar. Biol., 114, 397–405, 1992.
Vinogradow, M. E. and Shushkina, E. A.: Functioning of planktoncommunities in the euphotic zone of the ocean, Nauka, Moskwa,Russia, 1987.
Voipio, A.: The Baltic Sea, Elsevier Scientific Publishing Company,Amsterdam, The Netherlands, 123–143, 1981.
www.biogeosciences.net/7/2247/2010/ Biogeosciences, 7, 2247–2259, 2010