population genetics of common carp
TRANSCRIPT

Population Genetics of Common Carp
(Cyprinus carpio L.)
in the Murray-Darling Basin
Gwilym David Haynes
A thesis submitted to the Faculty of Veterinary Science, The University of Sydney, in
fulfilment of the requirements for the Degree of Doctor of Philosophy
March 2009

ii
Declaration
This thesis is submitted to the University of Sydney in fulfilment of the requirement for the Degree of Doctor of Philosophy The work presented in this thesis is, to the best of my knowledge and belief, original except as acknowledged in the text. Apart from the assistance mentioned in the acknowledgements and the contribution of the research paper co-authors listed below, the work described in this thesis was executed by the author, who also had substantial input into planning of the projects. I hereby declare that I have not submitted this material, either in full or in part, for a degree at this or any other institution. Signature:……………………………………………. Date:………………….....

iii
Contribution of Co-authors Chapter 3: Population genetics of a globally invasive species, common carp (Cyprinus carpio L.), in the Murray-Darling Basin, Australia: evidence for multiple introductions and genetic structure, with suggested management units
Dr. D.M. Gilligan selected the sample sites, organised and coordinated the collection of fish samples from the Murray-Darling Basin and Prospect Reservoir and assisted in manuscript preparation. Dr. P. Grewe offered extensive technical advice, made genotyping equipment available and assisted with manuscript preparation. Prof. F. Nicholas supervised the project, contributed to extensive discussions concerning data analysis and interpretation, and performed extensive manuscript editing.
Chapter 4: Invasive common carp (Cyprinus carpio L.) in Australia: origin of founding strains and population genetics of coastal waterways
Dr. D.M. Gilligan selected the sample sites, organised and coordinated the collection of common carp samples from the Murray-Darling Basin, Prospect Reservoir, the Hunter and Hawkesbury-Nepean catchments and assisted in manuscript preparation. Dr. P. Grewe offered extensive technical advice, made genotyping equipment available and assisted with manuscript preparation. Prof. F. Nicholas supervised the project, contributed to extensive discussions concerning data analysis and interpretation, and performed extensive manuscript editing. Prof. C. Moran assisted with manuscript preparation and provided technical and analytical advice.
Chapter 6: Rapid identification of maternal lineages in common carp (Cyprinus carpio L.) using real-time PCR and high resolution melt-curve analysis
Dr. J. Gongora assisted with implementation of software analysis and manuscript preparation.

iv
Prof. F. Nicholas supervised the project, contributed to extensive discussions concerning data analysis and interpretation, and performed extensive manuscript editing.
Dr. K.R. Zenger offered the original idea for the research paper and assisted with manuscript preparation.
I certify that the above statement about my contribution to the research papers in this Ph.D. thesis is true and accurate, and give Gwilym Haynes full permission to submit these journal articles as part of his Ph.D. thesis.
D.M. Gilligan Signature: Date:10 June 2008
P. Grewe Signature: Date: 30 May 2008.
F. Nicholas Signature: Date:25 June 2008. C. Moran Signature:………………………… Date:…………………........ J. Gongora Signature:………………………… Date:…………………........
K.R. Zenger Signature: Date: 2 June 2008

v
Acknowledgements First and foremost, I would like to thank Prof. Frank Nicholas, who has been my primary
supervisor throughout the duration of this project. His keen insight, objective reasoning
and endless patience have helped me greatly in developing my research and critical
thinking skills.
I am also indebted to my associate supervisors Dr. Peter Grewe, Dr. Dean Gilligan and
Prof. Chris Moran, without whom I would not have been able to complete this research.
I would like to thank Dr. Klaus Kohlmann and Dr. Bernd Hänfling for supplying most of
the “overseas” samples in my project; the Australian Koi Farm in Bringelly, NSW, for
donating samples of Japanese koi carp; and Pets on Broadway in Camperdown, NSW, for
donating samples of goldfish.
I thank Leanne Faulks, Vanessa Carracher, Peter Boyd, Dean Hartwell, and Cameron
McGregor from the NSW Department of Primary Industries, NSW; Ben Smith from the
South Australian Research & Development Institute; Michael Hutchinson and Stephanie
Backhouse from the Queensland Department of Primary Industries; Paul Brown from the
Victorian Department of Primary Industries; and Dr. Jawahar Patil from CSIRO Marine
Laboratories in Hobart for collecting samples from Australia.
I am also very grateful to colleagues in the former Pest Animal Control CRC and its
successor the Invasive Animals CRC, especially Tony Peacock, Brad Tucker, Wayne
Fulton Kylie Hall and Diane Holloway, for providing my scholarship, for facilitating my
research, and for encouraging my participation in CRC activities.
I thank Lee Miles and Dr. Jaime Gongora for assistance with calling genotypes; Lee Ann
Rollins, Dr. Jaime Gongora and Dr. Kyall Zenger for assistance with manuscript
preparation; and Zung Doan for technical support.
Finally, I would like to thank my friends and family in my hometown of Adelaide, in
Sydney, in New Zealand and around the world. Their kind support has been invaluable.

vi
Funding support was provided by the Fisheries R&D Corporation, the Murray-Darling
Basin Commission, the Invasive Animals Cooperative Research Centre (formerly the Pest
Animal Control CRC), the NSW Department of Primary Industries and the University of
Sydney.
vii
Abstract Common carp (Cyprinus carpio L.) are a highly invasive species of freshwater fish in
Australia. Native to Eurasia, they can be separated into 3-4 different subspecies and
innumerable aquaculture and ornamental strains. They have been introduced into Australia
on a number of occasions and were established in the Murray-Darling Basin (MDB),
Australia’s largest and most important river system, by the 1920s. The release of a new
aquaculture strain in the late 1960s, followed by extensive flooding in the mid 1970s,
resulted in an explosion of common carp numbers. They are now the dominant species in
this river system, and cause extensive ecological damage by competing with native
freshwater species and by their feeding mode, in which they suck up mud, filter it through
their gill rakers and expel water and fine particles through their gill opening. This feeding
mode has been linked to increases in water turbidity, algal blooms, damage to river banks,
loss of aquatic vegetation, alterations to the trophic cascade of ecosystems and declines in
native fish. However, the effects of carp are difficult to discern from other factors
degrading waterways and affecting native fish, such as flow regulation, irrigation and land
clearing.
There is substantial public interest in the control of common carp. Australians find them
unpalatable, considering them too bony and their flesh poor in taste. Subsequently, they are
undesirable for recreational fishing and few commercial markets exist in Australia. In
addition, as mentioned above, they are suspected of exerting a detrimental effect on the
aquatic environment. In fact, carp are currently considered by fisheries biologists as the
worst freshwater pest fish in many of the countries where they have been introduced. The
cost of management in Australia has been estimated at a total of $15.8 million annually,
with $2 million spent on research, $2 million on management, and $11.8 million on
remediation of environmental impacts.
Previous population genetic studies on carp in Australia identified four strains: Prospect,
Boolara, Yanco and Japanese koi. Interbreeding has been recorded between the Yanco and
Boolara strain, and there is no reason to believe that it cannot occur between the other carp
strains also. Hybridisation between carp and goldfish (Carassius auratus) has also been
detected in the MDB, but the level of introgression between the two species has not been
quantified. Some genetic structuring of carp within the MDB has been identified
previously, although there was little clear pattern to this structuring.
viii
The main aims of this Ph.D. study were:
1. to characterise the population genetic structure and level of genetic diversity of carp
in the MDB;
2. to discern the history of introduction and spread of carp in the MDB;
3. to identify barriers to gene flow in the MDB, and from this data propose
management units for control programs.
In addition, a number of side projects were also initiated with the following aims:
4. to discern the origin of the different strains of common carp that have been
introduced into Australia;
5. to investigate the population genetics of three carp populations in separate
waterways on the east coast of Australia;
6. to optimise PCR of microsatellite loci in both carp and goldfish;
7. to characterise the level of introgression between feral carp and goldfish in the
MDB; and
8. to develop a protocol for the screening of sequence variants in the mitochondrial
control region using real-time PCR and high-resolution melt-curve analysis
technology.
Common carp were collected from every major river in the MDB. In rivers with major
dams, carp were collected from both above and below these impoundments. Additionally,
feral carp were collected from Prospect Reservoir (source of the Prospect strain) in the
Sydney Basin; Japanese koi carp and domestic mirror-scaled carp were sourced from fish
breeders; wild carp were sourced from the River Danube in Germany; and Russian Ropsha
strain carp were obtained from a live gene bank in the Czech Republic. All carp were
characterised for 14 microsatellite loci.
The core aims of this Ph.D. (the aims #1-3 above) are addressed in Chapter 3. Because of
the expected lack of genetic equilibrium of the carp population under study, a range of
analyses was utilized and consensus among results was interpreted as approaching
biological reality. Genetic structuring between regions was detected, especially across the
large impoundments at river headwaters. Evidence was found for three discernable strains
of carp (Prospect, Yanco and Boolara) accounting for the majority of genetic variation

ix
within the MDB, with a very minor contribution from ornamental Japanese koi carp. A
history of introduction and colonisation is proposed from the genetic and non-genetic
evidence. The basin was divided into 15 management units for future control programs.
Most regions had high levels of genetic diversity, with multiple strains present and no
evidence of recent population bottlenecks, implying that the invasiveness of carp is
associated with high levels of genetic diversity. This project serves as a guide for other
research groups looking to understand the population structure of invasive fish species as a
step towards their control.
Chapter 4 builds on the research presented in Chapter 3. In this study, the origins of the
strains are investigated (aim #4) by comparing representative of each strain with carp
populations from Europe, using assignment tests and factorial component analysis (FCA).
As isolated populations were not available for all strains, groups of individuals
representative of the Boolara and Yanco strains were inferred from the assignment tests
performed in Chapter 3. The population genetics of carp in the east coast of Australia was
also investigated (aim #5). It was found that the Prospect, Boolara and Yanco strains are
descended essentially from the European/central-Asian subspecies C. carpio carpio.
Coastal populations exhibited levels of genetic variation comparable with domestic
populations, were non-panmictic, and contained different proportions of each strain,
consistent with independent histories of introduction. Recommendations are made for
preventing the further spread of carp throughout the rest of Australia.
In Chapter 5, PCR was optimised for microsatellite loci in both carp and goldfish (aim #6),
and introgression between the two species in the MDB was quantified (aim #7). Goldfish
were collected opportunistically along with carp from the MDB, as were 23 putative carp-
goldfish hybrids, identified as such by the presence of aberrant barbels around their
mouths. Goldfish were also collected from local pet stores. Eight of the fourteen
microsatellites that amplified in carp in Chapter 3 also amplified in goldfish. A closed
population of feral goldfish was genotyped for these eight markers, five of which proved to
be suitable for analysis. All remaining goldfish and hybrids were genotyped for these five
loci, and genotyping results were combined with results of genotyping of carp from
Chapter 3. Assignment analyses were implemented in STRUCTURE and NEWHYBRIDS
to determine whether the suspected hybrids had ancestry from both species, and to
investigate undetected mixed-ancestry in individuals in the MDB and Prospect Reservoir.

x
The relationship between the individuals was visualised using two-dimensional FCA. In
addition, UPGMA and Maximum Likelihood phylogenetic trees were constructed from the
mitochondrial control region sequences of all the putative hybrids and from a number of
carp, goldfish and related cyprinids. The assignment analyses and FCA confirmed the
mixed nuclear-genome ancestry of all 23 putative hybrids, with 20 classes as F1 generation
and 3 classified as F2 generation. Putative mixed ancestry was also detected in 15
individuals from the MDB phenotypically identified as carp, and one individual identified
as goldfish. Overall, approximately 1.6% of the genetic diversity of carp in the MDB was
found to be sourced from goldfish, and approximately 1% of feral goldfish genetic
diversity is sourced from carp. There was some evidence that carp-goldfish hybridisation
was biased in favour of male carp, namely that 21 of the 23 putative (phenotypic) hybrids
had goldfish mitochondrial sequence,. However, too few individuals and loci were
analysed to resolve this issue with any certainty. Although low, this level of introgression
is still of concern, as it may introduce new adaptive alleles (e.g. for disease resistance) into
invasive carp populations.
In Chapter 6, a protocol for using real-time PCR and high-resolution melt-curve (HRMC)
analysis to score polymorphisms in the mitochondrial DNA control region of common carp
is presented (aim #8). This is the first time HRMC analysis has been used in an
aquacultural species. The technique is accurate, robust and rapid to apply. It has a number
of advantages over other existing techniques for scoring DNA polymorphisms: it is rapid,
taking less than three hours from start to finish; all procedures take place in closed PCR
tubes, reducing the risk of contamination and human error; cycling conditions in the Rotor-
gene 6000 PCR machine used in the methodology are more homogenous than in traditional
block-based PCR machines; and the progress and success of each individual PCR is
monitored in real-time. The primers were designed to score a greater number of
polymorphic sites than in previous studies, and specifically target a section of the control
region that is polymorphic amongst European carp races, which otherwise have very little
mitochondrial DNA variation. The technique was used to accurately identify three
common carp and one goldfish haplotype, with no haplotypes incorrectly identified.
Although the method outlined here is optimised for scoring common carp mitochondrial
haplotypes using the Rotor-gene 6000 machine, real-time PCR and HRMC analysis can be
applied in a similar way to almost any species and/or loci, with a number of different real-
time PCR machines available for scoring genetic differences.

xi
There are a number of future research possibilities for the study of carp in Australia. These
include improving the accuracy and power of the research presented here by scoring more
genetic markers and including more outgroup populations; investigating more fully the
population genetics of the many coastal populations of carp in Australia; more accurately
quantifying introgression between carp and goldfish by scoring more DNA markers in both
species; and investigating the presence of crucian carp (Carassius carassius) in the MDB,
and possible interbreeding between this species and carp and goldfish.
This research is the most comprehensive study of common carp in a single river basin to
date. The quantity of samples (983 in the MDB) and collection sites (36 in the MDB)
exceeds any previous study of common carp, and is not often achieved amongst other
studies of freshwater fish. This is the first study in which the population history of common
carp has been investigated in detail at a local level, and in which management units for this
species have been proposed. A number of surprising findings have been made, namely the
presence of the Prospect strain in the MDB, the extent of population genetic structuring in
the Basin, the disparate distribution of the different stains as a result of human-mediated
dispersal, and the cryptic introgression between goldfish and carp. It was shown here that
despite being recently introduced, carp can exhibit population structuring within a single
river basin,and that this structuring that is consistent with the population not yet being in
mutation-drift-migration equilibrium and gene flow playing a larger role than genetic drift
in shaping genetic structure. This study serves as a guide to other research groups looking
to understand the population genetics of invasive freshwater fish species as a step towards
their control.
xii
Table of Contents
Declaration ........................................................................................................................... ii
Acknowledgements .................................................................................................................. v
Abstract ......................................................................................................................... vii
Table of Contents ................................................................................................................... xii
List of Tables and Appendices ............................................................................................ xvii
List of Figures ....................................................................................................................... xix
List of Abbreviations ............................................................................................................. xx
Chapter 1: Introduction .......................................................................................................... 1
1.1 References ..................................................................................................................... 4
Chapter 2: Literature Review ................................................................................................ 7
2.1. A brief introduction to the study of population genetics .............................................. 7
2.1.1. Bayesian statistics .......................................................................................... 9
2.1.2. Non-equilibrium populations ....................................................................... 12
2.2. A brief introduction to invasive species ..................................................................... 13
2.2.1. Paradox 1: How does any species manage to invade a new
environment that already appears to be occupied by well-
adapted indigenous species? ...................................................................... 14
2.2.2. Paradox 2: How can invasive species survive and evolve in a
new environment, after the genetic bottleneck of the
introduction process? ................................................................................. 15
2.2.3. Hybridisation and invasive species .............................................................. 17
2.3. What are Common Carp? ........................................................................................... 17
2.4. Biology of Common Carp .......................................................................................... 19
2.5. Common carp as an invasive species ......................................................................... 20
2.6. Domestication ............................................................................................................. 23
2.7. Morphological variation ............................................................................................. 24
2.8. Subspecies of common carp ....................................................................................... 27
2.9. Aquaculture strains and evolutionary significant units .............................................. 28
2.10. Population Genetics of the Common Carp ............................................................... 29
2.10.1. Evolution and demographic history of common carp ............................... 30
xiii
2.10.2. Genetic variation and structure .................................................................. 31
2.10.3. Limitations of the population genetic studies of common carp ................. 32
2.10.4. Future Work ............................................................................................... 34
2.11. Common carp in Australia ........................................................................................ 36
2.11.1. Introduction of carp ................................................................................... 36
2.11.2. Population growth and spread of carp in Australia ................................... 40
2.11.3. Population genetics of common carp in Australia ..................................... 41
2.11.4. Interbreeding between common carp and goldfish .................................... 44
2.11.5. Summary .................................................................................................... 46
2.12. Scope of this project ................................................................................................. 46
2.13. References ................................................................................................................ 47
Chapter 3: Population genetics and management units of invasive common
carp (Cyprinus carpio L.) in the Murray-Darling Basin,
Australia ......................................................................................................... 60
3.1. Abstract ....................................................................................................................... 60
3.2. Introduction ................................................................................................................ 61
3.3 Materials and Methods ................................................................................................ 62
3.3.1. Sample Collection ........................................................................................ 62
3.3.2. PCR and genotyping .................................................................................... 65
3.3.3. Statistical analysis ........................................................................................ 66
Allelic diversity ....................................................................................... 66
Assignment tests ...................................................................................... 66
Genetic structure .................................................................................... 67
Barriers to dispersal ............................................................................... 67
Defining management units .................................................................... 68
Genetic diversity and population bottlenecks ......................................... 68
3.4. Results ........................................................................................................................ 69
3.4.1. Allele Diversity ............................................................................................ 69
3.4.2. Assignment tests .......................................................................................... 69
3.4.3. Genetic structuring ...................................................................................... 71
3.4.4. Barriers to dispersal ..................................................................................... 72
3.4.4. Genetic diversity and population bottlenecks .............................................. 72
3.5. Discussion ................................................................................................................... 75
xiv
3.5.1. Strains of common carp in the Murray-Darling basin ................................. 75
3.5.2. Population genetic structure ........................................................................ 75
3.5.3. Genetic diversity .......................................................................................... 76
3.5.4. History of introduction and range expansion .............................................. 77
3.5.5. Barriers to dispersal and management units ................................................ 78
3.6. Acknowledgements .................................................................................................... 79
3.7. References .................................................................................................................. 80
Chapter 4: Invasive common carp (Cyprinus carpio L.) in Australia: origin of
founding strains and population genetics of coastal waterways ................ 89
4.1. Abstract ....................................................................................................................... 90
4.2. Introduction ................................................................................................................ 90
4.3. Materials and Methods ............................................................................................... 93
4.3.1. Selection of individuals to represent the strains of common carp
in Australia ................................................................................................ 93
4.3.2. European common carp populations ........................................................... 94
4.3.3. Coastal samples ........................................................................................... 97
4.3.4. DNA extraction and genotyping .................................................................. 97
4.3.5. Data analysis ................................................................................................ 97
4.3.6. Population genetics of common carp in coastal rivers ................................ 98
4.4. Results ........................................................................................................................ 99
4.4.1. Origin of carp in Australia ........................................................................... 99
4.4.2. Population genetics of common carp in coastal rivers ................................ 99
4.5. Discussion ................................................................................................................. 103
4.5.1. Origin of and relationship between founding common carp
strains ....................................................................................................... 103
4.5.2. Population genetics of common carp in coastal rivers .............................. 104
4.5.3. Implications for management and control ................................................. 105
4.5.4. Future work ................................................................................................ 106
4.6. Acknowledgements .................................................................................................. 107
4.7. References ................................................................................................................ 107

xv
Chapter 5: Invasive Cyprinid species Cyprinus carpio and Carassius auratus
in Australia: cryptic hybridisation and introgression .............................. 112
5.1. Introduction .............................................................................................................. 112
5.2. Materials and Methods ............................................................................................. 114
5.2.1. Sample collection ...................................................................................... 114
5.2.2. DNA extraction .......................................................................................... 114
5.2.3. Microsatellite cross-species PCR amplification and assessment .............. 118
5.2.4. Statistical analysis of microsatellite data ................................................... 119
5.2.5. Mitochondrial DNA analysis ..................................................................... 120
5. 3. Results ..................................................................................................................... 121
5.3.1. Microsatellite data ..................................................................................... 121
5.3.2. Mitochondrial sequence data ..................................................................... 125
5.4. Discussion ................................................................................................................. 126
5.4.1. Cross-Species amplification of microsatellite loci .................................... 126
5.4.2. Hybridisation between carp and goldfish .................................................. 127
5.4.3. Cryptic introgression between carp and goldfish ...................................... 127
5.4.4. Direction of hybridisation .......................................................................... 128
5.4.5. Implications for Conservation ................................................................... 128
5.5. Acknowledgements .................................................................................................. 129
5.6. References ................................................................................................................ 129
Chapter 6: Rapid identification of maternal lineages in common carp
(Cyprinus carpio L.) using real-time PCR and high resolution
melt-curve analysis ...................................................................................... 136
6.1. Abstract ..................................................................................................................... 137
6.2. Introduction .............................................................................................................. 137
6.3. Materials and Methods ............................................................................................. 139
6.3.1. Identification of mtDNA polymorphisms .................................................. 139
6.3.2. Primer design and PCR optimisation for HRMC analysis ........................ 143
6.3.3. High-Resolution Melt-Curve analysis ....................................................... 144
6.4. Results ...................................................................................................................... 146
6.4.1. Identification of mitochondrial DNA polymorphisms .............................. 146
6.4.2. High-Resolution Melt Curve Analysis ...................................................... 147
6.5. Discussion ................................................................................................................. 149

xvi
6.5.1. HRMC Analysis and haplotype identification ........................................... 149
6.5.2. Choice of regions ....................................................................................... 150
6.5.3. Other methods for rapid scoring of mitochondrial haplotypes .................. 150
6.5.4. Recommendations for using HRMC analysis ........................................... 151
6.5.5. Uses and future direction ........................................................................... 152
6.6. Acknowledgements .................................................................................................. 153
6.7. References ................................................................................................................ 153
Chapter 7: General discussion and conclusions................................................................ 157
7.1. Summary of findings ................................................................................................ 157
7.2. Reinterpretation of previous population genetic studies of carp in Australia .......... 158
7.3. Implications of this research ..................................................................................... 159
7.4. Future research ......................................................................................................... 161
7.4.1. Improving accuracy and power of this study ............................................. 161
7.4.2. Study of coastal populations ...................................................................... 162
7.4.3. Further study of carp-goldfish introgression ............................................. 162
7.4.4. Investigating the presence of crucian carp ................................................ 162
7.5. References ................................................................................................................ 163

xvii
List of Tables and Appendices Table 2.1. Analogues and modified version of Wright’s (1951) FST statistic .................... 8
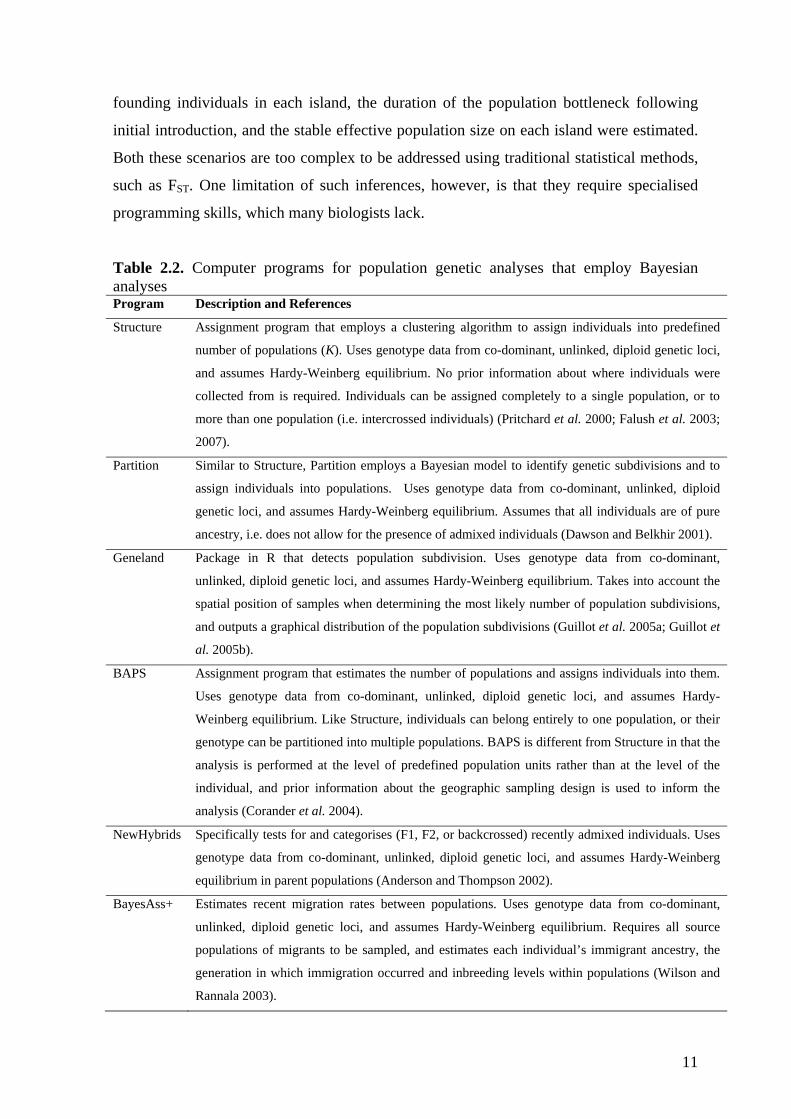
Table 2.2. Computer programs for population genetic analyses that employ
Bayesian analyses ............................................................................................ 11
Table 2.3. Attributes of carp as an invasive species ......................................................... 23
Table 2.4. Population genetic studies of common carp .................................................... 30
Table 2.5. Mitochondrial loci and analysis methods used in different studies of
common carp. .................................................................................................. 34
Table 2.6. History of introduction of common carp in Australia ..................................... 39
Table 2.7. Allozyme and colour traits diagnostic of the Yanco, Boolara and
Prospect strains of common carp ..................................................................... 42
Table 3.1. Collection sites for common carp .................................................................... 63
Table 3.2. Microsatellite alleles and allele size ranges detected ...................................... 71
Table 3.3. F-statistics (Weir and Cockerham 1984) and AMOVA results ....................... 72
Appendix 3.1. PCR conditions and primer sequences for microsatellite loci. ........................ 85
Appendix 3.2. PCR cycling protocols ..................................................................................... 86
Appendix 3.3. Samples used in isolation-by-distance analyses .............................................. 86
Appendix 3.4. Management units for common carp in the MDB ........................................... 87
Table 4.1. Founding strains of common carp used in this study ...................................... 95
Table 4.2. European populations of common carp used in this study .............................. 96
Table 4.3. Coastal populations of common carp used in this study ................................. 97
Table 5.1. Carp, goldfish and suspected hybrids investigated in this study ................... 116
Table 5.2. Missing data and departure from Hardy-Weinberg Equilibrium
(HWE) in goldfish from Nyngan (n=42) ....................................................... 119
Table 5.3. Mitochondrial sequences used in this study. ................................................. 121
Table 5.4. Assignment analysis of putative F1 carp-goldfish hybrids ........................... 123
Table 5.5. Assignment analysis of individuals showing inter-species ancestry ............. 123
Table 5.6. Microsatellite alleles in the 23 carp-goldfish hybrids identified by
phenotype ....................................................................................................... 124
Appendix 5.1. Allele frequencies and private alleles by population ..................................... 135
Table 6.1. Common carp mitochondrial control-region sequences from
Genbank (http://www.ncbi.nlm.nih.gov/) ...................................................... 139
Table 6.2. Mitochondrial control-region sequences obtained in this study. ................... 140

xviii
Table 6.3. Polymorphisms detected in the mitochondrial DNA control region ............. 142
Table 6.4. Primer sequences for the 5’ highly variable region (HVR) and the
3’ repeat motif region of the mtDNA CR locus ............................................ 144
Table 6.5. Mitochondrial haplotypes (HVR region and 3’repeat motif)
detected by the high-resolution melt curve analysis. ..................................... 148
Table 7.1. Distribution of the different strains of common carp in Australia ................ 157
xix
List of Figures Figure 2.1. Key morphological features of common carp. ................................................ 19
Figure 2.2. Australian catchments where introduced carp have established self-
sustaining populations. .................................................................................... 21
Figure 2.3. Phenotypes and hypothesised genotypes of scale morphs in
common carp, as controlled by the genes S and N. ......................................... 26
Figure 2.4. Natural distribution of common carp subspecies ............................................ 28
Figure 2.5. Colourful koi carp in urban waterways. .......................................................... 38
Figure 3.1. Collection sites for common carp .................................................................... 65
Figure 3.2. Assignment results from STRUCTURE for K=5 population groups. ............. 70
Figure 3.3. Putative barriers to dispersal calculated from A. Reynolds’ estimate
of FST, and B. Slatkin’s estimate of FST. ......................................................... 73
Figure 3.4. Genetic diversity in common carp in the MDB ............................................... 74
Figure 3.5. Proposed management units for common carp in the MDB. .......................... 79
Figure 4.1. FCA illustrating the relationship between common carp
strains/population ........................................................................................... 100
Figure 4.2. Contribution of the Prospect, Boolara, Yanco, and koi strains of
common carp to the coastal waterways ......................................................... 102
Figure 4.3. Allele richness (Ar) and mean number of alleles (A) of common
carp ................................................................................................................ 102
Figure 5.1. Collection sites for carp, goldfish and putative hybrids in the
Murray-Darling Basin .................................................................................... 115
Figure 5.2. FCA of the genetic relatedness between carp, goldfish and putative
carp-goldfish hybrids ..................................................................................... 125
Figure 5.3. Phylogenetic relationship of the first 600bp of the mitochondrial
control region in carp, goldfish, Japanese crucian carp, tench and
the putative carp-goldfish hybrids from the MDB ........................................ 126
Figure 6.1. Primer positions in the mitochondrial control region of common
carp. ............................................................................................................... 141
Figure 6.2. Median-joining network of the first 510 base pairs of the mtDNA
CR in common carp. ...................................................................................... 147
Figure 6.3. Melt curve profiles of mitochondrial control region haplotypes. .................. 149

xx
List of Abbreviations
General Abbreviations A Mean Number of Alleles Per Locus
AB Applied Biosystems
ACE After Common Era (AD)
ACT Australian Capital Territory
AMOVA Analysis of Molecular Variance
Ar Allele Richness
BCE Before Common Era (BC)
bp Base Pairs
CR Control Region
CRC Cooperative Research Centre
DNA Deoxyribonucleic Acid
ESU Evolutionary Significant Unit
FCA Factorial Correspondence Analysis
HE Expected Heterozygosity
HO Observed heterozygosity
HRMC High-Resolution Melt-Curve
HVR Highly Variably Region
HW Hardy-Weinberg
KHV Koi Herpes Virus
MCMC Monte Carlo Markov-Chain MDB Murray-Darling Basin
MIA Murrumbidgee Irrigation Area
mtDNA Mirochondrial DNA
NSW New South Wales
PCR Polymerase Chain Reaction
QLD Queensland
RFLP Restriction Fragment Length Polymorphisms
rt Real-Time
SA South Australia
SMM Stepwise mutation model
SSCP Single Strand Conformational Polymorphism
subsp. Subspecies
TAS Tasmania
TGGE Temperature-Gradient Gel Electrophoresis
TPM Two Phase Model
VIC Victoria
xxi
Carp Sample Sites AV Avoca
BD Burrendong Dam
BJ Burrinjuck Dam
BK Bourke
BR Broken River
CDM Condamine
CM Cooma
CN Coonamble
CS Campaspe
CV Charleville
CW Lake Cargelligo
D River Danube
DB Dubbo
DQ Deniliquin
EC Echuca
EI Lake Eildon
GB Goulburn
J Jaenschwalde, German Mirror -Scaled carp
K Koi (Germany)
Kb Koi (Sydney)
KIW Kiewa
KP Lake Keepit
LD Loddon
LH Lake Hume
LL Lower Lakes
MG Mudgee
MR Moree
NB Narrabri
ND Narrandera
NG Nyngan
OV Ovens
P Prospect Reservoir
PR Paroo River
R Ropsha
TAS Tasmania
WC Wilcannia
WG Walgett
WM Horsham
WN Wellington

xxii
WT Wentworth
WY Wyangala Dam
Carp Strains B Boolara
K Koi
P Prospect strain
Y Yanco

1
Chapter 1: Introduction
Common carp (Cyprinus carpio L.) are a highly invasive species of freshwater fish. They
have been introduced into Australia on a number of occasions since the late 19th Century
(Koehn et al 2000), were established in the Murray-Darling Basin (MDB) by the 1920s
(Clements 1988), and have been the dominant fish species in the basin since the mid-late
1970s (Harris and Gehrke 1997; Reid et al. 1997; Koehn et al. 2000; MDBC 2008b).
The presence of carp is undesirable throughout Australian waterways. Many Australians
find carp unpalatable (although they are highly prized by some European and Asian
migrant communities), considering them too bony and their flesh poor in taste (Koehn et
al. 2000). Their feeding habit, in which they suck up mud, filter it through their gill rakers
and expel water and fine particles through their gill opening, has been linked to increases
in water turbidity (Crivelli 1981; Fletcher et al. 1985; Newcome and Macdonald 1991;
Roberts et al. 1995; Driver et al. 1997; King et al. 1997; Schiller and Harris 2001; Angeler
et al. 2002; Tapia and Zambrano 2003; Pinto et al. 2005), algal blooms (Breukelaar et al.
1994; Gehrke and Harris 1994; Williams et al. 2002; Pinto et al. 2005), damage to river
banks (Wilcox and Hornbach 1991), loss of aquatic vegetation (Crivelli 1981; Hume et al.
1983a; Panek 1987; Roberts et al. 1995), alterations to the trophic cascade of ecosystems
(Angeler et al. 2002; Khan 2003; Parkos III et al. 2003) and declines in native fish
(Fletcher et al. 1985; Page and Burr 1991; Koehn et al. 2000). Although the effects of carp
are often difficult to discern from other factors degrading waterways and affecting native
fish, such as flow regulation, irrigation and land clearing (Hume et al. 1983a; Koehn et al.
2000), there is much public interest in carp control. The cost of carp management in
Australia has been estimated at a total of $15.8 million annually, with $2 million spent on
research, $2 million on management, and $11.8 million on remediation of environmental
impacts (McLeod 2004; Gilligan and Rayner 2007). Common carp are currently
considered by fisheries biologists as the worst freshwater pest fish in both Australia and
New Zealand (Chadderton et al. 2003).
A range of physical and biological controls are in various stages of development to control
invasive carp populations. These are summarised in Gilligan and Rayner (2007), and
include barring carp from key breeding sites, introduction of disease, daughterless
technology and various methods for removing carp from waterways.

2
The MDB is Australia’s most important river system, covering some 1,061,469 square
kilometres, equivalent to 14% of the country's total area; and containing Australia’s three
longest rivers, the Darling (2,740km), the Murray (2,530km) and the Murrumbidgee
(1,690km). In 1992, the MDB accounted for 71.1% of the total area of irrigated crops and
pastures (2,069,344 hectares), 70% of all water used for agriculture in Australia, and
$10.75 billion in industry turnover (MDBC 2008a). The basin harbours an estimated
30,000 wetlands of various sizes, 46 species of native fish and 11 species of alien (non-
Australian) or translocated fish (Australian but not native to the MDB) fish (Lintermans
2007). Although no fish has become extinct in the basin since European settlement, local
extinctions have occurred, 26 of the 46 native species are recognised as threatened or of
conservation concern, and alien species comprise 80-90 per cent of the fish biomass in
parts of many rivers (Lintermans 2007). In addition, the basin hosts no fewer than 35
species of endangered birds and 16 species of endangered mammal (MDBC 2008a).
Conservation of all aspects of the MDB is of great importance to Australia.
The main aims of this Ph.D. study were:
1. to characterise the population genetic structure and level of genetic diversity of carp
in the MDB;
2. to discern the history of introduction and spread of carp in the MDB;
3. to identify barriers to gene flow in the MDB, and from this data propose
management units for control programs.
In addition, a number of side projects were also initiated with the following aims:
4. to discern the origin of the different strains of common carp that have been
introduced into Australia;
5. to investigate the population genetics of three carp populations in separate
waterways on the east coast of Australia;
6. to optimise PCR of microsatellite loci in both carp and goldfish;
7. to characterise the level of introgression between feral carp and goldfish in the
MDB; and
8. to develop a protocol for the screening of sequence variants in the mitochondrial
control region using real-time PCR and high-resolution melt-curve analysis
technology.

3
This Ph.D. thesis contains four research chapters (Chapters 3-6). Chapters 3, 4 and 6 were
written for journal publication and are in various stages of peer review at the time of thesis
submission. Chapter 5 was not written specifically for any journal, although will be
rewritten for publication in the near future. Each chapter is written so that it can be read
independently. The original journal formatting of Chapters 3, 4 and 6 has been preserved
where possible. However, minor changes have been made so that the formatting of the
thesis is internally consistent.
The main aims of the CRC-funded research are addressed in Chapter 3. Chapter 4
addresses the aims of discerning the origin of the different strains of common carp that
have been introduced into Australia and of investigating the population genetics of three
carp populations in separate waterways on the east coast. These chapters are highly
relevant to the control of common carp in Australian waterways. Taken together, they
explain the origin of carp in Australia, and the mechanisms by which it has spread to new
regions following initial introduction; they suggest potential genetic factors that could
account for carp being so invasive; and they make recommendations for future control
programs.
In Chapter 5, introgression between feral carp and goldfish (Carassius auratus) in the
MDB is characterised. This chapter is of some significance for the control of feral carp, as
it identifies goldfish as a potential source of genetic variation which could allow carp to
become more virulent as an invasive species, and enable carp to overcome biological
controls (daughterless gene technology and introduced diseases) implemented against
them. It is also of broader interest, as it explores the ongoing exchange of genetic material
between related species, a process that likely has long-term evolutionary significance.
Chapter 6 details a protocol developed for the screening/genotyping of sequence variants
in the mitochondrial control region using real-time PCR and high-resolution melt-curve
(HRMC) analysis technology. To the knowledge of the authors of this chapter, this is the
first study in which real-time PCR and HRMC analysis are used to genotype sequence
variants in an aquaculture species. This combination of technologies has such applications
as identifying the success of different maternal lineages in mixed stock breeding programs
4
and measuring the contribution of escaped domestic strains to wild populations. Although
the protocol presented is specifically targeted at screening the mitochondrial DNA control
region in common carp using one particular brand and model of real-time PCR machine
with HRMC capacity, a range of such machines is available for the application of real-time
PCR and HRMC to other loci and species.
1.1 References
Angeler DG, Álvarez-Cobelas M, Sánchez-Carrillo S, Rodrigo MA (2002) Assessment of
exotic fish impacts on water quality and zooplankton in a degraded semi-arid
floodplain wetland. Aquatic Sciences, 64, 76-86. doi: 10.1007/s00027-002-8056-y.
Breukelaar AW, Lammens EH, Breteler K (1994) Effects of benthivorous bream (Aramis
brama) and carp (Cyprinus carpio) on sediment re-suspension and concentration of
nutrients and chlorophyll a. Freshwater Biology, 32, 113-121. doi: 10.1111/j.1365-
2427.1994.tb00871.x.
Chadderton WL, Grainger N, Dean T (2003) Appendix 1 – Prioritising control of invasive
freshwater fish. Managing invasive freshwater fish in New Zealand. Workshop
hosted by the Department of Conservation, Hamilton, New Zealand.
Clements J (1988) Salmon at the Antipodes A History and Review of Trout, Salmon and
Char and Introduced Coarse Fish in Australasia, Ballarat, Victoria, Australia,
Published by the author. ISBN: 0731637194.
Crivelli AJ (1981) The biology of common carp, Cyprinus carpio Linneaus in the
Camargue, Southern France. Journal of Fish Biology, 18, 271-290. doi:
10.1007/BF00018966.
Driver PD, Harris JH, Norris RH, Closs GP (1997) The role of the natural environment and
human impacts in determining biomass densities of common carp in New South
Wales. In Harris, J. H. & Gehrke, P. (Eds.) Fish and Rivers in stress: the NSW
rivers survey. Cronulla and Canberra, Australia, NSW Fisheries Office of
Conservation and Cooperative Research Center for Freshwater Ecology. ISBN:
0731094085.
Fletcher RF, Morison AK, Hume DJ (1985) Effects of carp Cyprinus carpio L., on
communities of aquatic vegetation in the lower Goulburn River Basin. Australian
Journal of Marine and Freshwater Research, 36, 311-327.
doi:10.1071/MF9850311.

5
Gehrke PC, Harris JH (1994) The role of fish in cyanobacterial blooms in Australia.
Australian Journal of Marine and Freshwater Research, 45, 905-915.
doi:10.1071/MF9940905.
Gilligan D, Rayner T (2007) The distribution, spread, ecological impacts, and potential
control of carp in the upper Murray River. NSW Department of Primary Industries,
Sydney.
Harris JH, Gehrke PC (1997) Fish and rivers in stress - the NSW rivers survey. NSW
Fisheries Office of Conservation & the Cooperative Research Centre for
Freshwater Ecology, Cronulla and Canberra.
Hume DH, Fletcher AR, Morsion AK (1983) Final Report. Carp Program Report No. 10.
Fisheries and Wildlife Division, Victorian Ministry for Conservation,
Khan TA (2003) Dietary studies on exotic carp (Cyprinus carpio) from two lakes in
Western Victoria, Australia. Aquatic Sciences, 65, 272-286. doi: 10.1007/s00027-
003-0658-5.
King AJ, Rovertson AI, Healy MR (1997) Experimental manipulations of the biomass of
introduced carp (Cyprinus carpio) in billabongs. 1. Impacts on water column
properties. Marine and Freshwater Research, 48, 435-443. doi:10.1071/MF97031.
Koehn J, Brumley B, Gehrke P (2000) Managing the Impacts of Carp, Canberra, Australia,
Bureau of Rural Sciences (Department of Agriculture, Fisheries and Forestry).
ISBN 0644292407 (set) 0642732019.
Lintermans M (2007) Fishes of the Murray-Darling Basin, Canberra, Australia, Murray-
Darling Basin Commission. ISBN: 1 921257 20 2.
McLeod R (2004) Counting the cost: impact of invasive animals in Australia. Cooperative
Centre for Pest Animal Control, Canberra.
MDBC (2008a). Murray Darling Basin Commission, Basin Statistics:
http://www.mdbc.gov.au/about/basin_statistics
MDBC (2008b) Sustainable rivers audit report. Murray-Darling Basin Commission,
Newcome CP, Macdonald DD (1991) Effects of suspended sediments on aquatic
ecosystems. North American Journal of Fisheries Management, 11, 72-82. Doi:
10.1577/1548-8675(1991)011.
Page LM, Burr BM (1991) A field guide to freshwater fishes: North America North of
Mexico, Boston, USA, Houghton Miffin Company. ISBN: 0395910919.
Panek FM (1987) Biology and ecology of carp. In Cooper, E. L. (Ed.) Carp in North
America. Maryland, USA, American Fisheries Society. ISBN: 9780913235447.
6
Parkos III JJ, Santucci VJ, Wahl DJ (2003) Effect of adult common carp (Cyprinus carpio)
on multiple trophic levels in shallow mesocosms. Canadian Journal of Fisheries
and Aquatic Sciences, 60, 182-192.
Pinto L, Chandrasena N, Pera J, Hawkins P, Eccles D, Sim R (2005) Managing invasive
carp (Cyprinus carpio L.) for habitat enhancement in at Botany Bay, Australia.
Aquatic Conservation: Marine and Freshwater Ecosystems, 15, 447-462. doi:
10.1002/aqc.684.
Reid DD, Harris JH, Chapman DJ (1997) NSW Inland Commercial Fishery Data Analysis.
Fisheries Research & Development Corporation, NSW Fisheries, Cooperative
Research Centre for Freshwater Ecology, Sydney, Australia.
Roberts J, Chick A, Oswald L, Thompson P (1995) Effects of carp, Cyprinus carpio L., an
exotic benthivorous fish on aquatic and water quality in experimental ponds.
Marine and Freshwater Research, 46. doi:10.1071/MF9951171.
Schiller C, Harris JH (2001) Native and alien fish. In Young, W. J. (Ed.) Rivers as
ecological systems: the Murray-Darling Basin. Canberra, Australia, Murray-
Darling Basin Commission. ISBN: 1876830034.
Tapia M, Zambrano L (2003) From Aquaculture Goals to Real Social and Ecological
Impacts: Carp Introduction in Rural Central Mexico. Ambio, 32, 252-557.
Wilcox TP, Hornbach DJ (1991) Macrobenthic community response to carp (Cyprinus
carpio) foraging. Journal of Freshwater Ecology, 6, 170-183.
Williams AE, Moss W, Eaton J (2002) Fish induced macrophyte loss in shallow lakes: top-
down and bottom-up processes in mesocosm experiments. Freshwater Biology, 47,
2216-2232. doi: 10.1046/j.1365-2427.2002.00963.x.

7
Chapter 2: Literature Review
2.1. A brief introduction to the study of population genetics
Population genetics can be defined as the study of changes in allele or gene frequencies in
space and time. Population genetic studies address such questions as identifying of
population structure (i.e. the presence of subpopulations), quantifying genetic differences
between subpopulations, estimating effective population sizes and effective migration rates
(i.e. gene flow), and making phylogenetic inferences.
The field of population genetics was pioneered by such scientists as Sewall Wright (1889-
1988), John Haldane (1892–1964) and Sir Ronald Fisher (1890–1962), who developed the
theoretical foundation upon which many of the analytical methods used today are based
(e.g. Haldane 1924; Fisher 1930; Wright 1931; 1951). It has been widely recognised,
however, that the early models of population structure, migration, demographics and
evolution are unrealistic, as they rely on assumptions that do not accurately reflect the real
biological world, such as constant population size and migration rates, and equilibrium
between mutation, migration and genetic drift (Whitlock and McCauley 1999; Pearse and
Crandall 2004).
The FST statistic (Wright 1951), which quantifies the difference in allele frequencies
between subpopulations relative to the overall population, has featured heavily in
population genetic studies since its inception (Pearse and Crandall 2004). FST has been
widely used to estimate migration rates between subpopulations under the equation
FST=1/(4Nm) (2Nm for haploid loci), where Nm is the migration rate (Wright 1951).
Numerous analogues of Wright’s (1951) original statistic have been devised to analyse
different types of genetic data or to operate under different population genetic models with
different assumptions, some of which are detailed in Table 2.1. The model of population
dynamics under which FST was built, however, is far too simplistic to reflect the
complexity of real biological scenarios (Whitlock and McCauley 1999). FST-based
estimates of migration and population structure can therefore be highly inaccurate
(Whitlock and McCauley 1999; Pearse and Crandall 2004), with FST analogues suffering
from the similar limitations as the original estimator (Pearse and Crandall 2004). FST and
its analogues are, however, still very useful as comparative benchmarks between studies
and as a basic descriptors of population subdivision (Pearse and Crandall 2004).

8
Table 2.1. Analogues and modified version of Wright’s (1951) FST statistic Statistic Description and References GST Devised for use with data for multiple alleles at diploid, co-dominant loci (Nei
1973).
θ FST analogue that is for “all intents and purposes” equivalent to Wright’s (1951) original FST (Weir and Cockerham 1984). Weir and Cockerham (1984) detail the use of a weighting procedure to combine information across all alleles and loci.
FST (no special signifier)
FST can be estimated from sequence data by treating each polymorphic site as a separate locus and each polymorphism as a separate allele (Hudson et al. 1992).
NST Devised for use with restriction fragment length polymorphism (RFLP) data sets (Lynch and Crease 1990).
Analysis of molecular variation (AMOVA)
Hierarchical partitioning genetic variation within and between different levels of population subdivisions. Originally devised for haploid sequence data (Excoffier et al. 1992), and adapted for use with co-dominant, diploid data sets .
RST Designed specifically for use with diploid microsatellite data sets; attempts to take into account they way in which microsatellite alleles most commonly mutate (i.e. with the addition or subtraction of a units of the repeat motif), by using the stepwise mutation model (SMM) rather than the infinite allele model (IAM) (Slatkin 1995).
(δμ)2 Designed specifically for use with diploid microsatellite data sets under the SMM (Goldstein et al. 1995).
ФST Designed specifically for use with diploid microsatellite data sets under the SMM (Michalakis and Excoffier 1996).
ρST Designed specifically for use with diploid microsatellite data sets under the SMM (Rousset 1996).
DR
Genetic distance measure for use with diploid microsatellite data sets under the SMM, incorporating mutational constraints on allele sizes (Zhivotovsky 1999).
Slatkin’s FST Follows a coalescence-based model of population subdivision (Slatkin 1991).
Reynolds’ FST Derived from the co-ancestry-based genetic distance of Reynolds et al. (1983) and implemented in the computer program Arequin (Excoffier et al. 2005).
In the last 10-15 years, advances in computing power coupled with the increasing ability to
generate large genetic data sets have led to the development of a wide array of new
analysis techniques. Rather then rely on summary statistics, such as FST, many of these new
analyses involve computationally-intensive procedures that simultaneously estimate
several parameters to find the overall set of parameters that best fits the data. More
information can therefore be extracted from genetic data, with it now being possible to
make inferences about past demography, identify genetic loci/regions under selection,
quantify genetic diversity, estimate the number of populations, estimate the rate of gene
9
flow, detect asymmetrical gene flow, discern the relative effects of migration and random
genetic drift on population structure, and make inferences about current and historical
effective population sizes (Pearse and Crandall 2004; Excoffier and Heckel 2006).
An extensive list of programs written for population genetic analysis is given by Excoffier
and Heckel (2006) and Pearse and Crandall (2004). These make an excellent starting point
for researchers engaged in population genetic analysis. However, as new programs are
constantly being written to either address new hypotheses or improve on current methods
to investigate existing hypotheses, a literature search for new programs is highly
recommended. In particular, such journals as Molecular Ecology Resources (previously
called Molecular Ecology Notes) and Bioinformatics are a good place to search for new
population genetic analysis programs.
Of particular relevance to this Ph.D. research are (1) analyses which employ Bayesian
statistics to make population genetic inferences, and (2) populations which are not in
equilibrium. These are discussed briefly in the sections below.
2.1.1. Bayesian statistics
Bayesian statistics are inference frameworks, based on the work of Thomas Bayes (1702-
1761), in which the posterior (post-analysis) probability of a parameter depends explicitly
on its prior (pre-analysis) probability (Excoffier and Heckel 2006). Bayesian analyses are
frequently used in conjuncture with Markov-chain Monte-Carlo (MCMC) techniques.
MCMC analysis makes it possible to estimate the joint posterior distribution (i.e. the
probability distribution of all possible combinations of parameter values, when a model is
defined by more than one parameter) of a set of parameters for a given data set under a
given model. MCMC techniques do this by exploring the parameter space (i.e. fitting the
data to different combinations of the parameters) one ‘step’ at a time. After enough steps,
the parameter space with the highest likelihood can be found (Excoffier and Heckel 2006).
MCMC methods bypass the computationally prohibitive measure of characterising the
entire parameter space (i.e. every possible combination of parameters for the data) and
have hence made it possible to address a range of biological questions for the first time.
Bayesian analyses coupled with MCMC techniques have therefore added greatly to the
study of population genetics.

10
A range of computer programs are now available that use Bayesian analyses to make
population genetic inferences. A number of these programs are described in Table 2.2.
Many implement different types of assignment test, where individuals are assigned to
populations based on their genotypes. By far the most popular assignment test is the one
developed by Pritchard et al. (2000) and implemented in their program Structure. This
method uses a clustering algorithm to assign individuals into a predefined number of
populations, K. The correct value of K (i.e. the actual number of populations) can then be
inferred using the ΔK statistic of Evanno et al. (2005). Although it can be computationally
heavy, Structure has the advantage of (1) assigning individuals rather than groups to a
population, and (2) this assignment being independent of where the individuals where
samples from (i.e. individuals can be assigned solely on the basis of their genotype).
Numerous improvements have been added since its inception (Falush et al. 2003; 2007).
Structure assumes that each population is in Hardy-Weinberg and linkage equilibrium, and
can be subsequently unsuitable for species where genetic differentiation follows a cline,
rather than a set of discrete subpopulations.
In addition to population assignment, Bayesian analyses can be used to infer detailed
demographic history of populations by combining information from both genetic and non-
genetic data. Estuope et al. (2001; 2003), for example, investigated the demographic
history of introduced populations of cane toads (Bufo marinus) in Australia and a species
of silveye bird (Zosterops lateralis lateralis), which naturally introduced itself from
Australia into New Zealand, Norfolk Island and Chatham Island in the Pacific Ocean. In
both studies, a large amount of historical and demographic information was available for
each species, such as the origin and date of introduced, when range expansions occurred,
generation time, and the size of a migrating flock (for silvereyes). This demographic data
was used to inform the Bayesian analyses (which included MCMC techniques) and
allowed many demographic parameters to be estimated for the first time. For cane toads,
number of introduced individuals, effective population size after the demographic boom
(the population explosion that occurred after the species was first introduced into
Australia), duration of the population boom, and the effective population size after
stabilisation was inferred. As cane toads were originally sourced from two different places
in South America, the length of time that these two source populations had been separated
and level of admixture between them was also estimated. For silvereyes, the number of
11
founding individuals in each island, the duration of the population bottleneck following
initial introduction, and the stable effective population size on each island were estimated.
Both these scenarios are too complex to be addressed using traditional statistical methods,
such as FST. One limitation of such inferences, however, is that they require specialised
programming skills, which many biologists lack.
Table 2.2. Computer programs for population genetic analyses that employ Bayesian analyses Program Description and References
Structure Assignment program that employs a clustering algorithm to assign individuals into predefined
number of populations (K). Uses genotype data from co-dominant, unlinked, diploid genetic loci,
and assumes Hardy-Weinberg equilibrium. No prior information about where individuals were
collected from is required. Individuals can be assigned completely to a single population, or to
more than one population (i.e. intercrossed individuals) (Pritchard et al. 2000; Falush et al. 2003;
2007).
Partition Similar to Structure, Partition employs a Bayesian model to identify genetic subdivisions and to
assign individuals into populations. Uses genotype data from co-dominant, unlinked, diploid
genetic loci, and assumes Hardy-Weinberg equilibrium. Assumes that all individuals are of pure
ancestry, i.e. does not allow for the presence of admixed individuals (Dawson and Belkhir 2001).
Geneland Package in R that detects population subdivision. Uses genotype data from co-dominant,
unlinked, diploid genetic loci, and assumes Hardy-Weinberg equilibrium. Takes into account the
spatial position of samples when determining the most likely number of population subdivisions,
and outputs a graphical distribution of the population subdivisions (Guillot et al. 2005a; Guillot et
al. 2005b).
BAPS Assignment program that estimates the number of populations and assigns individuals into them.
Uses genotype data from co-dominant, unlinked, diploid genetic loci, and assumes Hardy-
Weinberg equilibrium. Like Structure, individuals can belong entirely to one population, or their
genotype can be partitioned into multiple populations. BAPS is different from Structure in that the
analysis is performed at the level of predefined population units rather than at the level of the
individual, and prior information about the geographic sampling design is used to inform the
analysis (Corander et al. 2004).
NewHybrids Specifically tests for and categorises (F1, F2, or backcrossed) recently admixed individuals. Uses
genotype data from co-dominant, unlinked, diploid genetic loci, and assumes Hardy-Weinberg
equilibrium in parent populations (Anderson and Thompson 2002).
BayesAss+ Estimates recent migration rates between populations. Uses genotype data from co-dominant,
unlinked, diploid genetic loci, and assumes Hardy-Weinberg equilibrium. Requires all source
populations of migrants to be sampled, and estimates each individual’s immigrant ancestry, the
generation in which immigration occurred and inbreeding levels within populations (Wilson and
Rannala 2003).

12
2.1.2. Non-equilibrium populations
Many population genetic analyses, including FST, assume that the populations under
investigation are in equilibrium between random genetic drift, mutation and migration.
Such assumptions about equilibrium are often not met in the biological world. For invasive
species, populations may have undergone a recent population bottleneck (e.g. Puillandre et
al. 2008) and/or range expansions (e.g. Estoup et al. 2001), been sourced from multiple
sub-populations (e.g. Kolbe et al. 2004) and/or be under new selection regimes (e.g.
Carroll 2007). Populations of endangered species may have undergone a rapid population
reduction and populations may have become recently fragmented (Pearse and Crandall
2004). Even in well established species there can be a lack of regional or local equilibrium
due to such factors as unequal migration or gene flow between regions, sporadic gene flow,
meta-population (sub-populations subject to local extinction and re-colonisations events)
dynamics and insufficient time having past since ancient range expansion or contractions
(e.g. from the contraction or growth of glaciers) for equilibrium to have become
established (Crispo and Hendry 2006; Bay et al. 2008). There is therefore a need for
analyses that are not strongly dependent on population equilibrium to be accurate.
Bayesian and Maximum likelihood (the latter estimates the parameters of a model that
maximise the probability of the data under that model, Excoffier and Heckel 2006)
analyses are especially useful in investigating populations which may not be in
equilibrium. As such measures depend on few assumptions and estimate all parameters
simultaneously, they can be very robust or even independent of assumptions about
population equilibrium (Pearse and Crandall 2004; Hänfling and Weetman 2006). The
population genetic analysis introduced cane toads and silvereye birds of Estoup et al.
(2001; 2003), for example, were specifically designed to not rely on assumptions about
population equilibrium.
Population equilibrium can occur on different scales. While equilibrium may have been
reached on a regional scale, the small subpopulations that make up the larger population
can still show departure from mutation-drift-migration equilibrium. One example is
includes the fish Acanthochtomis polycanthus in the Great Barrier Reef in Australia, which
shows isolation-by-distance type genetic structuring on the regional (i.e. continental shelf)
scale, consistent with overall population equilibrium (Hutchinson and Templeton 1999);
but shows unequal migration rates, strong population structure and variation in genetic

13
diversities, consistent with meta-population type population dynamics (i.e. local
subpopulations not in equilibrium) on the scale of the individual reefs (Bay et al. 2008).
Equally, Hänfling and Weetman’s (2006) investigation of river sculpin fish (Cottus gobio),
in the River Rye in Europe, found regional equilibrium, demonstrated by isolation-by-
distance type population structure (Hutchinson and Templeton 1999). Evidence was also
found, however, that the populations at river headwaters showed signs of population
bottlenecks. The authors therefore postulated that headwater populations may be prone to
cycles of decline and recovery and hence may never obtain equilibrium. Conversely, a
species could be in equilibrium on the local scale but not at the regional scale.
Subpopulation of the European alpine plant Arabis alpina, for example, were shown to be
in mutation-drift equilibrium in some regions, while the overall population showed strong
departure from equilibrium (Ansell et al. 2008). The findings of wide-scale population
genetic studies should be therefore interpreted with caution, as population equilibrium
could be present at one scale but not another.
2.2. A brief introduction to invasive species
For the purpose of this chapter, an invasive species can be defined as any species that has
been translocated from its indigenous environment to a new environment and successfully
established a self-sustaining population. Such translocations can result from natural
processes, such as long-distance dispersal events (e.g. silver-eye birds, Zosterops lateralis,
colonised New Zealand from Australia in 1830 (Estoup and Clegg 2003)) or the formation
of dispersal pathways between previously isolated environments (e.g. the formation of land
bridges between previously isolated continents or islands; hydrological rearrangement river
catchments). The exchange of organisms between regions has undoubtedly played an
enormous role in the shaping the evolution of life on this planet.
Humans have always taken with them a host of organisms as they travelled across the
planet. These organisms include parasites (e.g. tapeworms and lice), scavengers (e.g. rats
and mice) and useful organisms that were translocated intentionally (e.g. pets, livestock
and crops). In recent times, the rate of such anthropomorphic translocation of species has
rapidly increased to the extent that invasive species are now recognised as having a
negative effect on the world’s biodiversity that is second only to habitat destruction and
habitat fragmentation (Sakai et al. 2001; Allendorf and Lundquist 2003; Zanden 2005).
14
There is therefore much interest in the study and control of invasive species. Invasive
species also offer the opportunity to study evolution in action, as both the invasive species
must evolve to meet the challenges of their new environment, and organisms in the invaded
environment must evolve to survive the impact of the newly established species.
The invasion of an environment by a new species typically has three phases: the initial
introduction; a lag period where the species remains localised and is either evolving to
meet the challenges of its new novel environment and/or building up it numbers; and
finally range expansion, where the species becomes truly invasive and starts colonising
new regions. These phases are described in detail in Sakai et al. (2001) and Allendorf and
Lundquist (2003) and will not be discussed further here.
There are two paradoxes that commonly arise in the study of invasive species. Firstly, how
can any species become invasive when it must compete with indigenous species that have
had a much longer time to adapt to local conditions? Secondly, how is it possible that
invasive species manage to thrive and evolve in a new environment, when the process of
introduction likely includes a genetic bottleneck (i.e. a small number of individuals are
translocated, which carry only a random sub-sample of the species’ overall genetic
diversity), which should leave the species genetically depauperate and prone to inbreeding
depression? These two paradoxes are addressed in the sections below.
2.2.1. Paradox 1: How does any species manage to invade a new environment that already
appears to be occupied by well-adapted indigenous species?
The success of an introduced species in a new environment tends to be idiosyncratic and
context-dependant, with very few general traits that characterise good invaders, or
environments that are vulnerable to invasion (Colautti et al. 2006; Moles et al. 2008).
Never-the-less, a number of traits have been shown to be significantly correlated with the
invasiveness of introduced species and with the invasibility of an environment.
Invasiveness traits including propagule pressure (i.e. many individuals released into the
new environment), the invasive species being commensal with human activities (e.g.
introduced livestock or crops), high germination rate (in invasive plants), high reproductive
output, and the ability of the invasive species to specialise in using an ecological niche that
is not being exploited fully in the invaded environment (Cassey et al. 2005; Colautti et al.
2006). Predictors of invasibility of an environment include high propagule pressure of the
15
introduced species, the habitat being disturbed (generally by human activities), and there
being high resource availability (Colautti et al. 2006). Consistent with this, Moles et al.
(2008) theoretically and empirically demonstrated that a strong predictor of invasiveness
and invasibility is where invasive species can occupy an ecological niche in the invaded
environment that is not being used by indigenous species, as commonly occurs in
environments that have been disturbed by human activities.
Invasive species have also been shown to benefit from escaping their native parasites,
predators or competitors (Allendorf and Lundquist 2003; Frankham 2005). In addition,
some invasive species may simply be more competitive than the indigenous species.
Examples include the replacement of all thylacines (Thlacinus cynocephalus) and
Tasmanian devils (Sarcophilus harrisii) on mainland Australia by dingoes (Canis
familiaris dingo) that were introduced from New Guinea around three thousand years ago
(Paddle 2000; Savolainen et al. 2004), and the replacement of practically all indigenous
marsupials in South America with ecologically equivalent North American placental
mammals when a land bridge formed between the two continents around three million
years ago (Flannery 2001). This greater competitiveness could stem from the invasive
species evolving in a more competitive environment (Callaway and Aschehoug 2000).
2.2.2. Paradox 2: How can invasive species survive and evolve in a new environment, after
the genetic bottleneck of the introduction process?
Pulliandre et al. (2008) identified three types of introduction: continuous expansion after
the permanent removal of a natural barrier, several discrete introductions from several
native populations, and a single introduction from a single source. For the first two types of
introduction, there are no problems with reduced genetic diversity and subsequent
inbreeding depression and lack of evolvability. If a natural barrier is removed, by the
opening of a canal, for example, a continuous stream of the introduced species will be able
to disperse into the new environment and the colonising species will subsequently have
similar levels of genetic diversity to their founding population. Examples include two
rabbit fishes (Siganus luridus Rüppell and Siganus rivulatus Forsskål) and one goat fish
(Upeneus moluccensis Bleeker) that invaded the Mediterranean Sea from the Red Sea after
the opening of the Suez Canal, and show no signs of reduced genetic variability and no
significant genetic differentiation from their source populations (Hassan et al. 2003;
Hassan and Bonhomme 2005; Hänfling 2007). When several introductions from several

16
source populations occur, levels of genetic diversity can be similar or even greater than in
the species native range. The green anole lizard, for example, was repeatedly introduced to
Florida from a number of different source populations in its native range in Cuba, and
subsequently shows greater genetic diversity in Florida than in any one location in Cuba
(Kolbe et al. 2004). Most introductions, however, come from a single source population
and a single introduction event and show reduced levels of genetic diversity relative to
their source populations (Puillandre et al. 2008).
There are a host of reason why species sourced from a single population in a single or
small number of introduction events can still become invasive. These are summarised
below:
1. Inbreeding depression is a stochastic probability, not a certainty. Introduced species
with reduced genetic variability can subsequently still be genetically viable in their
new environment.
2. Asexual and self-fertilising plants are often not vulnerable to inbreeding depression
(Frankham 2005)
3. Rapid population growth following introduction can minimise the subsequent loss
of genetic diversity. An example of this is the introduction of rabbits into Australia
(Zenger et al. 2003).
4. A genetic bottleneck can actually increase the genetic variation in a population,
through the epistatic interactions between loci, and through increased frequency of
recessive alleles that were rare in the parent population but more frequent in the
introduced population (Hänfling 2007). Such an increase in genetic variation has
been observed in introduced populations of invasive guppy fish (Poecilia
reticulata) in Queensland (Lindholm et al. 2005).
5. The genetic drift associated with a population bottleneck can allow alleles that are
advantageous in the new environment to become fixed, possible even ‘jumping’
across fitness valleys (Hänfling 2007). A good example of this chance fixation of
advantageous alleles is the introduced fire ants (Linepithema humile) in Chile,
Bermuda, and the United States. The loss of genetic diversity in these is associated
with reduced inter-colony aggression and subsequently ecological success (Tsutsui
et al. 2000).

17
2.2.3. Hybridisation and invasive species
The success of some invasive species is closely linked with hybridisation. This
hybridisation can occur between closely related species or between divergent lineages
within this same species; and can occur between introduced and native species/lineages,
and between two introduced species/lineages. Hybridisation can lead to the formation of
invasive lineages by creating new, novel combinations of alleles for selection to act upon
(Hänfling 2007). An example of this is an invasive hybrid lineage of sculpins (Cottus sp.)
in the River Rhine. These sculpins show novel habitat adaptations and life-history
characteristics which allow them to colonise downstream river habitats that are not suitable
for either parental taxa. They likely formed through secondary contact and interbreeding
between lineages that were previously geographically separate (allopatric) (Nolte et al.
2005). Even if early-generation hybrids have low fitness, hybridisation can still prove
beneficial as it can allow advantageous alleles (e.g. alleles associated with resistance to
local diseases) to be incorporated into the gene pools of invasive populations (possible
from interbreeding with related, indigenous species) without the large-scale mixing of
genomes (Hänfling 2007).
Hybridisation can also lead to changes in chromosome number (ploidy), creating lineages
that have one or two complete sets of chromosomes from two separate species
(allopolyploid lineages). These lineages can be capable of, or limited to, asexual
reproduction (parthenogenesis). They can subsequently have greatly elevated levels of
reproductive output, as all individuals are capable of producing offspring (c.f. only the
females in diploid, sexually reproducing species) (Hänfling 2007). Polyploidy lineages can
also have high levels of genetic diversity upon which natural selection can act, even if they
are limited to asexual reproduction, as they carry the full genomes of two separate species
(Hänfling 2007). An example of an invasive, allopolyploid lineage is the gibel carp
(Carassius auratus gibelio Bloch). This species colonised Europe from the Far East in the
early 20th Century and has since been progressively expanding westward (Zhou and Gui
2002; Hänfling 2007).
2.3. What are Common Carp?
The word ‘carp’ is applied to many species of freshwater fish. Examples include the grass
carp (Ctenopharyngodon molitorella), the silver carp (Hypopthalmichthys molitrix), the
black carp (Mylopharyngodon piceus), the Indian major carps (Cirrhinus mrigala, Catla
18
catla, Labeo rohita), European crucian carp (Carassius carassius), Japanese crucian carp
(Carassius cuvieri) and the Prussian carp (Carassius auratus gibelio). The name ‘common
carp,’ however, refers to Cyprinus carpio L. All uses of the word carp in this review refer
to the common carp, unless otherwise stated.
Common carp belong to the Order Cypriniformes and the family Cyprinidae. The family
Cyprinidae (cyprinids) is one of the most speciose families of freshwater teleost fish in the
world, containing seven subfamilies, 220 genera and approximately 20,000 described
species. Examples include carps, barbs, minnows, roaches, rudds, daces, bitterlings,
rasboras, danios and gudgeons (Howes 1991).
Common carp are characterized by the following traits: forked tail (caudal fin); no teeth in
the mouth; three rows of pharyngeal teeth on the lower element of the last gill arch, the
outer two rows of these pharyngeal teeth each having one tooth and the inner row having
three teeth (1,1,3:3,1,1 arrangement, which separates common carp from many other
Cyprinid species); 33–40 lateral-line scales; and two pairs of fleshy whiskers (barbels) on
either side of the mouth, with the posterior pair being longer than the anterior pair (Koehn
et al., 2000). These features (bar the toothless mouth) are illustrated in Figure 2.1, along
with some other basic features of common carp anatomy. Common carp are typically full-
scaled and coloured silvery-black/grey, olive-green or yellow-brownish on their backs,
softening to pale yellow or cream on their bellies (Kirpichnikov 1981; Balon 1995;
Lintermans 2007), although many colour and scale variants occur in both wild and
cultivated populations (see section 2.5. Morphological Variation).

19
Figure 2.1. Key morphological features of common carp. Image supplied by D.M.
Gilligan.
2.4. Biology of Common Carp
Carp are ecological generalists. They are tolerant to oxygen levels as low levels as 7 per
cent saturation, high levels of turbidity, moderate salinity (14%), a wide range of
temperatures (2-40.6°C) and high levels of toxicants (Koehn 2004). They prefer mid-
latitude, low-altitude, slow-flowing rivers and standing waters (lakes, dams, billabongs
etc.) and are less common in cool, swift-flowing streams (Koehn et al. 2000). In Australia,
carp are generally rare at altitudes greater than 500 metres above sea level in NSW (Koehn
et al. 2000; Gilligan and Rayner 2007), although a large carp population is present in the
upper reaches of the Murrumbidgee catchment around the township of Cooma, at an
elevation of approximately 798 metres; and they occur at other sites in NSW as high as 900
metres (Gilligan, unpublished data).
Carp are bottom feeders, sucking sediments into their mouths and expelling indigestible
particles through their gill openings (Koehn et al. 2000). Their diet varies depending on
what foods are available, but they are known to eat microcrustaceans, aquatic insect larvae,
20
molluscs, swimming and terrestrial insects and seeds and other plant matter (Hume et al.
1983a; Koehn et al. 2000; Khan 2003).
In Australia, common carp have been observed to spawn in waters that show seasonal
temperatures of between 17-29°C (Hume et al. 1983b; P. Gehrke, unpublished data, cited
by Koehn et al. 2000). While spawning normally occurs in spring through to autumn in
Australia (Smith 2005), year-round spawning has been observed in the invasive carp
population in the Botany Wetlands in Sydney, Australia (Pinto et al. 2005). Carp migrate
to and from appropriate spawning grounds during breeding season, sometimes travelling
hundreds of kilometres (Balon 1995; Stuart and Jones 2006). Eggs are sticky and are laid
on submerged vegetation (Balon 1995; Koehn et al. 2000; Horváth et al. 2002). This
stickiness has been hypothesised as facilitating carp dispersal, as eggs can stick to the feet
of water fowl and be subsequently transported between waterways (Gilligan and Rayner
2007). Flood conditions are especially favourable to carp spawning, as they provide
abundant food resources for adults and abundant vegetation for the attachment of eggs and
result in plankton blooms to provide food resources for growing larvae and juveniles.
2.5. Common carp as an invasive species
The native range of common carp extends from Japan (Mabuchi et al. 2005) to the River
Danube in Eastern Europe (Balon 1995). Human activities associated with the cultivation
and domestication of carp for food and for ornamental characteristics, however, have
introduced common carp into many new waterways throughout Asia, Africa, the Americas,
Oceania, Australia and New Zealand (Koehn 2004). Climate and habitat-matching studies
indicate that carp have great potential to further expand their range in Australia (Koehn
2004) and the Americas (Zambrano et al. 2006), and to a limited extent in Africa (Costa-
Pierce et al. 1993)..
In Australia, common carp are a highly invasive species. They are established in all states
and territories, except the Northern Territory (Koehn 2004). They are the dominant species
in the MDB, being present in practically all parts of the basin (Lintermans 2007), except
where colonisation is limited by unsuitable habitat (e.g. upper Murray) (Gilligan and
Rayner 2007), weirs or waterfalls (Koehn et al. 2000; Graham et al. 2005); reaching
densities of up to 11,316 individuals per ha (7,700 individuals ≤100mm in length, 3 616
individuals >100mm) in some regions (Reid et al. 1997); and constituting 85.9% of total

21
fish biomass in the Murrumbidgee drainage (Gilligan 2005). Carp are also common in
many coastal waterways (Koehn 2004). A small population is present in the interconnected
Lakes Crescent and Sorell in Tasmanina, although extensive effort has been made to
eradicate or control these populations and they will likely be extirpated in the near future
(Inland Fisheries Service 2007). The range of carp in Australia is illustrated in Figure 2.2.
Figure 2.2. Australian catchments where introduced carp have established self-
sustaining populations (map supplied by D.M. Gilligan, 2008).
The only other freshwater fish species with comparable invasiveness in Australia is the
goldfish. This species is even more widely distributed than common carp, being present in
most of MDB (Lintermans 2007), around urban centres (Brumley 1991), in the Lake Eyre
drainage (in which carp are not established) (Koehn 2004) and in many carp-free rivers in
Western Australia (Morgan et al. 2004). As millions of goldfish are imported annually for
the aquarium industry, range expansion via the release of individuals and greater
invasiveness through the addition of genetic variation is likely (Brumley 1991).
Fortunately, despite their widespread distribution, goldfish are far less destructive than
carp, and comprise only a small percentage of the total number of fish in the MDB

22
(Faragher and Lintermans 1997), and only 0.5% of the biomass in the Murrumbidgee
catchment (Gilligan 2005).
The success of carp in the MDB can be explained, at least in part, by the heavy
modification of the basin by human activities since European settlement. As described
previously in section 2.1, Moles et al. (2008) demonstrated that in habitats recently
modified by human activities, new ecological niches are created that are not fully occupied
by indigenous species, and introduced species have a much greater change of becoming
invasive if they are preadapted to utilising these newly created niches. The development of
water resources for agriculture, hydroelectricity, flood mitigation, and domestic use in the
MDB has required the construction of many dams, weirs, reservoirs and irrigation canals,
and has made some wetlands more permanent. These still-water environments are ideal
habitats for carp. In addition, human activities have increased the levels of pollution,
salinity and nutrient runoff, all of which carp are tolerant of (Koehn et al. 2000). These
same modifications have been largely detrimental to native fish species, because the
natural flow regimes of the rivers to which the native species are adapted have been
drastically altered; the stability of the human-controlled environment favours only a small
number of native species; cold water released from the lower levels of dams inhibits native
species’ ability to spawn; dams and weirs prevent migration; and native fish are largely
intolerant of high levels of pollution, salinity and nutrient runoff (Koehn et al. 2000). Carp
in the MDB are, in effect, occupying newly created ecological niches that the native fish
have not evolved to utilise. This is confirmed by Koehn (2004), who compared 13 species-
specific attributes in carp and in abundant native fish species, and found that carp in the
MDB differed clearly from native species in their behaviour, resource use and population
dynamics.
In addition to occupying ecological niches not occupied by native species, carp may simply
be a ‘good’ invasive species. While invasions success of an introduced species can be
difficult to predict and highly idiosyncratic (Colautti et al. 2006; Moles et al. 2008), Koehn
(2004) compared the ecological, behavioural, life history and genetic characteristics of
Australian common carp with those of other invasive fish species and identified eleven
characteristics that common carp share with these other invasive fish. These characteristics
are summarised in Table 2.3. Taken individually, any one of these traits would be unlikely

23
to predict invasiveness in common carp. Taken together, however, these 11 traits make a
strong case that carp are fundamentally well adapted to invading new environments.
Table 2.3. Attributes of carp as an invasive species; modified from Koehn (2004). Attribute Details
History of invading
many areas
Introduced and successfully established throughout Europe, Asia, Africa, North
America, South and Central America, Australia, New Zealand, Papua New
Guinea and some islands in Oceania
Wide environmental
tolerances
High environmental tolerances, with temperature tolerance ranging from 2 to
40.6 °C, salinity tolerances up to about 14 % (40% the salinity of seawater) and
pH from 5.0 to 10.5, oxygen levels as low as 7% saturation.
High genetic variability At least four strains have been introduced into Australia: Yanco, Prospect,
Boolara, and Japanese koi (see section 2.11.3. Population genetics of common
carp in Australia)
Early sexual maturity Males as early as 1 year, females as early as 2 years
Short generation time 2-4 years
Rapid growth Hatching of eggs is rapid (2 days at 25 °C) and newly hatched carp grow very
quickly
High reproductive
capacity
They are highly fecund broadcast-spawners with egg counts as high as 2 million
per female
Broad diet Omnivore/ detritivore
Gregariousness Carp, like many other invasive fish species, form schools
Possessing natural
mechanisms of dispersal
A mobile species with fish moving between schools. Dispersal can also occur
with the downstream drift of larvae. Rates of transfer can be increased by
conditions such as flooding
Commensal with human
activity
Bred as an ornamental and aquaculture species, used as bait and sought by some
anglers
2.6. Domestication
Common carp have a long history of domestication. They have been reared in ponds in
China as early as the 5th century B.C.E. (Horváth et al. 2002), and in Europe by monks as
early as the Middle Ages (Balon 1995). Balon (1995) argues for an even older
domestication of common carp in Europe, suggesting that carp were first domesticated by
the Romans in the 1st and 2nd centuries C.E. This argument is based on evidence that the
Romans maintained ponds for freshwater fish, that carp were an important food source in
Roman settlements along the River Danube, and that common carp are sufficiently robust
24
to survive being transported from the River Danube to man-made ponds in Western
Europe, provided that they are wrapped in wet moss. There is, however, no direct evidence
to support this theory. Balon (1995) also disputes early domestication of common carp in
China, arguing that the fish stocked in early Chinese ponds could have been other carp
species, such as grass carp, silver carp or the Indian major carps, rather than Cyprinus
carpio. While it is difficult to verify exactly which species were reared in ancient China,
there is currently a wealth of aquaculture carp strains in China that have been derived from
indigenous wild populations and have a long history of cultivation (Kohlmann et al. 2003;
Zhou et al. 2004a; Zhou et al. 2004b; Kohlmann et al. 2005). Xingguo red carp, for
example, have been cultivated for approximately 1,300 years (Zhou et al. 2004a). Even if
common carp domestication in China does not date back to the B.C.E. period, it has been
in practice in this region for over 1,000 years.
Today common carp are a globally important species. Being fecund and robust, they are
ideal for aquaculture and as such are farmed extensively throughout Eurasia, and to a lesser
extent in North and South America (Zambrano et al. 2006) and Africa (Costa-Pierce et al.
1993). In Asia they are typically grown in polyculture ponds with 3-5 other fish species,
each exploiting a different ecological niche in the pond (Koehn et al. 2000). The harvesting
of common carp for food, both from the wild and from aquaculture, has been growing
steadily since the late 1970s, surpassing the production of all salmonoid species combined
in 1997, and was estimated to be in excess of 3 million tons in 2006 (FAO 2008). Common
carp are subsequently an important source of protein and income for many people. The
trade in ornamental Japanese koi carp is also worth millions of dollars annually (Balon
1995).
Due to their enormous natural range and long history of domestication, carp exhibit much
morphological variation (see section 2.7 below). They can be divided into at least four
naturally occurring subspecies and innumerable domestic strains and evolutionary
significant units (ESUs) (see sections 2.8 and 2.9).
2.7. Morphological variation
Wild carp are typically torpedo-shaped, full-scaled, and coloured silvery-black/grey, olive-
green or yellow-brownish on the dorsal surface, softening to pale yellow or cream on the
ventral surface and flanks (Kirpichnikov 1981; Balon 1995; Lintermans 2007). Variations
25
in scale morphology, colour and body shape, however, are common in both wild
populations and domestic strains.
Domestic carp are typically rounder and plumper-bodied than wild carp (Michaels 1998).
Feral population of domestic carp, however, revert to a wild-type body shape soon after
establishment (Balon 1995). Traits such as dwarfism, the absence of ventral fins, the
presence of an additional fin, elongated fins and a dolphin-like head have also been
reported in both wild and domestic populations (Kirpichnikov 1981; Wang and Li 2004).
‘Mirror’ scales are a common feature of domestic carp strains. These scales are larger and
shinier than ordinary scales, and usually do not cover the entire body (Kirpichnikov 1981).
The absence of normal scales has been favoured by artificial selected in domestic fish to
make them easier to de-scale for cooking (Michaels 1998). According to Kirpichnikov
(1981), the inheritance of mirror scales is controlled by two loci, S and N. Depending on
genotype at the two loci, a carp may have scattered mirror scales (‘scatter scale’
phenotype), a single line of mirror scales running along its flanks (‘linear mirror’
phenotype), no scales or almost no scales (‘nude’ or ‘leather’ phenotype), or a full cover of
normal scales (wild-type phenotype) (Kirpichnikov, 1981). The scale phenotypes and
genotypes described by Kirpichnikov (1981) are summarised in Figure 2.3. The extent of
scale covering in mirror-scaled individuals is not entirely governed by these two loci.
Nicolescu (2004), for example, observed nude phenotype individuals in the absence of the
N allele, presumably as an extreme variant of the scatter scale phenotype (ssnn). Mirror-
scaled carp are found in wild and domestic populations of European and Asian carp
(Kirpichnikov 1981). About five per cent of Australian feral carp have mirror-scale
phenotypes (Koehn et al. 2000), with both the scattered and linear phenotypes being
observed (personal observations).

26
A. Full covering of normal scales (wild-type) SSnn, Ssnn
B. Scattered mirror scales ssnn
C. Linear mirror scales SSNn, SsNn
D. Nude or leather ssNn
Figure 2.3. Phenotypes and hypothesised genotypes of scale morphs in common carp,
as controlled by the genes S and N. The genotypes have been inferred from extensive
multi-generational breeding experiments. Individuals with genotypes SSNN, SsNN or
ssNN are presumed to be non-viable embryos. The large, shiny scales in phenotypes
B-D are referred to as “mirror scales.” Note that much variation in the location and
number of mirror scales occurs, and that the illustrations here only represent ‘ideal’
scattered mirror, linear mirror and nude common carp. Information and illustrations
taken from Kirpichnikov (1981).
Reported colour variations include golden, red, blue, orange, steel, green, albino, yellow,
lemon-yellow, green, violet and brown. These variants are reported in both wild and
domestic populations (Kirpichnikov 1981; Bialowas 2004; Wang and Li 2004). In
particular, red, golden and orange individuals are found amongst domestic and wild
populations in both Europe and Asia (Kirpichnikov 1981; Balon 1995). Selective breeding
for individuals for these novel colourations has led to the production of fancy carp, or koi,
in Japan. Koi have been bred in Japan for at least 190 years, although the beginning of koi
27
farming might actually be far older (Balon 1995). Koi are now available in a wide range of
colours, colour patterns, scale morphologies and body shapes.
2.8. Subspecies of common carp
The division of a species into subspecies is not always clear-cut. Biological systems rarely
consist of discrete units beyond the level of the individual. Rather, they exist as a
continuum of gene flow through space and time. Common carp have an enormous natural
range and show much regional variation. Dividing the most divergent groups into
subspecies is therefore a natural extension of their taxonomic classification, although there
is no definitive way to decide where regional variation ends and subspecies status begins.
Common carp are frequently separated into two subspecies: the central-Asian/European C.
carpio carpio and the east-Asian subspecies C. carpio haematopterus. This separation is
well supported by microsatellite and mitochondrial genetic data (Kohlmann et al. 2003;
Zhou et al. 2003; Zhou et al. 2004b; Kohlmann et al. 2005). The separation of south-east-
Asian carp into an additional subspecies, C. carpio viridiviolaceus/ rubrofuscus, on the
basis of mitochondrial sequence and morphological differences, has been suggested by
some researchers (e.g. Kirpichnikov 1981; Zhou et al. 2004b). A central-Asian subspecies,
C. carpio aralensis, was proposed by Kirpitchnikov (1967, cited by Balon, 1995).
However, Kohlmann et al. (2003; 2005) and Memiş and Kohlmann (2006) demonstrated
that European and central-Asian carp are closely related, with the latter comprising a subset
of the genetic diversity of the former. The authors subsequently classified both European
and central-Asian carp as subsp. carpio.
A unique Japanese subspecies may also exist. Mabuchi et al. (2005; 2008) investigated
mitochondrial control region and cytochrome b sequences from a morphologically distinct
lineage of carp indigenous to Lake Biwa, Japan. Phylogenetic analysis placed this Lake
Biwa (LBW) strain basal to all other carp strains investigated, indicating its ancient origin.
Although not suggested by the authors, the uniqueness of this lineage could warrant it
being classified as a subspecies or even a separate species.
The natural distribution of common carp subspecies is illustrated in Figure 2.4.
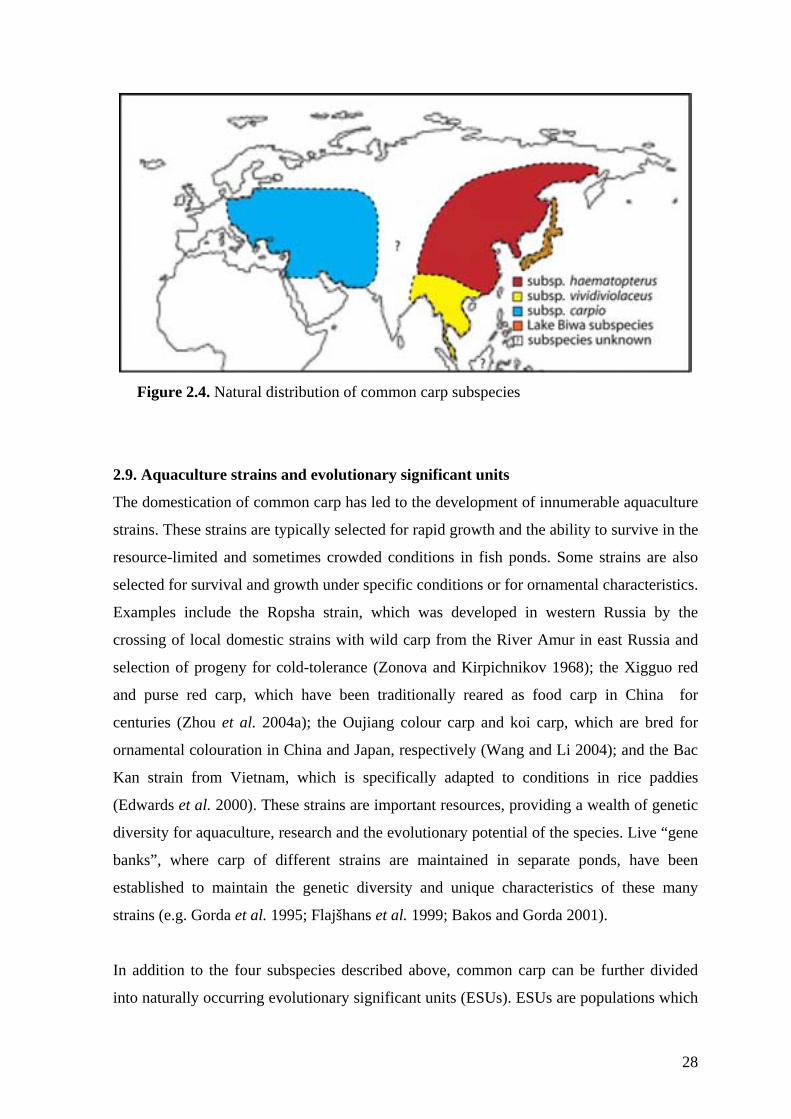
28
Figure 2.4. Natural distribution of common carp subspecies
2.9. Aquaculture strains and evolutionary significant units
The domestication of common carp has led to the development of innumerable aquaculture
strains. These strains are typically selected for rapid growth and the ability to survive in the
resource-limited and sometimes crowded conditions in fish ponds. Some strains are also
selected for survival and growth under specific conditions or for ornamental characteristics.
Examples include the Ropsha strain, which was developed in western Russia by the
crossing of local domestic strains with wild carp from the River Amur in east Russia and
selection of progeny for cold-tolerance (Zonova and Kirpichnikov 1968); the Xigguo red
and purse red carp, which have been traditionally reared as food carp in China for
centuries (Zhou et al. 2004a); the Oujiang colour carp and koi carp, which are bred for
ornamental colouration in China and Japan, respectively (Wang and Li 2004); and the Bac
Kan strain from Vietnam, which is specifically adapted to conditions in rice paddies
(Edwards et al. 2000). These strains are important resources, providing a wealth of genetic
diversity for aquaculture, research and the evolutionary potential of the species. Live “gene
banks”, where carp of different strains are maintained in separate ponds, have been
established to maintain the genetic diversity and unique characteristics of these many
strains (e.g. Gorda et al. 1995; Flajšhans et al. 1999; Bakos and Gorda 2001).
In addition to the four subspecies described above, common carp can be further divided
into naturally occurring evolutionary significant units (ESUs). ESUs are populations which

29
are (1) substantially reproductively isolated from other conspecific units and (2) represent
an important component of the evolutionary legacy of the species (Waples 1991). While
delimiting ESUs is at least partially subjective, Moritz (1994) suggests that that ESUs can
be identified by the presence of reciprocally monophyletic mitochondrial lineages among
areas, coupled with a corresponding divergence in nuclear allele frequencies. To date, I
know of no comprehensive study addressing the total number of wild carp ESUs around
the world for conservation. However, the genetic structuring detected between natural
populations (Kohlmann et al. 2005) indicates that at least some must exist beyond the four
subspecies. At a minimum, one naturally occurring population from each major river basin
in carp’s natural range could be proposed as ESUs. The genetic integrity of many carp
ESUs is threatened by the release of aquaculture strains into waterways (Balon 1995; 2004;
Mabuchi et al. 2005; Mabuchi et al. 2008). Like aquaculture strains, though,
representatives of wild carp populations – that could be ESUs - are also maintained in live
gene banks.
2.10. Population Genetics of the Common Carp
There have been numerous population genetic studies on common carp throughout the
world. These studies have utilised morphological markers, microsatellites, allozymes and
mitochondrial DNA, and combinations of such genetic markers. Key studies are listed in
Table 2.4.
The majority of population genetic studies have been performed at a local level, comparing
a small number of populations that are geographically close together (e.g. Desvignes et al.
2001). More recently, however, large-scale studies have been performed that compare
multiple populations/strains of carp from across Europe and Asia (Froufe et al. 2002;
Kohlmann et al. 2003; Kohlmann et al. 2005; Thai et al. 2005). These studies have
provided fresh insights into the taxonomy, evolutionary origin, demographic history and
the genetic variation and structure of common carp populations. The taxonomy of carp is
addressed in sections 2.1, 2.6 and 2.7. The evolutionary origin and demographic history
and the genetic variation and structure are summarised in the following sections.

30
Table 2.4. Population genetic studies of common carp Regions sampled Genetic markers used Reference Europe, Asia Morphology Svetovidov (1933) and Mišĭk (1958),
cited by Balon (1995) Australia (feral carp) Allozymes, morphology Shearer and Mulley (1978) Japan Allozymes Macaranas et al. (1986) Italy Allozymes Catuadella et al. (1987) Indonesia Allozymes Sumantadinata and Taniguchi (1990)Estonia Allozymes Paaver and Gross (1991) Hungary Allozymes Csizmadia et al. (1995) Poland Allozymes Anjum (1995) Germany Allozymes Kohlmann and Kersten (1999) Australia (feral carp) Allozymes, mitochondrial
RFLP Davis et al. (1999)
Israel Allozymes Ben-Dom et al. (2000) France, Czech Republic Allozymes, microsatellites Desvignes et al. (2001) Czech Republic Allozymes Slechtova et al. (2002) Europe, East Asia mitochondrial PCR-RFLP Gross et al. (2002) Austria and Hungary (River Danube), Japan (koi), East Russia (River Amur)
Mitochondrial sequences Froufe et al. (2002)
Uzbekistan Allozymes Murakaeva et al. (2003) Europe, Middle East, Central Asia, East Asia, South East Asia
Allozymes, microsatellites, mitochondrial PCR-RFLP
Kohlmann et al. (2003)
Europe, Asia Mitochondrial PCR-RFLP Zhou et al. (2003) East Asia, Eastern Europe Mitochondrial sequences Zhou et al. (2004b) East Asia (China) Microsatellites Zhou et al. (2004a) East Asia, Europe, South East Asia, Indonesia, India
Mitochondrial sequences Thai et al, (2005)
East Asia Mitochondrial sequences, RAPD analysis
Wang and Li (2004)
Europe, Central Asia, East Asia, South East Asia
Microsatellites Kohlmann et al. (2005)
Japan Mitochondrial sequences Mabuchi et al. (2005) Vietnam Mitochondrial sequences,
mitochondrial PCR-SSCP Thai et al. (Thai et al. 2006)
Turkey Microsatellites, mitochondrial PCR-RFLP
Memiş and Kohlmann (2006)
Japan Mitochondrial sequences Mabuchi et al. (2008) Europe and East Asia Mitochondrial sequences Wang and Li (submitted)
2.10.1. Evolution and demographic history of common carp
Carp most likely evolved from an ancestral species in east-Asia between 0.85 and 3.0
million years ago (Froufe et al. 2002). Evidence for this includes the presence of basal
mitochondrial lineages in east-Asia (Froufe et al. 2002; Mabuchi et al. 2005), and the
higher prevalence of private microsatellite alleles in east-Asia compared to Europe and
central-Asia (Kohlmann et al. 2005). While it is possible that carp evolved in central-Asian
or Europe and lost much genetic diversity in a severe bottleneck, this is a far less likely
scenario, as these regions lack the basal lineages detected in east-Asia. Carp have
unusually shallow levels of mitochondrial sequence divergence relative to other freshwater

31
fishes (Thai et al. 2006), indicating that their split from an ancestral species has been
relatively recent, or that they have undergone an extensive selective sweep.
From east-Asia, carp spread to central-Asia. From central-Asia, they colonised the
European catchments, most likely after the last glacial maximum (~19,000 years ago),
when fish from the Caspian Basin entered the Danube Basin (Kohlmann et al. 2003).
Although many authors assume that this colonisation was a natural event (e.g. Balon 1995),
Froufe et al. (2002) speculates that the colonisation of the Danube Basin could have been
human-mediated.
Carp underwent a severe bottleneck when colonising Europe. European carp hence show
less mitochondrial diversity than Asian populations. Froufe et al. (2002) detected no
polymorphism when sequencing the control region of 21 wild carp from the River Danube.
Kohlmann et al. (2003) detected only two composite haplotypes (H1 and H3) in 227
European carp sampled from 11 locations, when screening for polymorphisms of the ND-
3/4 and ND-5/6 loci using PCR-RFLP. One of these haplotypes (H3) was more likely a
result of contamination of local fish stocks with Asian carp rather than naturally occurring
variant in the European population. Further PCR-RFLP for ND-3/4 and ND-5/6 of carp in
Turkey by Memiş and Kohlmann (2006) revealed four additional haplotypes that differed
from haplotype H1 by only one or two restriction sites. Wang and Li (submitted) identified
some additional control region sequences in European carp, but these differed from the
sequences of Froufe et al. (2002) at only one or two sites.
2.10.2. Genetic variation and structure
Despite their relatively short evolutionary history, common carp show strong regional
variation (i.e. population structure). Almost all genetic studies to date have detected
significant differentiation (departure from panmixia, non-zero genetic distances and FST
values) between carp from different rivers and aquaculture stocks (e.g. Desvignes et al.
2001; Kohlmann et al. 2005). Kohlmann et al. (2005) detected one notable exception to
this among the many carp populations they analysed, with pairwise comparisons between
four wild central-Asian populations not revealing significant FST values. A wider study
including more free-living wild and feral populations of carp in adjacent waterways could
help resolve this. Generally, domestic populations have less genetic diversity and are more
genetically differentiated than wild populations (Kohlmann et al. 2003; 2005; Memiş and
32
Kohlmann 2006), which likely stems from domestic populations undergoing repeated
founder effects (leading to smaller effective population sizes) and having less dispersal
ability than wild populations.
2.10.3. Limitations of the population genetic studies of common carp
There are four main limitations to population genetics studies of common carp: sample
size, human-mediated movement, the apparent effect of domestication on genetic
variability, and the variability in markers used in different studies.
Insufficient sample sizes can lead to inaccurate representations of allele, genotype and
haplotype frequencies. Studies on simulated data by Kalinowski (2004), however, indicate
that small sample sizes can be compensated for by using a greater number of loci.
Human-mediated movement of carp can confound historical natural patterns of genetic
variation. Balon (1995), for example, described the wild “large, torpedo-shaped, fully-
scaled and gold-coloured carp” in the River Danube as “endangered… because of rampant
introduction of the domesticated form… a pure wild form may not exist anymore.”
Kohlmann et al. (2003) detected Asian mitochondrial haplotypes (haplotype H3) present in
the Danube (near Straubing, Germany). The active release of foreign strains into
Vietnamese ponds, mentioned by Thai et al. (2006), will no doubt affect the genetic
composition of the wild population, as escaped domestic fish find their way into the local
waterways and breed. Mabuchi et al. (2008) detected high levels of carp introduced from
Eurasia in Japanese waterways, stating that “almost half or more of the haplotypes in all of
the locations studied originate from domestic strains introduced from Eurasia.” Many
modern carp population are now composed of a mixture of the local strain of carp and of
escaped domestic carp, which can be derived from almost anywhere in the world.
Population genetic studies of common carp in the wild will increasingly reflect recent
patterns of human-mediated dispersal, rather than historical patterns of genetic variation.
There are some limitations to comparing free-living carp populations to domestic
populations. Differences in genetic diversity between regions can be used to work out
colonisation routes, and to detect ancient and recent bottlenecks. Results from population
genetic studies must be interpreted cautiously when comparisons are made between wild
33
and domestic populations, as the genetic diversity in the domestic populations will likely
be more reflective of modern breeding regimes than of long-term historical processes.
The fourth limitation of population genetic studies of common carp is that different studies
often use different combinations of loci and marker types, which presents a challenge if
one wishes to combine data. Furthermore, allozyme and microsatellite data from different
studies cannot be readily combined, even when the same loci are used, because scoring of
alleles is not consistent between the apparatus (e.g. gel rigs, sequencing machines) used by
different research groups, even for equipment of the same make and model. In addition,
different mitochondrial loci are favoured by different research groups, so the results of
many mitochondrial studies also cannot be combined for further analysis (see Table 2.5).
Inter-study comparisons are possible, though. Results concerning genetic diversity (e.g.
nucleotide diversity, mean allele diversity, allele richness, observed and expected
heterozygosity) or distance (e.g. FST, Nei’s genetic distances, Cavalli-Sforza & Edwards
distance) are comparable, even when different loci are analysed. Most studies report a
number of such measures, further facilitating such inter-study comparisons. Sequence and
RFLP data are also comparable, provided that the same loci are scored using the same
methods (region sequenced, enzymes used in the RFLP, etc.). Microsatellite and allozyme
data sets can also be combined, provided that the same loci are used, researchers are
willing collaborate to share allele scoring data (which is generally not published with the
original research article), and representative samples are made available from which to
calibrate allele callings (see 2.8.4 Future work below).

34
Table 2.5. Mitochondrial loci and analysis methods used in different studies of common
carp. Study Mitochondrial Loci Analysis method
Memiş and Kohlmann (2006),
Kohlmann et al. (2003),
Gross et al. (2002)
ND-3/4, ND-5/6 RFLP
Thai et al. (2006) control region sequencing, SSCP
Mabuchi et al. (2005) control region
cytochrome b
Sequencing
Thai et al. (2005) MTATPase6/ MTATPhase8
control region
Sequencing
Zhou et al. (2004a; 2004b) control region
cytochrome b
Sequencing
Zhou et al. (2003) ND-5/6
control region
RFLP (ND-5/6), sequencing
(control region)
Froufe et al. (2002) control region Sequencing
Davis et al. (1999)
Davis (1996)
complete mitochondrial
genomes
RFLP
2.10.4. Future Work
Future studies of the population genetics of common carp could aim to 1) identify genetic
units for conservation of wild and aquaculture populations, or control of carp where it is an
invasive species; and 2) learn more about the evolution and history of common carp. Such
studies would require a large-scale sampling regime that covers the entire range of carp. In
addition to neutral genetic markers, information about the morphology and ecology of the
carp under investigation could also be included, as some ESUs or strains may be
specifically adapted to local conditions without showing strong genetic differentiation from
neighbouring populations at neutral markers. Once population units have been determined,
recommendations can be made to government and industry bodies for the conservation of
wild and aquaculture strains, and for the control of feral populations. Inferences about the
population dynamics, history and evolution could also be made. These could also help
further inform conservation or control programs, by refining the delimiting of population

35
units, and by identifying aspects of carp biology relevant to their conservation or control
(e.g. recruitment dynamics).
Future work on common carp would be facilitated if a consistent suite of markers were
used between studies. Yue et al. (2004) list 21 unlinked microsatellite markers reported
from different studies, with the recommendation that they be adopted by different research
groups for the sake of consistency. Nineteen of these microsatellites, however, are
dinucleotides (two different base pairs repeated in tandem, e.g. (TA)n). Dinucleotides can
be difficult to score accurately as slippage of the DNA polymerase enzyme during PCR can
lead to the insertion or deletion of nucleotide repeats in the PCR products, creating
products of different size from the original template. These inaccurately replicated products
create a ‘stutter’ pattern which can be difficult to discern from the true alleles. Tri- and
tetranucleotide microsatellites (three and four base pairs repeated in tandem) are much less
prone to stuttering and are hence preferable for use in genetic studies over dinucleotides.
At least 17 tri- and tetranucleotides have been reported for common carp and related
species (Naish and Skibinski 1998; David et al. 2001; McConnell et al. 2001; Yue et al.
2004). Nine of these were reported by Yue et al. (2004), of which 6 had comparable levels
of genetic diversity (4-11 alleles) to the 21 recommended loci (4-17 alleles). It would
therefore have been useful if You et al. (2004) had included more tri- and tetranucleotides
in their list of 21 microsatellites. This may not have been practical, however, as Yue et al.
(2004) may not have been confident that these markers were all unlinked.
As mentioned in the previous section, merely using the same microsatellite markers does
not make it possible to combine data from different studies, as even machines of the same
make and model will give slightly different results in different laboratories. Combining
data from different studies requires collaboration between different research groups. Such
groups need to exchange samples with known genotypes, and use these samples to
calibrate their microsatellite allele calling.
Future work with mitochondrial markers should ideally employ sequencing of whole loci. I
recommend using both the control region, as this locus is highly variable, and the
cytochrome b locus, as this gene is used as a universal barcode for living organisms
(Hebert et al. 2003). The control region and the cytochrome b sequences can be combined
36
into composite haplotypes for analysis. The time and expense required for the sequencing
of whole loci, however, could make this impractical for some research groups or projects.
2.11. Common carp in Australia
2.11.1. Introduction of carp
Carp were first introduced to Australia by acclimatization societies trying to establish food
resources and recreational fisheries (Brumley 1991). In addition to common carp, such
societies were successful in introducing other species of Cyprinid, namely goldfish
(Carassius auratus), crucian carp (Carassius carassius), tench (Tinca tinca) and roach
(Rutilus rutilus). Exactly which species were and are present has been a matter of
confusion since colonial times. Stead (1929) noted that introduced fish were frequently
misclassified by aquaculturalists, with goldfish, common carp and crucian carp being
frequently confused with each other. The presence of crucian carp in the MDB was
reported by Whitley (1951), and was later refuted by museum curators in 1980 (Clements
1988), before being recently confirmed in the Campaspe River (a tributary to the Murray
River) in eastern Victoria (MDBC 2008b). Tench and roach are more distinctive in
appearance than common carp, crucian carp and goldfish, and therefore are not subject to
the same confusion as the latter three. The history of known common carp introductions is
summarised in Table 2.6.
The earliest known introductions occurred in Hobart, Sydney and Melbourne. Carp, most
likely from England, were introduced to Hobart in 1858. In Melbourne, introductions
(possibly from Hobart) occurred from 1859 to 1876, but did not give rise to self-sustaining
populations in the wild. A large population of red-orange-yellow colourful carp, however,
was established in the Melbourne Botanical Gardens, where it remained until 1962 when it
was eradicated by the state government after the Noxious Fish Act was passed (Clements
1988; Koehn et al. 2000). In Sydney, cyprinids of unknown origin, which may have
included common carp, were released into ponds around Government House around 1865
and were distributed to local waterways (Koehn et al. 2000). In 1907-08, David Stead, an
employee of NSW Fisheries, purchased 17 fingerlings of unknown origin from a Sydney
pet store, 14 of which were grown and bred in a fish farm in Prospect, a suburb of Sydney
(Stead 1929). The descendants of these fingerlings were used to seed other populations
around the Sydney Basin and were eventually released into Prospect Reservoir (Clements
37
1988), where they have persisted till the present day. These are referred to as the Prospect
strain in the literature (Shearer and Mulley 1978; Davis et al. 1999) (see 2.9.3. Population
genetics of carp in Australia). Whether they are solely descended from the fingerlings
purchased by Joseph Stead, or also have some ancestry with the cyprinids released in 1865,
is unknown.
Carp have been present in the MDB at least as early as the 1920s. Correspondence between
the NSW Fisheries Department and the Victorian Fisheries and Games Department in 1929
describes low numbers of C. carpio being caught in the MDB in both states (Clements
1988). While I know of no precise record of the events surrounding the introduction of
these carp, they were possibly sourced from Sydney. Rolls (1969) mentions that cyprinids
from the ponds around Government House in Sydney were frequently transported to and
released into the MDB prior to the 1920s. By the 1960s, carp were “widespread but only
common in irrigation canals and some other sluggish waters in New South Wales”
(Weatherly and Lake 1967).
In the Murrumbidgee Irrigation Area (MIA), an extensively irrigated region of the MDB in
central-southern NSW, a distinctive orange-coloured strain of carp became established. It
is unclear when these carp were first introduced. Brown (1996) states that the strain was
introduced in the 1950s. Koehn et al. (2000), however, suggest that introduction occurred
in the 1930s or 1940s, when large numbers of fish were released by acclimatisation
societies (Clements 1988). Gilligan (pers comm. 2008) suggests that these fish were
introduced after work began on the region’s irrigation systems in 1912. Shearer and Mulley
(1978) describe these carp as the Yanco strain (see 2.9.3. Population genetics of carp in
Australia).
In the late 1950s and early 1960s, Boolara strain carp (see 2.9.3 Population genetics of
carp in Australia) bred by Boolara Fish Farms Pty. Ltd., in Gippsland, Victoria, were
distributed to farm dams throughout Victoria. Despite eradication attempts, these carp
spread to the La Trobe River and Lake Wellington in south-eastern Victoria by 1962. They
entered the Murray River via Lake Hawthorn in 1968 (Clements 1988; Koehn et al. 2000).
More recently, ornamental Japanese koi carp have been released into Australia by
irresponsible pet owners. These colourful fish are now often sighted in urban waterways

38
(pers. obs.; Figure 2.5.). Koehn et al. (2000) reports the presence of koi in coastal rivers
near Perth, Lake Burley Griffin in the ACT, and Lakes Crescent and Sorell in Tasmania.
Additionally, Graham et al. (2005) report the presence of koi in the Richmond, Bellinger,
Hastings, Karuah and Towamba catchments in coastal NSW. Most recently, a koi carp was
collected from the Macleay catchment (coastal NSW) in February 2008 (D.M. Gilligan
pers. comm.).
Figure 2.5. Colourful koi carp in urban waterways. Picture taken in Lake Northam,
Victoria Park, Sydney (33°35’6.08”S 151°11’36.26”E) by Gwilym Haynes.

39
Table 2.6. History of introduction of common carp in Australia. Unrecorded introductions are also likely to have occurred. Further details are
given in 2.11.3 Population genetics of common carp in Australia. Introduction Strain Current distribution Reference
Origin Date Location Europe, probably England
1858 Hobart, Tasmania Unknown Did not establish Clements (1988)
Unknown; possibly from Tasmania
1859-1876 Melbourne, Victoria Unknown Did not establish in the wild; persisted in the Botanic Gardens till 1962
Clements (1988); Anon (1862) and Hume et al. (1983b) cited by Koehn et al. (2000).
Unknown 1865-1866, 1907-08
Multiple locations in Sydney Basin, most notably Prospect Reservoir
Prospect Present in Sydney Basin; possibly introduced into MDB
Stead (1929); Koehn et al. (2000)
Unknown. Suggested as being Singapore koi, or from Melbourne Botanical Gardens
Unknown. Suggested as 1920-30s, or 1950s.
MIA, NSW Yanco Originally restricted to MIA; may have spread to other parts of the MDB.
Shearer and Mulley (1978); Davis et al. (1999); Brown (1996); Koehn et al. (2000)
Boolara Fish Farms Pty. Ltd.
1962 Multiple farm dams and lakes in Victoria, includingLake Hawthorn
Boolara Widely distributed throughout MDB and Melbourne Basin
Clement (1988); Shearer and Mulley (1978)
Unknown Between 1970 and 1977
Torrens catchment, Adelaide, South Australia
Unknown Present in Torrens catchment. May have spread to other sites in SA.
Koehn et al. (2000)
Unknown Between 1977 and 1998
Glenelg and Barwon Rivers, Victoria
Unknown Still established. May have spread to adjacent water bodies.
Koehn et al. (2000)
Japan* 1976 Lake Burley Griffin, ACT Japanese koi Urban waterways in ACT; may have reached MIA.
Koehn et al. (2000), Davis et al. (1999)
Japan* 1990s Lakes Crescent and Sorell, Tasmania
Japanese koi Restricted Koehn et al. (2000)
Japan* 1990s Coastal rivers near Perth, WA
Japanese koi Restricted Koehn et al. (2000)
Japan* 2004 Sydney Basin Japanese koi Restricted Personal observation Japan* Before 2005 Multiple NSW coastal
waterways Japanese koi Restricted Graham et al. (2005)
Japan* 2008 Macleay catchment Japanese koi Restricted Gilligan (pers. comm.)
* These carp were not necessarily sourced directly from Japan. Although a Japanese strain, they could have been bred in local fish farms from Japanese ancestors prior to
release.

40
2.11.2. Population growth and spread of carp in Australia
In the Sydney Basin, the carp established in Prospect Reservoir remained localised despite
being introduced to multiple locations around Sydney (Koehn et al., 2000). This
localisation was not likely a result of any genetic limitations, as there are early reports of
Sydney carp reproducing “at an alarming rate” (Clements, 1988). More likely, the
introduced carp were physically constrained by the Great Dividing Range and the Tasman
Sea, and hence had little opportunity to expand their range outside of the Hawkesbury-
Nepean and Port Jackson (Sydney) catchments without human-mediated dispersal.
In the MDB, carp populations were either localized or at low density prior to the 1970s
(Clements 1988; Koehn et al. 2000). These carp may have lacked the genetic variation
necessary to become widespread, or may have been in the lag phase of their invasion
(Sakai et al. 2001; Allendorf and Lundquist 2003). During the 1970s, carp numbers began
to rise rapidly and carp began colonising regions from which they had previously been
absent (Koehn et al. 2000). By the fiscal year 1971/72, carp were sufficiently abundant to
become part of the commercial fish harvest from the MDB. In 1977/78, carp numbers
peaked, with 548 tonnes being caught by commercial fisheries. Carp abundance
subsequently declined and stabilised, with approximately 150 tonnes harvested each fiscal
year from 1986/87 to 1995/96 (Reid et al. 1997). The sudden rise in carp numbers and the
expansion of their range in the MDB corresponds to widespread flooding in 1974 and 1975
and the introduction of the Boolara strain. The 1974-75 floods were likely essential to carp
attaining their current dominance of the MDB, as they provided abundant habitat for food
and spawning and gave carp access to a plethora of new waterways by filling dry creek
beds and drowning out weirs. The expansion of carp in the MDB was also facilitated by
additional flooding in 1993 (Koehn et al. 2000).
The introduction of the Boolara strain is also frequently cited as being responsible for the
dominance of carp in the MDB (e.g. Shearer and Mulley 1978; Koehn et al. 2000). It has
been speculated that either the Boolara strain was already pre-adapted to flourishing in the
MDB environment, or the Boolara carp inter-bred with the strains already present in the
basin, which could have resulted in heterosis and produced more-invasive intercrossed
progeny (Brown 1980a, cited by Davis 1996).

41
In addition to flooding and release of the Boolara strain, human-mediated dispersal has
played a large role in facilitating the range expansion of carp after their initial introduction.
Carp have been spread through the accidental contamination of artificially stocked native
fish with carp fry, the use of carp fry as live bait, accidental or intentional release of koi,
and intentional introduction by people trying to establish recreational fisheries (Koehn et
al. 2000). The large Keepit, Burrendong, Wyangala, Burrinjuck, Hume and Eildon Dams at
river headwaters all contain carp populations. As these dams are too large to be drowned
out by floods, they were in all likelihood seeded by human activities, although introduction
via the movement of eggs on the feet of waterfowl cannot be excluded.
2.11.3. Population genetics of common carp in Australia
As discussed previously in section 2.11.1 Introduction of carp, common carp have been
introduced into Australia on a number of occasions and from a number of different source
populations. The exact number of successful introductions will probably never be known.
The research of Shearer and Mulley (1978) and Davis et al. (1999), however, shows that at
least four strains of carp have been introduced successfully into Australia: the Prospect,
Yanco, Boolara and Japanese koi strains. These papers are discussed below. A fifth group,
the Burrinjuck strain, is identified in the Ph.D. study reported in this thesis. This is detailed
in Chapter 3, and will not be further discussed here.
Shearer and Mulley (1978) investigated carp from Prospect Reservoir, in the Sydney
Basin, and Yanco and Narrandera in the MIA. The carp from Prospect were assumed to
have been the descendants of the carp released by David Stead in 1907 and 1908 (Stead
1929). The carp at Yanco were assumed to have been present in the MDB before the carp
from Boolara Fish Farms, as carp were mentioned in this region by Weatherly and Lake
(1967). The carp at Narrandera were assumed to have been descended from the stocks
released by Boolara Fish Farms. The aim of this study was to work out if the carp from the
three regions belonged to three different strains, by identifying diagnostic allozyme alleles
and/or morphological characters.
Shearer and Mulley (1978) scored the carp in their study for allozymes (20 loci),
morphological measurements (15 traits) and colour. Of the 20 allozymes, G-6-pd, Pgm and
Pt-3 had alleles diagnostic of each sample group. Of the 15 morphological measurements,
the Yanco carp could be separated from the Prospect and Boolara carp by the number of

42
dorsal fin rays, but none of the other measurements was diagnostic. Colour was found to be
a useful defining traits, with the Yanco carp being bright orange-red-yellow, and the
Boolara and Prospect carp being differing shades of silver, white, black and bronze.
Intriguingly, some carp at Yanco were even excluded from analysis because they clearly
had Boolara-type colouration and were hence regarded as vagrant Boolara carp rather than
resident Yanco carp. The diagnostic allozymes and colours are summarised in Table 2.7.
The ability of Shearer and Mulley (1978) to distinguish the carp from the three regions led
the authors to conclude that the carp represented three genetically distinct populations from
three separate introduction events. These were dubbed the Yanco, Boolara and Prospect
strains.
Table 2.7. Allozyme and colour traits diagnostic of the Yanco, Boolara and Prospect
strains of common carp. Data from Shearer and Mulley (1978). Sample
Site
Allozymes Colouration
G-6-pd Pgm Pt Colour of head
and dorsal surface
Colour of
ventral surface Colour of
caudal fin
Yanco Allele a Allele b, c Three bands Red to orange Yellow Red to orange
Boolara Allele a Allele a Four bands Silver grey Cream Silver grey on
dorsal lobes, red
of ventral lobes
Prospect Allele b Allele a Four bands Bronze to black White Bronze to black
Shearer and Mulley (1978) found no evidence of interbreeding between the Yanco,
Boolara and Prospect strains, despite the range of the Yanco and Boolara carp having
“recently begun to overlap.” In a follow-up paper, however, Mulley and Shearer (1980)
investigated a number of unusually coloured individuals in the MIA. Using the same
morphological measurements and allozymes as Shearer and Mulley (1978), they concluded
that these were F1 hybrids between the Yanco and Boolara strains.
The distinctive red-orange-yellow colouration of Yanco carp is no longer common in the
MIA (Bell, pers. comm. 2007). Either the Yanco strain has died-out, has bred extensively
with Boolara (or other) strain carp, or the frequencies of the alleles conferring red-orange-
yellow colouration have been decreased by selection and/or chance.

43
Davis et al. (1999) conducted a wider-ranging study than Shearer and Mulley (1978),
sampling carp from 14 locations in south-eastern Australia. These carp were scored for
seven polymorphic allozyme loci and RFLP of whole mitochondrial genomes. The results
of this study are generally consistent with those of Shearer and Mulley (1978) and Mulley
and Shearer (1980). Carp from the samples sites in the MIA showed the most genetic
diversity (number of allozyme alleles per locus), consistent with the presence of
interbreeding of the Yanco and Boolara strains in this regions. The Boolara and Prospect
strains could not be distinguished, however, because the allozyme that was diagnostic for
the Prospect carp in Shearer and Mulley (1978)’s study, G-6-pd, was monomorphic in the
Davis et al. (1999) study; and none of the other polymorphic loci in their study were
diagnostic.
The mitochondrial data of Davis et al. (1999) indicated that descendants of the Yanco
strain had spread beyond the MIA. Three haplotypes were detected, dubbed Haplotype 1, 2
and 3. Haplotype 2 was found only at Narrandera, in the MIA, and at Pooncarie, on the
Darling River. The presence of this rare haplotype at Narrandera is consistent with it being
indicative of Yanco strain maternal ancestry. The detection of Haplotype 2 in the Darling
River is therefore consistent with Yanco-descended carp having migrated out of the MIA.
Davis et al. (1999) found evidence for the dissemination of Japanese koi carp at some sites
in Australia. Seventeen koi from a fish farm in Bringelly, Sydney, were included in the
study, all of which had Haplotype 3. Haplotype 3 may therefore be diagnostic of koi
maternal ancestry, and was detected in carp from Tasmania and from Lake Burley Griffin
in the ACT.
Davis et al. (1999) also provided some fresh insights into the population genetic structure
of common carp in Australia. Analysis of allozyme allele and mitochondrial haplotype
frequencies found that carp were genetically structured both within the MDB and across
south eastern Australia as a whole. However, Davis et al. (1999) could find no clear pattern
behind this structuring.
There is some evidence that the Boolara and Prospect carp may have predominantly
European ancestry. The mirror-scale phenotype is found among both strains. Stead (1929)
noted that five of the fourteen fingerlings he used to found the Prospect strain of carp had

44
mirror-scales. Mirror-scaled carp were noted amongst the original carp released by Boolara
Fish Farms (Davis 1996), and are found in the MDB today, sometimes in high numbers
(Koehn et al. 2000; pers. obs.; Bell, pers. comm. 2007). Neither Stead (1929), Davis
(1996) nor Koehn et al. (2000) make any distinction between linear or scattered mirror
scales, although I have personally observed both forms in the MDB. Although mirror
scales are not unknown amongst Asian carp, they are actively selected for in many
domestic European carp breeds (see section 2.5.Morphological Variation). There is also
testimonial evidence that the carp from Boolara Fish Farms were illegally imported from
Germany (Clements 1988).
The origin of the Yanco strain remains a mystery. The bright colouration suggests that it is
a feral strain of koi carp. However, such colourations also occasionally occur in European
carp (see 2.5. Morphological Variation), so European ancestry cannot be eliminated.
Shearer and Mulley (1978) suggested that the Yanco strain was an escaped Singapore
strain, based on mention of Singapore carp in Taronga Zoo, Sydney, by Whitley (1951).
The Singapore carp was described as “a small eyed, pale-coloured variety” of carp. Shearer
and Mulley (1978) noted that the Yanco carp had small eyes. However, there is no other
evidence that the Yanco carp were from Singapore, especially as they were not simply
“pale,” but were coloured a distinct red-orange-yellow. Another hypothesis about the
origin of the Yanco strain was put forward by Clements (1988). He suggests that the Yanco
strain is descended from the coloured carp that were maintained in the Melbourne
Botanical Gardens until 1962 (Table 2.6). Many of these carp had colourations similar to
those described in Yanco, and some individuals were also small-eyed. This hypothesis is
not mutually exclusive to Shearer and Mulley’s (1978) suggestion of Singapore origin, as
the coloured carp in Melbourne could possibly have been sourced from Singapore.
2.11.4. Interbreeding between common carp and goldfish
Hybridisation is common between closely related species of Cyprinid (Howes, 1991).
Common carp and goldfish are no exception. Hybrids between carp and goldfish have been
reported in all locations where the two species occur in Australia (Brumley, 1991). Hybrids
have intermediate morphology between their parent species. They can be tentatively
identified in the field by having a rounded body and face (personal observation), and
reduced or absent barbels (Hume et al., 1983b; Koehn et al. 2000).

45
It is likely that all carp strain in Australia have some potential to hybridise with goldfish. In
Australia, goldfish-Boolara strain carp hybrids were reported by Hume et al. (1983b) and
goldfish-Yanco strain carp hybrids were reported by Shearer and Mulley (1978). In New
Zealand, goldfish-koi carp hybrids have been confirmed in genetic studies (Pullan and
Smith 1987). In the UK, hybridisation between goldfish and local carp strains has also
been confirmed genetically (Hänfling et al. 2005).There is no reason to suspect that
Prospect strain carp can not hybridise with goldfish also.
The fertility of carp-goldfish hybrids is questionable. Putative F1 individuals are observed
to be healthy and to produce eggs and milt in the wild (pers. obs.; Hume et al. 1983b).
Hybrids have been reported to be either sterile (Hubbs 1955) or to be able to back-cross
frequently (Trautman 1957, cited by Hume, 1983b; Aduma-bossman 1971, cited by
Hänfling et al., 2005). In an analysis of 34 hybrids (identified on the basis of five meristic
traits) from 14 different sites, Hume et al. (1983b) identified two subsets of hybrids: those
with only one pair of barbels, and those with two pairs of reduced barbels. The observation
that these groups also differed significantly for three morphological characters (ratio of
length of lower barbel to standard length, number of lateral-line scales and arrangement of
pharyngeal teeth) was interpreted as indicating that the two hybrid groups represented
different generations of intercrossing or backcrossing. More recently, backcrossed carp-
goldfish hybrids were detected in English waterways using microsatellite markers
(Hänfling et al. 2005). It can therefore be concluded that although fertility may be reduced
in carp-goldfish crosses, reproductive isolation is not complete and successful
backcrossing does occur.
Brumley (1991) noted that millions of goldfish are imported into Australia each year for
the aquarium industry, and that some of these imports are inevitably released into water
bodies. As goldfish and carp can hybridise, and their hybrids have some potential to
backcross with carp, goldfish likely act as a reservoir of genetic diversity for invasive
common carp in Australia. Even if hybridisation is rare and hybrid individuals have
reduced fitness, introgression between the two species could still allow the exchanging of
advantageous alleles between species (Hänfling 2007) and hence facilitate invasiveness.
The extent of introgression between carp and goldfish in any part of Australia has yet to be
quantified.

46
2.11.5. Summary
To summarise, carp have been present in Australia since the late 19th Century. Previous
studies have revealed that least four strains exist: Yanco, Japanese koi, Boolara and
Prospect. There is some evidence that the Prospect and Boolara strains are European in
origin. The Japanese koi, of course, has Asian origin. The origin of the Yanco strain is
unknown, although its colouration suggests that it is a feral form of koi. Of the strains,
interbreeding has been recorded between the Yanco and Boolara strain, and there is no
reason to believe that it cannot occur between the other carp strains also. The current
scarcity of Yanco-coloured carp in the MIA suggests that the Yanco strain has bred with
Boolara strain carp extensively. Some genetic structuring of carp within the MDB has
been detected, although no clear pattern to this structuring was discernable. Hybridisation
between carp and goldfish has been detected in the MDB, but the level of introgression
between the two species has never previously been quantified.
2.12. Scope of this project
There are many gaps in our knowledge of the population genetics of common carp in the
MDB. Still unknown when this project was initiated was the number and distribution of
strains, the extent and pattern of genetic structuring between populations in different river
basins, the history of introduction and dispersal of the different strains and the level of
interbreeding between the strains of carp and between carp and feral goldfish. Previous
studies were unable to address these issues comprehensively, due to limited sampling
schemes, the types of genetic markers used and the population-genetics analysis tools
available.
In this Ph.D. study, the population genetics of common carp in the MDB was
comprehensively investigated and the gaps in our knowledge left by previous studies
addressed in accordance with the project aims described in Chapter 1. This was possible
because:
(1) A comprehensive sampling regime was implemented, with carp being sampled from
all major river catchments in the MDB and every effort being made to collect at least
thirty individuals per sample site. In river catchments with large dams, carp were
sampled from above and below these impoundments. In addition, feral goldfish and

47
carp from two of the four known strains (Prospect and koi) and carp from overseas
populations (Europe and Russia) were also sampled.
(2) Microsatellite markers were used predominantly in the project. These are highly
polymorphic and robust to score, and are hence far more informative than the
allozymes, morphological characters and mitochondrial RFLP that previous studies
had to rely upon.
(3) A new range of population-genetics analyses and programs have been developed
since the last Australian carp project (Davis 1996) was completed. These have made
it possible to quickly calculate such useful measures as pairwise genetic differences
between regions/sample groups and the probability of departure of genotype
frequencies from expectation under Hardy-Weinberg Equilibrium; a process that once
had to be performed manually. Most importantly, a range of assignment tests have
been developed (Paetkau et al. 1995; Rannala et al. 1997; Pritchard et al. 2000;
Baudouin and Lebrun 2001; Anderson and Thompson 2002; Falush et al. 2003;
2007), making it possible to investigate the distribution and interbreeding of different
genetic groups with greater precision than ever before.
2.13. References
Allendorf, Lundquist (2003) Introduction: population biology, evolution, and control of
invasive species. Conservation Biology, 17, 24-30. doi: 10.1046/j.1523-
1739.2003.02365.x.
Anderson EC, Thompson EA (2002) A model-based method for identifying species
hybrids using multilocus genetic data. Genetics 160, 1217-1229.
Anjum R (1995) Biochemical and Chromosomal Genetic Characteristic of Several
Breeding Populations of Common Carp, Cyprinus carpio (L.). Faculty of Water
Protection and Freshwater Fisheries. Olsztyn, Poland, Olsztyn University of
Agriculture and Technology.
Ansell SW, Grundmann M, Russell SJ, Schneider H, Vogel JC (2008) Genetic
discontinuity, breeding-system change and population history of Arabis alpina in
the Italian Peninsula and adjacent Alps. Molecular Ecology, 19, 2245-2257. doi:
10.1111/j.1365-294X.2008.03739.x.
Bakos J, Gorda S (2001) FAO Fisheries Technical Paper 417: Genetic Resources of
Common Carp at the Fish Culture Research Institute, Szarvas, Hungary, Rome,
Food and Agriculture Organization of the United Nations. ISBN: 9789251046586.
48
Balon EK (1995) Origin and domestication of the wild carp, Cyprinus carpio: from Roman
Gourmets to the swimming flower. Aquaculture, 129, 3-48. doi: 10.1016/0044-
8486(94)00227-F
Balon EK (2004) About the oldest domestication among fishes. Journal of Fish Biology,
65 (Supplement A), 1-27. doi: 10.1111/j.1095-8649.2004.00563.x.
Baudouin L, Lebrun P (2001) An operational bayesian approach for the identification of
sexually reproduced cross-fertilized populations using molecular markers. In Doré,
C., Dosba, F. & Baril, C. (Eds.) Proceedings of the International Symposium on
Molecular Markers for Characterizing Genotypes and Identifying Cultivars in
Horticulture. Montpellier, France
Bay LK, Caley MJM, Crozier RH (2008) Meta-population structure in a coral reef fish
demonstrated by genetic data on patterns of migration, extinction and re-
colonisation. BMC Evolutionary Biology, 8, 248. doi:10.1186/1471-2148-8-248.
Ben-Dom N, Cherfas NB, Gomelsky B, Hu;ata G (2000) Genetic stability of Israeli
common carp stocks inferred from electrophoretic analysis of transferrin,
phosphoglucomutase and glucose-6-phosphate isomerase. Israeli Journal of
Aquaculture, 52, 30-35.
Bialowas H (2004) Inheritance of orange pigmentation and scale patterns in common carp
(Cyprinus carpio L.). Archives of Polish Fisheries, 12, 145-150.
Brown P (1996) Fish Facts 4 Carp in Australia. NSW Fisheries (now part of the NSW
Department of Primary Industries), Narrandera, Australia.
Brumley AR (1991) Cyprinids of Australasia. Cyprinid fishes systematics, biology and
exploitation. Suffolk, United Kingdom, St. Edumdsbury Press. ISBN: 92-5-
103027-8.
Callaway RM, Aschehoug ET (2000) Invasive plant versus their new and old neighbors: a
mechanism for exotic invasion. Science, 290, 81-94. doi: A66888386.
Carroll SP (2007) Brave new world: the epistatic foundation of natives adapting to
invaders. Genetica, 129, 193-204. doi: 10.1007/s10709-006-9014-8.
Cassey P, Blackburn TM, Duncan RP, Lockwood JL (2005) Lessons from the
establishment of exotic species: a meta-analytical case study using birds. Journal of
Animal Ecology, 74, 250-258. doi: 10.1111/j.1365-2656.2004.00918.x.
Cataudella S, Sola L, Corti M, Arcangeli R, La Rosa G, Mattoccia M, Coboldi S, Sbordoni
V (1987) Cytogenetic, genetic and morphometric characterization of groups of
common carp, Cyprinus carpio. In: Tiews, K (Ed.), Proc. World Symp. on
49
Selection, Hybridization, and Genetic Engineering in Aquaculture, Bordeaux 27-30
May 1986. Schriften der Bundesanstalt fur Fischerei Hamburg vol. 1, pp 113-129.
Berlin.
Clements J (1988) Salmon at the Antipodes A History and Review of Trout, Salmon and
Char and Introduced Coarse Fish in Australasia, Ballarat, Victoria, Australia,
Published by the author. ISBN: 0731637194.
Colautti RI, Grigorovich IA, MacIsaac HG (2006) Propagule pressure: a null model for
biological invasions. Biological Invasions, 8, 1023-1037. doi: 10.1007/s10530-005-
3735-y.
Corander J, Waldmann P, Marttinen P, Sillanpaa MJ (2004) BAPS 2: enhanced
possibilities for the analysis of genetic population structure. Bioinformatics, 20,
2363-2369. doi: 10.1093/bioinformatics/bth250.
Costa-Pierce BA, Moreau J, Pullin RSV (1993) New introductions of common carp
(Cyprinus carpio L.) and their impact on indigenous species in sub-Saharan Africa.
Discovery and Innovation, 5, 211-221.
Crispo E, Hendry AP (2006) Does time since colonization influence isolation by distance?
A meta-analysis. Conservation Genetics, 6, 1572-9737. doi: 10.1007/s10592-005-
9026-4.
Csizmadia C, Jeney Z, Szerencses I, Gorda S (1995) Transferrin polymorphism of some
races in a live gene bank of common carp. Aquaculture, 129, 193-198.
doi:10.1016/0044-8486(94)00247-L.
David L, Rajasekaran P, Fang J, Hillel J, Lavi U (2001) Polymorphisms in ornamental and
common carp strains (Cyprinus carpio L.) as revealed by AFLP analysis and a new
set of microsatellite markers. Molecular Genetics and Genomics, 266, 353-362.
doi: 10.1007/s004380100569.
Davis KM (1996) Investigation into the genetic variation of carp (Cyprinus carpio) in
Southeastern Australia. Sydney, Australia, University of NSW.
Davis KM, Dixon PI, Harris JH (1999) Allozyme and mitochondrial DNA analysis of carp,
Cyprinus carpio L., from south-eastern Australia. Marine and Freshwater
Resources, 50, 253-60. doi: 10.1071/MF97256
Dawson KJ, Belkhir K (2001) A Bayesian approach to the identification of panmictic
populations and the assignment of individuals. Genetic Resources, 78, 59-77.
doi:10.1017/S001667230100502X.
50
Desvignes JF, Laroche J, Durand JD, Bouvet Y (2001) Genetic variability in reared stocks
of common carp (Cyprinus carpio L.) based on allozymes and microsatellites.
Aquaculture, 194, 291-301. doi:10.1016/S0044-8486(00)00534-2.
Edwards P, Hiep DD, Anh PM, Mair G (2000) Traditional culture of indigenous common
carp in rice fields in northern Vietnam. World Aquaculture, 31, 34-40.
Estoup A, Clegg SM (2003) Bayesian inferences on the recent island colonization history
by the bird Zosterops lateralis lateralis. Molecular Ecology, 12, 657 - 674. doi:
10.1046/j.1365-294X.2003.01761.x.
Estoup A, Wilson IJ, Sullivan C, Cornuet J-M, Moritz C (2001) Inferring population
history from microsatellite and enzyme data in serially introduced cane toads, Bufo
marinus. Genetics, 159, 1671-1687.
Evanno G, Regnaut S, Goudet J (2005) Detecting the number of clusters of individuals
using the sortware STRUCTURE: a simulation study. Molecular Ecology, 14,
2611-2620. doi: 10.1111/j.1365-294X.2005.02553.x.
Excoffier L, Heckel G (2006) Computer programs for population genetics data analysis: a
survival guide. Nature Reviews, 7, 745-758. doi: 10.1038/nrg1904.
Excoffier L, Laval G, Schneider S (2005) Arlequin ver. 3.0: An integrated software
package for population genetics data analysis. Evolutionary Bioinformatics Online
1, 47-50.
Excoffier L, Smouse PE, Quattro JM (1992) Analysis of molecular variance inferred from
metric distances among DNA haplotypes: application to human mitochondrial
DNA restriction data. Genetics, 131, 479-491.
Falush D, Stephens M, Pritchard JK (2003) Inference of Population Structure Using
Multilocus Genotype Data: Linked Loci and Correlated Allele Frequencies
Genetics, 164, 1567-1587.
Falush D, Stephens M, Pritchard JK (2007) Inference of population structure using
multilocus genotype data: dominant markers and null alleles. Molecular Ecology
Notes, 7, 574–578. doi: 10.1111/j.1471-8286.2007.01758.x.
FAO (2008). Yearbook of Fisheries Statistics Summary Table. Available at:
http://www.fao.org/fishery/statistics/global-production/en.
Faragher RA, Lintermans M (1997) Alien fish species from the New South Wales rivers
survey. Fish and rivers in stress: the NSW rivers survey. Cronulla, Australia, NSW
Fisheries (now NSW Department of Primary Industries). ISBN: 0731094085.
Fisher RA (1930) The genetical theory of natural selection, Oxford, Clarendon Press.
51
Flajšhans M, Linhart O, Šlechtová V, Šlechta V (1999) Genetic resources of commercially
important fish species in the Czech Republic: present state and future strategy.
Aquaculture, 172, 471–483. doi: 10.1016/S0044-8486(98)00477-3.
Flannery T (2001) The eternal frontier : an ecological history of North America, London,
Heinemann. ISBN: 9781877008566.
Frankham R (2005) Resolving the genetic paradox in invasive species. Heredity, 94, 385.
doi: 10.1038/sj.hdy.6800634.
Froufe E, Magyary I, Lehoczky I, Weiss S (2002) mtDNA sequence data supports an
Asian ancestry and single introduction of the common carp into the Danube Basin.
Journal of Fish Biology, 61, 301-304. doi:10.1006/jfbi.2002.2046.
Gilligan D (2005) Fish communities of the Murrumbidgee catchment: status and trends.
NSW Department of Primary Industries, Narrandera, NSW.
Gilligan D, Rayner T (2007) The distribution, spread, ecological impacts, and potential
control of carp in the upper Murray River. NSW Department of Primary Industries,
Sydney.
Goldstein DB, Linares AR, Cavalli-Sforza LL, Feldman MW (1995) Genetic absolute
dating based on microsatellites and the origin of modern humans. Proceedings of
the National Academy of Science of the United States of America, 92, 6723-6727.
Gorda S, Bakos J, Liska J, Kakuk C (1995) Live gene bank of common carp strains at the
Fish Culture Research Institute, Szarvas. Aquaculture, 129, 199-202.
doi:10.1016/0044-8486(94)00248-M.
Graham KJ, Lowry MB, Walford TR (2005) Carp in NSW: assessment of distribution,
fishery and fishing methods. NSW Department of Primary Industries, Cronulla,
Australia.
Gross R, Kohlmann K, Kersten P (2002) PCR-RFLP analysis of the mitochondrial ND-3/4
and ND-5/6 gene polymorphisms in the European and East Asian subspecies of
common carp (Cyprinus carpio L.). Aquaculture, 204, 507-516.
doi:10.1016/S0044-8486(01)00836-5.
Guillot G, Estoup A, Mortier F, Cosson JF (2005a) A spatial statistical model for
landscape genetics Genetics, 170, 1261-1280. doi:10.1534/genetics.104.033803.
Guillot G, Mortier F, Estoup A (2005b) Geneland: a computer package for landscape
genetics Molecular Ecology Notes, 5, 712-715. doi: 10.1111/j.1471-
8286.2005.01031.x.

52
Haldane JBS (1924) A mathematical theory of natural and artificial selection" Part 1
(1924) Transactions of the Camrbidge philosophical society. Transactions of the
Camrbidge philosophical society, 23, 19-41.
Hänfling B (2007) Understanding the establishment success of non-indigenous fishes:
lessons from population genetics. Journal of Fish Biology, 71 (Supplement D),
115-135. doi: 10.1111/j.1095-8649.2007.01685.x.
Hänfling B, Bolton P, Harley M, Carvalho GR (2005) A molecular approach to detect
hybridisation between crucian carp (Carassis carassius) and non-indigenous carp
species (Carassisus cpp. and Cyprinus carpio). Freshwater Biology, 50, 403-417.
doi:10.1111/j.1365-2427.2004.01330.x.
Hänfling B, Weetman D (2006) Concordant genetic estimators of migration reveal
structural anthropogenically enhanced source-sink population structure in the river
sculpin, Cottus gobio. Genetics, 173.
Hassan M, Bonhomme F (2005) No reduction in neutral variability of mitochondrial and
nuclear genes for a Lessepsian migrant, Upeneus moluccensis. Journal of Fish
Biology, 66, 865-870. doi: 10.1111/j.0022-1112.2005.00643.x.
Hassan M, Harmelin-Vivien M, Bonhomme F (2003) Lessepsian invasion without
bottleneck: example of two rabbitfish species (Siganus rivulatus and Siganus
luridus) Journal of Experimental Marine Biology and Ecology, 291, 219-232.
doi:10.1016/S0022-0981(03)00139-4.
Hebert PDN, Cywinska A, Ball SL, deWaard JR (2003) Biological identifications through
DNA barcodes. Proceedings of the Royal Society of London B, 270, 313-321.
Horváth L, Tamás G, Seagrave C (2002) Carp and pond fish culture second edition,
Oxford, United Kingdom, Blackwell Science. ISBN: 0852381794.
Howes GJ (1991) Chapter 1 Systematics and biogeography: an overview. In Winfield, I. J.
& Nelson, J. S. (Eds.) Cyprinid fishes systematics, biology and exploitation. Bury
St Edmunds, United Kingdom, St. Edumdsbury Press. ISBN: 92-5-103027-8.
Hubbs CL (1955) Hybridization between fish species in nature. Systematic Zoology 4, 1-
20.
Hudson RR, Slatkin M, Maddison WP (1992) Estimating levels of gene flow from DNA
sequence data. Genetics, 132, 583-589.
Hume DH, Fletcher AR, Morsion AK (1983a) Final Report. Carp Program Report No. 10.
Fisheries and Wildlife Division, Victorian Ministry for Conservation,

53
Hume JD, Fletcher AR, Morison AK (1983b) Interspecific hybridization between carp
(Cyprinus carpio L.) and goldfish (Carassius auratus L.) from Victorian waters.
Australian Journal of Marine and Freshwater Research, 34, 915-919.
doi:10.1071/MF9830915.
Hutchinson DW, Templeton AR (1999) Correlations of pairwise genetic distance and
geographic distance measures: inferring the relarive influences of gene flow and
drift on the distribution of genetic variability. Evolution, 53, 1898-1914.
Inland Fisheries Service (2007) Carp Management Program Annual Report 2006-07.
Hobart, Tasmania.
Kalinowski ST (2004) Do polymorphic loci require large sample sizes to estimate genetic
distances? Heredity, 94, 33-36. doi:10.1038/sj.hdy.6800548
Khan TA (2003) Dietary studies on exotic carp (Cyprinus carpio) from two lakes in
Western Victoria, Australia. Aquatic Sciences, 65, 272-286. doi: 10.1007/s00027-
003-0658-5.
Kirpichnikov VS (1981) Genetic Bases of Fish Selection, Berlin and Heidelberg, Germany,
New York, USA, Springer-Verlag. ISBN: 0387109110.
Koehn J (2004) Carp (Cyprinus carpio) as a powerful invader in Australian waterways.
Freshwater Biology, 49, 882-894. doi: 10.1111/j.1365-2427.2004.01232.x.
Koehn J, Brumley B, Gehrke P (2000) Managing the Impacts of Carp, Canberra, Australia,
Bureau of Rural Sciences (Department of Agriculture, Fisheries and Forestry).
ISBN 0644292407 (set) 0642732019.
Kohlmann K, Gross R, Murakaeva A, Kersten P (2003) Genetic variability and structure of
common carp (Cyprinus carpio) populations throughout the distribution range
inferred from allozyme, microsatellite and mitochondrial DNA markers. Aquatic
Living Resources, 16, 421-431. doi:10.1016/S0990-7440(03)00082-2.
Kohlmann K, Kersten P (1999) Genetic variability of German and foreign common carp
(Cyprinus carpio L.) populations. Aquaculture, 173, 435-445. doi:10.1016/S0044-
8486(98)00474-8.
Kohlmann K, Kersten P, Flajshans M (2005) Microsatellite-based genetic variability and
differentiation of domesticated, wild and feral common carp (Cyprinus carpio L.)
populations. Aquaculture, 247, 253-256. doi:10.1016/j.aquaculture.2005.02.024.
Kolbe JJ, Glor RE, Schettino LR, Lara AC, Larson A, Losos JB (2004) Genetic variation
increases during biological invasion by a Cuban lizard. Nature, 431, 177-181. doi:
10.1038/nature02807.

54
Lindholm AK, Brenden F, Alexander HJ, Chan W-K, Thakurta SG, Brooks R (2005)
Invasion success and genetic diversity of introduced populations of guppies
Poecilia reticulata in Australia. Molecular Ecology, 14, 3671-3682. doi:
10.1111/j.1365-294X.2005.02697.x.
Lintermans M (2007) Fishes of the Murray-Darling Basin, Canberra, Australia, Murray-
Darling Basin Commission. ISBN: 1 921257 20 2.
Lynch M, Crease TJ (1990) The analysis of population survey data on on DNA sequence
variation. Molecular Biology and Evolution, 7, 377-394.
Mabuchi K, Senou H, Nishida M (2008) Mitochondrial DNA analysis reveals cryptic
large-scale invasion of non-native genotypes of common carp (Cyprinus carpio) in
Japan. Molecular Ecology, 17, 796-809. doi:10.1111/j.1365-294X.2007.03626.x.
Mabuchi K, Senou H, Suzuki T, Nishida M (2005) Discovery of an ancient lineage of
Cyprinus carpio from Lake Biwa, central Japan, based on mtDNA sequence data,
with reference to possible multiple origins of koi. Journal of Fish Biology, 66,
1516-1528. doi:10.1111/j.0022-1112.2005.00676.x.
Macarnes JM, Sato J, Fujio Y (1986) Genetic characterization of cultured populations of
Japanese common carp. Agricultural Research, 218, 153-166.
McConnell SK, Leamon J, Skibinski DOF, Mair GC (2001) Microsatellite markers from
the Indian major carp species, Catla catla. Molecular Ecology Notes, 1, 115-116.
doi: 10.1046/j.1471-8278.2000.00025.x.
MDBC (2008) Sustainable rivers audit report. Murray-Darling Basin Commission,
Memiş D, Kohlmann K (2006) Genetic characterization of wild common carp (Cyprinus
carpio L.) from Turkey. Aquaculture, 258, 257-262.
doi:10.1016/j.aquaculture.2006.03.041.
Michaels VJ (1998) Carp Farming, Farnham, United Kingdom, The Dorset Press. ISBN:
0852381530.
Michalakis Y, Excoffier L (1996) A generic estimator of population subdivision using
distances between alleles with special reference for microsatellite loci. Genetics,
142, 1061-1064.
Moles AT, Gruber MAM, Bonser SP (2008) A new framework for predictinginvasive plant
species. Journal of Ecology, 96, 13-17. doi: 10.1111/j.1365-2745.2007.01332.x.
Morgan D, Gill HS, Maddern MG, Beatty S (2004) Distribution and impacts of introduced
freshwater fishes in Western Australia. New Zealand Journal of Marine and
Freshwater Research, 38, 511-523. doi: 0028–8330/04/3803–0511.
55
Moritz C (1994) Defining evolutionary significant units for conservation. Trends in
Ecology and Evolution, 9, 373-375. doi: 10.1016/0169-5347(94)90057-4.
Mulley JC, Shearer KD (1980) Identification of natural 'Yanco' × 'Boolara' hybrids of the
carp, Cyprinus carpio. Australian Journal of Marine and Freshwater Research, 31,
409-411. doi:10.1071/MF9800409
Murakaeva A, Kohlmann K, Kersten P, Kamilov B, Khabibullin D (2003) Genetic
characterisation of wild and domestic common carp (Cyprinus carpio L.)
populations from Uzbekistan. Aquaculture, 218, 153-166. doi:10.1016/S0044-
8486(03)00005-X.
Naish KA, Skibinski DOF (1998) Tetranucleotide microsatellite loci for Indian major carp.
Journal of Fish Biology, 53, 886-889. doi:10.1111/j.1095-8649.1998.tb01841.x.
Nei M (1973) Analysis of gene diversity in subdivided populations. Proceedings of the
National Academy of Science of the United States of America, 70, 3321-3323.
Nicolescu C (2004) The phenotypical expression of the common carp's scale cover pattern
in accordance with the genotypic structure and the gene dose. Buletinul
Universitatii de Stiinte Agricole si Medicina Veterinara Cluj-Napoca, Seria
Zootehnie si Biotehnologii 60, 78-83.
Nolte AW, Freyhof J, Stemshorn KC, Tautz D (2005) An invasive lineage of sculpins,
Cottus sp (Pisces, Teleostei) in the Rhine with new habitat adaptations has
originated from hybridization between old phylogeographic groups. Proceedings of
the Royal Society B, 272, 2379-2387. doi: 10.1038/rspb.2005.3231.
Paaver T, Gross R (1991) Genetic variability of Cyprinus carpio L. stocks reared in
Estonia. Soviet Genetics, 839-846 (translated from Genetika 26 (1990), 1269-
1278).
Paddle R (2000) The last of the Tasmanian tiger, the history of the extinction of the
thylacine, Cambridge, UK, Cambridge University Press. ISBN: 0-521-53154-3.
Paetkau D, Calvert W, Stirling I, Strobeck C (1995) Microsatellite analysis of population
structure in Canadian polar bears. Molecular Ecology, 3, 347-354.
doi:10.1111/j.1365-294X.1995.tb00227.x.
Pearse DE, Crandall KA (2004) Beyond FST: Analysis of population genetic data for
conservation. Conservation Genetics, 5, 585-602. doi: 10.1007/s10592-003-1863-4.
Pinto L, Chandrasena N, Pera J, Hawkins P, Eccles D, Sim R (2005) Managing invasive
carp (Cyprinus carpio L.) for habitat enhancement in at Botany Bay, Australia.

56
Aquatic Conservation: Marine and Freshwater Ecosystems, 15, 447-462. doi:
10.1002/aqc.684.
Pritchard JK, Stefens M, Donelly P (2000) Inference of population structure using
multilocus genotype data. Genetics, 155, 945-959.
Puillandre N, Dupas S, Dangles O, Zeddam J-L, Capdevielle-Dulac C, Barbin K, Torres-
Leguizamon M, Silvain J-F (2008) Genetic bottleneck in invasive species: the
potato tuber moth adds to the list. Biological Invasions, 10, 319-333. doi:
10.1007/s10530-007-9132-y.
Pullan S, Smith PJ (1987) Identification of hybrids between koi (Cyprinus carpio) and
goldfish (Carassius auratus). New Zealand Journal Of Marine And Freshwater
Research, 21, 41-46.
Rannala B, Mountain JLDibu, 9197-9221. mgPNASU (1997) Detecting immigration by
using multilocus genotypes. Proceedings of the National Academy of Science of the
United States of America, 94, 9197-9221.
Reid DD, Harris JH, Chapman DJ (1997) NSW Inland Commercial Fishery Data Analysis.
Fisheries Research & Development Corporation, NSW Fisheries, Cooperative
Research Centre for Freshwater Ecology, Sydney, Australia.
Reynolds J, Weir BS, Cockerham CC (1983) Estimation of the coancestry coefficient:
basis for a short-term genetic distance. Genetics, 105, 767-779.
Rolls EC (1969) They all ran wild : the story of pests on the land in Australia, London,
United Kingdom, Angus & Robertson Publishers. ISBN: 020713491X.
Rousset F (1996) Equilibrium values of measures of population subdivision from stepwise
mutation processes. Genetics, 142, 1357-1362.
Sakai AK, Allendorf FW, Holt JS, Lodge DM, Molofsky J, With KA, Baughman S, Cabin
RJ, Cohen JE, Ellstrand NC, McCauley DE, O'Neil P, Parker IM, Thompson JN,
Weller SG (2001) The Population Biology of Invasive Species. Annual Review of
Ecology and Systematics (now the Annual Review of Ecology, Evolution and
Systematics), 32, 305-332. doi: 0066-4162/01/1215.
Savolainen P, Leitner T, Wilton AN, Matisoo-Smith E, Lundeberg J (2004) A detailed
picture of the origin of the dingo, obtained from the study of mitochondrial DNA.
Proceedings of the National Academy of Science of the United States of America,
101, 12387-12390. doi: 10.1073/pnas.0401814101.
57
Shearer KD, Mulley JC (1978) The introduction and distribution of the carp, Cyprinus
carpio Linnaeus, in Australia. Australian Journal of Marine and Freshwater
Research, 29, 661-563. doi:10.1071/MF9780551
Slatkin M (1991) Inbreeding coefficients and coalescence times. Genetical Research,
Cambridge 58, 167-175.
Slatkin M (1995) A measure of population subdivision based on microsatellite allele
frequencies. Genetics, 139, 457-462.
Slechtova V, Slechta V, Flajshans M, Gela D (2002) Protein variability in common carp
(Cyprinus carpio) breeds in the Czech Republic. Aquaculture, 204, 241-271.
Smith B (2005) The state of the art: a synopsis of information on common carp (Cyprinus
carpio) in Australia. Final Technical Report, SARDI Aquatic Sciences Publication
No. RD04/0064-2. South Australian Research and Development (SARDI),
Adelaide, Australia.
Stead DG (1929) Introduction of the great carp Cyprinus carpio into waters of New South
Wales. Australian Zoologist, 6, 100-102.
Stuart I, Jones M (2006) Large, regulated forest floodplain is an ideal recruitment zone for
non-native common carp (Cyprinus carpio L.). Marine and Freshwater Research,
57, 333–347. doi: 10.1071/MF05035.
Sumantadinata K, Taniguchi N (1990) Comparison of electrophoretic allele frequencies
and genetic variability of common carp stocks from Indonesia and Japan.
Aquaculture, 88, 263-271. doi:10.1016/0044-8486(90)90153-E
Thai BT, Burridge CP, Pham TA, Austin CM (2005) Using mitochondrial nucleotide
sequences to investigate diversity and genealogical relationships within common
carp (Cyprinus carpio L.) Animal Genetics, 36, 23-28. doi: 10.1111/j.1365-
2052.2004.01215.x.
Thai BT, Pham TA, Austin CM (2006) Genetic diversity of common carp in Vietnam
using direct sequencing and SSCP analysis of the mitochondrial DNA control
region. Aquaculture, 258, 228-240. doi:10.1016/j.aquaculture.2006.03.025.
Tsutsui ND, Suarez AV, Holway DA, Case TJ (2000) Reduced genetic variation and the
success of an invasive species. Proceedings of the National Academy of Science of
the United States of America, 97, 5948-5953. doi: 10.1073/pnas.100110397.
Wang C, Li S (2004) Phylogenetic relationships of ornamental (koi) carp, Oujiang color
carp and long-fin carp revealed by mitochondrial DNA COII gene sequences and
RAPD analysis. Aquaculture, 231, 83-91. doi:10.1016/j.aquaculture.2003.10.040.
58
Wang C, Li S (submitted) Genetic structure and phylogeny of Chinese and Hungarian
common carp (Cyprinus carpio L.) strains based on mitochondrial DNA sequence
analysis, with reference to the origin of European common carps.
Waples RS (1991) Pacific salmon, Oncorhynchus spp., and the definition of "species"
under the endangered species act Marine Fisheries Review, 53, 11.
Weatherly AH, Lake JS (1967) Introduced Fish Species in Australian Inland Waters. In
Weatherly, A. H. (Ed.) Australian Inland Waters and Their Fauna. Canberra,
Australia, A.N.U. Press. ISBN: 1131973461.
Weir BS, Cockerham CC (1984) Estimating F-statistics for the analysis of population
structure. Evolution, 38, 1358-1370.
Whitley GP (1951) Introduced Fishes-II. The Australian Museum Magazine, 10, 234-238.
Whitlock M, McCauley DE (1999) Indirect estimates of gene flow and migration:
FST≠1/(4Nm + 1). Heredity, 82, 117-125. doi:10.1038/sj.hdy.6884960.
Wilson GA, Rannala B (2003) Bayesian inferences of recent migration rates using
multilocus genotypes. Genetics, 163, 1177-1191.
Wright S (1931) Evolution in Mendelian populations. Genetics, 16, 97-159.
Wright S (1951) The genetic structure of populations. Annals of Eugenics, 15, 97-159.
Yue GH, Ho MY, Orban L, Komen J (2004) Microsatellites within genes and ESTs of
common carp and their applicability in silver crucian carp. Aquaculture, 234, 85-
98. doi:10.1016/j.aquaculture.2003.12.021.
Zambrano L, Martinez-Meyer E, Menezes N, Peterson AT (2006) Invasive potential of
common carp (Cyprinus carpio) and Nile tilapia (Oreochromis niloticus) in
American freshwater systems. Canadian Journal of Fisheries and Aquatic
Sciences, 63, 1903-1910. doi: 10.1139/F06-088.
Zanden MJV (2005) The success of animal invaders. Proceedings of the National Academy
of Science USA, 102. doi: 10.1073/pnas.0502549102.
Zenger KR, Richardson BJ, Vachot-Griffin A-M (2003) A rapid population expansion
retains genetic diversity within European rabbits in Australia. Molecular Ecology,
12, 789-794. doi:10.1046/j.1365-294X.2003.01759.x.
Zhivotovsky LA (1999) A new genetic distance with application to constrained variation at
microsatellite loci. Molecular Biology and Evolution, 16, 467-471.
Zhou J, Wu Q, Wang Z, Ye Y (2004a) Genetic variation within and among six varieties of
common carp (Cyprinus carpio L.) in China using microsatellite markers. Russian
Journal of Genetics, 40, 1144-1148. doi: 10.1023/B:RUGE.0000044758.51875.25.

59
Zhou JF, Wu Q, Wang Z, Ye Y (2004b) Molecular phylogeny of three subspecies of
common carp Cyprinus carpio, based on sequence analysis of cytochrome b and
control region mtDNA. Journal of Zoological Systematics and Evolutionary
Research, 42, 266-269. doi: 10.1111/j.1439-0469.2004.00266.x.
Zhou JF, Wu QJ, Ye YZ, Tong JG (2003) Genetic divergence between Cyprinus carpio
carpio and Cyprinus carpio haematopterus as assessed by mitochondrial DNA
analysis, with emphasis on the origin of European domestic carp. Genetica, 119,
93-97.
Zhou L, Gui JF (2002) Karyotypic Diversity in Polyploid Gibel Carp, Carassius Auratus
Gibelio Bloch Genetica, 115, 223-232. doi: 10.1023/A:1020102409270.
Zonova AS, Kirpichnikov VS (1968) Selection of Ropsha carp. Seminar/study tour in the
U.S.S.R. on genetic selection and hybridization of cultivated fishes. FAO Corporate
Document Repository http://www.fao.org/documents.

60
Chapter 3: Population genetics and management units of invasive
common carp (Cyprinus carpio L.) in the Murray-Darling Basin,
Australia
Initially submitted to the Journal of Fish Biology: 05.05.2008
Resubmitted with changes addressing reviewers’ comments: 20.06.2008
Resubmitted with changes addressing reviewers’ comments: 03.03.2009
Authors:
G. D. HAYNES, Faculty of Veterinary Science, University of Sydney, NSW 2006,
Australia
D. M. GILLIGAN, NSW Department of Primary Industries (Fisheries), Batemans Bay,
NSW 2536, Australia
P. GREWE, CSIRO Division of Marine Research, Castray Esplanade, Hobart, TAS 7000,
Australia
F. W. NICHOLAS, Faculty of Veterinary Science, University of Sydney, NSW 2006,
Australia
3.1. Abstract
Common carp (Cyprinus carpio L.) were introduced into Australia on several occasions
and are now the dominant fish in the Murray-Darling Basin (MDB), the continent’s largest
river system. In this study, variability at fourteen microsatellite loci was examined in carp
(n = 1037) from 34 sites throughout the major rivers in the MDB, from 3 cultured
populations, from Prospect Reservoir in the Sydney Basin and from Lake Sorrell in
Tasmania. Consistent with previous studies, assignment testing indicated that the Boolara,
Yanco and koi strains of carp are present in the MDB. Unique to this study, however, the
Prospect strain was widely distributed throughout the MDB. Significant genetic structuring
of populations (Fisher’s exact test, AMOVA and distribution of the different strains)
amongst the MDB sub-drainages was detected, and was strongly associated with
contemporary barriers to dispersal and population history. The distributions of the strains
were used to infer the history of introduction and spread of carp in the MDB. Populations
in 15 management units, proposed for control programmes, have high levels of genetic

61
diversity, contain multiple interbreeding strains and show no evidence of founder effects or
recent population bottlenecks.
Key words: Boolara; freshwater fish; invasive species; koi carp; Prospect Reservoir; Yanco
3.2. Introduction
Common carp (Cyprinus carpio L.) are a highly invasive species of freshwater fish. Native
to Eurasia, they have been successfully introduced to parts of the Americas, Oceania,
Africa, Asia, Europe and Australia (2004). Carp have been introduced into Australian
rivers several times since the late 19th century (Anderson 1920; Clements 1988; Koehn et
al. 2000) and have spread from introduction sites through natural range expansions and
through intentional and accidental releases (Koehn et al. 2000). They have been in the
Murray-Darling Basin (MDB), Australia’s largest river system, since at least 1917
(Anderson 1920; Clements 1988). After extensive flooding in 1974–1975, carp numbers
increased sharply, and carp became the dominant species in the MDB (Harris and Gehrke
1997; Koehn et al. 2000). There is much interest in carp control, because carp have a
detrimental effect on the aquatic environment and are considered a pest in most Australian
states (Koehn et al. 2000). The extent of population sub-structure in the MDB can be
identified with a population genetic assessment, which can be a useful guide for
implementing pest-management strategies. Molecular population markers can be used to
determine where there are multiple, independent subpopulations or a single panmictic unit.
Previous genetic studies indicated the presence of at least four common carp strains in
Australia: Prospect, Yanco, Boolara and koi (Shearer and Mulley 1978; Davis et al. 1999).
The Prospect strain was founded in Sydney from 14 fingerlings of unknown origin in
1907–1908 (Stead 1929) and was used to seed several waterways in the Sydney Basin
(Clements 1988). The Yanco strain was introduced into the MDB between 1910–1950
(Brown 1996). Individuals of this strain was originally a distinctive orange colour (Shearer
and Mulley 1978), a trait which is now rarely observed in the MDB carp (K. Bell, pers.
comm.). Interbreeding with other strains, and possibly natural selection, has presumably
led to the replacement of this colouration with the wild-type phenotype in contemporary
populations. The Boolara strain was likely illegally imported from Germany in the late
1950s and was deliberately spread throughout Victoria. It invaded the Murray River in
62
1968 (Clements 1988; Koehn et al. 2000). Koi are an ornamental strain of carp from Japan
(Balon 1995), sometimes illegally released into waterways (Koehn et al. 2000; Graham et
al. 2005). Previous studies detected Yanco carp at two sites and koi at one site in the MDB,
the Boolara strain throughout the MDB, and the Prospect strain only in the Sydney Basin
(Shearer and Mulley 1978; Davis et al. 1999). The introduction history of these strains may
provide insights into the contemporary genetic structuring of carp in the MDB.
In the present study, repeat-length variability in fourteen microsatellite loci was surveyed
to determine the distributions of the various strains, to estimate the extent of genetic
structuring between sub-drainages, and to assess levels of genetic diversity within the
MDB. The distribution of the different strains is interpreted in conjunction with historical
and demographic data to infer the history of colonization and expansion of carp in the
MDB since their introduction. In addition, the microsatellite variability between sub-
drainages was used to identify barriers to migration which, when considered with the
geography of the region, is used to define management units that can inform strategies for
control programs.
3.3 Materials and Methods
3.3.1. Sample Collection
Common carp were collected by electro-fishing from March 2004 to October 2006. A fin-
clip was taken from each individual and immediately placed in 70% ethanol. Effort was
made to collect at least 30 fish from each major river catchment in the MDB. Samples
were collected upstream and downstream of major dams to assess the effect of the dams on
migration. Carp were also sampled from Lake Sorell, Tasmania, where they were first
reported in 1995 (Koehn et al. 2000). Prospect strain carp were collected from Prospect
Reservoir in the Sydney catchment, and koi were obtained from two fish breeders, one in
Germany and one in Sydney. Mirror-scale domestic carp were obtained from a fish farm in
Jaenschwalde, Germany, to represent ‘pure’ European carp that have not interbred with
non-European strains. Sample site names and coordinates, and sample sizes, appear in
Table 3.1. Sample site locations are given in Figure 3.1.
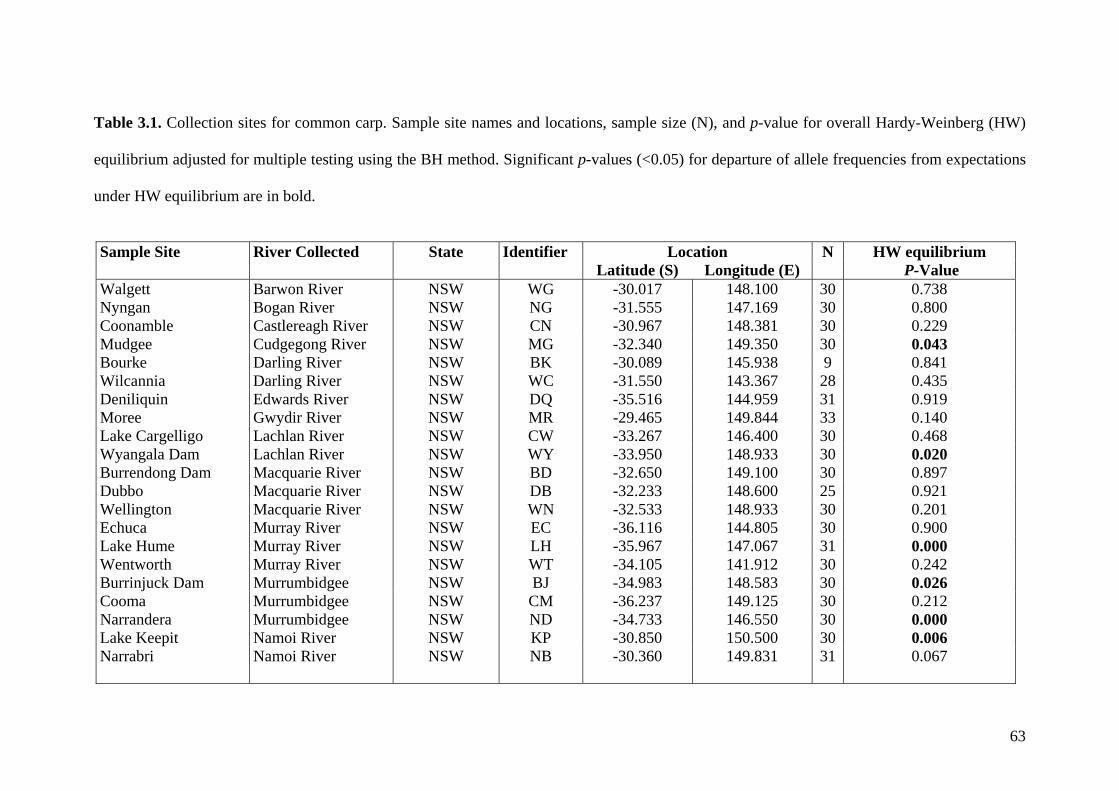
63
Table 3.1. Collection sites for common carp. Sample site names and locations, sample size (N), and p-value for overall Hardy-Weinberg (HW)
equilibrium adjusted for multiple testing using the BH method. Significant p-values (<0.05) for departure of allele frequencies from expectations
under HW equilibrium are in bold.
Sample Site River Collected State Identifier Location N HW equilibrium
P-Value Latitude (S) Longitude (E) Walgett Barwon River NSW WG -30.017 148.100 30 0.738 Nyngan Bogan River NSW NG -31.555 147.169 30 0.800 Coonamble Castlereagh River NSW CN -30.967 148.381 30 0.229 Mudgee Cudgegong River NSW MG -32.340 149.350 30 0.043 Bourke Darling River NSW BK -30.089 145.938 9 0.841 Wilcannia Darling River NSW WC -31.550 143.367 28 0.435 Deniliquin Edwards River NSW DQ -35.516 144.959 31 0.919 Moree Gwydir River NSW MR -29.465 149.844 33 0.140 Lake Cargelligo Lachlan River NSW CW -33.267 146.400 30 0.468 Wyangala Dam Lachlan River NSW WY -33.950 148.933 30 0.020Burrendong Dam Macquarie River NSW BD -32.650 149.100 30 0.897 Dubbo Macquarie River NSW DB -32.233 148.600 25 0.921 Wellington Macquarie River NSW WN -32.533 148.933 30 0.201 Echuca Murray River NSW EC -36.116 144.805 30 0.900 Lake Hume Murray River NSW LH -35.967 147.067 31 0.000Wentworth Murray River NSW WT -34.105 141.912 30 0.242 Burrinjuck Dam Murrumbidgee NSW BJ -34.983 148.583 30 0.026Cooma Murrumbidgee NSW CM -36.237 149.125 30 0.212 Narrandera Murrumbidgee NSW ND -34.733 146.550 30 0.000Lake Keepit Namoi River NSW KP -30.850 150.500 30 0.006Narrabri
Namoi River NSW NB -30.360 149.831 31 0.067
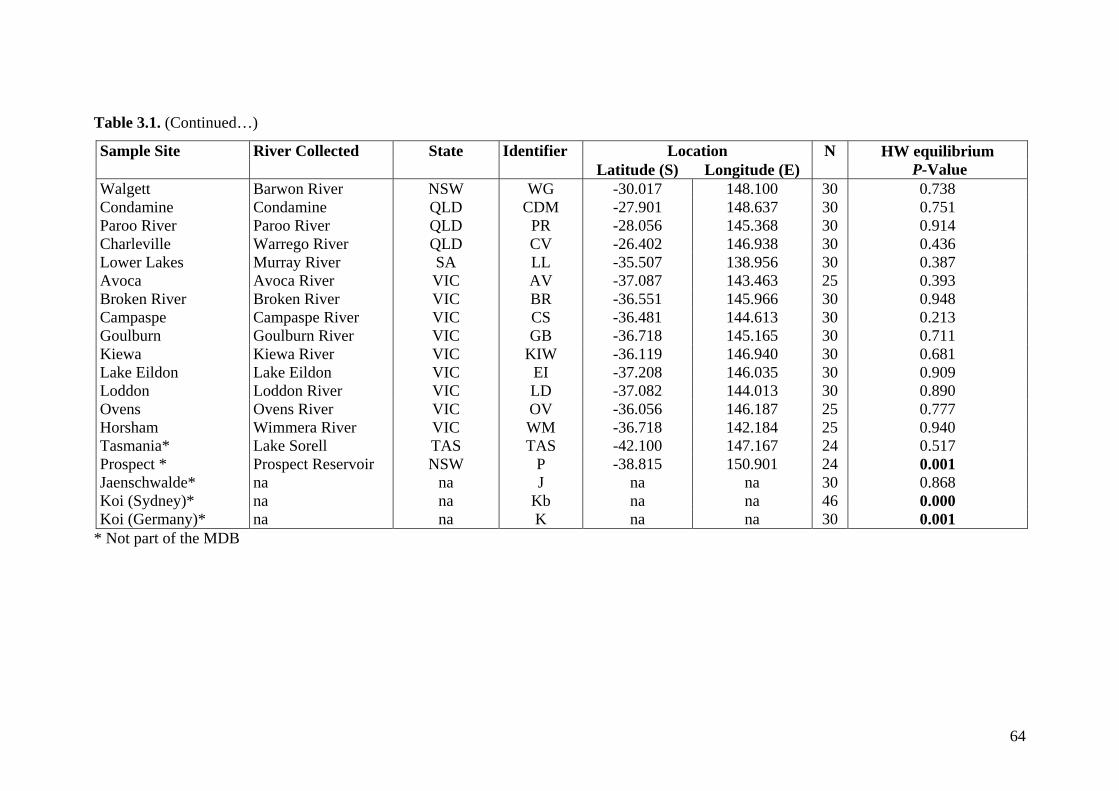
64
Table 3.1. (Continued…)
Sample Site River Collected State Identifier Location N HW equilibrium P-Value Latitude (S) Longitude (E)
Walgett Barwon River NSW WG -30.017 148.100 30 0.738 Condamine Condamine QLD CDM -27.901 148.637 30 0.751 Paroo River Paroo River QLD PR -28.056 145.368 30 0.914 Charleville Warrego River QLD CV -26.402 146.938 30 0.436 Lower Lakes Murray River SA LL -35.507 138.956 30 0.387 Avoca Avoca River VIC AV -37.087 143.463 25 0.393 Broken River Broken River VIC BR -36.551 145.966 30 0.948 Campaspe Campaspe River VIC CS -36.481 144.613 30 0.213 Goulburn Goulburn River VIC GB -36.718 145.165 30 0.711 Kiewa Kiewa River VIC KIW -36.119 146.940 30 0.681 Lake Eildon Lake Eildon VIC EI -37.208 146.035 30 0.909 Loddon Loddon River VIC LD -37.082 144.013 30 0.890 Ovens Ovens River VIC OV -36.056 146.187 25 0.777 Horsham Wimmera River VIC WM -36.718 142.184 25 0.940 Tasmania* Lake Sorell TAS TAS -42.100 147.167 24 0.517 Prospect * Prospect Reservoir NSW P -38.815 150.901 24 0.001 Jaenschwalde* na na J na na 30 0.868 Koi (Sydney)* na na Kb na na 46 0.000 Koi (Germany)* na na K na na 30 0.001
* Not part of the MDB

65
Figure 3.1. Collection sites for common carp. Murray-Darling Basin is indicated in white,
the rest of Australia in grey. Sample site coordinates and full names are in Table 3.1
3.3.2. PCR and genotyping
DNA was extracted according to Wasko et al. (2003), and samples were genotyped for
fourteen di-, tri- or tetranucleotide microsatellite loci, including Cca02, Cca07, Cca09,
Cca17, Cca19, Cca65, Cca67, Cca72, GF1, Koi5-6, Koi29-30, Koi41-42, MFW6 and
MFW26 (Crooijmans et al. 1997; David et al. 2001; Yue et al. 2004). Microsatellite DNA
was amplified using the polymerase chain reaction (PCR) in 8 single-locus and 3 multiplex
reactions. Primers for Cca65, Cca09, Cca07, Cca17, Koi5-6, Koi29-30 and Koi41-42 were
redesigned to anneal at higher temperatures and to change the size of the PCR products to
facilitate multiplexing. Primer sequences appear in Appendix 3.1. Optimal conditions for
each PCR consisted of 1 μl (10–100 ng) total genomic DNA, 1x PCR Buffer (Fisher
66
Biotech), 200 μM each dNTP, 1 unit Taq DNA polymerase, primer and MgCl2
concentrations (Appendix 3.1), and sterile water to 15 μl total volume. PCR amplifications
were made with touch-down protocols (Appendix 3.1 & 3.2). PCR products were pooled
into two groups and genotyped using an AB 3730 DNA Analyzer. Genotypes were scored
with GeneMapper 3.1TM and checked by eye by at least two individuals.
3.3.3. Statistical analysis
Allelic diversity
Allelic size ranges and numbers at each locus were summarized using GenAlEx 6.0
(Peakall and Smouse 2006). Departures of genotype frequencies from Hardy-Weinberg
(HW) proportions were tested in GENEPOP 4.0 (Raymond and Rousset 1995). As a large
number of sites were tested, the HW P-values were adjusted for multiple tests using the
Benjamini-Hochberg (BH) method (Benjamini and Hochberg 1995), which has been
demonstrated to be robust and effective at minimising type 1 errors (Reiner et al. 2003).
Assignment tests
Assignment tests were made with a Bayesian algorithm in STRUCTURE 2.1 (Pritchard et
al. 2000; Falush et al. 2003), which uses HW expectations and linkage disequilibrium to
assign individuals to population groups. Analyses were run for K = 1–10 potential
population groups with 500 000 burn-in steps and 1 000 000 Markov-Chain Monte-Carlo
steps. The ‘allele frequencies correlated’ and ‘use prior population information to assist
clustering’ models were used, as preliminary analyses indicated that these two models
were best able to differentiate between the populations analyzed here. Three replicates
were made for each value of K. The ΔK statistic (Evanno et al. 2005) was used to estimate
the actual number of population groups present (i.e. the true value of K). This statistic is
the change in the log probability values [LnP(D)] between successive values of K, and
when plotted against K produces a sharp peak at the most likely value of K (Evanno et al.
2005). The Prospect, koi, and Jaenschwalde strains were included in the analysis to test
how effectively STRUCTURE differentiated among isolated populations and to estimate
the extent to which these strains were introduced into the MDB. The USEPOPINFO
parameter was set to 1 for these samples to indicate they were learning samples and to 0
for the remaining samples. Koi from Sydney and Germany were pooled in this analysis.

67
Genetic structure
The F-statistics of Weir & Cockerham (1984) were estimated with GENEPOP 4.0
(Raymond and Rousset 1995), and analysis of molecular variance (AMOVA) (Excoffier et
al. 1992) performed with GenAlEx 6.0 (Peakall and Smouse 2006). The significances of
the AMOVA results were tested against an empirical null distribution derived from 9999
permutations. As the large dams at river headwaters likely limit carp dispersal, the
AMOVA and F-statistic analyses were conducted on three groups: 1) all MDB samples, 2)
below-dam MDB samples and 3) above-dam MDB samples. In addition, departure of allele
frequencies from the null hypothesis of panmixia was tested for each pair of above-dam
versus below-dam sites (KP, BD, WY, BJ, LH and EI sites against the NB, WN, CW, ND,
KIW and GB sites respectively ) using Fisher’s exact test in GENEPOP 4.0.
To test for isolation-by-distance population structure, geographic distances between MDB
sample sites were measured in Google Earth, both ‘as the crow flies’ and following the
shortest path along river channels. Two measures of the fixation index between
subpopulations, FST, were calculated between all pairs of sample sites in ARLEQUIN 3.1
(Excoffier et al. 2005). These were Slatkin’s estimate of FST (Slatkin 1991) and Reynolds’
estimate of FST, derived from the coancestry-based genetic distance of Reynolds et al.
(1983). Correlations between geographical and genetic distances were estimated for each
combination of geographic (along-river and crow-flies) and genetic (Reynolds’ and
Slatkin’s estimates of FST) distance. Twelve combinations of sample sites were tested to
account for barriers to dispersal imposed by impoundments and limited flows (Appendix
3.3). The Bourke (BK) site was excluded, because its small sample size (n = 9) could skew
results. The significance of each correlation was determined using a Mantel permutation
test in GenAlEx 6.0, with 9999 permutations. As tests were not independent (i.e., same
sample sites used in multiple tests), P-values were adjusted for multiple tests using the
Benjamini & Yekutieli (BY) procedure (Benjamini and Yekutieli 2001) in the
MULTTEST package (Pollard et al. 2008) in R, rather than the BH procedure (Benjamini
and Hochberg 1995) used previously, as this false discovery rate correction takes into
account that P–values may not be independent.
Barriers to dispersal
Barriers to dispersal were identified with BARRIER 2.2 (Manni et al. 2004), which uses
geographic and genetic distances to identify genetic discontinuities between regions. The

68
potential number of barriers (predefined by user) can range from 1 to the number of sample
sites. Non-MDB sites were excluded from these analyses. The BK site was also excluded,
because of its small sample size. BARRIER was run for each of the two measures of
genetic distance (Reynolds’ and Slatkin’s estimate of FST). Bootstrap values for each
barrier were generated by subsampling with replacement from each sample to generate 100
randomly re-sampled datasets, by computing a genetic distance matrix for each of the 100
re-sampled datasets and by analyzing these matrices with BARRIER. Bootstrap values for
each apparent barrier can range from 1% (barrier detected in one of the resampled
matrices) to 100% (barrier detected from each of the 100 resampled matrices). Bootstrap
values were arbitrarily classed as strong (>80%), weak (40–79%) or not significant
(<40%).
Defining management units
Management units can be defined as populations “connected by such low levels of gene
flow that they are functionally independent”, at least on the time scale relevant to short-
term management, and identified by the presence of divergent allele frequencies between
regions (Moritz 1994). Management units were proposed in this study based on genetic
differentiation between regions implicit in the assignment tests (i.e. different population
groups present in different regions), on genetic discontinuities being consistently detected
by BARRIER for the two genetic distance measures, and on the known physical barriers to
dispersal (primarily catchment boundaries within the MDB). As the dams at river
headwaters almost certainly limit carp dispersal, the level of bootstrap support for the
barriers detected by BARRIER between the above-dam and below-dam sites was used as a
guide to the minimal level of bootstrap support necessary to delimit a management unit
from the BARRIER results. Consistency between assignment tests and BARRIER analysis
was desirable, but not strictly necessary to delimit a management unit.
Genetic diversity and population bottlenecks
Genetic diversity was estimated as allele richness (Ar), mean number of alleles per locus
(A) and observed (HO) and expected heterozygosity (HE). These measures were calculated
for the MDB as a whole, for the proposed management units (see Discussion) and for the
Tasmania, Prospect, koi and Jaenschwalde samples. Ar, A and HE were estimated with HP
RARE (Kalinowski 2005), and HO with GENEPOP 4.0 (Raymond & Rousset, 1995). For
Ar, rarefaction was used to adjust for different sample sizes. As the smallest group analyzed

69
consisted of 24 individuals, the number of genes per locus was set to 48 for this
calculation.
Departures from mutation-drift equilibrium indicative of a recent population bottleneck
(inflated heterozygosity relative to heterozygosity expected at mutation-drift equilibrium)
were tested using BOTTLENECK 1.2.02 (Cornuet and Luikart 1996; Pirey et al. 1999). A
two-phase model (TPM) of mutation was used, and significance was assessed with a two-
tailed Wilcoxon sign-rank test, which provides relatively large power with as few as four
loci. Departures from expected values under mutation-drift equilibrium were tested for the
MDB as a whole, separately for each proposed management unit and for Tasmanian,
Jaenschwalde, koi and Prospect carp. Koi from Sydney and Germany were analyzed
separately. P-values were adjusted for multiple testing using the BH method (Benjamini
and Hochberg 1995), and adjusted values of < 0·05 were considered significant.
3.4. Results
3.4.1. Allele Diversity
The number of detected alleles ranged from four (GF1 and Cca07) to 17 (MFW26), with
allele size ranges being consistent with size ranges reported in the literature, expect in
some where primers were redesigned to anneal in different regions (Table 3.2). As shown
in the last column of Table 3.1, nine of the 39 sample sites showed a significant (P < 0·05)
overall departure from HW after adjustment for multiple testing.
3.4.2. Assignment tests
The graph of ΔK against K produced a single, distinctive peak at K = 5 (data not shown),
indicating the presence of five population groups in the analysis. The distribution of these
population groups is illustrated in Figure 3.2. Jaenschwalde and koi carp corresponded
closely to population groups 2 and 3, respectively. Prospect carp correspond most strongly
with group 1, although about 30% of their overall genetic variation was assigned to group
2. Population group 4 is distributed ubiquitously throughout the MDB and is the dominant
group in Victoria. Population group 5 is also widely distributed and is dominant in the
Murrumbidgee catchment (ND site). A large proportion (59%) of individuals from the
MDB and Tasmania were allocated to more than one population group. The distribution of

70
the population groups suggested approximately eleven genetically different regions in the
MDB.
Figure 3.2. Assignment results from STRUCTURE for K=5 population groups. Pie
diagrams indicate the overall proportions of each population group (1-5) to the
genetic diversity of each sample site.

71
Table 3.2. Microsatellite alleles and allele size ranges detected
Microsatellite loci
Size Range Number of alleles detected Reported* Detected
Cca02 173-194 159-205 12 Cca09a 303-387 332-380 11 Cca65a 184-194 150-160 5 Cca72 244-299 237-304 12 GF1** 337-353 335-376 4 Koi41-42a 228 285-316 6 MFW26 122-150 125-170 17 MFW6 144-152 116-168 15 Cca07a 216– 245 224-236 4 Cca17a 322– 367 371-389 5 Cca19 262-370 291-299 5 Cca67 228-254 231-267 11 Koi29-30a 247 334-344 5 Koi5-6a 189 234-255 6
* References for allele size ranges are listed in Table 3.3. Reported ranges differ
greatly from detected ranges in some cases because primers were redesigned to
anneal in different regions. ** Additional information about size ranges was
reported by Hänfling et al. (2005).
3.4.3. Genetic structuring
Significant allele-frequency differences were detected among sample sites. The AMOVA
showed significant variation among sites (Table 3.3), with 11% of variation among sites
and 89% within sites in the MDB overall. As expected, the percentage of among-site
variation was smaller (7%) among below-dam samples and larger (20%) among above-
dam samples. F-statistics also indicated that population structuring was greatest among
above-dam samples (FST = 0·1724), lowest among the below-dam samples (FST = 0·0384)
and intermediate among all samples (FST = 0·0720). All exact test comparisons between
above- and below-dam samples were highly significant (P < 0·001).
In the plots of genetic distance against geographic distance that were generated to test for
isolation-by-distance, the data points showed little scatter about the y-axis (genetic
distance) (data not shown). None of the 48 correlations between geographic and genetic
distance was significant after BY adjustment (Benjamini and Yekutieli 2001) for multiple
testing.
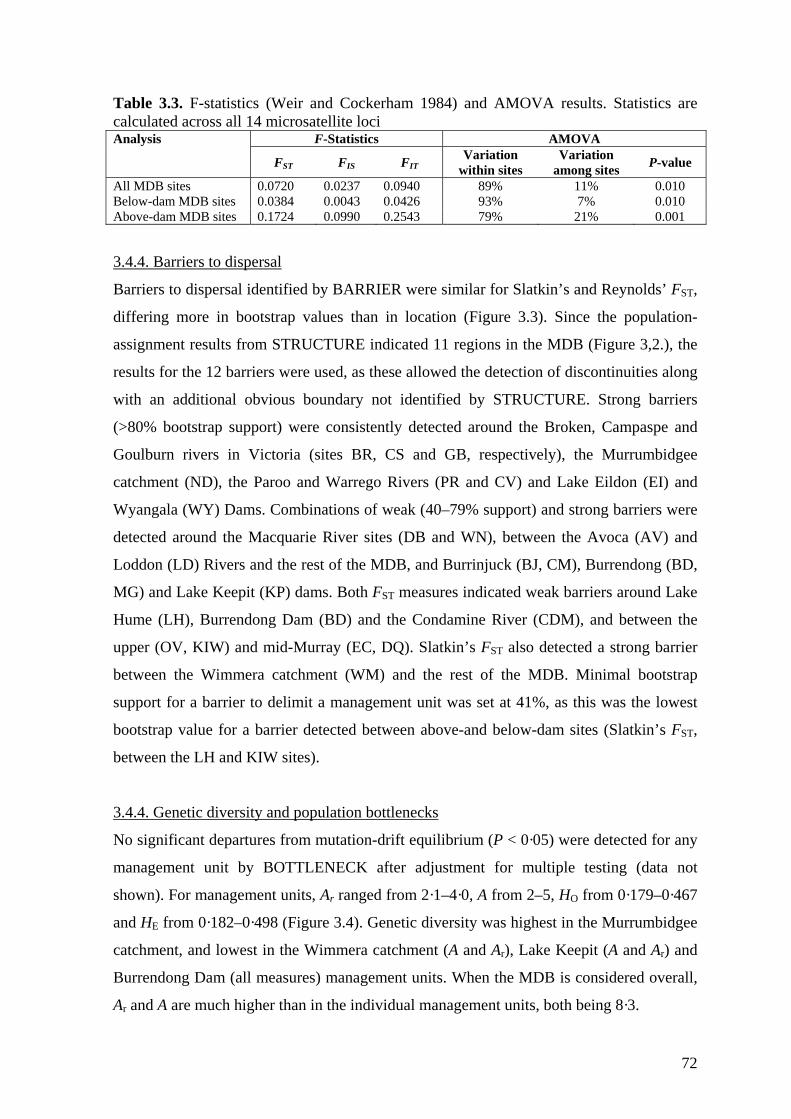
72
Table 3.3. F-statistics (Weir and Cockerham 1984) and AMOVA results. Statistics are calculated across all 14 microsatellite loci Analysis F-Statistics AMOVA
FST FIS FIT Variation within sites
Variation among sites P-value
All MDB sites 0.0720 0.0237 0.0940 89% 11% 0.010 Below-dam MDB sites 0.0384 0.0043 0.0426 93% 7% 0.010 Above-dam MDB sites 0.1724 0.0990 0.2543 79% 21% 0.001
3.4.4. Barriers to dispersal
Barriers to dispersal identified by BARRIER were similar for Slatkin’s and Reynolds’ FST,
differing more in bootstrap values than in location (Figure 3.3). Since the population-
assignment results from STRUCTURE indicated 11 regions in the MDB (Figure 3,2.), the
results for the 12 barriers were used, as these allowed the detection of discontinuities along
with an additional obvious boundary not identified by STRUCTURE. Strong barriers
(>80% bootstrap support) were consistently detected around the Broken, Campaspe and
Goulburn rivers in Victoria (sites BR, CS and GB, respectively), the Murrumbidgee
catchment (ND), the Paroo and Warrego Rivers (PR and CV) and Lake Eildon (EI) and
Wyangala (WY) Dams. Combinations of weak (40–79% support) and strong barriers were
detected around the Macquarie River sites (DB and WN), between the Avoca (AV) and
Loddon (LD) Rivers and the rest of the MDB, and Burrinjuck (BJ, CM), Burrendong (BD,
MG) and Lake Keepit (KP) dams. Both FST measures indicated weak barriers around Lake
Hume (LH), Burrendong Dam (BD) and the Condamine River (CDM), and between the
upper (OV, KIW) and mid-Murray (EC, DQ). Slatkin’s FST also detected a strong barrier
between the Wimmera catchment (WM) and the rest of the MDB. Minimal bootstrap
support for a barrier to delimit a management unit was set at 41%, as this was the lowest
bootstrap value for a barrier detected between above-and below-dam sites (Slatkin’s FST,
between the LH and KIW sites).
3.4.4. Genetic diversity and population bottlenecks
No significant departures from mutation-drift equilibrium (P < 0·05) were detected for any
management unit by BOTTLENECK after adjustment for multiple testing (data not
shown). For management units, Ar ranged from 2·1–4·0, A from 2–5, HO from 0·179–0·467
and HE from 0·182–0·498 (Figure 3.4). Genetic diversity was highest in the Murrumbidgee
catchment, and lowest in the Wimmera catchment (A and Ar), Lake Keepit (A and Ar) and
Burrendong Dam (all measures) management units. When the MDB is considered overall,
Ar and A are much higher than in the individual management units, both being 8·3.

73
Figure 3.3. Putative barriers to dispersal calculated from A. Reynolds’ estimate of FST, and B. Slatkin’s estimate of FST. Polygons around each sample site represent the Voronï tessellations drawn around each sample site by BARRIER. Thickened lines represent putative barriers to dispersal. The level of bootstrap support for each barrier is indicated by both the number associated with the barrier, and the thickness of the barrier. Bootstrap values less than 40 are not shown.

74
Figure 3.4. Genetic diversity in common carp in the MDB. A. Allele richness (Ar) and
mean number of alleles per locus (A). B. Observed and expected heterozygosity (HO and
HE respectively). Genetic diversity indices from this study are shown in comparison with
published data from common carp in their native range, other invasive species of
freshwater fish, and freshwater fish in general. Allele richness was not reported in any of
the published studies, and Ho was not reported for freshwater fish in general. Data from
carp in Australia is given for the MDB as a whole, and for each individual management
unit (Figure 3.5). Numbers are: 1. all MDB, 2. Paroo-Warrego Catchments, 3. Condamine
Catchment, 4. Macquarie Catchment, 5. Main MDB, 6. Wimmera Catchment, 7. Avoca-
Loddon Catchments, 8. Murrumbidgee Catchment, 9. Central Victoria, 10. Upper Murray,
11. Burrendong Dam, 12. Lake Keepit, 13. Wyangala Dam, 14. Lake Eildon, 15. Lake
Hume, 16. Burrinjuck Dam, 17. Tasmania, 18. Prospect Reservoir, 19. Jaenschwalde, 20.
koi (Sydney fish farm), 21. koi (German fish farm), 22. C.carpio, European, wild*, 23.
C.carpio, European, domestic*, 24. C.carpio, Central Asian, wild*, 25. C.carpio, East
Asian, wild*, 26. Petromyzon marinus**, 27. Poecilia reticulata†, 28. Freshwater fish
overall††. *Kohlmann et al. (Kohlmann et al. 2005), ** Bryan et al. (2005), †Lindholm et
al. (2005), ††DeWoody and Avise (2000).

75
3.5. Discussion
This research is the most comprehensive population genetic study of common carp in a
single river basin to date. Consistent with the findings of previous Australian studies, this
study confirms that the Boolara, Yanco and koi strain are present in the MDB (Shearer and
Mulley 1978; Davis et al. 1999). The results of this study also show that the Prospect strain
is widely distributed throughout the MDB. Significant genetic structuring appears across
the MBD and is strongly associated with contemporary barriers to dispersal. Levels of
genetic variation in the MDB were similar to those in domestic populations (koi and
Jaenschwalde), indicating that carp are not genetically depauperate in Australia. A history
of introduction and spread of the various carp strains in Australia is proposed below, based
on the current distribution of the strains. The MBD is divided into fifteen management
units for control programs, each corresponding to natural or man-made barriers to carp
dispersal.
3.5.1. Strains of common carp in the Murray-Darling Basin
Five population groups of carp were identified with STRUCTURE (Figure. 3.2). Groups 1,
2 and 3 likely represent the Prospect, Jaenschwalde and koi carp, respectively, as these
strains correspond most closely with these groups. The imperfect separation between
groups 1 and 2 in the Prospect strain is likely a result of a smaller sample size (24) of
Prospect individuals, the limited number of microsatellite loci (14) and the genetic
similarity between Prospect and Jaenschwalde carp. Group 4 likely represents the Boolara
strain, as it is ubiquitously distributed throughout the MDB and is the dominant group in
Victoria (Davis et al. 1999). Group 5 likely represents the Yanco strain, as it is the
dominant group at Narrandera in the Murrumbidgee Catchment (ND site), close to where
Shearer and Mulley (1978) caught the Yanco-strain individuals in their study. The ability
of STUCTURE to detect these strains in the MDB, despite several generations of potential
interbreeding, may stem from the longevity of carp. Older individuals of ‘pure’ strain
ancestry may have been caught alongside younger, intercrossed progeny, as carp over 50
years in age have been caught in the wild (P. Sorenson, pers. comm.).
3.5.2. Population genetic structure
Significant variation among sites (AMOVA) and the heterogeneous distribution of the
strains indicate that carp in the MDB exhibit considerable population genetic structure.
Dams play a role in limiting gene flow, as among-site variation measured by AMOVA was

76
greater when samples from above dams were included than when only below-dam samples
were analyzed. All pairwise comparisons of allele frequencies between above- and below-
dams sites showed highly significant departures from panmixia. This genetic structuring is
not associated with isolation-by-distance. The lack of scatter around the y-axis (genetic
distance) in the plots of genetic distance against geographic distance is similar to a scenario
theoretically and empirically demonstrated by Hutchinson and Templeton (1999), in which
a lack of regional equilibrium, and migration and gene flow play a larger role in shaping
genetic structure than does genetic drift. The pattern of genetic structure can therefore be
attributed to contemporary barriers to dispersal that limit migration and gene flow, as well
as historical patterns of introduction and range expansion.
3.5.3. Genetic diversity
Although many invasive species show decreased levels of genetic diversity in their
introduced range relative to their native range (e.g. Hamner et al. 2007), some invasives
have comparable or greater levels of genetic diversity, because they originated from
multiple source populations and rapid population growth following establishment
minimized the loss of genetic diversity through drift (Zenger et al. 2003; Frankham 2005;
Hänfling 2007). Common carp in the MDB generally have high levels of genetic diversity,
with multiple strains detected in all regions, a large proportion (59%) of individuals
showing mixed-strain ancestry and no evidence for a recent population bottleneck. Only
three of the 15 management units (Burrendong Dam, Lake Keepit and the Wimmera
catchment) showed greatly reduced A, Ar, HE or HO relative to the domestic populations
(koi and Jaenschwalde carp) analyzed here. The high level of genetic diversity in the
Murrumbidgee catchment management unit is consistent with the presence of a self-
sustaining population of Yanco strain carp before the introductions of the Boolara and
Prospect strains. Overall values of A and Ar in MDB populations are greater than in
domestic populations in Europe (Kohlmann et al. 2005), invasive lampreys (Petromyzon
marinus Linnaeus, 1758) in the Great Lakes of North America (Bryan et al. 2005), and
invasive guppies (Poecilia reticulata Peters, 1859) in Queensland, Australia (Lindholm et
al. 2005). Genetic diversity, however, is less than estimates for indigenous populations of
wild carp reported by Kohlmann et al. (2005), although this may be due to the use of a
different set of microsatellite loci by Kohlmann et al. (2005). HE and HO for the
management units and the MDB as a whole are also lower than previous estimates for wild
and domestic carp in their native range (Kohlmann et al. 2005), freshwater fish overall

77
(DeWoody and Avise 2000), and invasive lampreys and guppies, and may have resulted
from the inclusion of different strains in the samples (Wahlund’s effect). The high level of
genetic diversity of carp in the MDB may have facilitated invasiveness and adaptation to
new environments.
3.5.4. History of introduction and range expansion
The following scenarios for the introductions and spread of carps in the MDB are
proposed. (1) As the Prospect strain was detected throughout the MDB, it was likely
introduced early, and perhaps expanded its range during the extensive 1950s floods. (2)
The widespread distribution of the Boolara strain is consistent with a range expansion
during large-scale floods in 1974–5 (Reid et al. 1997; Koehn et al. 2000), perhaps aided by
heterosis (hybrid vigour) resulting from mating with the already present Prospect strain. (3)
The scarcity of the Yanco strain in some regions indicates a range expansion after the
expansion of the Prospect and Boolara strains. Prospect and Boolara carp and their
intercrossed progeny may not have entered the Murrumbidgee catchment in significant
numbers until the 1974–1975 floods. Prospect and Boolara carps may have bred with the
resident Yanco carps, resulting in further heterosis and providing the genetic diversity
necessary for the descendents of introduced Yanco carp to lose their conspicuous orange
coloration and expand their range. Descendents of Yanco carp are now scarce in some of
the rivers in the Darling River catchment, because these rivers have remained partially
isolated from the rest of the MDB since the 1974–1975 floods. The Yanco strain was also
possibly prevented from penetrating far into the Victorian rivers and the upper reaches of
the Murray River by weirs and by the abundance of adult Boolara and Prospect strain carp
already present in these regions. (4) Koi carp have been released in low numbers
throughout the MDB, but have contributed little to the overall population. Thirty-seven
carp with 5–50% koi ancestry were detected above Burrinjuck Dam (BJ and CM sites) and
seven in the sample from Tasmania, consistent with the detection by Davis et al. (1999) of
putative koi haplotypes in Lake Burley Griffin (which is also located above Burrinjuck
Dam) and in Tasmania.
The establishment of carp above six of the large dams in the MDB indicates that carp were
present before the dams were constructed or were introduced by humans, as these dams are
too large to be submerged by flooding. Dispersal of sticky carp eggs on the feet or plumage
of waterfowl has been postulated as a mechanism of disperal (Gilligan and Rayner 2007),

78
although to date no empirical evidence to supports this. The following is proposed for
these populations. (1) The carp above the Eildon (EI) and Hume (LH) dams were likely
introduced from adjacent waterways, possibly those immediately downstream, as they have
a similar strain composition to these adjacent rivers. (2) The Keepit (KP), Wyangala (WY)
and Burrinjuck (BJ, CM) dam populations were likely introduced before the expansion of
the Yanco strain, as these populations include the Prospect and Boolara strains. (3) The
reduced levels of genetic diversity and prevalence of the Prospect strain above Burrendong
Dam (BD, MG) is consistent with a founding by a small number of Prospect-strain carp,
which may have been introduced from the Sydney Basin. This strain was unlikely present
before the construction of Burrendong Dam in 1967, as aging data from otoliths indicate
that the oldest of 300 carp caught in Burrendong Dam was spawned in 1989 (D.M.
Gilligan, unpublished data). As carp can live over 50 years in the wild (P.W. Sorenson,
pers. comm.), the rivers above Burrendong Dam were not likely populated with carp prior
to the dam’s construction. Whether these introductions are the results of accidental
releases, through use of carp as live bait or contamination of stocked native fish with carp
fry (Koehn et al. 2000), or of deliberate introductions is unknown.
3.5.5. Barriers to dispersal and management units
The presence of fifteen discrete genetic entities that could be classified as individual
management units were identified by the assignment tests and BARRIER analyses, in
conjunction with known dispersal barriers in the MDB. These management units are
illustrated in Figure 3.5, and supporting information appears in Appendix 3.4. Each
management unit corresponds with the presence of impoundments, naturally limited flows
and catchment boundaries. These units should be interpreted with some caution, however,
for two reasons. First, the ongoing construction of fishways (Stuart et al. 2008) and
improved flow management may increase connectivity between populations in various
regions and may render some units obsolete, although this could be minimized by the
inclusion of William’s carp-separation cages to reduce the movement of carp (Stuart et al.
2006b). Second, these units are defined over a broad area, including the whole river
catchment within the MDB. As additional barriers to dispersal may be present within each
unit, the fine details of the hydrology of each river system should also be considered when
implementing control programs. The proposed units, however, indicate which catchments
can be managed independently and which should be managed in conjunction with each
other units for the effective long-term control of invasive carp.

79
Figure 3.5. Proposed management units for common carp in the MDB. Units are based on
genetic discontinuities and geographic barriers to dispersal (see Appendix 3.4).
3.6. Acknowledgements
We thank Lee Miles and Jaime Gongora for assistance with calling genotypes, Chris
Moran and Lee Ann Rollins for assistance with manuscript preparation, and Zung Doan for
technical support. We are indebted to Klaus Kohlmann for supplying samples from
Germany, and to Leanne Faulks, Vanessa Carracher, Peter Boyd, Ben Smith, Michael
Hutchinson, Stephanie Backhouse, Paul Brown, Dean Hartwell, Cameron McGregor and
Jawahir Patil for collecting samples from Australia. Funding support was provided by the
Fisheries R&D Corporation, the Murray-Darling Basin Commission, the Invasive Animals
Cooperative Research Centre, the NSW Department of Primary Industries and the
University of Sydney.
80
3.7. References
Anderson, H. K. (1920). Rescue operation on the Murrumbidgee River. The Australian
Zoologist 1, 157-160.
Balon, E. K. (1995). Origin and domestication of the wild carp, Cyprinus carpio: from
Roman Gourmets to the swimming flower. Aquaculture 129, 3-48. doi:
10.1016/0044-8486(94)00227-F
Benjamini, Y. & Hochberg, Y. (1995). Controlling the false discovery rate: a practical and
powerful approach to multiple testing. Journal of the Royal Statistical Society:
Series B (Statistical Methodology) 57, 289-300.
Benjamini, Y. & Yekutieli, D. (2001). The control of the false discovery rate in multiple
hypothesis testing under dependency. Annals of Statistics 29, 1165-1188.
Brown, P. (1996). Fish Facts 4 Carp in Australia. Narrandera, Australia: NSW Fisheries
(now part of the NSW Department of Primary Industries).
Brownstein, M. J., Carpten, J. D. & Smith, J. R. (1996). Modulation of non-templated
nucleotide addition by Taq DNA polymerase: primer modifications the facilitate
genotyping. BioTechniques 20, 1004-1010.
Bryan, M. B., Zalinski, D., Filcek, K. B., Libants, S., LI, W. & Scribner, K. T. (2005).
Patterns of invasion and colonization of the sea lamprey (Petromyzon marinus) in
North America as revealed by microsatellite genotypes. Molecular Ecology 14,
3757–3773. doi: 10.1111/j.1365-294X.2005.02716.x.
Clements, J. (1988). Salmon at the Antipodes A History and Review of Trout, Salmon and
Char and Introduced Coarse Fish in Australasia. Ballarat, Victoria, Australia:
Published by the author.
Cornuet, J. M. & Luikart, G. (1996). Description and power analysis of two tests for
detecting recent population bottlenecks from allele frequency data. Genetics 144,
2001-2014.
Crooijmans, R. P. M. A., Bierbooms, V. A. F., Komen, J., Van der Poel, J. J. & Groenen,
M. A. M. (1997). Microsatellite markers in common carp (Cyprinus carpio L.).
Animal Genetics 28, 129-134. doi: 10.1111/j.1365-2052.1997.00097.x.
David, L., Rajasekaran, P., Fang, J., Hillel, J. & Lavi, U. (2001). Polymorphisms in
ornamental and common carp strains (Cyprinus carpio L.) as revealed by AFLP
analysis and a new set of microsatellite markers. Molecular Genetics and Genomics
266, 353-362. doi: 10.1007/s004380100569.

81
Davis, K. M., Dixon, P. I. & Harris, J. H. (1999). Allozyme and mitochondrial DNA
analysis of carp, Cyprinus carpio L., from south-eastern Australia. Marine and
Freshwater Resources 50, 253-260. doi: 10.1071/MF97256
DeWoody, J. A. & Avise, J. C. (2000). Microsatellite variation in marine, freshwater and
anadromous fishes compared with other animals. Journal of Fish Biology 56, 461–
473. doi: 10.1111/j.1095-8649.2000.tb00748.x.
Evanno, G., Regnaut, S. & Goudet, J. (2005). Detecting the number of clusters of
individuals using the sortware STRUCTURE: a simulation study. Molecular
Ecology 14, 2611-2620. doi: 10.1111/j.1365-294X.2005.02553.x.
Excoffier, L., Laval, G. & Schneider, S. (2005). Arlequin ver. 3.0: An integrated software
package for population genetics data analysis. Evolutionary Bioinformatics Online
1, 47-50.
Excoffier, L., Smouse, P. E. & Quattro, J. M. (1992). Analysis of molecular variance
inferred from metric distances among DNA haplotypes: application to human
mitochondrial DNA restriction data. Genetics 131, 479-491.
Falush, D., Stephens, M. & Pritchard, J. K. (2003). Inference of Population Structure Using
Multilocus Genotype Data: Linked Loci and Correlated Allele Frequencies
Genetics 164, 1567-1587.
Frankham, R. (2005). Resolving the genetic paradox in invasive species. Heredity 94, 385.
doi: 10.1038/sj.hdy.6800634.
Gilligan, D. & Rayner, T. (2007). The distribution, spread, ecological impacts, and
potential control of carp in the upper Murray River. In NSW Department of Primary
Industries - Fisheries Research Report Series Sydney: NSW Department of
Primary Industries.
Graham, K. J., Lowry, M. B. & Walford, T. R. (2005). Carp in NSW: assessment of
distribution, fishery and fishing methods. In Fisheries Final Report Series No. 72.
Cronulla, Australia: NSW Department of Primary Industries.
Hamner, R. M., Freshwater, D. W. & Whitfield, P. E. (2007). Mitochondrial cytochrome b
analysis reveals two invasive lionfish species with strong founder effects in the
western Atlantic. Journal of Fish Biology 71 (Supplement B), 214-222. doi:
10.1111/j.1095-8649.2007.01575.x.
Hänfling, B. (2007). Understanding the establishment success of non-indigenous fishes:
lessons from population genetics. Journal of Fish Biology 71 (Supplement D),
115-135. doi: 10.1111/j.1095-8649.2007.01685.x.
82
Hänfling, B., Boton, P., Harley, M. & Carvalho, G. R. (2005). A molecular approach to
detect hybridisation between crucian carp (Carassis carassius) and non-indigenous
carp species (Carassisus cpp. and Cyprinus carpio). Freshwater Biology 50, 403-
417. doi:10.1111/j.1365-2427.2004.01330.x.
Harris, J. H. & Gehrke, P. C. (1997). Fish and rivers in stress - the NSW rivers survey.
Cronulla and Canberra: NSW Fisheries Office of Conservation & the Cooperative
Research Centre for Freshwater Ecology.
Hutchinson, D. W. & Templeton, A. R. (1999). Correlations of pairwise genetic distance
and geographic distance measures: inferring the relarive influences of gene flow
and drift on the distribution of genetic variability. Evolution 53, 1898-1914.
Kalinowski, S. T. (2005). HP-RARE 1.0: a computer program for performing rarefaction
on measures of allelic richness. Molecular Ecology Notes 5, 187–189. doi:
10.1111/j.1471-8286.2004.00845.x.
Koehn, J. (2004). Carp (Cyprinus carpio) as a powerful invader in Australian waterways.
Freshwater Biology 49, 882-894. doi: 10.1111/j.1365-2427.2004.01232.x.
Koehn, J., Brumley, B. & Gehrke, P. (2000). Managing the Impacts of Carp. Canberra,
Australia: Bureau of Rural Sciences (Department of Agriculture, Fisheries and
Forestry).
Kohlmann, K., Kersten, P. & Flajshans, M. (2005). Microsatellite-based genetic variability
and differentiation of domesticated, wild and feral common carp (Cyprinus carpio
L.) populations. Aquaculture 247, 253-256. doi:10.1016/j.aquaculture.2005.02.024.
Lindholm, A. K., Brenden, F., Alexander, H. J., Chan, W.-K., Thakurta, S. G. & Brooks,
R. (2005). Invasion success and genetic diversity of introduced populations of
guppies Poecilia reticulata in Australia. Molecular Ecology 14, 3671-3682. doi:
10.1111/j.1365-294X.2005.02697.x.
Manni, F., Guérard, E. & Heyer, E. (2004). Geographic patterns of (genetic, morphologic,
linguistic) variation: how barriers can be detected by "Monmonier's algorithm".
Human Biology 76, 173-190.
Moritz, C. (1994). Defining evolutionary significant units for conservation. Trends in
Ecology and Evolution 9, 373-375. doi: 10.1016/0169-5347(94)90057-4.
Peakall, R. & Smouse, P. E. (2006). GENALEX 6: genetic analysis in EXCEL. Population
genetic software for teaching and research. Molecular Ecology Notes 6, 288-295.
doi: 10.1111/j.1471-8286.2005.01155.x.

83
Pirey, S., Luikart, G. & Cornuet, J. M. (1999). BOTTLENECK: a computer program for
detecting recent reductions in the effective population size using allele frequency
data. Journal of Heredity 90, 502-503.
Pollard, K. S., Dudoit, S. & van der Laan, L. J. (2008). Multiple testing procedures: R
multtest package and applications to genomics U.C. Berkeley Division of
Biostatistics Working Paper Series. Working Paper 164.
http://www.bepress.com/ucbbiostat/paper164.
Pritchard, J. K., Stefens, M. & Donelly, P. (2000). Inference of population structure using
multilocus genotype data. Genetics 155, 945-959.
Raymond, M. & Rousset, F. (1995). GENEPOP (version 1.2): population genetics software
for exact tests and eumenicism. Journal of Heredity 86, 248-249.
Reid, D. D., Harris, J. H. & Chapman, D. J. (1997). NSW Inland Commercial Fishery Data
Analysis. In FRDC Project No. 94/027. Sydney, Australia: Fisheries Research &
Development Corporation, NSW Fisheries, Cooperative Research Centre for
Freshwater Ecology.
Reiner, A., Yekutieli, D. & Benjamini, Y. (2003). Identifying differentially expressed
genes using false discovery rate controlling procedures. Bioinformatics 19, 368-
375.
Reynolds, J., Weir, B. S. & Cockerham, C. C. (1983). Estimation of the coancestry
coefficient: basis for a short-term genetic distance. Genetics 105, 767-779.
Shearer, K. D. & Mulley, J. C. (1978). The introduction and distribution of the carp,
Cyprinus carpio Linnaeus, in Australia. Australian Journal of Marine and
Freshwater Research 29, 661-563. doi:10.1071/MF9780551
Shuber, A. P., Grondin, V. J. & Klinger, K. W. (1995). A simplified procedure for
developing multiplex PCRs. Genome Research 5, 488-493.
Slatkin, M. (1991). Inbreeding coefficients and coalescence times. Genetical Research,
Cambridge 58, 167-175.
Stead, D. G. (1929). Introduction of the great carp Cyprinus carpio into waters of New
South Wales. Australian Zoologist 6, 100-102.
Stuart, I. G., Williams, A., McKenzie, J. & Holt, T. (2006). Managing a migratory pest
species: a selective trap for common carp. North American Journal of Fisheries
Management 26, 888-893.

84
Stuart, I. G., Zampatti, B. P. & Baumgartner, L. J. (2008). Can a low-gradient vertical-slot
fishway provide passage for a lowland river fish community? Marine and
Freshwater Research 59, 332-346. doi: 10.1071/MF07141
Wasko, A. P., Martins, C., Oliveira, C. & Foresti, F. (2003). Non-destructive genetic
sampling of fish. An improved mehtod for DNA extraction from fish fins and
scales. Hereditas 138, 161-165. doi:10.1034/j.1601-5223.2003.01503.x.
Weir, B. S. & Cockerham, C. C. (1984). Estimating F-statistics for the analysis of
population structure. Evolution 38, 1358-1370.
Yue, G. H., Ho, M. Y., Orban, L. & Komen, J. (2004). Microsatellites within genes and
ESTs of common carp and their applicability in silver crucian carp. Aquaculture
234, 85-98. doi:10.1016/j.aquaculture.2003.12.021.
Zenger, K. R., Richardson, B. J. & Vachot-Griffin, A.-M. (2003). A rapid population
expansion retains genetic diversity within European rabbits in Australia. Molecular
Ecology 12, 789-794. doi:10.1046/j.1365-294X.2003.01759.x.
Zheng, W., Stacey, N. E., Coffin, J. & Strobeck, C. (1995). Isolation and characterization
of microsatellites loci in the goldfish Carassius auratus. Molecular Ecology 4, 791-
792.
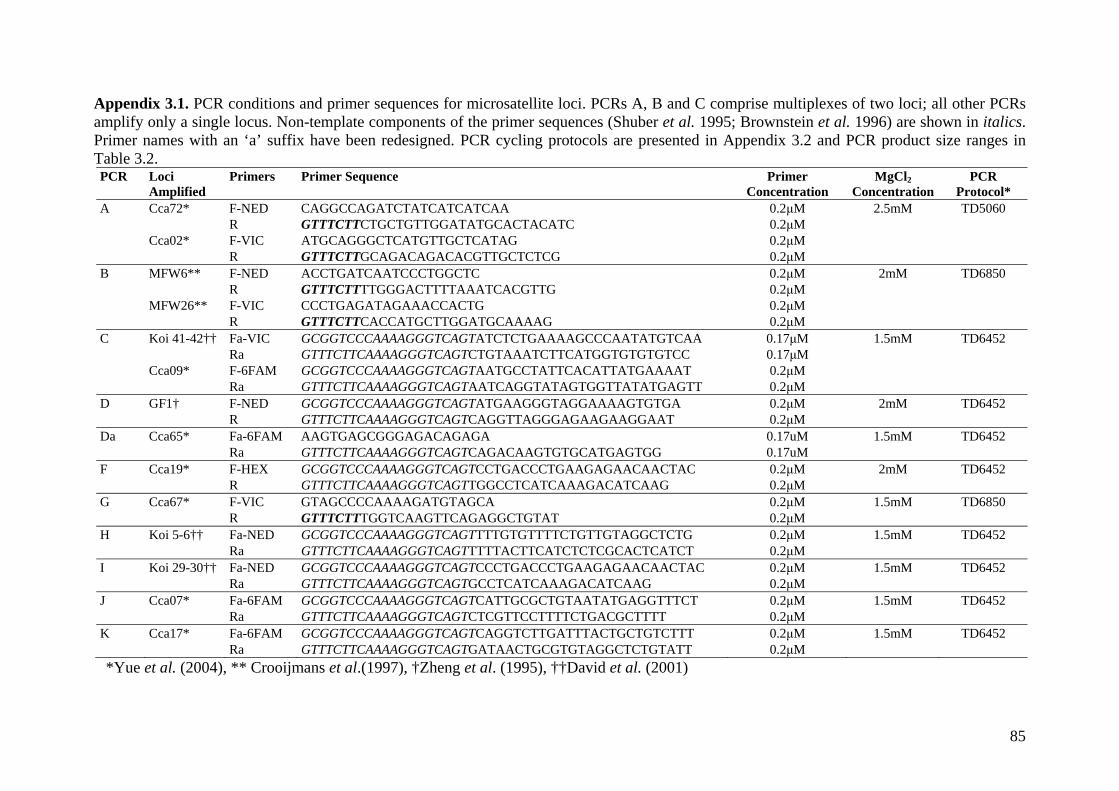
85
Appendix 3.1. PCR conditions and primer sequences for microsatellite loci. PCRs A, B and C comprise multiplexes of two loci; all other PCRs amplify only a single locus. Non-template components of the primer sequences (Shuber et al. 1995; Brownstein et al. 1996) are shown in italics. Primer names with an ‘a’ suffix have been redesigned. PCR cycling protocols are presented in Appendix 3.2 and PCR product size ranges in Table 3.2. PCR Loci
Amplified Primers Primer Sequence Primer
Concentration MgCl2
ConcentrationPCR
Protocol* A Cca72* F-NED CAGGCCAGATCTATCATCATCAA 0.2μM 2.5mM TD5060 R GTTTCTTCTGCTGTTGGATATGCACTACATC 0.2μM Cca02* F-VIC ATGCAGGGCTCATGTTGCTCATAG 0.2μM R GTTTCTTGCAGACAGACACGTTGCTCTCG 0.2μM B MFW6** F-NED ACCTGATCAATCCCTGGCTC 0.2μM 2mM TD6850 R GTTTCTTTTGGGACTTTTAAATCACGTTG 0.2μM MFW26** F-VIC CCCTGAGATAGAAACCACTG 0.2μM R GTTTCTTCACCATGCTTGGATGCAAAAG 0.2μM C Koi 41-42†† Fa-VIC GCGGTCCCAAAAGGGTCAGTATCTCTGAAAAGCCCAATATGTCAA 0.17μM 1.5mM TD6452 Ra GTTTCTTCAAAAGGGTCAGTCTGTAAATCTTCATGGTGTGTGTCC 0.17μM Cca09* F-6FAM GCGGTCCCAAAAGGGTCAGTAATGCCTATTCACATTATGAAAAT 0.2μM Ra GTTTCTTCAAAAGGGTCAGTAATCAGGTATAGTGGTTATATGAGTT 0.2μM D GF1† F-NED GCGGTCCCAAAAGGGTCAGTATGAAGGGTAGGAAAAGTGTGA 0.2μM 2mM TD6452 R GTTTCTTCAAAAGGGTCAGTCAGGTTAGGGAGAAGAAGGAAT 0.2μM Da Cca65* Fa-6FAM AAGTGAGCGGGAGACAGAGA 0.17uM 1.5mM TD6452 Ra GTTTCTTCAAAAGGGTCAGTCAGACAAGTGTGCATGAGTGG 0.17uM F Cca19* F-HEX GCGGTCCCAAAAGGGTCAGTCCTGACCCTGAAGAGAACAACTAC 0.2μM 2mM TD6452 R GTTTCTTCAAAAGGGTCAGTTGGCCTCATCAAAGACATCAAG 0.2μM G Cca67* F-VIC GTAGCCCCAAAAGATGTAGCA 0.2μM 1.5mM TD6850 R GTTTCTTTGGTCAAGTTCAGAGGCTGTAT 0.2μM H Koi 5-6†† Fa-NED GCGGTCCCAAAAGGGTCAGTTTTGTGTTTTCTGTTGTAGGCTCTG 0.2μM 1.5mM TD6452 Ra GTTTCTTCAAAAGGGTCAGTTTTTACTTCATCTCTCGCACTCATCT 0.2μM I Koi 29-30†† Fa-NED GCGGTCCCAAAAGGGTCAGTCCCTGACCCTGAAGAGAACAACTAC 0.2μM 1.5mM TD6452 Ra GTTTCTTCAAAAGGGTCAGTGCCTCATCAAAGACATCAAG 0.2μM J Cca07* Fa-6FAM GCGGTCCCAAAAGGGTCAGTCATTGCGCTGTAATATGAGGTTTCT 0.2μM 1.5mM TD6452 Ra GTTTCTTCAAAAGGGTCAGTCTCGTTCCTTTTCTGACGCTTTT 0.2μM K Cca17* Fa-6FAM GCGGTCCCAAAAGGGTCAGTCAGGTCTTGATTTACTGCTGTCTTT 0.2μM 1.5mM TD6452 Ra GTTTCTTCAAAAGGGTCAGTGATAACTGCGTGTAGGCTCTGTATT 0.2μM
*Yue et al. (2004), ** Crooijmans et al.(1997), †Zheng et al. (1995), ††David et al. (2001)
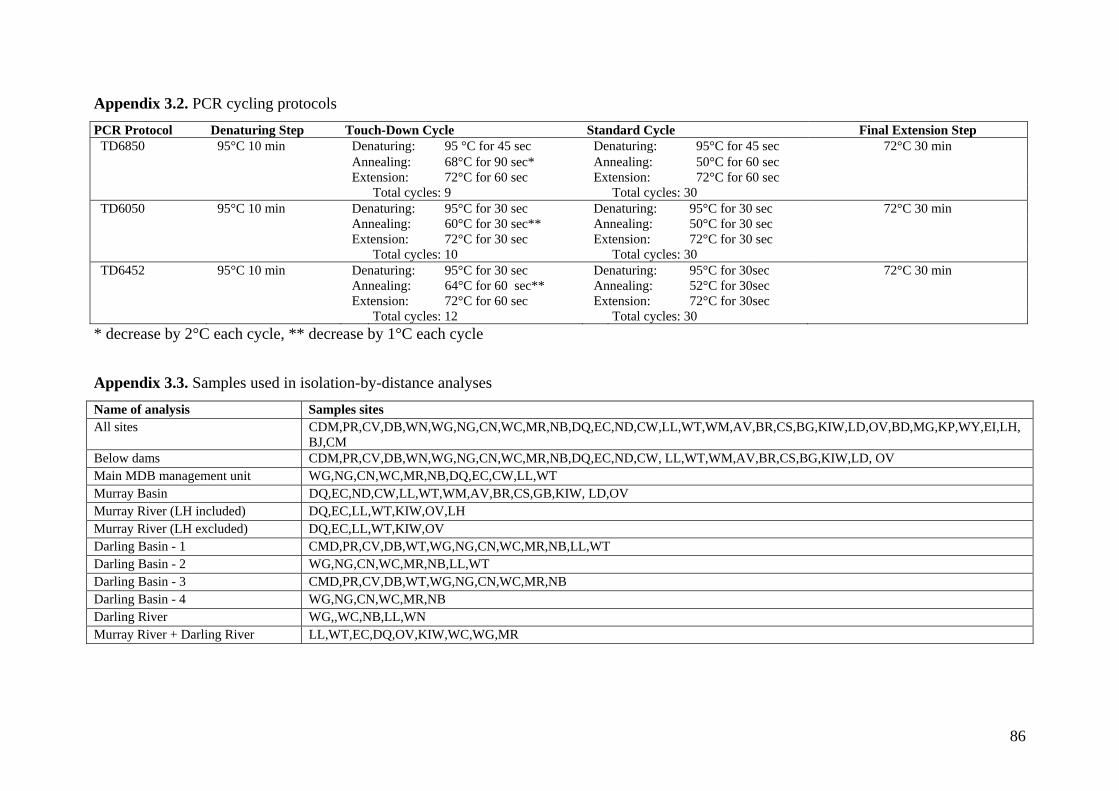
86
Appendix 3.2. PCR cycling protocols PCR Protocol Denaturing Step Touch-Down Cycle Standard Cycle Final Extension Step TD6850 95°C 10 min Denaturing: 95 °C for 45 sec Denaturing: 95°C for 45 sec 72°C 30 min Annealing: 68°C for 90 sec* Annealing: 50°C for 60 sec Extension: 72°C for 60 sec Extension: 72°C for 60 sec Total cycles: 9 Total cycles: 30 TD6050 95°C 10 min Denaturing: 95°C for 30 sec Denaturing: 95°C for 30 sec 72°C 30 min Annealing: 60°C for 30 sec** Annealing: 50°C for 30 sec Extension: 72°C for 30 sec Extension: 72°C for 30 sec Total cycles: 10 Total cycles: 30 TD6452 95°C 10 min Denaturing: 95°C for 30 sec Denaturing: 95°C for 30sec 72°C 30 min Annealing: 64°C for 60 sec** Annealing: 52°C for 30sec
Extension: 72°C for 60 sec Extension: 72°C for 30sec Total cycles: 12 Total cycles: 30
* decrease by 2°C each cycle, ** decrease by 1°C each cycle Appendix 3.3. Samples used in isolation-by-distance analyses Name of analysis Samples sites All sites CDM,PR,CV,DB,WN,WG,NG,CN,WC,MR,NB,DQ,EC,ND,CW,LL,WT,WM,AV,BR,CS,BG,KIW,LD,OV,BD,MG,KP,WY,EI,LH,
BJ,CM Below dams CDM,PR,CV,DB,WN,WG,NG,CN,WC,MR,NB,DQ,EC,ND,CW, LL,WT,WM,AV,BR,CS,BG,KIW,LD, OV Main MDB management unit WG,NG,CN,WC,MR,NB,DQ,EC,CW,LL,WT Murray Basin DQ,EC,ND,CW,LL,WT,WM,AV,BR,CS,GB,KIW, LD,OV Murray River (LH included) DQ,EC,LL,WT,KIW,OV,LH Murray River (LH excluded) DQ,EC,LL,WT,KIW,OV Darling Basin - 1 CMD,PR,CV,DB,WT,WG,NG,CN,WC,MR,NB,LL,WT Darling Basin - 2 WG,NG,CN,WC,MR,NB,LL,WT Darling Basin - 3 CMD,PR,CV,DB,WT,WG,NG,CN,WC,MR,NB Darling Basin - 4 WG,NG,CN,WC,MR,NB Darling River WG,,WC,NB,LL,WN Murray River + Darling River LL,WT,EC,DQ,OV,KIW,WC,WG,MR

87
Appendix 3.4. Management units for common carp in the MDB. A map of these units is given in Figure 3.4.
Unit Sample sites Reason for delimiting as a management unit Main MDB LL, WT, EC, DQ, CW,
BK, WC, WG, MR, NG, CN, NB, WM
Multiple known barriers to dispersal, multiple genetic discontinuities detected by STRUCTURE (predominantly Prospect, Yanco and Boolara strains present) and BARRIER. Although the Yanco strain is more prevalent in the Darling catchment than in the Murray catchment, sites from both catchments are included in the management units as a genetic discontinuity was not detected by BARRIER between the two catchments.
Paroo-Warrego Catchments
PR, CV Genetic discontinuity detected by STRUCTURE (predominantly Prospect and Boolara strain) and BARRIER; Paroo and Warrego Rivers linked by irrigation channels.
Condamine Catchment
CDM Genetic discontinuity detected by STRUCTURE (predominantly Boolara strain) and BARRIER
Macquarie Catchment
WN, DB Genetic discontinuity detected by STRUCTURE (predominantly Prospect and Boolara strain) and BARRIER. Both sites in the Macquarie River (WN and DB) are proposed to be part of the same management unit, despite discontinuities being consistently detected between them by BARRIER, because there are no major barriers to dispersal between the two sites. The discontinuity is likely an artefact of the predominantly Prospect strain carp in Burrendong Dam dispersing downstream and hence being more prevalent at the WN site immediately below the dam outlet than at the more distant DB site.
Murrumbidgee Catchment
ND Genetic discontinuity detected by STRUCTURE (predominantly Yanco strain) and BARRIER
Wimmera Catchment
WM Strongly isolated from other parts of the MDB, genetic discontinuity detected for Slatkin’s FST by BARRIER
Avoca-Loddon Catchments
AV, LD Genetic discontinuity detected by STRUCTURE (predominantly Prospect and Boolara strain) and BARRIER
Central Victoria BR, GB, CS Genetic discontinuity detected by STRUCTURE (predominantly Prospect and Boolara strain) and BARRIER
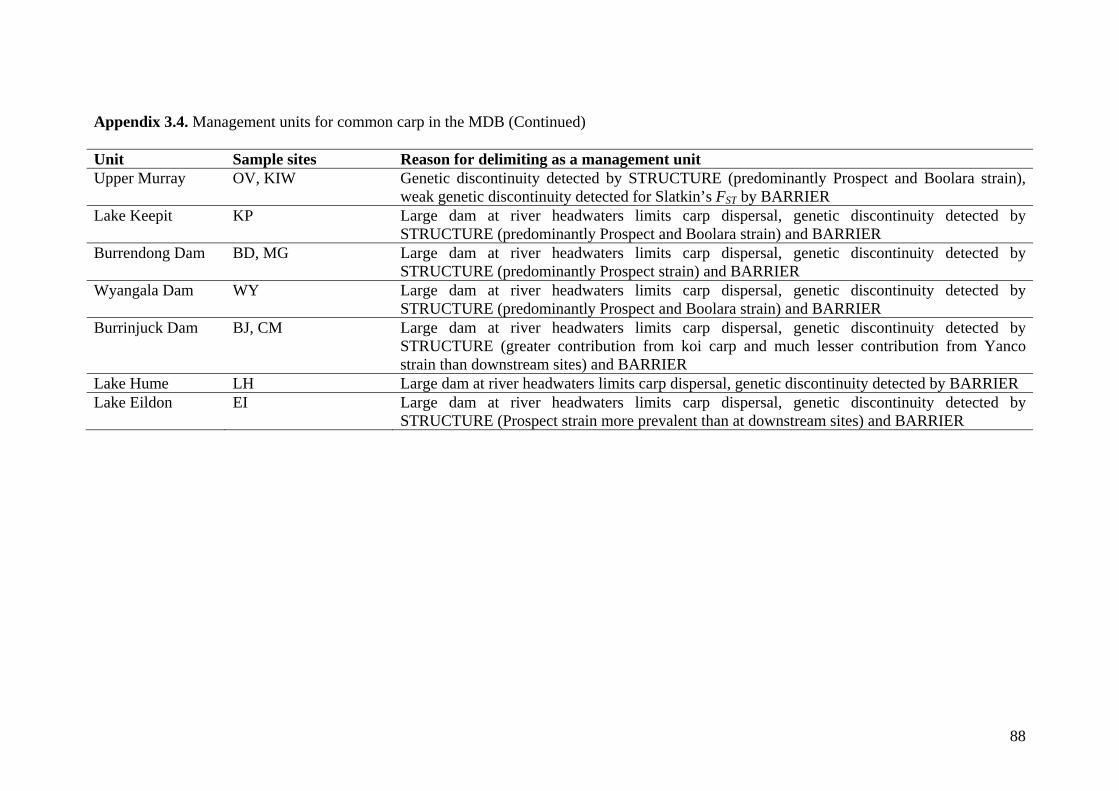
88
Appendix 3.4. Management units for common carp in the MDB (Continued) Unit Sample sites Reason for delimiting as a management unit Upper Murray OV, KIW Genetic discontinuity detected by STRUCTURE (predominantly Prospect and Boolara strain),
weak genetic discontinuity detected for Slatkin’s FST by BARRIER Lake Keepit KP Large dam at river headwaters limits carp dispersal, genetic discontinuity detected by
STRUCTURE (predominantly Prospect and Boolara strain) and BARRIER Burrendong Dam BD, MG Large dam at river headwaters limits carp dispersal, genetic discontinuity detected by
STRUCTURE (predominantly Prospect strain) and BARRIER Wyangala Dam WY Large dam at river headwaters limits carp dispersal, genetic discontinuity detected by
STRUCTURE (predominantly Prospect and Boolara strain) and BARRIER Burrinjuck Dam BJ, CM Large dam at river headwaters limits carp dispersal, genetic discontinuity detected by
STRUCTURE (greater contribution from koi carp and much lesser contribution from Yanco strain than downstream sites) and BARRIER
Lake Hume LH Large dam at river headwaters limits carp dispersal, genetic discontinuity detected by BARRIER Lake Eildon EI Large dam at river headwaters limits carp dispersal, genetic discontinuity detected by
STRUCTURE (Prospect strain more prevalent than at downstream sites) and BARRIER

89
Chapter 4: Invasive common carp (Cyprinus carpio L.) in Australia:
origin of founding strains and population genetics of coastal waterways
Submitted to Heredity: 27.11.2008
Authors: Mr. Gwilym David Haynes1, Dr. Dean M. Gilligan2, Dr. Peter Grewe3, Prof.
Chris Moran1, Prof. Frank W. Nicholas1
1Faculty of Veterinary Science, University of Sydney, NSW 2006, Australia
2NSW Department of Primary Industries (Fisheries), Batemans Bay, NSW 2536, Australia
3Division of Marine Research, Castray Esplanade, Hobart, TAS 7000, Australia
Corresponding Author: Mr. Gwilym David Haynes, room 505, Faculty of Veterinary
Science, NSW 2006 Australia; phone (mobile) +61424260712, FAX +61 2 9351 2114,
email: [email protected], [email protected]
Key words: population genetics, common carp, Cyprinus carpio, invasive species, koi,
microsatellite
Running Title: Origin of common carp in Australia
90
4.1. Abstract
Common carp (Cyprinus carpio) are a highly invasive freshwater fish species in many
places around the world, including Australia. In a previous study, we confirmed the
findings of earlier genetic studies that four strains of carp – Japanese koi, Prospect, Boolara
and Yanco - have been introduced into Australia. In this study, the origin of the strains is
investigated by comparing representatives of each strain with populations from Europe
using factorial correspondence analysis (FCA). As isolated populations were not available
for all strains, groups of individuals’ representative of the Boolara and Yanco strains were
inferred from the assignment tests of the previous study. It was found that the Prospect,
Boolara and Yanco strains are descended essentially from the European/central-Asian carp
subspecies C. carpio subsp. carpio. The population genetics of common carp in the east
coast of Australia is also investigated. Coastal populations exhibited levels of genetic
variation comparable with domestic populations (although lower than indigenous, wild
populations), were non-panmictic and contained different proportions of each strain,
consistent with each being an independent population founded in separate introduction
events. Recommendations are made for preventing the further spread of carp in the rest of
Australia.
4.2. Introduction
The common carp (Cyprinus carpio L.) are the oldest cultivated species of freshwater fish
in the world, having been reared in ponds in China as early as the 5th century BC (Horváth
et al. 2002), and in Europe at least as early as the Middle Ages (Balon 1995). While the
native range of common carp extends from Japan to the River Danube in Eastern Europe
(Balon 1995; Mabuchi et al. 2005), human cultivation has introduced them into many new
waterways throughout Asia, Africa, the Americas, Oceania and Australia (Koehn 2004).
Potential problems associated with the introduction of common carp outside their natural

91
range include uprooting of aquatic vegetation, undermining of river banks, increased water
turbidity, competition with indigenous freshwater species, increased incidence of blue-
green algal blooms and alteration of the trophic cascade of the waterway (Koehn et al.
2000; Angeler et al. 2002; Parkos III et al. 2003; Tapia and Zambrano 2003; Pinto et al.
2005). However, the extent to which these problems can be attributed to carp invasion or to
anthropogenic changes to ecosystems is still unclear (Hume et al. 1983a; Koehn et al.
2000).
Common carp are frequently separated into two subspecies: the central-Asian/European C.
carpio subsp. carpio and the east-Asian subspecies C. carpio subsp. haematopterus. This
separation is supported by microsatellite and mitochondrial genetic data (Kohlmann et al.
2003; Zhou et al. 2003; Zhou et al. 2004b; Kohlmann et al. 2005). The division of C. c.
haematopterus into additional southeast-Asian subspecies is also suggested by some
researchers (e.g. Kirpichnikov 1981; Zhou et al. 2004b).
Common carp have been introduced into Australia on a number of different occasions
since the late 19th century (Clements 1988; Koehn et al. 2000), and has spread from
introduction sites through a combination of natural range expansion and intentional and
accidental release (Koehn et al. 2000). They are now established in all states and
territories, bar the Northern Territory (Koehn 2004), and are currently the dominant species
in the Murray-Darling Basin (MDB) (Harris and Gehrke 1997; Koehn et al. 2000),
Australia’s largest river system.
Previous studies indicated that at least four strains of common carp have been introduced
into Australia: Yanco, Boolara, Prospect, and koi (Shearer and Mulley 1978; Davis et al.
92
1999; Haynes et al. submitted). Koi carp originate from Japan, where they have a long
history of cultivation and selective breeding for ornamental traits (Balon 1995). Koi belong
essentially to the east-Asian subsp. haematopterus, although crossing with subsp. carpio
does sometimes occurred in their breeding (Balon, 1995). The Prospect strain was founded
from fourteen fingerlings in 1907-08, but the origin of these fingerlings in unknown (Stead
1929). The Boolara strain is alleged to have been imported illegally from Germany, but
this was never been proven (Clements 1988). It has been suggested that the orange-
coloured Yanco strain was sourced from Singapore (Shearer and Mulley 1978) or from
colourful carp of unknown origin held in the Melbourne Botanical Gardens from the late
19th century till 1962 (Clements, 1988), but no rigorous direct comparisons have been
made to confirm either of these suggestions. Assignment testing using the program
Structure version 2.1 (Pritchard et al. 2000) in our previous study (Haynes et al. submitted)
confirmed the existence of all four strains, and indicated that in the MDB, the Prospect and
Boolara strains are distributed almost ubiquitously, the Yanco strain is also widespread,
and koi make only a small contribution to the overall genetic diversity. The history of the
four strains is summarised in Table 4.1.
In this study, the four strains of common carp in Australia are compared to populations
from Europe to investigate whether the Prospect, Yanco, and Boolara strains are of
European (subsp. carpio) or east-Asian (subsp. haematopterus) origin. The population
genetics of introduced carp populations from three coastal waterways in New South Wales
is also investigated. This is the first time nuclear genetic markers have been used to
specifically investigate the origin of invasive common carp populations.

93
4.3. Materials and Methods
4.3.1. Selection of individuals to represent the strains of common carp in Australia
Samples of Prospect (P) and koi (K) strain carp that had been maintained in isolation from
other carp strains were used in our previous study (Haynes et al. submitted), with Prospect
strain individuals being collected from Prospect Reservoir in Sydney, Australia, and koi
carp donated by fish farms in Sydney and Germany. These same samples were used to
represent the Prospect and koi strains in this study, with the exception of a small number of
koi samples that were excluded from the present study after applying a more stringent
criteria for proportion of loci scoreable than Haynes et al. (submitted). The Australian
strains investigated in this study are summarised in Table 4.1.
Individuals representative of the Yanco (Y) and Boolara (B) strains were identified for this
study from the assignment test implemented in the program Structure version 2.1
(Pritchard et al. 2000) in our previous study (Haynes et al. submitted). Structure
implements a Bayesian clustering analysis that assigns individuals into population clusters
under the assumption of Hardy-Weinberg (HW) and linkage equilibrium. Structure has an
advantage over other assignment programs, in that individuals rather than populations are
assigned into population clusters, and that individual can be assigned solely on the basis of
their genotype, without reference to where they were sampled. An individual can be
assigned completely (100%) to a single cluster, or can be a hybrid of two or more clusters.
In the analysis of Haynes et al. (submitted), four Structure-assigned clusters were
considered highly likely to be synonymous with the four strains of common carp known to
have been introduced into Australia. For the present study, individuals that had been
assigned 95-100% to either of the clusters presumed to be synonymous with Boolara or
Yanco strains were assumed to be a ‘pure’ representative of the relevant strain. In this way,
94
118 Boolara and 85 Yanco strain individuals were identified for the present study, from the
983 MDB samples analysed by Haynes et al. (submitted).
4.3.2. European common carp populations
Tissue samples from wild common carp from the River Danube (D) (Germany), domestic
mirror-scale common carp (J) (fish farm in Jaenschwalde, Germany), and Ropsha strain
common carp (R) (maintained in a live gene bank in the Czech Republic) were generously
donated by Dr. Kohlmann; and samples of wild and domestic common carp from England
(UK) and from River Danube (D) (Germany) donated by Dr. Hänfling. The domestic
mirror-scale carp likely represent ‘pure’ European subsp. carpio, with little or no genetic
contribution from non-European populations (Kohlmann, pers. comm.). The River Danube
and Ropsha strain comprise a mixture of European subsp. carpio and east-Asian subsp.
haematopterus, as Asian varieties have escaped and been released into the River Danube in
recent times (Kohlmann, pers. comm.) and the Ropsha strain was developed by crossing
domestic European subsp. carpio with wild subsp. haematopterus from the River Amur in
east-Asia (Zonova and Kirpichnikov 1968). The English common carp were sourced from
local waterways in Hampshire and Hertfordshire, and from Riverfield Carp Farm in Kent
(Hänfling, pers comm.). These European populations are summarised in Table 4.2.

95
Table 4.1. Founding strains of common carp used in this study
Strain History of introduction and spread Location samples
N References
Prospect (P)
Founded from 14 fingerlings in 1907-08 in Prospect Reservoir in the Sydney catchment, and used to seed multiple populations around Sydney. Suggested as having European origin. Currently form a self-sustaining population in Prospect Reservoir, Sydney. Found extensively throughout MDB.
Prospect Reservoir*
23 Stead (1929), Shearer and Mulley (1978), Davis et al. (1999), Haynes et al. (submitted).
Boolara (B)
Distributed to farm dams around Victoria in the early 1960s by Boolara Fish Farms Ltd. Escaped into the MDB in 1968 and are now widespread. Claimed by Boolara Fish Farms Ltd. to have been sourced from Prospect Reservoir. Alleged to have been illegally imported from Germany.
MDB* 29 Shearer and Mulley (1978), Clements (1988), Brown (1996), Haynes et al. (submitted)
Yanco (Y) Established in MDB between 1920 and 1950. Originally orange coloured, but introgression with Prospect and Boolara strains has masked this colouration. Origin is unknown, although they have been suggested as being a feral form of Singapore koi, or as being sourced from the colourful carp that formerly present in the Melbourne Botanical gardens. Currently found throughout the MDB.
MDB* 38 Shearer and Mulley (1978), Clements (1988), Brown (1996), Haynes et al. (submitted)
Koi (K) Originally selectively bred for novel colourations in Japan. Now a popular aquarium and pond variety of common carp in many places. Have made a minor contribution to genetic diversity of common carp in the MDB.
Fish farms in Sydney and Germany*
50 Balon (1995), Haynes et al. (submitted)
*Same samples used by Haynes et al. (submitted), †Same samples used by Kohlmann et al. (2005), ††Same samples used by Hänfling et al.
(2005)
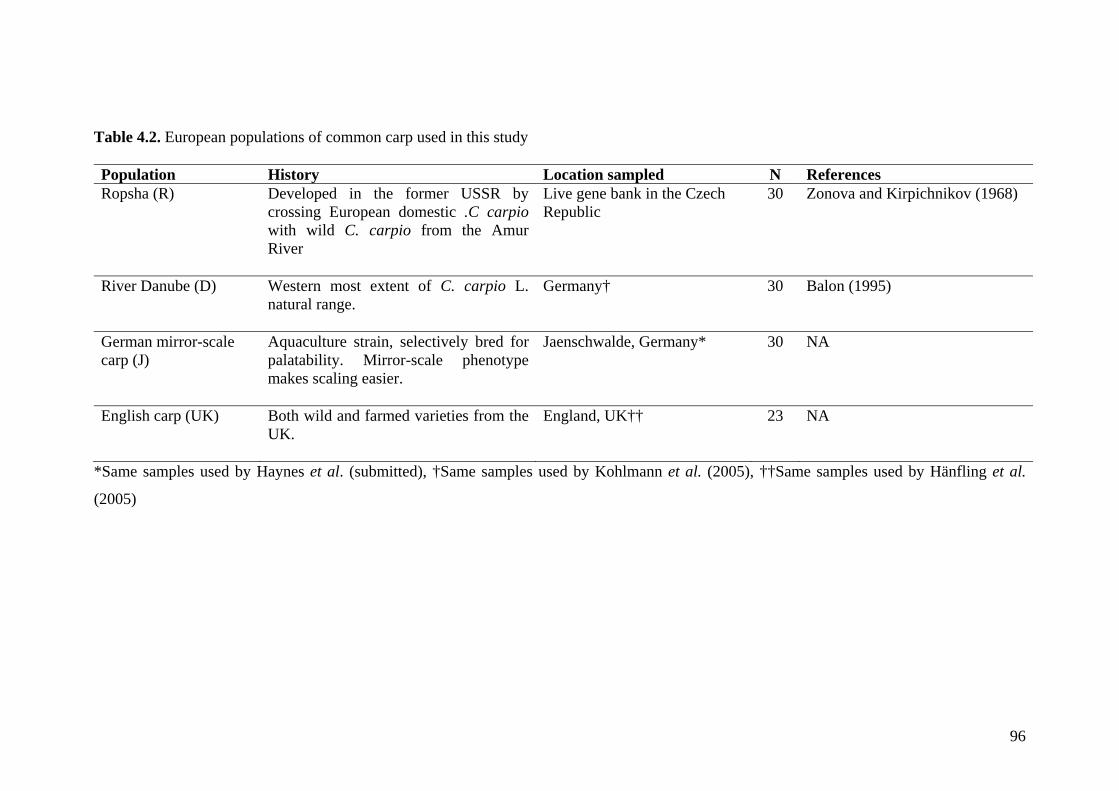
96
Table 4.2. European populations of common carp used in this study Population History Location sampled N References Ropsha (R) Developed in the former USSR by
crossing European domestic .C carpio with wild C. carpio from the Amur River
Live gene bank in the Czech Republic
30 Zonova and Kirpichnikov (1968)
River Danube (D) Western most extent of C. carpio L. natural range.
Germany† 30 Balon (1995)
German mirror-scale carp (J)
Aquaculture strain, selectively bred for palatability. Mirror-scale phenotype makes scaling easier.
Jaenschwalde, Germany* 30 NA
English carp (UK) Both wild and farmed varieties from the UK.
England, UK†† 23 NA
*Same samples used by Haynes et al. (submitted), †Same samples used by Kohlmann et al. (2005), ††Same samples used by Hänfling et al.
(2005)

97
4.3.3. Coastal samples
Three waterways on the east coast of Australia were selected for this study: the Hunter
River at a site close to Clarence Town (CT), the Hawkesbury-Nepean (HN) River and the
Parramatta (PM) River, the latter two of which run through urban areas of Sydney.
Specimens were collected by electrofishing between November 2004 and June 2006. A fin-
clip was taken from each individual and immediately placed in 70% ethanol. Effort was
made to catch at least 30 individuals per site. These coastal samples are summarised in
Table 4.3.
Table 4.3. Coastal populations of common carp used in this study
River collected Sample site coordinates N
Hawkesbury-Nepean River (HN) -33.60297 (S) 150.80724 (E) 27
Parramatta River (PM) -33.80727 (S) 151.00468 (E) 20
Hunter River (CT) -32.58416 (S) 151.783503 (E) 27
4.3.4. DNA extraction and genotyping
DNA extraction and genotyping for 14 microsatellite loci in the European and coastal
samples was performed according to Haynes et al. (submitted).
4.3.5. Data analysis
Origin of Australian common carp strains
To determine whether the Prospect, Boolara, and Yanco strains are descended primarily
from subspecies carpio or haematopterus, traditional phylogenetic trees were not
considered appropriate, as the history of human-induced interbreeding amongst populations
in recent times cannot be suitably represented with a branching-tree diagram. Factorial
correspondence analysis (FCA) (Guinand et al. 2003) was instead implemented to

98
elucidate the extent of allele sharing amongst the Australian, European and Asian carp
strains, using the software Genetix version 4.05.2 (Belkhir et al. 2000). A two-dimensional
plot was generated to represent the extent of allele sharing between individuals (i.e. each
individual represented by a single data point). A second plot representing the average
allele-sharing between populations or strains (i.e. each population or strain represented by a
single data point) was also generated.
4.3.6. Population genetics of common carp in coastal rivers
Departure of genotype frequencies from expectations under HW equilibrium was tested in
Genepop version 1.2 (Raymond and Rousset 1995). FST (Weir and Cockerham 1984)
values between each pair of populations was calculated in Genepop, and analysis of
molecular variance (AMOVA) (Excoffier et al. 1992) performed in GenAlEx 6.0 (Peakall
and Smouse 2006), with an empirical null distribution derived from 9999 permutations
used to test significance. Departure of genotype frequencies between each pair of coastal
rivers from expectations under panmixia was tested using Fisher’s exact test in Genepop.
The contribution of different common carp strains to different coastal regions was
estimated in Structure 2.1 (Pritchard et al. 2000), with the the individuals representative of
Yanco, Prospect, Boolara and koi strains used as learning samples (i.e. the USEPOPINFO
parameter was set to 1 for these samples and 0 for the remaining samples). Run conditions
were 500 000 burn-in steps and 1 000 000 Markov-Chain Monte-Carlo steps, under the
Prior Population Information and Allele Frequencies Correlated models. The analysis was
run for K = 1-10 population clusters, with 3 iterations to check for consistency between
runs. The ΔK statistic (Evanno et al. 2005) was used to estimate the actual number of
population groups present (i.e. the true value of K).

99
To assess the level of genetic diversity in each river, allele richness (Ar) The mean number
of alleles per locus (A) was estimated in the program HP-Rare (Kalinowski 2005). For
comparison, representatives of the Australian strains, the European populations, and
common carp from the MDB used in Haynes et al. (submitted) were analysed in addition to
the coastal samples. The koi from the fish farms in Sydney and Germany were analysed
seperately. For Ar estimates, the rarefaction strategy was implemented to compensate for
different sample sizes between the groups analysed. As the smallest population (Parramatta
River) had 20 individuals, the number of ‘genes per locus’ was set to 40 (2 genes per
diploid locus × number of individuals) for this calculation.
4.4. Results
4.4.1. Origin of carp in Australia
In the FCA, the first two axes accounted for 32% and 27% (total 59%) of variation in the
data (Figure 1). The third axis, accounting for 14% of the variation, was not included in the
figure as it did not significantly affect the visualisation of the results. The koi (K) and
Ropsha (R) strains formed distinct clusters, while the Australian strains and other European
populations grouped together.
4.4.2. Population genetics of common carp in coastal rivers
The samples from the Parramatta and Hunter rivers showed significant departure from
expectations under HW equilibrium (p=0.0047 and p<0.0001 respectively), while genotype
frequencies detected in the Hawkesbury-Nepean River were consistent with HW
frequencies (p=0.7802). FST values between rivers were 0.0918 (CT and HN), 0.1964 (HN
and PM) and 0.244 (CT and PM). The AMOVA analysis was highly significant (p=0),
partitioning 76% of the genetic variation within rivers and 24% among rivers. As expected,
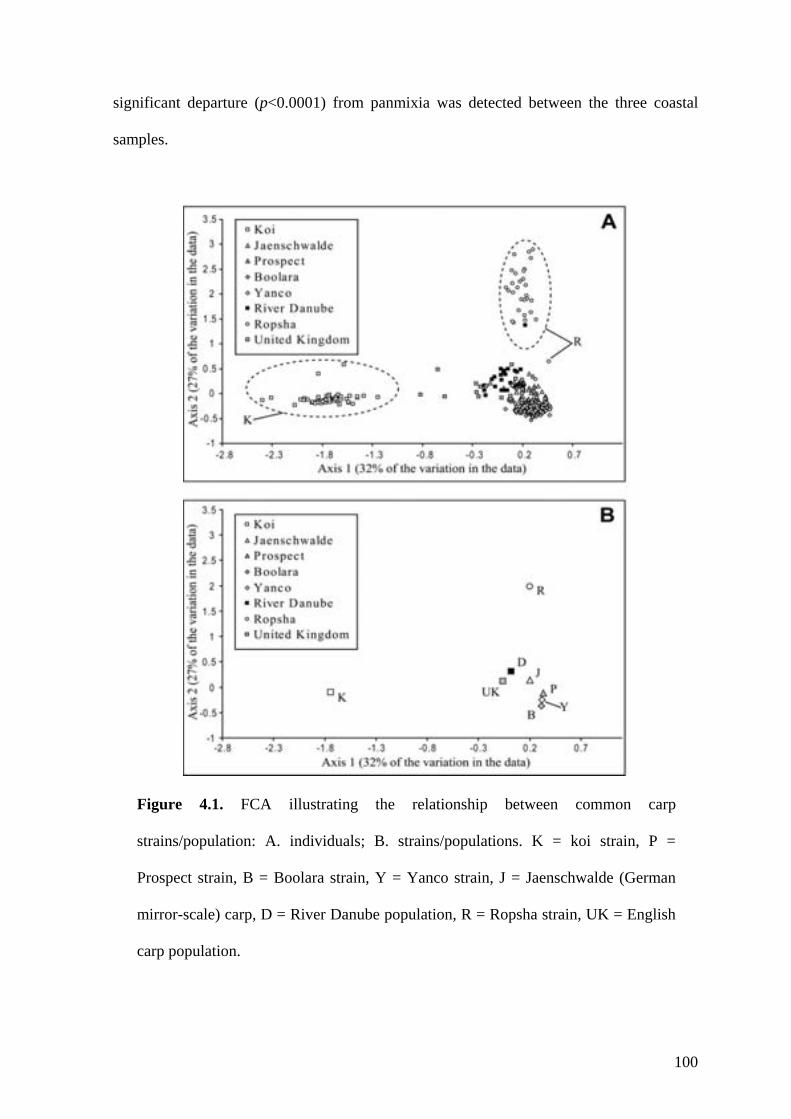
100
significant departure (p<0.0001) from panmixia was detected between the three coastal
samples.
Figure 4.1. FCA illustrating the relationship between common carp
strains/population: A. individuals; B. strains/populations. K = koi strain, P =
Prospect strain, B = Boolara strain, Y = Yanco strain, J = Jaenschwalde (German
mirror-scale) carp, D = River Danube population, R = Ropsha strain, UK = English
carp population.
101
The ΔK statistic (Evanno et al. 2005) indicated the presence of four population clusters the
Structure analysis. Visual inspection of the K = 4 results confirmed that the different runs
produced very similar results. All subsequent analyses are based on the output of the first
run. Consistent with expectations, the four population clusters each corresponded closely
with one of the representative samples of Prospect, Boolara, Yanco and koi strain carp, and
partitioned the carp from the coastal populations into these stains (Figure 4.2). Most of the
genetic diversity of the Parramatta River came from the koi strain carp (69%), followed by
Prospect strain (20%), with smaller contributions from the Yanco (3%) and Boolara (8%).
The Hawkesbury-Nepean River samples consisted predominantly of Prospect strain carp
(78%), followed the Boolara strain (11%), with very minor contributions from the Yanco
and koi strains (6% and 5% respectively). The Hunter River samples were the most
diverse, comprising 57% Booara strain carp, 16% koi, 13% Prospect, 14% Yanco. These
results should be interpreted with caution, however, as the detection of all 4 strains at each
site could be an artefact of some strains being genetically similar, and/or from having to
use individuals inferred to belong to different genetic groups to represent the different
strains, rather than individuals from populations with a known history of isolation from
other strains.
The results of the A and Ar analysis are summarised in Figure 3. A and Ar were very similar
for most samples, with the exeption of the MBD overall, where A (7.6) was much greater
than Ar (3.4). The River Danube common carp were the most diverse (A=7.1 Ar=7) and the
koi from the German fish farm the least (A and Ar=2.5). Amongst the coastal samples, A
and Ar ranged from 3.4 (CT) to 4.4 (PM). Genetic diversity in the coastal rivers was similar
to or slightly higher than the founding strains and the Jaenschwalde and Ropsha carp, and
less than carp from the River Danube and the from UK.

102
Figure 4.2. Contribution of the Prospect, Boolara, Yanco, and koi strains of
common carp to the coastal waterways, as assigned by the K = 4 analysis in
Structure version 2.1.
Figure 4.3. Allele richness (Ar) and mean number of alleles (A) of common carp.
Population identifiers are given in Tables 4.1. and 4.2. * koi sourced from fish farm
in Sydney, ** koi sourced from fish farm in Germany.

103
4.5. Discussion
4.5.1. Origin of and relationship between founding common carp strains
The FCA results of this study confirm Shearer and Mulley’s (1978) suggestion that the
Prospect and Boolara strains were derived essentially from European subsp. carpio, as both
these strains clustered with the European carp rather than the Asian koi in this analysis. All
or most of the fourteen fingerlings from which the Prospect strain was founded (Stead
1929) were likely subsp. carpio. The claim by Boolara Fish Farms Ltd. that the common
carp they distributed were sourced solely from Prospect Reservoir (Table 4.1) (Clements
1988) is, however, refuted by this study as the Prospect strain is more similar to the Yanco
strain than it is to Boolara strain.
The suggestion that the Yanco strain is a feral form of Singapore common carp (Shearer
and Mulley 1978) is refuted by FCA results of this study Common carp from Singapore
would be expected to belong to subsp. haematopterus, rather than subsp. carpio. In the
FCA, however, the Yanco carp cluster strongly with the European carp, rather than the
Asian carp. Shearer and Mulley (1978) originally described the Yanco strain as being
orange coloured, a trait commonly associated with the koi strain. This colouration,
however, also occurs in European common carp (Kirpichnikov 1981; Bialowas 2004), and
is determined by recessive alleles at two loci (Bialowas 2004). These alleles were likely at
high frequency when Shearer and Mulley (1978) collected their Yanco samples, possibly
as a result of a bottleneck when the population was founded or because the initial
introduction was of orange fish. Interbreeding with Boolara and Prospect strains (Haynes et
al. submitted) would have since decreased the frequency of these alleles in areas where
they were formerly common. While the true history of the introduction of the Yanco strain
may never be known, it was likely introduced to establish a coarse-angling fishery

104
sometime after 1912, when construction began on the irrigation system from which the
strain gets its name.
The European origin of the Boolara, Prospect and Yanco strains is consistent with previous
studies of mitochondrial DNA of carp from Australia, where all Australian sequences
analysed were shown to be of European descent (Thai et al. 2004b; Haynes et al. 2009).
4.5.2. Population genetics of common carp in coastal rivers
The heterogeneous distribution of common carp strains and lack of panmixia (Fisher’s
exact test and AMOVA) between the three coastal rivers is consistent each river being
having an independent population of carp founded in different introduction events and with
little gene flow between rivers. Consistent with historical accounts of common carp being
distributed around the Sydney Basin from Prospect Reservoir in the early twentieth century
(Clements 1988), Prospect strain carp contributed significantly to both the Hawkesbury-
Nepean and the Parramatta Rivers. Large numbers of koi, however, have been more
recently introduced into the Parramatta River, with koi now the dominant strain in this
waterway. Carp were introduced into the Hunter River some time between 1980 and 1985,
as extensive river surveys document that carp where absent from the Hunter catchment in
1980, but were present in 1985 (Battaglene 1985). The colonisation of the Hunter River
was likely independent of the Parramatta and Hawkesbury-Nepean Rivers, with the Hunter
River be seeded largely with Boolara strain carp. The lack of HW equilibrium in the
Parramatta and Hunter Rivers is consistent with these rivers containing multiple strains of
carp that (i.e. non-random mating), and insufficient time having passed for the equilibrium
conditions to have become established (i.e. random mating between strains and death of
parental individuals). The detection of koi genotypes in all three waterways indicates that
further introduction is still occurring via the irresponsible disposal of unwanted koi. The

105
longevity of carp (carpover 50 years of age have been caught in the wild, P. Sorenson,
Pers. comm.) and ongoing introduction could mean that these populations never reach
equilibrium.
There is no evidence for a loss of genetic diversity associated with a population bottleneck
in any of the coastal river populations, as these populations have similar levels of genetic
diversity to other strains of common carp. The independent introduction of multiple strains
to each coastal river possibly masked any such loss of genetic diversity. These findings
should be interpreted with caution, however, as small sample sizes and the representation
of two of the founding strains using individuals of inferred membership could lead to an
underestimation of genetic diversity, as is apparent by the discrepancy between A and Ar
results from the MDB.
4.5.3. Implications for management and control
Of major concern is the potential for future expansion of common carp into currently
unoccupied waterways in Australia. While they currently occupy waterways draining only
one million of Australia’s seven million square kilometres of land area, climate matching
indicates that they are suited to all bodies of permanent freshwater in Australia (Koehn
2004). Of particular concern are the currently uncolonised coastal rivers, especially on the
east and south-east coast of the mainland; Tasmanian waterways; the drainages along the
north coast; and the Lake Eyre and Bulloo-Bancannia drainages in the interior of the
continent (Koehn 2004). Secondary contact between separate populations is also a concern,
as mating between divergent lineages could result in increased genetic diversity and
heterosis that could make populations more invasive. This process has been implicated in
allowing a number of introduced species to become invasive (e.g. Kolbe et al. 2004; Facon
et al. 2005), including common carp in the MDB (Haynes et al. submitted). The presence

106
of multiple strains and high levels of genetic diversity in all coastal rivers investigated, and
the ongoing release of koi, will likely facilitate further invasiveness and spread of common
carp in Australia.
To protect ecosystems from further degradation by introduced common carp, we make the
following recommendations for control of this species : (1) monitoring of common carp-
free waterways, with rapid-response removal efforts undertaken if common carp are
detected; (2) keeping the public well informed about the environmental risks associated
with releasing common carp; (3) consideration of making possession of all strains of
common carp, including koi, illegal in all parts of Australia; (4) consistent policing and
punishment of individuals releasing fish; and (5) extirpation of small, isolated populations
if possible, as is currently being attempted in Tasmania (Gilligan and Rayner 2007).
4.5.4. Future work
Much can be done to further investigate the population genetics of common carp in
Australia. The fourteen microsatellite loci used here and in Haynes et al. (submitted) can
form the basis of the future studies. More loci could be included to improve the accuracy
and power of statistical inferences. The accuracy of the assignment of individuals to one of
the founding strains could also be improved if a greater number of individuals representing
those strains were genotyped. This would require sampling of common carp from non-
MDB rivers in Victoria for the Boolara strain; sampling of Potts Point Reservoir (Davis
1996) and further sampling of Prospect Reservoir for the Prospect strain; and purchasing
more fish from breeders for the koi strain. We know of no isolated populations of Yanco
strain, although some material may be available from museums. Obtaining samples from
more pure Asian and European populations may also make it possible to ascertain a more
107
precise origin of the different strains. Sequencing of mitochondrial loci in Australian carp
could also facilitate this.
In Australia, a project involving the more extensive sampling of coastal rivers could
identify source populations and putative pathways for the spread of common carp in these
regions. Equally, scoring of microsatellite and mitochondrial loci from carp around the
world could identify additional historical and ancient patterns of carp dispersal that have
not yet been investigated.
4.6. Acknowledgements
We would like to thank Dr. Klaus Kohlmann from the Department of Inland Fisheries,
Berlin, Germany, for the donation of koi, River Danube, German mirror-scale carp and
Ropsha strain carp samples; and Dr. Bernd Hänfling from the Department of Biological
Sciences, University of Hull, Hull, UK, for donation of English and River Danube carp
samples. We thank the Australian Koi Farm in Bringelly, NSW, Australia for donation of
koi samples. We are indebted to the staff at the NSW Department of Primary Industries,
Australia, for collecting the Australian samples. Funding for this project was supplied by
the Invasive Animals CRC (previously the Pest Animal Control CRC) and the University
of Sydney.
4.7. References
Angeler DG, Álvarez-Cobelas M, Sánchez-Carrillo S, Rodrigo MA (2002). Assessment of
exotic fish impacts on water quality and zooplankton in a degraded semi-arid
floodplain wetland. Aquat. Sci. 64: 76-86.
Balon EK (1995). Origin and domestication of the wild carp, Cyprinus carpio: from
Roman Gourmets to the swimming flower. Aquaculture 129: 3-48.

108
Battaglene SC (1985). Preliminary study of the fish resources of the Hunter Valley. NSW
Department of Agriculture - Division of Fisheries: Taylors Beach, Australia.
Belkhir K, Borsa P, Goudet J, Chikli L, Bonhomme F (2000). GENETIX, logiciel sous
WindowsTM pour la ge´ne´tique des populations, version 4.01. Release University
of Montpellier II, Montpellier.
Bialowas H (2004). Inheritance of orange pigmentation and scale patterns in common carp
(Cyprinus carpio L.). Archives of Polish Fisheries 12: 145-150.
Brown P (1996). Fish Facts 4 Carp in Australia. NSW Fisheries (now part of the NSW
Department of Primary Industries): Narrandera, Australia.
Clements J (1988). Salmon at the Antipodes A History and Review of Trout, Salmon and
Char and Introduced Coarse Fish in Australasia Published by the author, Ballarat,
Victoria, Australia.
Davis KM (1996). Investigation into the genetic variation of carp (Cyprinus carpio) in
Southeastern Australia. Ph.D., University of NSW.
Davis KM, Dixon PI, Harris JH (1999). Allozyme and mitochondrial DNA analysis of
carp, Cyprinus carpio L., from south-eastern Australia. Mar. Freshw. Res. 50: 253-
60.
Evanno G, Regnaut S, Goudet J (2005). Detecting the number of clusters of individuals
using the sortware STRUCTURE: a simulation study. Mol. Ecol. 14: 2611-2620.
Excoffier L, Smouse PE, Quattro JM (1992). Analysis of molecular variance inferred from
metric distances among DNA haplotypes: application to human mitochondrial
DNA restriction data. Genetics 131: 479-491.
Facon B, Jarne P, Pointier JP, David P (2005). Hybridization and invasiveness in the
freshwater snail Melanoides tuberculata: hybrid vigour is more important than
increase in genetic variance. J. Evolution Biol. 18: 524-535.
Gilligan D, Rayner T (2007). The distribution, spread, ecological impacts, and potential
control of carp in the upper Murray River. NSW Department of Primary Industries:
Sydney.
Guinand B, Parisseaux B, Lebreton J, Bonhomme F (2003). Estimating population genetics
‘F-statistics’ using factorial correspondence analysis with respect to instrumental
variables. International Conference on Correspondence Analysis and Related
Methods, Barcelona.

109
Hänfling B, Bolton P, Harley M, Carvalho GR (2005). A molecular approach to detect
hybridisation between crucian carp (Carassis carassius) and non-indigenous carp
species (Carassisus cpp. and Cyprinus carpio). Freshwater Biol. 50: 403-417.
Harris JH, Gehrke PC (1997). Fish and rivers in stress - the NSW rivers survey. NSW
Fisheries Office of Conservation & the Cooperative Research Centre for Freshwater
Ecology: Cronulla and Canberra.
Haynes GD, Gilligan DM, Grewe P, Nicholas FW (submitted). Population genetics and
management units of invasive common carp (Cyprinus carpio L.), in the Murray-
Darling Basin, Australia. J. Fish. Biol. 000: 000.
Haynes GD, Gongora J, Nicholas FW, Zenger KR (2009). Rapid identification of maternal
lineages in common carp (Cyprinus carpio L.) using real-time PCR and high
resolution melt-curve analysis. Aquaculture 287: 59-66.
Horváth L, Tamás G, Seagrave C (2002). Carp and pond fish culture second edition
Blackwell Science, Oxford, United Kingdom.
Hume DH, Fletcher AR, Morsion AK (1983). Final Report. Carp Program Report No. 10.
Fisheries and Wildlife Division, Victorian Ministry for Conservation:
Kalinowski ST (2005). HP-RARE 1.0: a computer program for performing rarefaction on
measures of allelic richness. Mol. Ecol. Notes 5: 187–189.
Kirpichnikov VS (1981). Genetic Bases of Fish Selection Springer-Verlag, Berlin and
Heidelberg, Germany, New York, USA.
Koehn J (2004). Carp (Cyprinus carpio) as a powerful invader in Australian waterways.
Freshw. Biol. 49: 882-894.
Koehn J, Brumley B, Gehrke P (2000). Managing the Impacts of Carp Bureau of Rural
Sciences (Department of Agriculture, Fisheries and Forestry), Canberra, Australia.
Kohlmann K, Gross R, Murakaeva A, Kersten P (2003). Genetic variability and structure
of common carp (Cyprinus carpio) populations throughout the distribution range
inferred from allozyme, microsatellite and mitochondrial DNA markers. Aquat.
Living Resour. 16: 421-431.
Kohlmann K, Kersten P, Flajshans M (2005). Microsatellite-based genetic variability and
differentiation of domesticated, wild and feral common carp (Cyprinus carpio L.)
populations. Aquaculture 247: 253-256.
Kolbe JJ, Glor RE, Schettino LR, Lara AC, Larson A, Losos JB (2004). Genetic variation
increases during biological invasion by a Cuban lizard. Nature 431: 177-181.

110
Mabuchi K, Senou H, Suzuki T, Nishida M (2005). Discovery of an ancient lineage of
Cyprinus carpio from Lake Biwa, central Japan, based on mtDNA sequence data,
with reference to possible multiple origins of koi. J. Fish. Biol. 66: 1516-1528.
Parkos III JJ, Santucci VJ, Wahl DJ (2003). Effect of adult common carp (Cyprinus
carpio) on multiple trophic levels in shallow mesocosms. Can. J. Fish. Aquat. Sci.
60: 182-192.
Peakall R, Smouse PE (2006). GENALEX 6: genetic analysis in EXCEL. Population
genetic software for teaching and research. Mol. Ecol. Notes 6: 288-295.
Pinto L, Chandrasena N, Pera J, Hawkins P, Eccles D, Sim R (2005). Managing invasive
carp (Cyprinus carpio L.) for habitat enhancement in at Botany Bay, Australia.
Aquat. Conserv. 15: 447-462.
Pritchard JK, Stefens M, Donelly P (2000). Inference of population structure using
multilocus genotype data. Genetics 155: 945-959.
Raymond M, Rousset F (1995). GENEPOP (version 1.2): population genetics software for
exact tests and eumenicism. J. Hered. 86: 248-249.
Shearer KD, Mulley JC (1978). The introduction and distribution of the carp, Cyprinus
carpio Linnaeus, in Australia. Aust. J. Mar. Fresh. Res. 29: 661-563.
Stead DG (1929). Introduction of the great carp Cyprinus carpio into waters of New South
Wales. Aust. J. Zool. 6: 100-102.
Tapia M, Zambrano L (2003). From Aquaculture Goals to Real Social and Ecological
Impacts: Carp Introduction in Rural Central Mexico. Ambio 32: 252-557.
Thai BT, Burridge CP, Pham TA, Austin CM (2004). Using mitochondrial nucleotide
sequences to investigate diversity and genealogical relationships within common
carp (Cyprinus carpio L.). Anim. Genet. 36: 22-28.
Weir BS, Cockerham CC (1984). Estimating F-statistics for the analysis of population
structure. Evolution 38: 1358-1370.
Zhou JF, Wu Q, Wang Z, Ye Y (2004). Molecular phylogeny of three subspecies of
common carp Cyprinus carpio, based on sequence analysis of cytochrome b and
control region mtDNA. J. Zoo. Syst. Evol. 42: 266-269.
Zhou JF, Wu QJ, Ye YZ, Tong JG (2003). Genetic divergence between Cyprinus carpio
carpio and Cyprinus carpio haematopterus as assessed by mitochondrial DNA
analysis, with emphasis on the origin of European domestic carp. Genetica 119: 93-
97.

111
Zonova AS, Kirpichnikov VS (1968). Selection of Ropsha carp. Seminar/study tour in the
U.S.S.R. on genetic selection and hybridization of cultivated fishes, FAO Corporate
Document Repository http://www.fao.org/documents.

112
Chapter 5: Invasive Cyprinid species Cyprinus carpio and Carassius
auratus in Australia: cryptic hybridisation and introgression
5.1. Introduction
Hybridisation between divergent lineages is increasingly recognised as playing an
important role in introduced species becoming invasive. Two non-exclusive hypotheses
used to explain this are (1) heterosis (hybrid vigour) occurring in the cross-bred progeny
and/or (2) novel allele combinations extending the phenotypic range beyond that of the
parent populations, and consequently increasing the potential for survival and reproduction
in the new environment (Hänfling 2007).
Within-species hybridisation between divergent lineages is commonly reported in invasive
populations. Examples include the green anole lizard in Florida and Hawaii (Kolbe et al.
2004) and the European rabbit in Australia being sourced from multiple parent populations
(Zenger et al. 2003); and invasive European green crabs in North American and the
amphipod Gammarus tigrinis in Europe undergoing range expansion following admixture
between divergent lineages (Kelly et al. 2006; Roman 2006).
Hybridisation between different species can also lead to the formation of invasive lineages.
Nolte et al. (2005), for example, reported an invasive lineage of sculpin fish, Cottus sp., in
the River Rhine that displayed novel habitat adaptations and life-history characteristics and
was likely generated by the interbreeding of two previously allopatric species. Changes in
ploidy resulting from between-species hybridisation have been responsible for the
generation of new, reproductively isolated species. The Gibel carp (Carassius auratus
gibelio Bloch), for example, is a polyploidy hybrid species, and has been progressively
expanding its range in Europe since the early 20th century (Hänfling 2007). Even when
hybrid fitness is low, inter-specific hybridisation can still facilitate the invasiveness of
introduced species by allowing them to obtain advantageous alleles from related species
(Hänfling 2007).
Two well known species from the Family Cyprinidae, common carp (Cyprinus carpio) and
goldfish (Carassius auratus), have a long history of sympatry. Both are native to east-Asia
(Balon 2004) and have been introduced to waterways outside their native range by human

113
activities (Brumley 1991; Koehn et al. 2000; Koehn 2004). Both species have a similar
number of chromosomes. An exhaustive study of 249 metaphase cells by Al-Sabati (1986)
concluded that 2n=98 for carp, while Ruiguang and Zheng (1980) found that 2n=100 for
both species, and Ohno et al. (1967) reported 2n=104 or less of both species. The two
species are known to hybridise in the wild (Taylor and Mahon 1977; Shearer and Mulley
1978; Hume et al. 1983b; Pullan and Smith 1987; Brumley 1991; Hänfling et al. 2005).
Hybrids can be readily identified in the field using a range of morphological and
morphometric characters (Taylor and Mahon 1977; Hume et al. 1983b), the easiest to score
being the fleshy barbels (whiskers) around the mouth. Carp have two such pairs of barbels,
goldfish have no barbels, and hybrids of the two species have aberrant barbels that are
often truncated and reduced to a single pair. The number of lateral-line scales has been
claimed to be diagnostic, with one study reporting carp as having 34-37 such scales,
goldfish 26-29, and their hybrids having an intermediate 29-35 scales (Hume et al. 1983b),
but the overlap in distributions limits the utility of this trait.
The fertility of carp-goldfish hybrids is questionable. Putative F1 individuals are observed
to be healthy and to produce eggs and milt in the wild (Hume et al. 1983b). Hybrids have
been reported to be either sterile (Hubbs, 1955) or to be able to back-cross frequently
(Trautman 1957, cited by Hume et al. 1983; Aduma-bossman 1971, cited by Hänfling et
al. 2005). In an analysis of 34 hybrids (identified on the basis of five meristic traits) from
14 different sites, Hume et al. (1983b) identified two subsets of hybrids: those with only
one pair of barbels, and those with two pairs of reduced barbels. The observation that these
groups also differed significantly for three morphological characters (ratio of length of
lower barbel to standard length, number of lateral-line scales and arrangement of
pharyngeal teeth) was interpreted as indicating that the two hybrid groups represented
different generations of intercrossing or backcrossing. More recently, Hänfling et al.
(2005) detected backcrossed carp-goldfish hybrids in English waterways using
microsatellite markers. It can therefore be concluded that although fertility may be reduced
in the progeny of carp and goldfish crosses, reproductive isolation is not complete and
intercrossing does sometimes occur.
In this study, introgression between naturalised carp and goldfish populations in Australia
is investigated. Carp were collected extensively from the Murray-Darling Basin (MDB),
Australia’s largest river system. Goldfish and putative hybrids were collected

114
opportunistically along with the carp. Additionally, three domestic populations of common
carp were collected from breeders, and domestic goldfish from pet stores. The aims of this
study were to (1) identify microsatellite loci that can be PCR-amplified reliably in both
species; (2) investigate whether individuals classed as hybrids on the basis of having
aberrant barbels are indeed true hybrids; (3) identify and quantify cryptic introgression;
and (4) investigate the direction of hybridisation. This study offers a guide to researchers
looking to investigate the phenomenon of introgression between sympatric populations
where there is a lack of good samples representative of parental populations.
5.2. Materials and Methods
5.2.1. Sample collection
Naturalised carp were collected by electrofishing from the MDB and from Prospect
Reservoir in the Sydney catchment between March 2004 and October 2006. Effort was
made to collect at least 30 carp from every major river catchment in the MDB. For MDB
rivers with major dams, fish were collected both upstream and downstream of the dam.
Goldfish (readily identified from morphology) and putative carp-goldfish hybrids
(identified by having aberrant barbels) were collected opportunistically with carp. A fin-
clip was taken from each individual and immediately placed in 70% ethanol. In addition, a
fin clip was taken from a single live tench (Tinca tinca) collected from Lake Eildon,
Goulburn River catchment, Victoria, Australia. Samples from domestic populations of carp
were kindly provided by Dr. Klaus Kohlmann from Germany (ornamental koi and mirror-
scale carp) and from a live “gene bank” in the Czech Republic (Russian Ropsha strain
carp); and by a local fish breeder (ornamental koi carp). A small number of domestic
goldfish were donated by a pet store in Sydney. The samples used in this study are
summarised in Table 5.1, and the sample sites from which fish were collected in Australia
are illustrated in Figure 5.1.
5.2.2. DNA extraction
DNA was extracted using the TNES protocol of Wasko et al. (2003).

115
Figure 5.1. Collection sites for carp, goldfish and putative hybrids in the Murray-Darling
Basin. Site identifiers are given in Table 5.1.
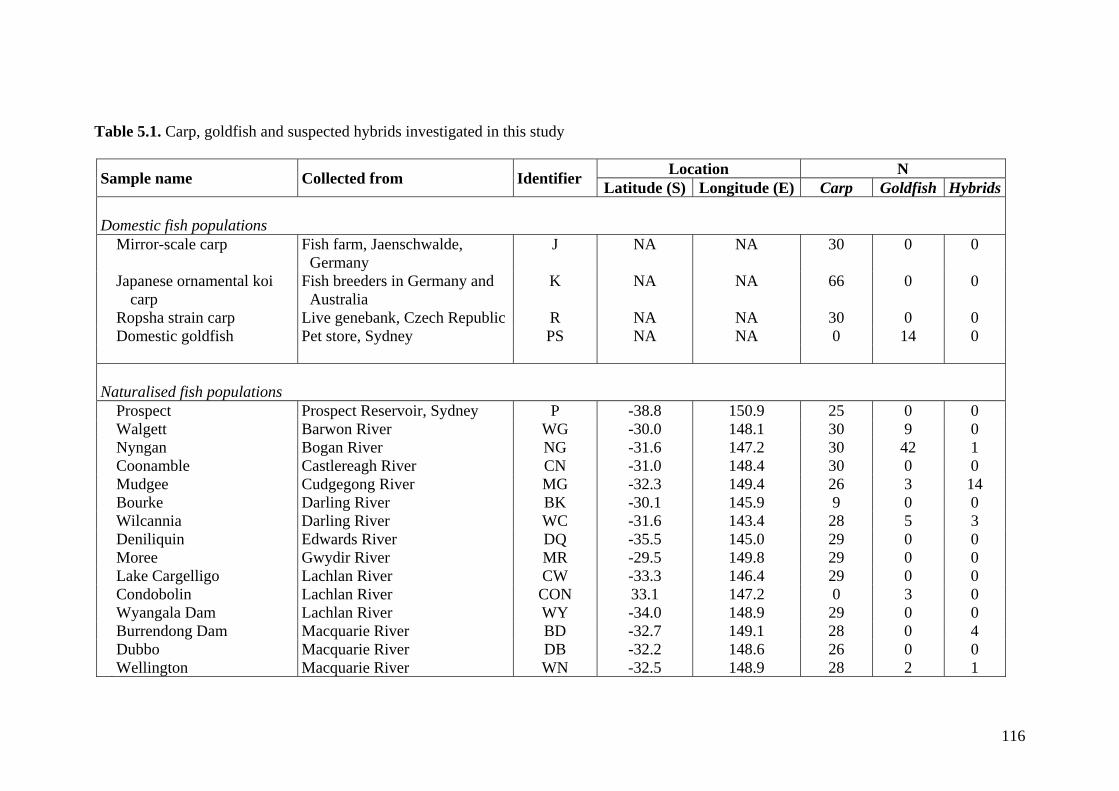
116
Table 5.1. Carp, goldfish and suspected hybrids investigated in this study
Sample name Collected from Identifier Location N Latitude (S) Longitude (E) Carp Goldfish Hybrids
Domestic fish populations Mirror-scale carp Fish farm, Jaenschwalde,
Germany J NA NA 30 0 0
Japanese ornamental koi carp
Fish breeders in Germany and Australia
K NA NA 66 0 0
Ropsha strain carp Live genebank, Czech Republic R NA NA 30 0 0 Domestic goldfish Pet store, Sydney PS NA NA 0 14 0 Naturalised fish populations Prospect Prospect Reservoir, Sydney P -38.8 150.9 25 0 0 Walgett Barwon River WG -30.0 148.1 30 9 0 Nyngan Bogan River NG -31.6 147.2 30 42 1 Coonamble Castlereagh River CN -31.0 148.4 30 0 0 Mudgee Cudgegong River MG -32.3 149.4 26 3 14 Bourke Darling River BK -30.1 145.9 9 0 0 Wilcannia Darling River WC -31.6 143.4 28 5 3 Deniliquin Edwards River DQ -35.5 145.0 29 0 0 Moree Gwydir River MR -29.5 149.8 29 0 0 Lake Cargelligo Lachlan River CW -33.3 146.4 29 0 0 Condobolin Lachlan River CON 33.1 147.2 0 3 0 Wyangala Dam Lachlan River WY -34.0 148.9 29 0 0 Burrendong Dam Macquarie River BD -32.7 149.1 28 0 4 Dubbo Macquarie River DB -32.2 148.6 26 0 0 Wellington Macquarie River WN -32.5 148.9 28 2 1
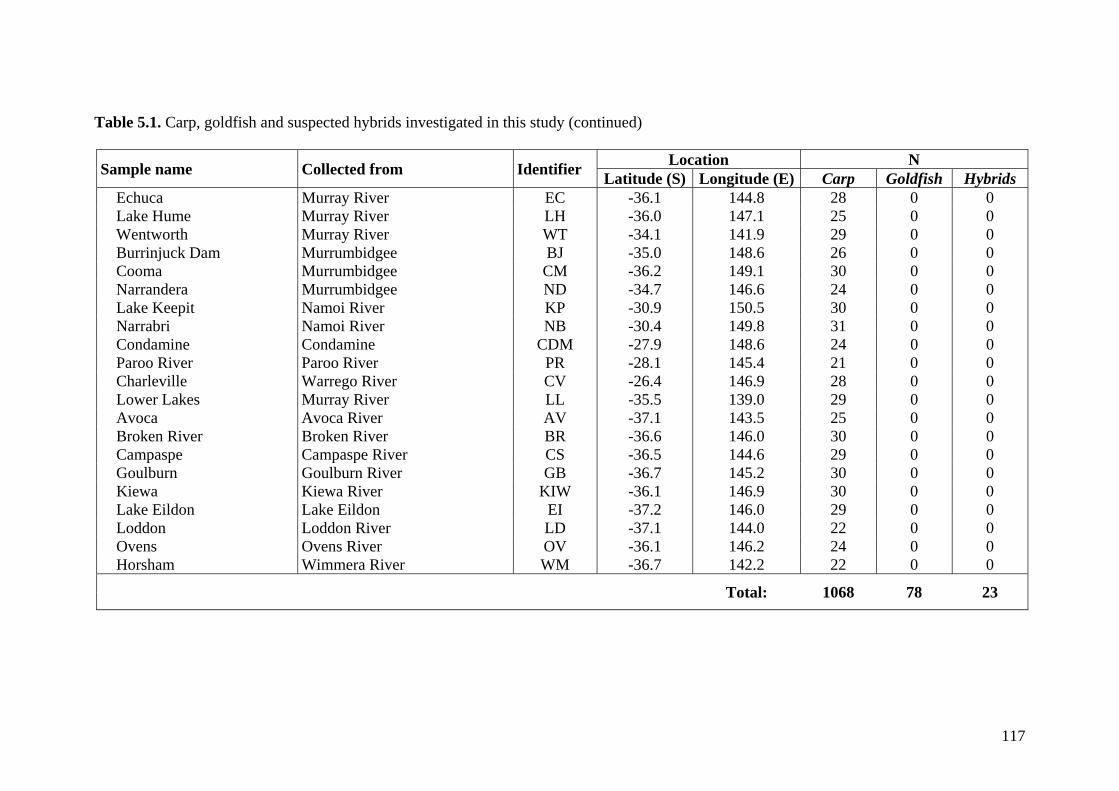
117
Table 5.1. Carp, goldfish and suspected hybrids investigated in this study (continued)
Sample name Collected from Identifier Location N Latitude (S) Longitude (E) Carp Goldfish Hybrids
Echuca Murray River EC -36.1 144.8 28 0 0 Lake Hume Murray River LH -36.0 147.1 25 0 0 Wentworth Murray River WT -34.1 141.9 29 0 0 Burrinjuck Dam Murrumbidgee BJ -35.0 148.6 26 0 0 Cooma Murrumbidgee CM -36.2 149.1 30 0 0 Narrandera Murrumbidgee ND -34.7 146.6 24 0 0 Lake Keepit Namoi River KP -30.9 150.5 30 0 0 Narrabri Namoi River NB -30.4 149.8 31 0 0 Condamine Condamine CDM -27.9 148.6 24 0 0 Paroo River Paroo River PR -28.1 145.4 21 0 0 Charleville Warrego River CV -26.4 146.9 28 0 0 Lower Lakes Murray River LL -35.5 139.0 29 0 0 Avoca Avoca River AV -37.1 143.5 25 0 0 Broken River Broken River BR -36.6 146.0 30 0 0 Campaspe Campaspe River CS -36.5 144.6 29 0 0 Goulburn Goulburn River GB -36.7 145.2 30 0 0 Kiewa Kiewa River KIW -36.1 146.9 30 0 0 Lake Eildon Lake Eildon EI -37.2 146.0 29 0 0 Loddon Loddon River LD -37.1 144.0 22 0 0 Ovens Ovens River OV -36.1 146.2 24 0 0 Horsham Wimmera River WM -36.7 142.2 22 0 0 Total: 1068 78 23

118
5.2.3. Microsatellite cross-species PCR amplification and assessment
Cross-species PCR amplification was attempted with the fourteen microsatellite loci used
successfully on common carp by Haynes et al. (submitted): Cca02, Cca07, Cca09, Cca17,
Cca19, Cca65, Cca67, Cca72 (Yue et al. 2004), MFW6, MFW26 (Crooijmans et al. 1997),
GF1 (Zheng et al. 1995), Koi5-6, Koi29-30, and Koi41-42 (David et al. 2001). PCR was
performed on genomic DNA from three goldfish using the same primers and touch-down
cycling protocols as Haynes et al. (submitted), and PCR products were separated by
electrophoresis on 1.5% agarose gels to assess the quantity and accuracy of amplification.
Cross-species amplification of loci GF1 and MFW6 was previously attempted by Hänfling
et al. (2005), who were successful in cross-species amplification of locus GF1, but were
not successful with MFW6. Eight loci (Cca09, Cca17, Cca65, Cca67, GF1, Koi5-6, Koi29-
30, and Koi41-42) amplified consistently in goldfish and were considered for further
analysis.
The eight loci were scored according to Haynes et al. (submitted) in the 42 goldfish
collected from Nyngan (Table 5.1, Figure 5.1). These goldfish were all collected from the
same weir pool and expressed the wild-type phenotype of olive-grey colouration,
consistent with them coming from a single breeding population rather than from a number
of recent, independent introductions. For each locus, the per cent of missing data (PCR
failure or unscorable alleles) was calculated. Two loci (Cca09 and Cca67) had
exceptionally high levels of missing data (35.7% and 26.2%, respectively; Table 5.2), and
were not considered further. The remaining loci were tested for departure of genotype
frequencies from expectations under Hardy-Weinberg Equilibrium (HWE), using Genepop
(Raymond and Rousset 1995) under suboptions 1.1 (H1=locus not in HWE), 1.2 (H1=
heterozygote excess) and 1.3 (H1=homozygote excess). Locus Koi41-42a showed
significant (p-value < 0.05) departure from HWE and homozygote excess and was
consequently deemed unreliable and not used further. The five remaining loci were PCR
amplified and scored in all remaining goldfish and putative hybrids.

119
Table 5.2. Missing data and departure from Hardy-Weinberg Equilibrium (HWE) in
goldfish from Nyngan (n=42). Dashes (-) indicate loci that were monomorphic in this
population.
Locus
%
Missing data
HWE p-values
HWE Heterozygote excess Homozygote excess
Cca09a* 35.7 NA NA NA
Cca17a 1.2 1 0.8819 1
Cca65a 1.2 - - -
Cca67* 26.2 NA NA NA
GF1 0.0 0.7262 0.72022 1
Koi29-30a 2.4 - - -
Koi41-42a* 0.0 0.0105 1 0.0121
Koi5-6a 0.0 - - -
* Loci deemed unreliable and not used further in this study.
5.2.4. Statistical analysis of microsatellite data
Clustering algorithms employing Markov-Chain Monte-Carlo simulations were
implemented in the programs STRUCTURE version 2.1 (Pritchard et al. 2000; Falush et
al. 2003; 2007) and NEWHYBRIDS version 1.1 (Anderson and Thompson 2002) to
analyse the data from the five microsatellite scored in all fish. Both programs can be run
without a priori information about where samples were collected, do not require pure
representatives of each group, and do not require that the different groups being analysed
have diagnostic alleles. STRUCTURE assigns individuals to one or more of a predefined
number of clusters, K, under the assumptions of HWE and linkage equilibrium. For each
individual, the estimated proportion of ancestry from a particular cluster (K) is given by the
statistic qK. In accordance with the strategy of Vähä and Primmer (2006), individuals
assigned 90-100% to a single cluster (qK = 0.9-1.0) were considered to be representative of
the strain most associated with that cluster (i.e. ‘purely’ descended from that group).
Individuals with qK = 0.35-0.65 were considered F1-generation hybrids, and individuals
with 0.1< qK < 0.35 for one cluster, and the balance from the other cluster, were considered
F2-generation or backcross. NEWHYBRIDS estimates the posterior probability (p-value)
for each individual belonging to each specific category (Parental, F1, F2 or backcross).
120
The analysis in STRUCTURE was run for K=2 clusters (corresponding to carp and
goldfish) under the admixture and allele-frequencies-correlated models with 50,000 burn-
in steps, 500,000 Markov-Chain Monte-Carlo steps, and three replicates to check for
consistency between runs. To ensure that burn-in and run lengths were adequate,
convergence of the summary statistics alpha (α), P(D) and likelihood were checked by eye.
The NEWHYBRIDS analysis was run with 50 000 burn-in steps and 100 000 MCMC
sweeps after burn-in. The analysis was repeated 10 times, and final p-values for each
hybrid category were calculated as the average over these replicates.
The program GENALEX (Peakall and Smouse 2006) was used to calculate allele
frequencies and identify private alleles in carp and goldfish. The individuals identified
phenotypically as hybrids, and any carp or goldfish identified as having mixed ancestry in
the NEWHYBRIDS or STRUCTURE analyses, were excluded from the identification of
private alleles. Microsatellite profiles of the 23 putative hybrids were inspected to identify
species-specific and shared alleles in each individual, to explain the assignments made by
STRUCTURE and NEWHYBRIDS.
Factorial correspondence analysis (FCA) (Guinand et al. 2003) was implemented to
elucidate the extent of allele sharing amongst carp, goldfish and hybrids using the software
Genetix version 4.05.2 (Belkhir et al. 2000).
5.2.5. Mitochondrial DNA analysis
To determine of the putative hybrids had carp or goldfish maternal ancestry, the
mitochondrial control region was sequenced in all 23 putative carp-goldfish hybrids, five
carp, one goldfish and one tench. The control region was PCR amplified according to
(Zhou et al. 2003). PCR products were purified using UltraClean GelSpin DNA
Purification Kits (Mo Bio, Solana Beach) and sequenced with BigDye Terminator Version
3.1 chemistry (AB, Foster) using the forward (LD) primer to initiate transcription. The
first 600 base pairs of each sequence were aligned in CLUSTALW (Thompson et al. 1994)
against published sequences of three carp, two goldfish, one Japanese crucian carp
(Carassius cuvieri) and one tench sequence from the NCBI database
(http://www.ncbi.nlm.nih.gov/). Both the central-Asian/European (C. carpio carpio) and
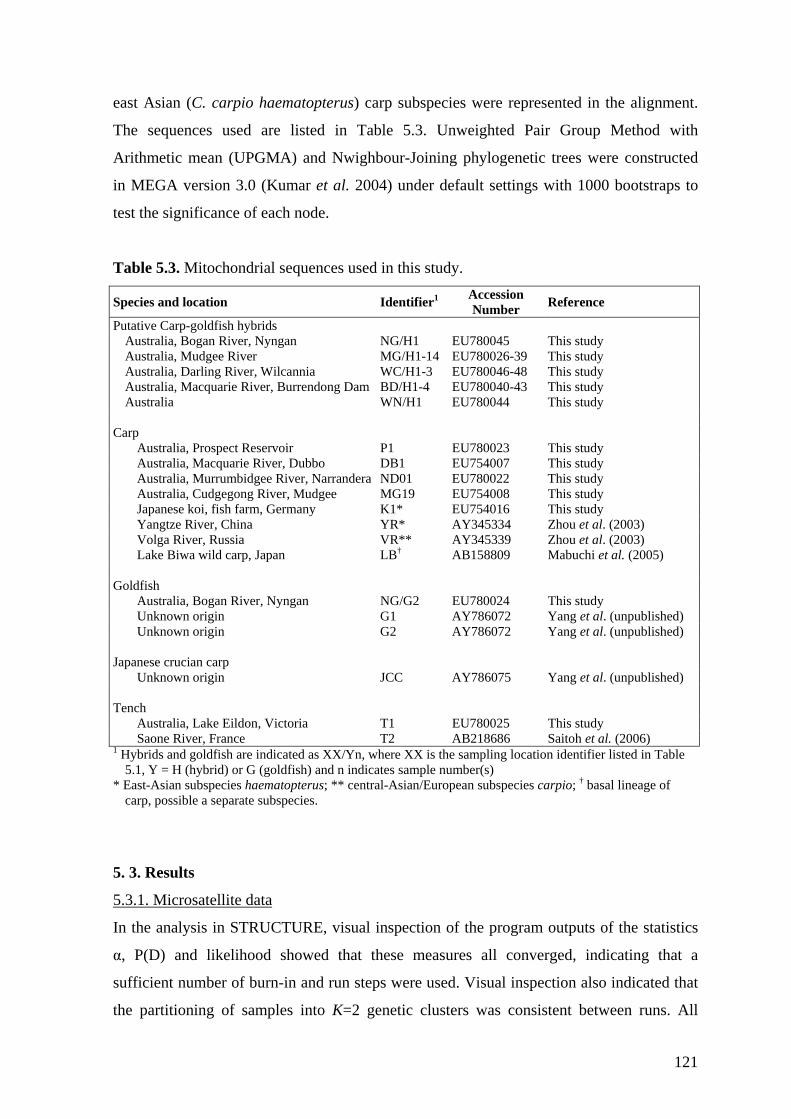
121
east Asian (C. carpio haematopterus) carp subspecies were represented in the alignment.
The sequences used are listed in Table 5.3. Unweighted Pair Group Method with
Arithmetic mean (UPGMA) and Nwighbour-Joining phylogenetic trees were constructed
in MEGA version 3.0 (Kumar et al. 2004) under default settings with 1000 bootstraps to
test the significance of each node.
Table 5.3. Mitochondrial sequences used in this study.
Species and location Identifier1 Accession Number Reference
Putative Carp-goldfish hybrids Australia, Bogan River, Nyngan Australia, Mudgee River Australia, Darling River, Wilcannia Australia, Macquarie River, Burrendong Dam Australia
NG/H1 MG/H1-14 WC/H1-3 BD/H1-4 WN/H1
EU780045EU780026-39 EU780046-48 EU780040-43 EU780044
This study This study This study This study This study
Carp
Australia, Prospect Reservoir P1 EU780023 This study Australia, Macquarie River, Dubbo DB1 EU754007 This study Australia, Murrumbidgee River, Narrandera ND01 EU780022 This study Australia, Cudgegong River, Mudgee MG19 EU754008 This study Japanese koi, fish farm, Germany K1* EU754016 This study Yangtze River, China YR* AY345334 Zhou et al. (2003) Volga River, Russia VR** AY345339 Zhou et al. (2003) Lake Biwa wild carp, Japan LB† AB158809 Mabuchi et al. (2005)
Goldfish
Australia, Bogan River, Nyngan NG/G2 EU780024 This study Unknown origin G1 AY786072 Yang et al. (unpublished) Unknown origin G2 AY786072 Yang et al. (unpublished)
Japanese crucian carp
Unknown origin JCC AY786075 Yang et al. (unpublished) Tench
Australia, Lake Eildon, Victoria T1 EU780025 This study Saone River, France T2 AB218686 Saitoh et al. (2006)
1 Hybrids and goldfish are indicated as XX/Yn, where XX is the sampling location identifier listed in Table 5.1, Y = H (hybrid) or G (goldfish) and n indicates sample number(s)
* East-Asian subspecies haematopterus; ** central-Asian/European subspecies carpio; † basal lineage of carp, possible a separate subspecies.
5. 3. Results
5.3.1. Microsatellite data
In the analysis in STRUCTURE, visual inspection of the program outputs of the statistics
α, P(D) and likelihood showed that these measures all converged, indicating that a
sufficient number of burn-in and run steps were used. Visual inspection also indicated that
the partitioning of samples into K=2 genetic clusters was consistent between runs. All
122
subsequent analyses and discussions are based on the first such run. The results for the
domestic carp and goldfish samples confirmed that the two clusters closely correspond
(average qK=0.99) to the two species. However, three of the 66 koi samples were classed as
F2 or backcross, having only 77%-86% of their ancestry from the carp cluster (qc=0.77-
0.86). Of the naturalised fish, four individuals identified phenotypically as carp were
classed as F1-generation hybrids (qc=0.52-0.55); and 11 individuals identified
phenotypically as carp and one as goldfish were classed as F2-generation or backcross
(qc=0.66-0.79 and qg= 0.83, respectively). Amongst the 23 putative hybrids, 20 were
classified as F1-generation (qc=0.36—0.51) and three as F2 or backcross (qc=0.77-0.78).
These results are summarised in Tables 5.4 and 5.5. Overall, 1.6% of the genetic diversity
of naturalised carp was assigned to the goldfish cluster; and 1% of the genetic diversity of
naturalised goldfish was assigned to the carp cluster.
In the classification of fish in NEWHYBRIDS, two of the three koi carp identified as F2 or
backcross in the STRUCTURE analysis were assigned a highest probability of being carp
backcross (p-value=0.72). Of the naturalised fish, 3 individuals identified as carp in the
field were assigned the highest probability (p-value=0.48-0.71) of being carp backcrosses,
and eight as F2 generation crosses (p-value=0.0.43-0.57). No individuals were classified as
F1. Four individuals classified as F2 or backcrossed in STRUCTURE were classed as
parental carp (p-value=0.8-0.82). Amongst the 23 putative hybrids, 20 had highest
probability of being F1 generation (p-value=0.65-0.91) and three of being carp backcross
(p-value=0.72-73)..These results are summarised in Tables 5.4 and 5.5.
Allele frequencies differed between species and strains/populations, and 18 carp-specific
and six goldfish-specific alleles were identified (Appendix 5.1). Inspection of the
microsatellite profiles of the putative hybrids (Table 5.6) indicated that species-specific
alleles were not present for loci Cca65 and Koi5-6; that a carp-specific allele (335) was
present at locus GF1, and both carp-specific and goldfish-specific alleles were present at
locus Cca17 (alleles 371 and 374 for carp; and alleles 387 and 389 for goldfish), and a
goldfish-specific allele was present at locus Koi29-30 (322).

123
Table 5.4. Assignment analysis of putative F1 carp-goldfish hybrids. c = carp, g = goldfish, P = parental, and BX = backcross; qK = proportion of ancestry from cluster K. The NEWHYBRIDS classification with the highest probability is marked in bold.
STRUCTURE NEWHYBRIDS (p-value)
qc qg Classification P.c P.g F1 F2 c BX g BX BD/H01 0.50 0.50 F1 0.00 0.00 0.84 0.07 0.09 0.00 BD/H02 0.50 0.50 F1 0.00 0.00 0.84 0.07 0.09 0.00 BD/H03 0.36 0.64 F1 0.00 0.00 0.65 0.28 0.04 0.03 BD/H04 0.51 0.49 F1 0.00 0.00 0.90 0.04 0.05 0.00 MG/H01 0.50 0.50 F1 0.00 0.00 0.91 0.04 0.05 0.00 MG/H02 0.51 0.49 F1 0.00 0.00 0.90 0.04 0.05 0.00 MG/H03 0.51 0.49 F1 0.00 0.00 0.90 0.04 0.05 0.00 MG/H04 0.51 0.49 F1 0.00 0.00 0.90 0.04 0.05 0.00 MG/H05 0.78 0.22 F2 or BX 0.05 0.00 0.00 0.23 0.72 0.00 MG/H06 0.51 0.49 F1 0.00 0.00 0.90 0.04 0.05 0.00 MG/H07 0.37 0.63 F1 0.00 0.00 0.73 0.20 0.04 0.02 MG/H08 0.37 0.63 F1 0.00 0.00 0.73 0.20 0.04 0.02 MG/H09 0.37 0.63 F1 0.00 0.00 0.73 0.20 0.04 0.02 MG/H10 0.77 0.23 F2 or BX 0.04 0.00 0.00 0.24 0.73 0.00 MG/H11 0.51 0.49 F1 0.00 0.00 0.90 0.04 0.05 0.00 MG/H12 0.51 0.49 F1 0.00 0.00 0.90 0.04 0.05 0.00 MG/H13 0.51 0.49 F1 0.00 0.00 0.90 0.04 0.05 0.00 MG/H14 0.51 0.49 F1 0.00 0.00 0.90 0.04 0.05 0.00 NG/H01 0.50 0.50 F1 0.00 0.00 0.91 0.04 0.05 0.00 WC/H01 0.50 0.50 F1 0.00 0.00 0.91 0.04 0.05 0.00 WC/H02 0.51 0.49 F1 0.00 0.00 0.90 0.04 0.05 0.00 WC/H03 0.51 0.49 F1 0.00 0.00 0.90 0.04 0.05 0.00 WN/H01 0.78 0.22 F2 or BX 0.05 0.00 0.00 0.23 0.72 0.00
Table 5.5. Assignment analysis of individuals showing inter-species ancestry. c = carp, g = goldfish, P = parental, and BX = backcross; qK = proportion of ancestry from genetic cluster K. NewHybrid classification with the highest probability is marked in bold.
STRUCTURE NEWHYBRIDS (p-value)
qc qg Classification P.c P.g F1 F2 c BX g BX Domestic carp K31 0.77 0.77 F2 or BX 0.04 0.00 0.00 0.24 0.72 0.00 K39 0.86 0.86 F2 or BX 1.00 0.00 0.00 0.00 0.00 0.00 K43 0.77 0.77 F2 or BX 0.04 0.00 0.00 0.24 0.72 0.00 Naturalised carp AV05 0.68 0.32 F2 or BX 0.01 0.00 0.12 0.30 0.57 0.00 BJ25 0.66 0.34 F2 or BX 0.21 0.00 0.01 0.43 0.36 0.00 Cs26 0.55 0.45 F2 or BX 0.39 0.00 0.00 0.53 0.08 0.00 Cs27 0.55 0.45 F2 or BX 0.39 0.00 0.00 0.53 0.08 0.00 Cs28 0.75 0.25 F2 or BX 0.80 0.00 0.00 0.13 0.07 0.00 Cs29 0.75 0.25 F2 or BX 0.80 0.00 0.00 0.13 0.07 0.00 Cs30 0.75 0.25 F2 or BX 0.80 0.00 0.00 0.13 0.07 0.00 Ei05 0.65 0.35 F2 or BX 0.01 0.00 0.01 0.52 0.47 0.00 Ei11 0.66 0.34 F2 or BX 0.21 0.00 0.01 0.43 0.36 0.00 Ei13 0.52 0.48 F1 0.00 0.00 0.10 0.57 0.33 0.00 Ei19 0.52 0.48 F1 0.03 0.00 0.10 0.55 0.32 0.00 Ei20 0.76 0.24 F2 or BX 0.82 0.00 0.00 0.11 0.08 0.00 Ei28 0.65 0.35 F2 or BX 0.01 0.00 0.01 0.52 0.47 0.00 MR25 0.79 0.21 F2 or BX 0.37 0.00 0.01 0.14 0.48 0.00 Naturalised goldfish WGG5 0.17 0.83 F2 or BX 0 0.55 0 0.4 0 0.05

124
Table 5.6. Microsatellite alleles in the 23 carp-goldfish hybrids identified by phenotype.
Orange = allele shared by both species; blue = carp-specific allele; yellow = goldfish-
specific allele (see Appendix 5.1). “0” designates missing data.
Individual Microsatellite Locus Cca65 GF1 Cca17 Koi29-30 Koi5-6 BD/H01 152 158 335 349 0 0 322 340 237 237 BD/H02 152 158 335 349 0 0 322 340 237 237 BD/H03 152 158 349 351 371 387 322 340 237 237 BD/H04 152 158 335 351 374 389 322 340 237 237 MG/H01 152 158 335 349 374 389 322 340 237 237 MG/H02 152 158 335 351 374 389 322 340 237 237 MG/H03 152 158 335 351 374 389 322 340 237 237 MG/H04 152 158 335 351 374 389 322 336 237 237 MG/H05 152 152 335 351 371 374 322 340 237 237 MG/H06 152 158 335 351 374 389 322 340 237 237 MG/H07 152 158 351 351 374 389 322 340 237 237 MG/H08 152 158 351 351 374 389 322 340 237 237 MG/H09 152 158 351 351 374 389 322 340 237 237 MG/H10 152 158 335 335 374 374 322 340 237 237 MG/H11 152 158 335 351 374 389 322 340 237 237 MG/H12 152 158 335 351 374 389 322 340 237 237 MG/H13 152 158 335 351 374 389 322 340 237 237 MG/H14 152 158 335 351 374 389 322 340 237 237 NG/H01 152 158 335 349 374 389 322 336 237 237 WC/H01 152 158 335 349 374 389 322 340 237 237 WC/H02 152 158 335 351 371 387 322 336 237 237 WC/H03 152 158 335 351 374 389 322 340 237 237 WN/H01 152 152 335 351 371 374 322 340 237 237
A two-dimensional representation of the results of the FCA is shown in Figure 5.2, with
the first two axes/dimensions accounting for 45% and 20% respectively of the variation in
the data. A third axis/dimension, accounting for an additional 19% of the genetic variation,
was excluded as it did not significantly affect the positioning of the data points relative to
one another. The MDB, mirror-scale (J) and Prospect Reservoir (P) carp cluster together,
and the koi (K) and Ropsha (R) carp form distinctly separate clusters. The Ropsha carp
have a very diffuse cluster, with some individuals being close to European mirror-scale
carp, and others being highly differentiated. This is consistent with these carp being
derived from crossing and backcrossing of European domestic carp with wild carp from the
River Amur in eastern Russia (Zonova and Kirpichnikov 1968). The goldfish were distinct
from carp, with the fish from the pet store being widely spread, consistent with them

125
coming from a wide range of domestic breeding lineages. The hybrids clustered between
the carp and goldfish data points.
Figure 5.2. FCA of the genetic relatedness between carp, goldfish and putative carp-
goldfish hybrids
5.3.2. Mitochondrial sequence data
The UPGMA and Neighbour-Joining phylogenetic trees were highly consistent, differing
only in the level of bootstrap support given to some nodes (Figure 5.3), and separating each
species into a well supported (86 - 100% bootstrap value) monophyletic clade. As the
purpose of the two trees was to identify DNA sequences as having come from common
carp or goldfish, they were considered sufficient for this study, although more sophisticated
and accurate tree-building methods, such as maximum likelihood (Hasegawa and Yano
1984) and maximum parsimony (Sober 1988), would be necessary for a more detailed
phylogenetic study. As expected, the Cyprinus carpio sequence from Lake Biwa, Japan
(AB158809), was placed basal to all other carp sequences, consistent with the findings of
Mabuchi et al. (2005). Previous studies have detected European ancestry of naturalised
carp in Australia (Shearer and Mulley 1978; Thai et al. 2004a; Haynes et al. 2009).
Consistent with these studies, the carp sequences from the MDB and Prospect Reservoir
clustered with the carp from the Volga River, which belongs to the European/central-Asian

126
subspecies C. carpio carpio (Zhou et al. 2003). Of the hybrids, 21 were placed in the
goldfish clade, and two in the carp clade.
Figure 5.3. Phylogenetic relationship of the first 600bp of the mitochondrial control
region in carp, goldfish, Japanese crucian carp, tench and the putative carp-goldfish
hybrids from the MDB. Individual identifiers are given in Table 5.3. A. Neighbour-
Joining tree, B. UPGMA tree. Bootstrap values less than 50 are not shown.
5.4. Discussion
In this study, the cross-species PCR amplification of five loci made it possible to confirm
that hybridisation is occurring between carp and goldfish and to detect cryptic inter-species
hybridisation. Some evidence was found that hybridisation was biased in favour of male
carp. The implications of these and other findings are discussed below.
5.4.1 Cross-Species amplification of microsatellite loci
To facilitate future studies of introgression between carp and goldfish, cross-species PCR
was optimised for four additional microsatellite loci in this study: Cca09, Cca17, Cca65

127
and Cca67 (Yue et al. 2004). Combined with the six loci that were amplified in both carp
and goldfish by Hänfling et al. (2005), namely GF1, GF17, GF29, MFW2, MFW7,
MFW17 (Croojimans et al. 1997; Zheng et al, 1995), 10 such loci are now available for
cross-species studies. PCR conditions are given for these loci by Hänfling et al. (2005) and
Haynes et al. (submitted). Locus GF1 was used in both studies, and can be PCR-amplified
under either protocol. While Vähä and Primmer (2006) recommend using no fewer than 12
loci for assignment testing to fully resolve the level of hybridisation (F1, F2, or backcross)
in a given individual, the loci used here and by Hänfling et al. (2005) have been shown to
be highly effective at detecting cross-species introgression, so optimising cross-species
PCR in for additional loci may not be necessary.
5.4.2. Hybridisation between carp and goldfish
This study confirms that interbreeding is occurring between invasive carp and goldfish in
Australia, with mixed-species ancestry confirmed genetically in all 23 phenotypically
identified hybrids. Of these hybrids, both the NEWHYBIRDS and STRUCTURE
assignments identified 20 as being most likely to be F1 generation, and three as carp-
backcrosses. The presence of backcrossed individuals confirms that hybrids are not sterile
(although they may show reduced levels of fertility), and there is likely some gene flow
between naturalised populations of carp and goldfish. The presence of aberrant barbels
around the mouth is clearly a strong indicator fish having inter-species ancestry.
5.4.3. Cryptic introgression between carp and goldfish
This study has successfully detected cryptic introgression between invasive carp and
goldfish in Australia, with 16 individuals from the MDB identified phenotypically as carp
and one individual identified phenotypically as goldfish showing putative inter-species
ancestry. The classification of these individuals as F1, F2 or backcrossed is less clear than
for the phenotypically identified hybrids, as results differ more between the STRUCTURE
and NEWHYBRIDS assignments. As NEWHYBRIDS specifically tests for the level of
hybridisation in each individual, however, the results from NEWHYBRIDS analyses are
likely more accurate than STRUCTURE. It is clear that cross-species introgression is very
rare, with mixed ancestry detected in only approximately 1.3% of carp and 1.6% of
goldfish; and with 1.63% of the overall genetic diversity of naturalised carp likely to have
been sourced from goldfish, and 1% of the genetic diversity of naturalised goldfish
128
assigned to carp. These numbers may be understated, however, as hybrid individuals
comprised only a small fraction of the total samples analysed; and this has been
demonstrated to reduce the power of both STRUCTURE and NEWHYBRIDS to detect
such hybrids (2006).
Interestingly, some of the koi used as controls also showed mixed ancestry. Possibly the
ancestors of these fish were crossed with domestic goldfish to introduce novel alleles
desirable for the selective breeding of ornamental traits.
5.4.4. Direction of hybridisation
Prior to beginning this study, it was speculated that the hybridisation between carp and
goldfish would be biased in favour of male carp, as the larger carp males could potentially
exclude the smaller goldfish males from spawning aggregations (D.M. Gilligan, per.
comm.). The detection of goldfish mitochondrial DNA in 21 of the 23 hybrids, and carp
mitochondria in only two, suggests that interspecies hybridisation is a male-carp biased.
The small number of hybrids and microsatellite loci analysed makes this far from certain,
however, and further research is needed to fully resolve this issue.
5.4.5. Implications for Conservation
The introgression detected in this study is of some concern for the conservation of
Australian freshwater ecosystems. Even through the level of introgression was low, it
indicates that goldfish could act as a reservoir of genetic diversity for highly invasive and
destructive carp. Large numbers of goldfish are imported each year for the aquarium
industry (Brumley 1991), and inevitable some individuals find their way into waterways
and survive and reproduce. Even if the fertility of inter-species hybrids is low,
interbreeding coupled with natural selection could result in the spread of adaptive alleles
into carp populations (Hänfling 2007).
Two forms of biological control of carp are being developed in Australia. These are the
daughterless gene technology, and the introduction of diseases. Both of these controls
could potentially be compromised by introgression with goldfish (Bax and Thresher 2003;
Gilligan and Rayner 2007).
129
Daughterless gene technology involves releasing large number of carp that have been
genetically modified to produce only male progeny. Continuous release of such fish has
been predicted to skew sex ratios and ultimately reduce carp numbers (Thresher and Bax
2003). Goldfish, however, could act as a reservoir of functional copies of the modified
gene(s), and so undermine attempts at control.
Koi herpes virus (KHV) is currently being assessed for use in controlling carp numbers in
Australia (Gilligan and Rayner 2007). It is especially desirable, as related species of
Cyprinid such as goldfish and grass carp (Ctenopharyngodon idella) are not affected by the
virus and do not act as carriers (Perelberg et al. 2003; Ronen et al. 2003). Were the virus to
be widely released, however, individuals carrying genes for KHV resistance inherited from
goldfish ancestors could gain a selective advantage. KHV resistance genes could hence
move rapidly through the population and negate any long-term impact of the disease.
Goldfish are resistant to a number of other viruses to which carp are susceptible (e.g.
Hedrick et al. 2006), and could act as a genetic reservoir of resistance to a whole range of
potential disease controls.
5.5. Acknowledgements
I would like to thank Dr. Klaus Kohlmann from the Department of Inland Fisheries, Berlin,
Germany, for donation of the European, Ropsha and koi samples; and the staff at the
Department of Primary Industries, NSW, Australia, for collecting the Australian samples;
the Australian Koi Farm in Bringelly, NSW, for donating samples of Japanese koi carp;
and Pets on Broadway in Camperdown, NSW, for donating samples of goldfish. My
supervisor Prof. Frank Nicholas and my associate supervisors Prof. Chris Moran, Dr. Dean
Gilligan and Dr. Peter Grewe assisted with the development of this side project and the
preparation of this document. Funding for this project was supplied by the Invasive
Animals CRC (previously the Pest Animal Control CRC), the NSW Department of
Primary Industries and the University of Sydney.
5.6. References
Al-Sabti K (1986) Karyotypes of Cyprinus carpio and Leuciscus cephalus. Cytobios, 47,
19-25.

130
Anderson EC, Thompson EA (2002) A model-based method for identifying species
hybrids using multilocus genetic data. Genetics 160, 1217-1229.
Balon EK (2004) About the oldest domestication among fishes. Journal of Fish Biology,
65 (Supplement A), 1-27. doi: 10.1111/j.1095-8649.2004.00563.x.
Bax N, Thresher R (2003) The science of producing daughterless technology; possibilities
for population control using daughterless technology; maximising the impact of
carp control. Proceedings of the National Carp Control Workshop. Canberra,
Australia.
Belkhir K, Borsa P, Goudet J, Chikli L, Bonhomme F (2000) GENETIX, logiciel sous
WindowsTM pour la ge´ne´tique des populations, version 4.01. Montpellier,
University of Montpellier II.
Brumley AR (1991) Cyprinids of Australasia. Cyprinid fishes systematics, biology and
exploitation. Suffolk, United Kingdom, St. Edumdsbury Press. ISBN: 92-5-103027-
8.
Crooijmans RPMA, Bierbooms VAF, Komen J, Van der Poel JJ, Groenen MAM (1997)
Microsatellite markers in common carp (Cyprinus carpio L.). Animal Genetics, 28,
129-134. doi: 10.1111/j.1365-2052.1997.00097.x.
David L, Rajasekaran P, Fang J, Hillel J, Lavi U (2001) Polymorphisms in ornamental and
common carp strains (Cyprinus carpio L.) as revealed by AFLP analysis and a new
set of microsatellite markers. Molecular Genetics and Genomics, 266, 353-362. doi:
10.1007/s004380100569.
Falush D, Stephens M, Pritchard JK (2003) Inference of Population Structure Using
Multilocus Genotype Data: Linked Loci and Correlated Allele Frequencies
Genetics, 164, 1567-1587.
Falush D, Stephens M, Pritchard JK (2007) Inference of population structure using
multilocus genotype data: dominant markers and null alleles. Molecular Ecology
Notes, 7, 574–578. doi: 10.1111/j.1471-8286.2007.01758.x.
Gilligan D, Rayner T (2007) The distribution, spread, ecological impacts, and potential
control of carp in the upper Murray River. NSW Department of Primary Industries,
Sydney.
Guinand B, Parisseaux B, Lebreton J, Bonhomme F (2003) Estimating population genetics
‘F-statistics’ using factorial correspondence analysis with respect to instrumental
variables. International Conference on Correspondence Analysis and Related
Methods. Barcelona, Spain.
131
Hänfling B (2007) Understanding the establishment success of non-indigenous fishes:
lessons from population genetics. Journal of Fish Biology, 71 (Supplement D),
115-135. doi: 10.1111/j.1095-8649.2007.01685.x.
Hänfling B, Bolton P, Harley M, Carvalho GR (2005) A molecular approach to detect
hybridisation between crucian carp (Carassis carassius) and non-indigenous carp
species (Carassisus cpp. and Cyprinus carpio). Freshwater Biology, 50, 403-417.
doi:10.1111/j.1365-2427.2004.01330.x.
Hasegawa M, Yano T (1984) Maximum likelihood method of phylogenetic inference from
DNA sequence data. Bulletin of the Biometric Society of Japan, 5, 1-7.
Haynes GD, Gilligan DM, Grewe P, Nicholas FW (submitted) Population genetics and
management units of invasive common carp (Cyprinus carpio L.), in the Murray-
Darling Basin, Australia. Journal of Fish Biology, 000, 000.
Haynes GD, Gongora J, Nicholas FW, Zenger KR (2009) Rapid identification of maternal
lineages in common carp (Cyprinus carpio L.) using real-time PCR and high
resolution melt-curve analysis. Aquaculture, 287, 59-66.
doi:10.1016/j.aquaculture.2008.10.035.
Hedrick RP, Waltzek TB, McDowell TS (2006) Susceptibility of koi carp, common carp,
goldfish and goldfish x common carp hybrids to cyprinid herpesvirus-2 and
herpesvirus-3. Journal of Aquatic Animal Health, 18, 26-34.
Hume JD, Fletcher AR, Morison AK (1983) Interspecific hybridization between carp
(Cyprinus carpio L.) and goldfish (Carassius auratus L.) from Victorian waters.
Australian Journal of Marine and Freshwater Research, 34, 915-919.
doi:10.1071/MF9830915.
Kelly DW, Muirhead JR, Heath DD, Macisaac HJ (2006) Contrasting patterns in genetic
diversity following multiple invasions of fresh and brackish waters. Molecular
Ecology, 15, 3641–3653. doi: 10.1111/j.1365-294X.2006.03012.x.
Koehn J (2004) Carp (Cyprinus carpio) as a powerful invader in Australian waterways.
Freshwater Biology, 49, 882-894. doi: 10.1111/j.1365-2427.2004.01232.x.
Koehn J, Brumley B, Gehrke P (2000) Managing the Impacts of Carp, Canberra, Australia,
Bureau of Rural Sciences (Department of Agriculture, Fisheries and Forestry).
ISBN 0644292407 (set) 0642732019.
Kolbe JJ, Glor RE, Schettino LR, Lara AC, Larson A, Losos JB (2004) Genetic variation
increases during biological invasion by a Cuban lizard. Nature, 431, 177-181. doi:
10.1038/nature02807.
132
Kumar S, Tamura K, Nei M (2004) MEGA3: Integrated software for Molecular
Evolutionary Genetics Analysis and Sequence Alignment. Briefings in
Bioinformatics, 5, 150-163. doi:10.1093/bib/5.2.150.
Mabuchi K, Senou H, Suzuki T, Nishida M (2005) Discovery of an ancient lineage of
Cyprinus carpio from Lake Biwa, central Japan, based on mtDNA sequence data,
with reference to possible multiple origins of koi. Journal of Fish Biology, 66,
1516-1528. doi:10.1111/j.0022-1112.2005.00676.x.
Nolte AW, Freyhof J, Stemshorn KC, Tautz D (2005) An invasive lineage of sculpins,
Cottus sp (Pisces, Teleostei) in the Rhine with new habitat adaptations has
originated from hybridization between old phylogeographic groups. Proceedings of
the Royal Society B, 272, 2379-2387. doi: 10.1038/rspb.2005.3231.
Ohno S, Muramoto J, Christian L, Atkin NB (1967) Diploid-tetraploid relationship among
Old-World members of the Fish Family Cyprinidae. Chromosoma (Berlin), 23, 1-9.
doi: 10.1007/BF00293307.
Peakall R, Smouse PE (2006) GENALEX 6: genetic analysis in EXCEL. Population
genetic software for teaching and research. Molecular Ecology Notes, 6, 288-295.
doi: 10.1111/j.1471-8286.2005.01155.x.
Perelberg A, Smirnov M, Hutoran M, Diamant A, Bejerano Y, Kotler M (2003)
Epidemiological description of a new viral disease afflicting cultured Cyprinus
carpio in Israel. The Israeli Journal of Aquaculture, 55, 5-12.
Pritchard JK, Stefens M, Donelly P (2000) Inference of population structure using
multilocus genotype data. Genetics, 155, 945-959.
Pullan S, Smith PJ (1987) Identification of hybrids between koi (Cyprinus carpio) and
goldfish (Carassius auratus). New Zealand Journal Of Marine And Freshwater
Research, 21, 41-46.
Raymond M, Rousset F (1995) GENEPOP (version 1.2): population genetics software for
exact tests and eumenicism. Journal of Heredity, 86, 248-249.
Roman J (2006) Diluting the founder effect: cryptic invasions expand a marine invader’s
range. Proceedings of the Royal Society B, 273, 2453-2459. doi:
10.1098/rspb.2006.3597.
Ronen A, Perelberg A, Abramovitz J, Mutoran M, Tinman S, Bejerano I, Steinitz M,
Kotler M (2003) Efficient vaccine against the virus causing a lethal disease in
cultured Cyprinus carpio. Vaccine, 21, 4677-4684. doi:10.1016/S0264-
410X(03)00523-1.
133
Ruiguang Z, Zheng S (1980) Analysis and comparison between the karyotypes of Cyprinus
carpio and Carassius auratus as well as Aristichthys nobilis and
Hypophthalmichthys molitrix. Acta Genetica Sinca, 7, 72-77.
Saitoh K, Sado T, Mayden RL, Hanzawa N, Nakamura K, Nishida M, Miya M (2006)
Mitogenomic evolution and interrelationships of the Cypriniformes (Actinopterygii:
)stariophysi): the first evidence toward resolution of higher-level relationships of
the world's largest freshwater fish clade based on 59 whole mitogenome sequences.
Journal of Molecular Evolution, 63, 826-841 doi: 10.1007/s00239-005-0293-y.
Shearer KD, Mulley JC (1978) The introduction and distribution of the carp, Cyprinus
carpio Linnaeus, in Australia. Australian Journal of Marine and Freshwater
Research, 29, 661-563. doi:10.1071/MF9780551
Sober E (1988) Reconstructing the past: parsimony, evolution, and inference, Cambridge,
Massachusetts, MIT Press. ISBN: 026219273x
Taylor J, Mahon R (1977) Hybridization of Cyprinus carpio and Carassius auratus, the
first two exotic species in the lower Laurentian Great Lakes Environmental Biology
of Fishes, 1, 205-208. doi:10.1007/BF00000412.
Thai BT, Burridge CP, Pham TA, Austin CM (2004) Using mitochondrial nucleotide
sequences to investigate diversity and genealogical relationships within common
carp (Cyprinus carpio L.) Animal Genetics, 36, 23-28.
Thompson JD, Higgins DG, Gibson TJ (1994) CLUSTAL W: improving the sensitivity of
progressive multiple sequence alignment through sequence weighting, position-
specific gap penalties and weight matrix choice. Nucleic Acids Research, 22, 4673-
4680.
Thresher R, Bax N (2003) The science of producing daughterless technology; possibilities
for population control using daughterless technology; maximising the impact of
carp control. In Lapidge, K. L. (Ed.) Proceedings of the National Carp Control
Workshop, March 2003, Canberra. Cooperative Research Center for Pest Animal
Control, Canberra, Australia.
Vähä JP, Primmer CR (2006) Efficiency of model-based Bayesian methods for detecting
hybrid individuals under different hybridization scenarios and with different
numbers of loci. Molecular Ecology, 15, 63–72. doi:10.1111/j.1365-
294X.2005.02773.x

134
Wasko AP, Martins C, Oliveira C, Foresti F (2003) Non-destructive genetic sampling of
fish. An improved mehtod for DNA extraction from fish fins and scales. Hereditas,
138, 161-165. doi:10.1034/j.1601-5223.2003.01503.x.
Yue GH, Ho MY, Orban L, Komen J (2004) Microsatellites within genes and ESTs of
common carp and their applicability in silver crucian carp. Aquaculture, 234, 85-
98. doi:10.1016/j.aquaculture.2003.12.021.
Zenger KR, Richardson BJ, Vachot-Griffin A-M (2003) A rapid population expansion
retains genetic diversity within European rabbits in Australia. Molecular Ecology,
12, 789-794. doi:10.1046/j.1365-294X.2003.01759.x.
Zheng W, Stacey NE, Coffin J, Strobeck C (1995) Isolation and characterization of
microsatellites loci in the goldfish Carassius auratus. Molecular Ecology, 4, 791-
792.
Zhou JF, Wu QJ, Ye YZ, Tong JG (2003) Genetic divergence between Cyprinus carpio
carpio and Cyprinus carpio haematopterus as assessed by mitochondrial DNA
analysis, with emphasis on the origin of European domestic carp. Genetica, 119,
93-97.
Zonova AS, Kirpichnikov VS (1968) Selection of Ropsha carp. Seminar/study tour in the
U.S.S.R. on genetic selection and hybridization of cultivated fishes. FAO Corporate
Document Repository http://www.fao.org/documents.

135
Appendix 5.1. Allele frequencies and private alleles by population. Phenotypically identified hybrids and individuals identified as having mixed ancestry in the STRUCTURE and HEWHYBRIDS analyses were excluded from the estimation of private alleles. Locus Allele Carp Goldfish Hybrids2
Mirror-scale
Koi Ropsha Feral1 Feral Pet store
Cca65a 150* 0.017 0.484 0.155 0.065 0.000 0.000 0.000 152 0.983 0.452 0.845 0.873 0.033 0.036 0.543 156* 0.000 0.000 0.000 0.001 0.000 0.000 0.000 158 0.000 0.065 0.000 0.061 0.959 0.964 0.457 160* 0.000 0.000 0.000 0.001 0.000 0.000 0.000 166† 0.000 0.000 0.000 0.000 0.008 0.000 0.000 GF1 335* 1.000 0.984 1.000 0.935 0.000 0.000 0.435 339† 0.000 0.000 0.000 0.000 0.000 0.143 0.000 349 0.000 0.000 0.000 0.003 0.190 0.679 0.130 351 0.000 0.016 0.000 0.061 0.810 0.179 0.435 Cca17a 371 0.583 0.175 0.433 0.128 0.000 0.000 0.095 374* 0.417 0.825 0.400 0.867 0.000 0.000 0.476 377* 0.000 0.000 0.000 0.006 0.000 0.000 0.000 381 0.000 0.000 0.167 0.000 0.000 0.107 0.000 387† 0.000 0.000 0.000 0.000 0.081 0.143 0.048 389† 0.000 0.000 0.000 0.000 0.919 0.750 0.381 Koi29-30a 309* 0.000 0.024 0.000 0.000 0.000 0.000 0.000
322† 0.000 0.000 0.000 0.000 0.984 1.000 0.000 332* 0.000 0.000 0.300 0.000 0.000 0.000 0.000 334* 0.000 0.016 0.000 0.001 0.000 0.000 0.000 336 0.133 0.806 0.000 0.346 0.008 0.000 0.152 338* 0.000 0.000 0.000 0.047 0.000 0.000 0.000 340 0.867 0.000 0.650 0.607 0.008 0.000 0.848 344* 0.000 0.153 0.000 0.000 0.000 0.000 0.000 348* 0.000 0.000 0.050 0.000 0.000 0.000 0.000 Koi5-6a 234* 0.000 0.026 0.000 0.000 0.000 0.000 0.000
237 0.833 0.077 0.414 0.988 1.000 0.429 1.000 243* 0.000 0.026 0.000 0.000 0.000 0.000 0.000 249 0.000 0.000 0.000 0.003 0.000 0.071 0.000 252* 0.167 0.269 0.103 0.009 0.000 0.000 0.000 255* 0.000 0.551 0.000 0.001 0.000 0.000 0.000 263* 0.000 0.051 0.000 0.000 0.000 0.000 0.000 267 0.000 0.000 0.483 0.000 0.000 0.143 0.000 273† 0.000 0.000 0.000 0.000 0.000 0.357 0.000
* Carp-specific alleles, † goldfish-specific alleles. 1 Carp from the MDB and Prospect Reservoir 2 Identified phenotypically by the presence of aberrant barbels around the mouth
136
Chapter 6: Rapid identification of maternal lineages in common carp
(Cyprinus carpio L.) using real-time PCR and high resolution melt-curve
analysis
Submitted to Aquaculture: 7.05.2008
Accepted: 21.10.2008
Publication details: Haynes GD, Gongora J, Nicholas FW, Zenger KR (2009). Rapid
identification of maternal lineages in common carp (Cyprinus carpio L.) using real-time
PCR and high resolution melt-curve analysis. Aquaculture 287: 59-66 doi:10.1016/
j.aquaculture.2008.10.035
Authors:
G.D. Haynes1,a, J. Gongoraa, F.W. Nicholasa, K.R. Zengerb,c
aRMC Gunn Building B19, Faculty of Veterinary Science, University of Sydney,
Camperdown, NSW 2006, Australia
bJL Shute Building C01, Faculty of Veterinary Science, University of Sydney,
Camden, NSW 2075, Australia
cPresent address: School of Marine and Tropical Biology, Faculty of Science,
Engineering and Information Technology, James Cook University,
Townsville, QLD, Australia 4811
1Corresponding author: G.D. Haynes
email: [email protected]
phone: +64 2 9351 4789, +64 424260712
FAX: +64 2 9351 2114
137
6.1. Abstract
This study presents a protocol for using real-time PCR and high-resolution melt-curve
(HRMC) analysis to score polymorphisms in the mitochondrial DNA control region of
common carp. This is the first time HRMC analysis has been used in an aquacultural
species. The technique is accurate, robust and rapid to apply. It has a number of advantages
over other existing techniques for rapidly scoring DNA polymorphisms, namely it is rapid,
taking less than three hours from start to finish; all procedures take place in closed PCR
tubes, reducing the risk of contamination and human error; cycling conditions in the
Rotorgene 6000 PCR machine used in the methodology are more homogenous than in
traditional block-based PCR machines; and the progress and success of each individual
PCR is monitored real-time. The primers were designed to score a greater number of
polymorphic sites than in previous studies, and specifically target a section of the control
region that is polymorphic amongst European carp races, which otherwise have very little
mitochondrial DNA variation. The technique was used to accurately identify three common
carp and one goldfish haplotype, with no haplotypes incorrectly identified. Although the
method outlined here is optimised for scoring common carp mitochondrial haplotypes
using the Rotorgene 6000 machine, real-time PCR and HRMC analysis can be applied in a
similar way to almost any species and/or loci, with a number of different real-time PCR
machines available for scoring genetic differences.
Key words: real-time PCR, high resolution melt-curve analysis, common carp, control
region
6.2. Introduction
Common carp (Cyprinus carpio L.) are one of the most commercially important species of
freshwater fish in the world. The trade in ornamental varieties of common carp (koi) forms
a thriving global industry. The harvesting of common carp for food, both from the wild and
from aquaculture, has been growing steadily since the late 1970s. It surpassed the
production of all salmonoid species combined in 1997, and was estimated to be in excess
of 3 million tons in 2005 (FAO 2007). In some regions, introduced common carp are
regarded as invasive pests, and measures are undertaken to control their numbers and to
limit their negative impact on the environment (Koehn et al. 2000). Management of carp,
both in the wild and in aquaculture, has been aided in recent times by advances in genetic

138
technologies, which have assisted population monitoring and species identification studies
(e.g. Hänfling et al. 2005; Thai et al. 2006).
The genotyping and comparison of maternally inherited mitochondrial DNA (mtDNA)
sequences have been utilised in a range of evolutionary and population investigations in
common carp. These include phylogeographic studies (Kohlmann et al. 2003); monitoring
the success of different carp strains in aquaculture (Thai et al. 2006); identifying the source
of invasive populations (Davis et al. 1999; Mabuchi et al. 2008); and identifying unique,
local common carp strains for conservation (Mabuchi et al. 2005; Thai et al. 2006).
Traditionally, mtDNA polymorphisms are identified either through direct sequencing (e.g.
Mabuchi et al., 2005), using restriction fragment length polymorphisms (RFLP) analysis
(e.g. Davis et al. 1999; Gross et al. 2002) or single-strand conformational polymorphisms
(SSCP) (e.g. Thai et al., 2006).
The current study presents a novel technique for the rapid identification of mtDNA
haplotypes in common carp using high-resolution melt curve (HRMC) analysis. HRMC
analysis takes advantage of different DNA sequences having slightly different melting
temperatures, even if they differ by only a single base pair. Polymorphisms in PCR-
amplified DNA sequences are identified by their unique melt-curve profiles. This
technique is similar in principal to temperature-gradient gel electrophoresis (TGGE)
(Riesner et al. 1989), but is carried out using a real-time (rt) PCR machine with high-
resolution melt-curve analysis capabilities. The benefit of this technique is the relative
speed and cost of the procedure, with it being possible to analyse hundreds of samples in
just a few hours for little more than the cost of a PCR reaction for each sample. HRMC has
been shown to be highly accurate (Reed et al. 2007; Vandersteen et al. 2007), and has been
used extensively in clinical studies to identify different viral and bacterial species and
strains (Cheng et al. 2006; Dames et al. 2007; Fortini et al. 2007; Nakagawa et al. 2008),
to identify affected and carrier individuals for genetic disorders (McKinney et al. 2004;
Zhou et al. 2004d) and to match organ donors with compatible recipients (Zhou et al.
2004c). To our knowledge, this is the first time a HRMC protocol has been developed for
the purpose of investigating evolutionary and population relationships of wild or
aquacultural populations. Although the protocol presented here is optimised for the
mitochondrial control region of common carp, HRMC analysis can readily be applied to
other loci and other species.
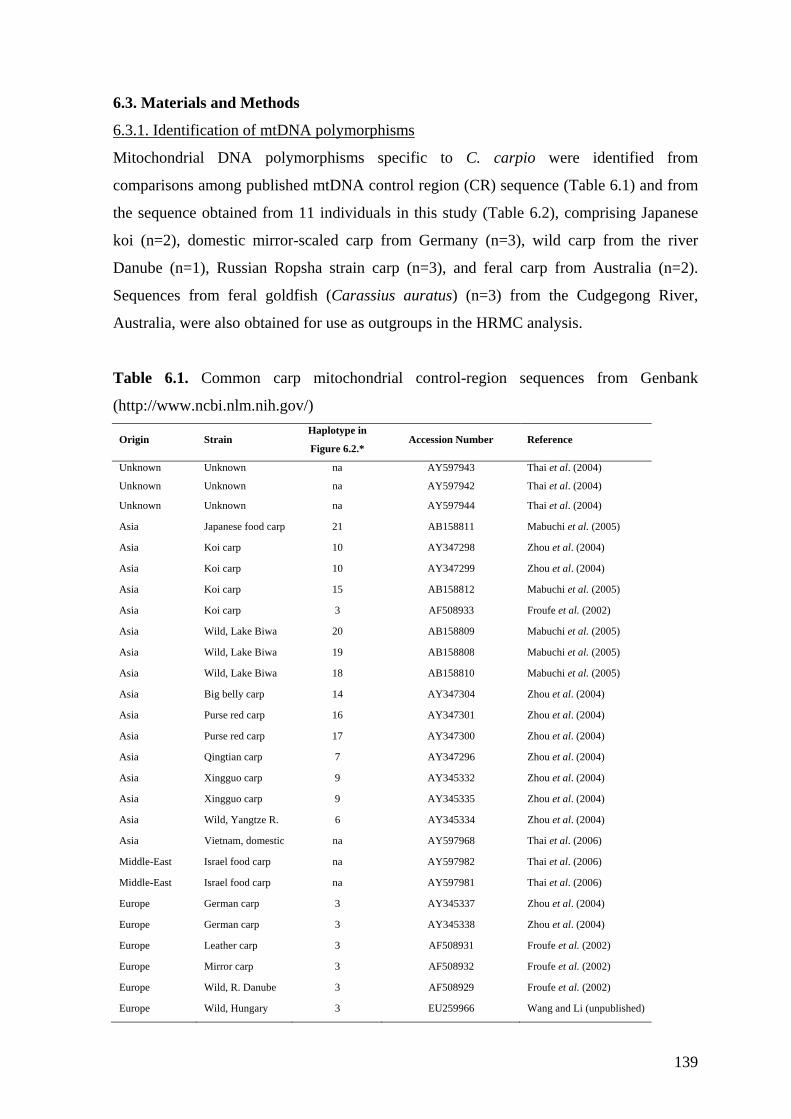
139
6.3. Materials and Methods
6.3.1. Identification of mtDNA polymorphisms
Mitochondrial DNA polymorphisms specific to C. carpio were identified from
comparisons among published mtDNA control region (CR) sequence (Table 6.1) and from
the sequence obtained from 11 individuals in this study (Table 6.2), comprising Japanese
koi (n=2), domestic mirror-scaled carp from Germany (n=3), wild carp from the river
Danube (n=1), Russian Ropsha strain carp (n=3), and feral carp from Australia (n=2).
Sequences from feral goldfish (Carassius auratus) (n=3) from the Cudgegong River,
Australia, were also obtained for use as outgroups in the HRMC analysis.
Table 6.1. Common carp mitochondrial control-region sequences from Genbank
(http://www.ncbi.nlm.nih.gov/)
Origin Strain Haplotype in
Figure 6.2.* Accession Number Reference
Unknown Unknown na AY597943 Thai et al. (2004)
Unknown Unknown na AY597942 Thai et al. (2004)
Unknown Unknown na AY597944 Thai et al. (2004)
Asia Japanese food carp 21 AB158811 Mabuchi et al. (2005)
Asia Koi carp 10 AY347298 Zhou et al. (2004)
Asia Koi carp 10 AY347299 Zhou et al. (2004)
Asia Koi carp 15 AB158812 Mabuchi et al. (2005)
Asia Koi carp 3 AF508933 Froufe et al. (2002)
Asia Wild, Lake Biwa 20 AB158809 Mabuchi et al. (2005)
Asia Wild, Lake Biwa 19 AB158808 Mabuchi et al. (2005)
Asia Wild, Lake Biwa 18 AB158810 Mabuchi et al. (2005)
Asia Big belly carp 14 AY347304 Zhou et al. (2004)
Asia Purse red carp 16 AY347301 Zhou et al. (2004)
Asia Purse red carp 17 AY347300 Zhou et al. (2004)
Asia Qingtian carp 7 AY347296 Zhou et al. (2004)
Asia Xingguo carp 9 AY345332 Zhou et al. (2004)
Asia Xingguo carp 9 AY345335 Zhou et al. (2004)
Asia Wild, Yangtze R. 6 AY345334 Zhou et al. (2004)
Asia Vietnam, domestic na AY597968 Thai et al. (2006)
Middle-East Israel food carp na AY597982 Thai et al. (2006)
Middle-East Israel food carp na AY597981 Thai et al. (2006)
Europe German carp 3 AY345337 Zhou et al. (2004)
Europe German carp 3 AY345338 Zhou et al. (2004)
Europe Leather carp 3 AF508931 Froufe et al. (2002)
Europe Mirror carp 3 AF508932 Froufe et al. (2002)
Europe Wild, R. Danube 3 AF508929 Froufe et al. (2002)
Europe Wild, Hungary 3 EU259966 Wang and Li (unpublished)

140
Table 6.1. (continued).
Origin Strain Haplotype in
Figure 6.2.* Accession Number Reference
Europe Wild, Hungary 3 EU259962 Wang and Li (unpublished)
Europe Wild, Hungary 3 EU259953 Wang and Li (unpublished)
Europe Wild, Hungary 3 EU259964 Wang and Li (unpublished)
Europe Wild, Hungary 2 EU259954 Wang and Li (unpublished)
Europe Wild, Hungary 1 EU259952 Wang and Li (unpublished)
Europe Wild, Volga R. 3 AY345339 Zhou et al. (2004)
Europe Wild, Volga R. 5 AY345340 Zhou et al. (2004)
Russia Russian carp 8 AY345333 Zhou et al. (2004)
Russia Russian carp 8 AY345336 Zhou et al. (2004)
Russia Wild, R. Amur 4 AF508935 Froufe et al. (2002)
Russia Wild, R. Amur 11 AF508938 Froufe et al. (2002)
Russia Wild, R. Amur 13 AF508937 Froufe et al. (2002)
Russia Wild, R. Amur 12 AF508936 Froufe et al. (2002)
Australia Feral carp na AY597977 Thai et al. (2004)
* Haplotypes are based only on the first 510 base pairs of the control region
Table 6.2. Mitochondrial control-region sequences obtained in this study.
Name Origin Accession Number Haplotype* AU01 Australian feral carp EU754008 A AU02 Australian feral carp EU754007 A R01 Ropsha strain Russian carp EU754009 A R02 Ropsha strain Russian carp EU754010 A R03 Ropsha strain Russian carp EU754011 A D01 Wild carp, River Danube EU754012 A GR01 German mirror-scale carp EU754013 B GR02 German mirror-scale carp EU754014 B GR03 German mirror-scale carp EU754015 B K01 Ornamental koi carp, Japan EU754016 C K02 Ornamental koi carp, Japan EU754017 C MGG6 Australian feral goldfish EU754018 G MGG7 Australian feral goldfish EU754019 G MGG8 Australian feral goldfish EU754020 G *DNA sequence polymorphisms characteristic of haplotypes A, B and C are summarised in
Table 6.3.
To generate PCR products for sequencing, mtDNA CR was amplified using the light strand
(LD) and heavy strand (HD) primers of Zhou et al. (2003), which anneal in the two genes
(tRNA-Pro and tRNA-Phe) that flank the control region (Figure 6.1). Each PCR (total of
15 µl) consisted of 10-100ng DNA template, 1x PCR buffer, 1.5mM MgCl2, 0.2mM

141
dNTPs, 0.2µM each primer and 0.4 units of Platinum Taq-DNA polymerase (Invitrogen,
Carlsbad). The PCR amplification cycle consisted of an initial denaturation of 95°C for 6
min, followed by 35 cycles of denaturation at 95°C for 30 s, annealing at 55°C for 1 min,
and extension at 72°C for 1 min, then a final extension at 72°C for 20 min. PCR products
were purified with UltraClean GelSpin DNA Purification Kits (Mo Bio, Solana Beach).
Sequencing was performed using BigDye Terminator Version 3.1 chemistry (AB, Foster).
Separate sequencing reactions were run using the LD and the HD primers. Consensus
sequences for each individual were generated in Sequencher Version 4.7TM. Forward and
reverse sequences were consistent with each other and had few difficult-to-call bases.
There was no evidence for either point or length heteroplasmy in the individuals
sequenced, as secondary peaks greater than 10% of the height of the primary peaks were
not detected (see Brandstätter et al. 2004).
Figure 6.1. Primer positions in the mitochondrial control region of common carp.
Primer sequences are listed in Table 6.4. Dashed lines indicate regions PCR amplified
in this study and subject to HRMC analysis.
Complete and partial mtDNA CR sequences from common carp were located in the NCBI
website (http://www.ncbi.nlm.nih.gov/) through BLAST searching with the carp sequences
AU01 and K01 (Table 6.2). Forty-one of these sequences, representing the worldwide
geographical range of common carp (Table 6.1), plus the 11 sequences obtained in this
study (Table 6.2), were aligned in CLUSTALW (Thompson et al. 1994), and conserved
and polymorphic regions were identified by eye (Table 6.3). A median-joining network
was constructed in Network version 4.5 (www.fluxus-engineering.com) (Bandelt et al.
1995) to illustrate the relationship between these sequences and individuals sequenced in
this project. Only the first 510bp were used in this analysis, as the 3’ region of this locus
was not available for many sequences. Sequences AY597944, AY597943, AY597942,

142
AY597982, AY597981, AY597977 and AY597968 were excluded because parts of the 5’
region were missing for these individuals.
A total of 55 polymorphic sites were identified within the common carp mtDNA CR
sequences: a (TA)8-14 repeat motif at the 3’ end of the CR, and 54 other polymorphic sites.
These are summarised in Table 3. Two regions were selected for further analysis. These
were a highly variable region (HVR) containing 40 polymorphic sites at the 5’ end of the
control region (positions 1-545), and the (TA)8-14 repeat motif (positions 812-854) and the
3’ end.
Table 6.3. Polymorphisms detected in the mitochondrial DNA control region Source Strain Identifier (Haplotype) 23
35
59
64
68
11
0 12
6 14
1 15
3 16
9 17
2 19
2 19
8 23
8 23
9 24
2 24
3 26
3 26
6 28
9 29
0 29
1
This study German mirror carp GR01, GR02, GR03 (B) T T T A A T G T C A T C A C C T C A G G G C
This study Ropsha strain, R. Danube, Australian feral carp
R01, R02, R03, D01, AU01, AU02 (A) . . . . . . . . . . . . . . . . . . . . . .
This study Koi carp K01, K02 (C) . . . . . . . C . . . . : T T . T . . . . .Genbank Unknown AY597944 - - - - - . . . . . C . : T . . T . . . . TGenbank Unknown AY597943, AY597942 - - - - - . A . . . C . : T . . . . . . . TGenbank Big belly carp AY347304 (18) . . . . . . . . . G . . : T . . T . . . . TGenbank Japanese food carp AB158811 (21) . . . . . . . C . . . . : T T . T . . . .
Genbank Koi carp AY347298, AY347299 (10) . . . G . . A . . . C . : T . . . . . . . T
Genbank Koi carp AB158812 (15) . . . . . . . . . G . . : T . . T . . . . TGenbank Lake Biwa wild carp AB158808 (19) . . C . . . A . . . . . : T T . T . A . A TGenbank Lake Biwa wild carp AB158810 (18) . . C . . . A . . . . . : T T . T . A . A TGenbank Lake Biwa wild carp AB158809 (20) . . C . . . A . . . . . . T T . T . A . A TGenbank Purse red carp AY347301 (16) . . C . . . . . . . C . : T . C T . . . . TGenbank Purse red carp AY347300 (17) . : C . . : . . . . C . : T . C T G . . . TGenbank Qingtian carp AY347296 (7) . . . G . . A . . . C . : T . . . . . . . TGenbank Xiniggo carp AY345332, AY345335 (9) . . . G . . A . . . C . : T . . . . . . . TGenbank Yantze River wild carp AY345334 (6) C . C G . . A . . . C . : T . . . . . . . TGenbank R. Amur wild carp AF508936 (12) . . . . . . . . . G . T : T . . . . . . . TGenbank R. Amur wild carp AF508937 (13) . . . . . . . . . G . . : T . . T . . . . TGenbank R. Amur wild carp AF508938 (11) . . . . C . . . . . . . : T . . T . . A . TGenbank R. Amur wild carp AF508935 (4) . . . G . . . . . . . . : . . . . . . . . .Genbank Russian carp AY345333, AY345336 (8) . . . G . . A . . . C . : T . . . . . . . T
Genbank Leather carp, mirror carp, R. Danube wild carp, koi
AF508931, AF508932, AF508929, AF508933 (3) . . . . . . . . . . . . . . . . . . . . . .
Genbank Israel, Israel, Australia, Vietnam
AY597982, AY597981, AY597977, AY597968 - - - - - . . . . . . . . . . . . . . . . .
Genbank Hungary EU259966, EU259962, EU259953, EU259964 (3) . . . . . . . . . . . . . . . . . . . . . .
Genbank Hungary EU259954 (2) . . . . . . . . A . . . . . . . . . . . . .Genbank Hungary EU259952 (1) . . . . . . . . . . . . . . . . . . . . . .Genbank Germany AY345338 (3) . . . . . . . . . . . . . . . . . . . . . .
Genbank German carp, Volga R. wild carp AY345337, AY345339 (3) . . . . . . . . . . . . . . . . . . . . . .
Genbank Volga River AY345340 (5) . . . . . . . . . . . . . . . . . . . . . .
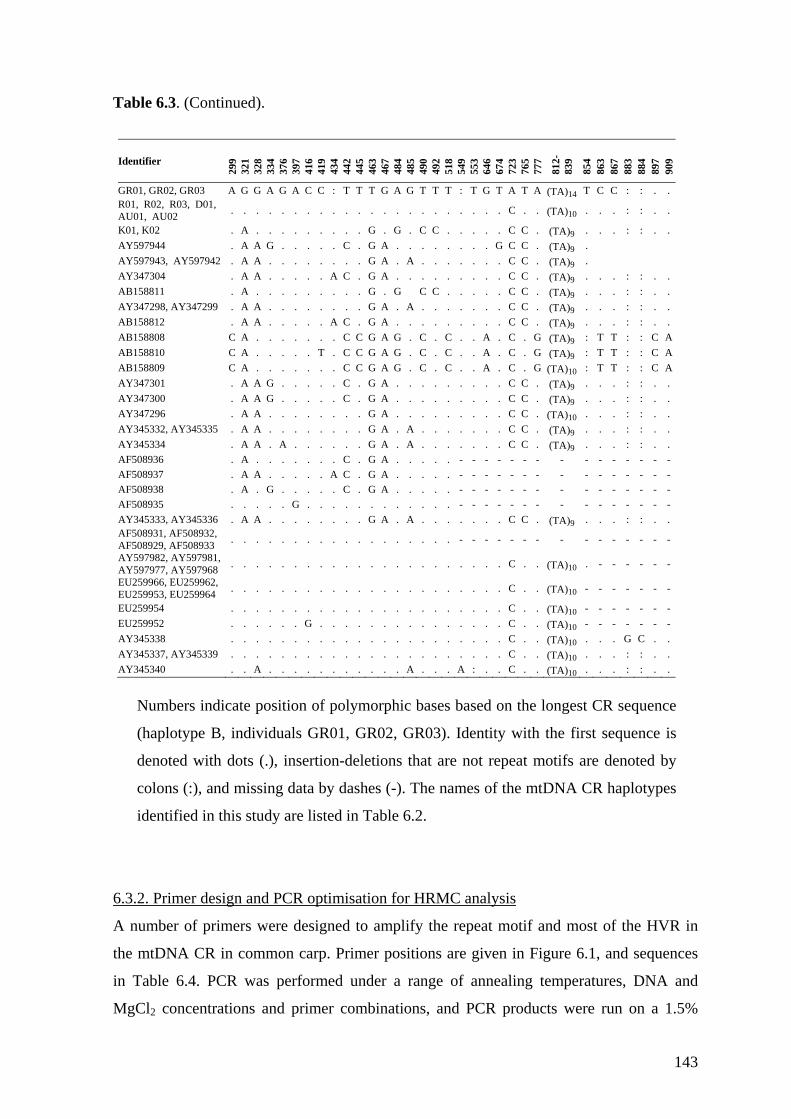
143
Table 6.3. (Continued).
Identifier
299
321
328
334
376
397
416
419
434
442
445
463
467
484
485
490
492
518
549
553
646
674
723
765
777
812-
839
854
863
867
883
884
897
909
GR01, GR02, GR03 A G G A G A C C : T T T G A G T T T : T G T A T A (TA)14 T C C : : . . R01, R02, R03, D01, AU01, AU02 . . . . . . . . . . . . . . . . . . . . . . C . . (TA)10 . . . : : . .
K01, K02 . A . . . . . . . . . G . G . C C . . . . . C C . (TA)9 . . . : : . . AY597944 . A A G . . . . . C . G A . . . . . . . . G C C . (TA)9 . AY597943, AY597942 . A A . . . . . . . . G A . A . . . . . . . C C . (TA)9 . AY347304 . A A . . . . . A C . G A . . . . . . . . . C C . (TA)9 . . . : : . . AB158811 . A . . . . . . . . . G . G C C . . . . . C C . (TA)9 . . . : : . . AY347298, AY347299 . A A . . . . . . . . G A . A . . . . . . . C C . (TA)9 . . . : : . . AB158812 . A A . . . . . A C . G A . . . . . . . . . C C . (TA)9 . . . : : . . AB158808 C A . . . . . . . C C G A G . C . C . . A . C . G (TA)9 : T T : : C AAB158810 C A . . . . . T . C C G A G . C . C . . A . C . G (TA)9 : T T : : C AAB158809 C A . . . . . . . C C G A G . C . C . . A . C . G (TA)10 : T T : : C AAY347301 . A A G . . . . . C . G A . . . . . . . . . C C . (TA)9 . . . : : . . AY347300 . A A G . . . . . C . G A . . . . . . . . . C C . (TA)9 . . . : : . . AY347296 . A A . . . . . . . . G A . . . . . . . . . C C . (TA)10 . . . : : . . AY345332, AY345335 . A A . . . . . . . . G A . A . . . . . . . C C . (TA)9 . . . : : . . AY345334 . A A . A . . . . . . G A . A . . . . . . . C C . (TA)9 . . . : : . . AF508936 . A . . . . . . . C . G A . . . . . - - - - - - - - - - - - - - -AF508937 . A A . . . . . A C . G A . . . . . - - - - - - - - - - - - - - -AF508938 . A . G . . . . . C . G A . . . . . - - - - - - - - - - - - - - -AF508935 . . . . . G . . . . . . . . . . . . - - - - - - - - - - - - - - -AY345333, AY345336 . A A . . . . . . . . G A . A . . . . . . . C C . (TA)9 . . . : : . . AF508931, AF508932, AF508929, AF508933 . . . . . . . . . . . . . . . . . . - - - - - - - - - - - - - - -
AY597982, AY597981, AY597977, AY597968 . . . . . . . . . . . . . . . . . . . . . . C . . (TA)10 . - - - - - -
EU259966, EU259962, EU259953, EU259964 . . . . . . . . . . . . . . . . . . . . . . C . . (TA)10 - - - - - - -
EU259954 . . . . . . . . . . . . . . . . . . . . . . C . . (TA)10 - - - - - - -EU259952 . . . . . . G . . . . . . . . . . . . . . . C . . (TA)10 - - - - - - -AY345338 . . . . . . . . . . . . . . . . . . . . . . C . . (TA)10 . . . G C . . AY345337, AY345339 . . . . . . . . . . . . . . . . . . . . . . C . . (TA)10 . . . : : . . AY345340 . . A . . . . . . . . . . . A . . . A : . . C . . (TA)10 . . . : : . .
Numbers indicate position of polymorphic bases based on the longest CR sequence
(haplotype B, individuals GR01, GR02, GR03). Identity with the first sequence is
denoted with dots (.), insertion-deletions that are not repeat motifs are denoted by
colons (:), and missing data by dashes (-). The names of the mtDNA CR haplotypes
identified in this study are listed in Table 6.2.
6.3.2. Primer design and PCR optimisation for HRMC analysis
A number of primers were designed to amplify the repeat motif and most of the HVR in
the mtDNA CR in common carp. Primer positions are given in Figure 6.1, and sequences
in Table 6.4. PCR was performed under a range of annealing temperatures, DNA and
MgCl2 concentrations and primer combinations, and PCR products were run on a 1.5%

144
agarose gel to assess quality and quantity. The primer pairs that gave the clearest PCR
product for the two regions of interest were used in the subsequent rt PCR and HRMC
analysis. For the HVR, the combination of the LD forward primer and the R8 reverse
primer yielded the clearest and strongest PCR product. This product is 416-417bp in length
and contains 25 identified polymorphic sites. The repeat motif at the 3’ end of the mtDNA
CR were best amplified with the F8 forward and HD reverse primers, to produce PCR
products 234-245bp in length. Both products are shown in Figure 6.1.
Table 6.4. Primer sequences for the 5’ highly variable region (HVR) and the 3’ repeat
motif region of the mtDNA CR locus. The location of the primer binding sites is on Figure
6.1.
5’ hypervariable region 3' repeat motif (TA)8-14 Forward Primers Forward Primers F1 AACTCTCACCCCTGGCTCC F2 CCAAGGAGGACTCAAGAACG
LD* TCACCCCTGGCTCCCAAAGC F4 CGAAACCAAGGAGGACTCAA
Carp-Pro** AACTCTCACCCCTGGCTACCAAA F8 CAAACCCCGAAACCAAGGAGGAC
Reverse Primers Reverse Primers R1 TCGGCATGTGGGGTA HD* CATCTTAGCATCTTCAGTG
R8 AAATAGGAACCAGATGCCAGTAA Carp-Phe** CTAGGACTCATCTTAGCATCTTCAG
R9 CACCATTAATCAGATGCCAGT R3 TTTGGGGATTTTTGGTAGGG
R7 TGGTAGGGACTTTTAGGTAAGTGG
* Zhou et al . (2004), ** Thai et al. (2004)
6.3.3. High-Resolution Melt-Curve analysis
Rt PCR and HMRC analysis was performed using a Rotorgene 6000 Real-Time PCR
machine. PCR conditions for both regions of interest consisted of 1x PCR buffer
(Invitrogen, Carlsbad), 1x LCGreen+ (Idaho Technology, Salt Lake City), 1.5mM MgCl2,
0.2mM dNTPs, 0.2µM each primer, 5% DMSO, 25µg/ml BSA, 0.4 Units Platinum Taq-
DNA polymerase (Invitrogen, Carlsbad), ~120ng genomic DNA and sterile water to 10µl
total volume. Optimal cycling conditions were 4 min initial denaturation at 94°C, followed
by 30 cycles of denaturation at 95°C for 30 sec, annealing at 55°C for 30 sec, and
extension at 72°C for 40 sec, then a final extension step of 10 min at 72°C, followed by
HRMC. In the HRMC analysis, the temperature of the PCR products was raised from 75-
85°C in 0.1°C increments, with a two-second hold at each increment.

145
The high-resolution melt curves were analysed using Rotor-gene series 6000 software
version 1.7. In each analysis, the melt curve of a representative of each identified haplotype
(A, B, C and G, see Results) was used as a control (Table 6.5).
The remaining melt curves (unknowns) were then compared with the control haplotypes. It
is important to note that only a small subset of the haplotypes in Table 6.3 were analysed in
the present study, and hence are included in Table 5. In this comparison, melt-curves for all
products from a single PCR were first normalised, so that all curves from a single PCR had
identical levels of fluorescence at the start (75°C) and at the end (85°C) of the HRMC
analysis. A melt-curve profile for each unknown sample was then generated by graphing
this normalised fluorescence against temperature. Following this, a confidence parameter
(C) was calculated as:
C S×−= 02.005.1 ,
where ∑=
−=e
s
T
Tiii ControlUnknownS 2)( , with Ts = start temperature, Te = end temperature,
and Unknowni and Controli being the height of the respective curves at temperature i.
If the highest C for an unknown with respect to a control was ≥ a given threshold, this
unknown was allocated to the haplotype corresponding to that control. If the highest C for
an unknown was < the given threshold in relation to any control, the unknown was not
assigned to a haplotype (Speller, personal communication). After some preliminary testing,
the threshold chosen for the present analysis was C = 80%.
For the HVR, carps AU01 and K01 and goldfish MGG8 were randomly chosen from
within their relevant haplotype groups to be the controls for haplotypes A/B, C and G,
respectively (see Table 6.5). Two replicates of each of the carps D01, R01 and GR01, and a
second sample of carps AU01 and K01, were genotyped via PCR-HRMC analysis, by
comparing their melt curves (unknown) with each of the control melt curves. Two
unreplicated goldfish with identical mtDNA CR sequences (MGG6 and MGG7) were also
genotyped by PCR-HRMC analysis, to check that carp and goldfish sequences could be
distinguished, and that identical goldfish sequences also produced the same melt curves.
146
Individuals were genotyped for the 3’ repeat motif in the same way as for the HVR, only
with the addition of two replicates of individual GR02 (haplotype B), and with the first
replicate of carp GR01 set as a control for haplotype B. GR02 was included to check that
haplotype B melt-curves were consistently identified when amplified from different
individuals.
6.4. Results
6.4.1. Identification of mitochondrial DNA polymorphisms
The mtDNA CR sequence polymorphisms identified in this study are summarised in Table
6.3, alongside those from the published literature. The individuals sequenced in this study
revealed four previously unidentified mtDNA CR haplotypes: A, B, C and G (Table 6.2,
Table 6.3). Haplotype A is present in the Australian feral carp (AU01, AU02), the Russian
Ropsha strain carp (R01, R02, R03) and the wild carp from the River Danube (D01).
Haplotype B was found in the German mirror scale carp (individuals GR01, GR02 and
GR03). The Japanese koi carp (K01 and K02) have haplotype C. The three goldfish have
haplotype G. None of the detected haplotypes is identical to any complete CR sequence
known to be reported in the literature, although the 5’ region of haplotypes A and B are
identical to 15 of the partial sequences (Table 6.3).
Haplotypes A and B differ by their number of repeat motifs in the 3’ end of the mtDNA
CR (haplotype A is (TA)10 and haplotype B (TA)14) and at a SNP [A/C] at sequence
position 723. Both haplotypes are very similar to sequences reported from European carp
by Froufe et al. (2002) and Zhou et al. (2004b) and Wang and Li (unpublished) and to
sequences reported from carp of European descent in Australia, Israel and Vietnam by Thai
et al. (2006). The presence of European-type haplotypes in the Ropsha and Australian carp
suggests that these carp have European maternal ancestry. Not surprisingly, the Asian
haplotype C is very different from the European haplotypes A and B, whereby it is (TA)9 at
the 3’ repeat motif and differs from A and B at 12 other polymorphic sites. Haplotype G is
highly divergent from the two carp haplotypes, differing from haplotype A at a total of 109
sites, haplotype B at 108 sites, haplotype C at 109 sites, and being (TA)8 at the 3’ repeat
motif.
The relationship between haplotypes A, B, and C and the mtDNA CR sequences from
Genbank is illustrated in a median-joining network in Figure 6.2. Haplotypes A and B are

147
grouped with European carp (haplotypes 1-5) and haplotype C with Japanese food carp
(haplotype 21). This is consistent with Thai et al. (2004a) where mtDNA sequences from
Australian carp were identical to those of European carp. Also consistent with previous
studies, the Japanese Lake Biwa carp form a lineage basal to all other carp strains
(Mabuchi et al. 2005), and one of the koi (AF508933) and one of the Russian carp
(AF508935) cluster with the European carp, indicative of those particular fish having a
European maternal ancestor (Froufe et al. 2002).
Figure 6.2. Median-joining network of the first 510 base pairs of the mtDNA CR in
common carp. Numbered circles represent haplotypes listed in Table 6.1. Small,
black, unlabelled circles represent putative mutation events, and small, white,
unlabelled circles represent theoretical ancestral haplotypes.
6.4.2. High-Resolution Melt Curve Analysis
The HRMC analysis was able to identify each of the four mtDNA CR haplotypes (A, B, C
and G) described and investigated in this study. On the basis of pre-determined sequence, it
is evident that no unknown was misassigned across the two regions amplified. Only one
individual (MGG6) could not be assigned with greater than 80% confidence to any of the
haplotypes used as controls, and this was likely a result of poor PCR amplification. In other
words, amongst all the unknowns that could be assigned, each was correctly assigned to its
haplotype. Amongst those unknowns that could be assigned a haplotype, the average
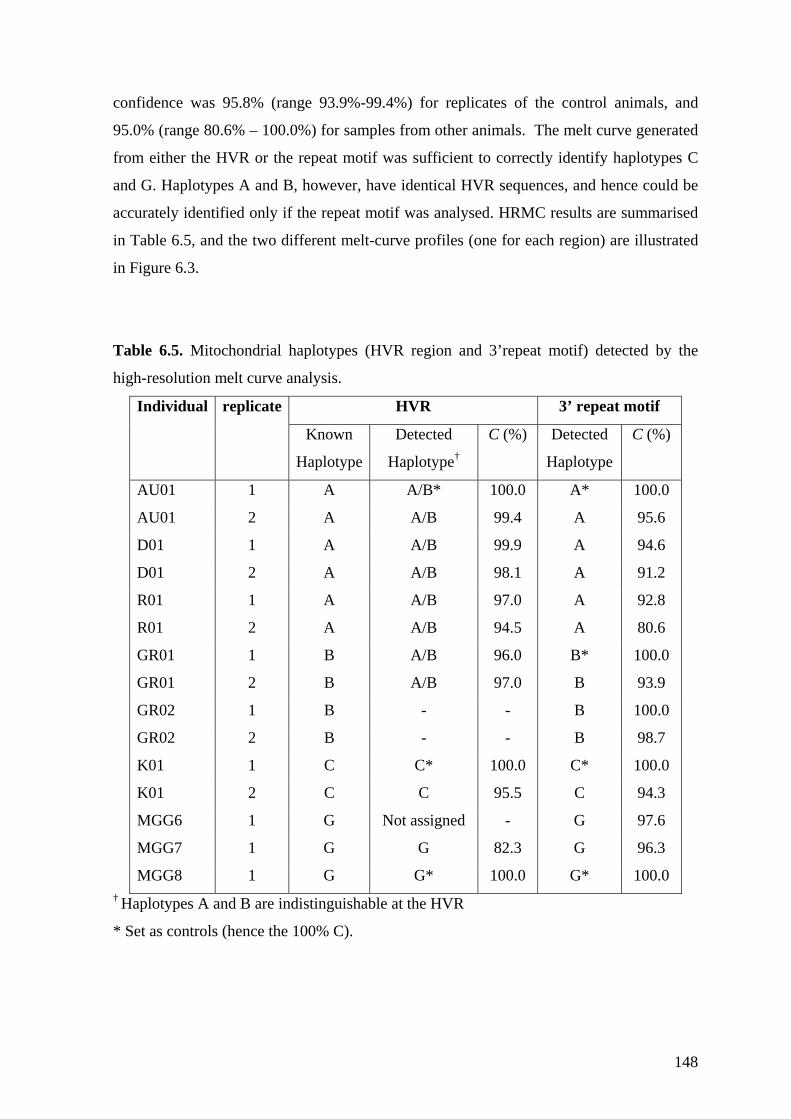
148
confidence was 95.8% (range 93.9%-99.4%) for replicates of the control animals, and
95.0% (range 80.6% – 100.0%) for samples from other animals. The melt curve generated
from either the HVR or the repeat motif was sufficient to correctly identify haplotypes C
and G. Haplotypes A and B, however, have identical HVR sequences, and hence could be
accurately identified only if the repeat motif was analysed. HRMC results are summarised
in Table 6.5, and the two different melt-curve profiles (one for each region) are illustrated
in Figure 6.3.
Table 6.5. Mitochondrial haplotypes (HVR region and 3’repeat motif) detected by the
high-resolution melt curve analysis.
Individual replicate HVR 3’ repeat motif
Known
Haplotype
Detected
Haplotype†
C (%) Detected
Haplotype
C (%)
AU01 1 A A/B* 100.0 A* 100.0
AU01 2 A A/B 99.4 A 95.6
D01 1 A A/B 99.9 A 94.6
D01 2 A A/B 98.1 A 91.2
R01 1 A A/B 97.0 A 92.8
R01 2 A A/B 94.5 A 80.6
GR01 1 B A/B 96.0 B* 100.0
GR01 2 B A/B 97.0 B 93.9
GR02 1 B - - B 100.0
GR02 2 B - - B 98.7
K01 1 C C* 100.0 C* 100.0
K01 2 C C 95.5 C 94.3
MGG6 1 G Not assigned - G 97.6
MGG7 1 G G 82.3 G 96.3
MGG8 1 G G* 100.0 G* 100.0 † Haplotypes A and B are indistinguishable at the HVR
* Set as controls (hence the 100% C).

149
Figure 6.3. Melt curve profiles of mitochondrial control region haplotypes A, B,
C and G. A. HVR, B. 3’ repeat motif loci.
As expected, there is some consistency between the differences in the curves in Figure 6.3
and the sequence differences in the haplotypes. In the HVR (Figure 6.3A), the melt curve
for haplotype G is markedly different from the other melt curves, consistent with its
sequence being highly divergent in this region. In contrast, the curves for haplotypes A/B
and C are much more similar, consistent with their differing at only 5 sites in the same
region. In the 3' repeat-motif region (Figure 6.3B), the differences between the curves are
far less marked, consistent with the haplotypes differing only in total length by a very small
number of bases. Even though differences as small as this are difficult to discern by eye in
Figure 6.3, the photometric analysis was able to distinguish between them with a high
degree of confidence.
6.5. Discussion
6.5.1. HRMC Analysis and haplotype identification
In the protocol presented here, HRMC analysis is used to rapidly and accurately identify
different mtDNA CR haplotypes in common carp. Two regions of the mtDNA CR locus
are amplified by rtPCR, and HRMC analysis is performed on the PCR products. Different
sequences are identified by their unique melt-curve profiles. Although DNA sequencing is
the most accurate way to identify different haplotypes, HRMC offers a faster and cheaper
alternative, and has been shown here to be able to distinguish haplotypes that differ by as
few as two bases.

150
HRMC analysis has a number of advantages over other methods for DNA polymorphism
screening. These are (1) rapidity, taking less than three hours from start to finish; (2)
reduced risk of contamination and human error as all procedures take place in closed PCR
tubes; (3) homogeneity of PCR thermal cycling conditions in the Rotorgene 6000 between
different PCR tubes, unlike traditional block-based PCR machines; and (4) the progress
and success of each individual PCR is monitored in real-time.
The HRMC analysis also has some limitations. When optimising PCR conditions on the
Rotorgene 6000, we found that the PCR was very sensitive to DNA quality and
concentration, with the PCRs failing if too much DNA or degraded DNA was used. DNA
template must therefore be of high quality and must be accurately quantified to avoid
overloading.
6.5.2. Choice of regions
The primers used in the present study were specifically designed to capture as much
genetic variation as possible, with the two regions of the CR analysed comprising around
650bp and containing a total of 35 sites known to be polymorphic amongst carp, including
a 3’ (TA)8-14 repeat motif, which makes it possible to distinguish between otherwise
invariable European carp mtDNA CR haplotypes. By comparison, the smaller 230 bp
fragment of the mtDNA CR screened by Thai et al. (2006) contains only 17 polymorphic
sites, none of which is known to vary amongst European carp.
6.5.3. Other methods for rapid scoring of mitochondrial haplotypes
A number of other methods have been devised for the rapid scoring of mitochondrial DNA
in common carp. All such methodologies forgo the accuracy of directly sequencing the
locus/region of interest in favour of being able to score the locus/region in a large number
of individuals in a faster and more cost-effective manner. These techniques are discussed
below.
Davis et al. (1999) digested whole mitochondrial genomes, extracted from muscle and
gonad tissue, with three restriction enzymes. Three composite haplotypes were identified
and used to infer where different strains of common carp had become established or were
introduced in Australia. The requirement to extract whole mitochondrial genomes makes

151
this technique impractical for studies where large amounts of high quality tissue are not
available.
Gross et al. (2002) used PCR-RFLP to analyse the mitochondrial ND-3/4 and ND-5/6
genes. The loci were amplified in two separate PCR reactions, and PCR products were
digested with ten restriction enzymes. Composite haplotypes were inferred from the
presence and absence of restriction sites. This technique was used in both the Gross et al.
(2002) study and in subsequent population genetic studies (Kohlmann et al. 2003; Memiş
and Kohlmann 2006) to infer relatedness between carp populations from different regions.
This technique has many strengths. The use of PCR allows it to be applied even when only
small amounts of DNA are available, and digestion of DNA with restriction enzymes is
generally robust and reproducible. The choice of loci made it possible to detect
polymorphisms amongst the mitochondrial DNA of European carp populations (Gross et
al. 2002). The technique is limited, however, in that multiple restriction enzymes must be
purchased, and that all DNA digestions (20 in this case) have to be performed in separate
tubes and analysed individually.
More recently, Thai et al. (2006) developed an SSCP protocol to screen genetic variation in
the carp mtDNA CR. Fourteen SSCP haplotypes, out of 25 determined by sequencing,
were resolved using this method. Upon close inspection of the sequences used by Thai et
al. (2006), six different sequences were all identified as SSCP haplotype C, and two as
haplotype J. SSCP techniques also can be difficult to reproduce in different laboratories,
and are likely less accurate than HRMC analysis as conditions in the closed PCR tubes
used in HRMC analysis are more controlled and more homogeneous than conditions in the
polyacrylamide gels used in SSCP, and HRMC information is read with a laser instead of
by eye.
6.5.4. Recommendations for using HRMC analysis
The following recommendations are made for researchers wishing to use real-time PCR
and HRMC analysis to score mtDNA haplotypes in common carp. (1) DNA should of the
highest quality and extracted using appropriate methodologies, to remove PCR inhibitors,
RNA and degraded DNA template. (2) DNA should be accurately quantified, using a
NanoPhotometerTM or equivalent high-accuracy technology. (3) Several known
representatives of each haplotype should be used as controls. (4) After the HRMC run, the

152
haplotypes of a sample of unassigned individuals should be sequenced. (5) If new
haplotypes are identified, it is then a simple matter to reanalyse the existing melt-curve
analysis data (i.e. without doing another HRMC run), with one or two individuals from
each of the new haplotypes set as controls. This will automatically identify all samples
with the new haplotypes.
Based on current prices, the total cost of the HRMC methodology is significantly less than
the cost of directly sequencing large numbers of individuals at commercial sequencing
rates. This is especially the case, when the number of haplotypes identified is much smaller
than the number of samples under investigation.
6.5.5. Uses and future direction
The rapid identification of mitochondrial DNA haplotypes using real-time PCR and
HRMC analysis has a wide range of applications. These include screening of wild and
domestic common carp populations to identify unique or rare strains for conservation or
selective breeding; measuring the contribution of escaped domestic carp strains to wild
populations; investigating the direction (sex or species bias) of introgression in regions
where multiple species of closely related cyprinids co-occur; and investigating
interrelatedness between common carp populations. Hänfling et al. (2005) used six nuclear
microsatellites to investigate interbreeding between the related cyprinids common carp,
goldfish (C. auratus) and gibel carp (Carassius spp.) in the UK, and detected F1 hybrids
and backcrossed individuals. The HRMC protocol outlined here could build upon this
research by scoring mtDNA CR of the fish from that study. This information could in turn
by used to infer whether the introgression was sex or species biased, and to what extent
mitochondrial lineages characteristic of one species are persisting in another. The
technique easily distinguishes between the mtDNA CR haplotypes of common carp and
goldfish, and would in all likelihood be able to distinguish gibel carp haplotypes also.
Previous studies of European carp have found very little mitochondrial DNA diversity
(Froufe et al. 2002; Mabuchi et al. 2005). Only Gross et al. (2002), Li and Wang
(unpublished) and this study have detected mitochondrial variation amongst European carp
races. Kohlmann et al. (2003) also detected mitochondrial variation within European
populations, but attributed it to the release of Asian carp into the River Danube. The
relatively low variation has been attributed to carp undergoing a series of bottlenecks as

153
they expanded their distribution from East Asia, where they originated, to Europe
(Kohlmann et al., 2003). Additional work to identify more polymorphisms amongst
European carp races for screening with HRMC would therefore be useful.
Although the method outlined here is optimised for scoring common carp mitochondrial
haplotypes, rtPCR and HRMC analysis can be applied in a similar way to almost any
species and/or loci to score genetic differences. A range of real-time PCR machines are
available for this in addition to the Rotorgene 6000, such as the HR-1™ System (Idaho
Technology Inc.) and the LightCycler ® (Roche). PCR-HRMC analysis has already been
used effectively in a diverse range of studies to identify sequence differences in both
diploid (McKinney et al. 2004; Zhou et al. 2004c; Zhou et al. 2004d) and haploid (Cheng
et al. 2006; Dames et al. 2007; Fortini et al. 2007; Nakagawa et al. 2008) genomes; has
been shown to be highly accurate, both here and in previous studies (Reed et al. 2007;
Vandersteen et al. 2007); and has much to offer the study of aquacultural species.
6.6. Acknowledgements
DNA samples were supplied by Dr. Dean Gilligan at the Department of Primary Industries,
NSW, Australia, and Dr. Klaus Kohlmann at the Department of Inland Fisheries, Berlin,
Germany. Funding for this project was supplied by the Invasive Animals CRC (previously
the Pest Animal Control CRC) and the University of Sydney. We are indebted to Bridget
Speller from Corbett Life Science for her advice in the use of the Rotor gene 6000 and its
supporting software; and to Jonathan Usmar and Professor John James from the Faculty of
Veterinary Science, University of Sydney, for their advice on statistics and computing.
6.7. References
Bandelt, H.-J., Forster, P., Sykes, B.C., Richards, M.B., 1995. Mitochondrial portraits of
human populations. Genetics 141, 743-753
Brandstätter, A., Niederstätter, H., Parson, W., 2004. Monitoring the inheritance of
heteroplasmy by computer-assisted detection of mixed basecalls in the entire
human mitochondrial DNA control region. Int J Legal Med 118, 47-54.
Cheng, J.C., Huang, C.L., Lin, C.C., Chen, C.C., Chang, Y.C., Chang, S.S., Tseng, C.P.,
2006. Rapid detection and identification of clinically important bacteria by high-

154
resolution melting analysis after broad-range ribosomal RNA real-time PCR.
Clinical Chemistry 52, 1997-2004.
Dames, S., Pattison, D.C., Bromley, L.K., Wittwer, C.T., Voelkerding, K.V., 2007.
Unlabeled probes for the detection and typing of herpes simplex virus. Clinical
Chemistry 53, 1847-1854.
Davis, K.M., Dixon, P.I., Harris, J.H., 1999. Allozyme and mitochondrial DNA analysis of
carp, Cyprinus carpio L., from south-eastern Australia. Marine and Freshwater
Resources 50, 253-260.
FAO, 2007. Yearbook of Fisheries Statistics Summary Table. Available at:
http://www.fao.org/fi/statist/summtab/default.asp.
Fortini, D., Ciammaruconi, A., De Santis, R., Fasanella, A., Battisti, A., D'Amelio, R.,
Lista, F., Cassone, A., Carattoli, A., 2007. Optimization of high-resolution melting
analysis for low-cost and rapid screening of allelic variants of Bacillus anthracis by
multiple-locus variable-number tandem repeat analysis. Clinical Chemistry 53,
1377-1380.
Froufe, E., Magyary, I., Lehoczky, I., Weiss, S., 2002. mtDNA sequence data supports an
Asian ancestry and single introduction of the common carp into the Danube Basin.
Journal of Fish Biology 61, 301-304.
Gross, R., Kohlmann, K., Kersten, P., 2002. PCR-RFLP analysis of the mitochondrial ND-
3/4 and ND-5/6 gene polymorphisms in the European and East Asian subspecies of
common carp (Cyprinus carpio L.). Aquaculture 204, 507-516.
Hänfling, B., Boton, P., Harley, M., Carvalho, G.R., 2005. A molecular approach to detect
hybridisation between crucian carp (Carassis carassius) and non-indigenous carp
species (Carassisus cpp. and Cyprinus carpio). Freshwater Biology 50, 403-417.
Koehn, J., Brumley, B., Gehrke, P., 2000. Managing the Impacts of Carp. Bureau of Rural
Sciences (Department of Agriculture, Fisheries and Forestry - Australia), Canberra.
Kohlmann, K., Gross, R., Murakaeva, A., Kersten, P., 2003. Genetic variability and
structure of common carp (Cyprinus carpio) populations throughout the distribution
range inferred from allozyme, microsatellite and mitochondrial DNA markers.
Aquatic Living Resources 16, 421-431.
Mabuchi, K., Senou, H., Nishida, M., 2008. Mitochondrial DNA analysis reveals cryptic
large-scale invasion of non-native genotypes of common carp (Cyprinus carpio) in
Japan. Molecular Ecology 17, 796-809.
155
Mabuchi, K., Senou, H., Suzuki, T., Nishida, M., 2005. Discovery of an ancient lineage of
Cyprinus carpio from Lake Biwa, central Japan, based on mtDNA sequence data,
with reference to possible multiple origins of koi. Journal of Fish Biology 66, 1516-
1528.
McKinney, J.T., Longo, N., Hahn, S.H., Matern, D., Rinaldo, P., Strauss, A.W.,
Dobrowlski, S.F., 2004. Rapid, comprehensive screening of the human medium
chain acyl-CoA dehydrogenase gene. Molecular Genetics and Metabolism 82, 112-
120.
Memiş, D., Kohlmann, K., 2006. Genetic characterization of wild common carp (Cyprinus
carpio L.) from Turkey. Aquaculture 258, 257-262.
Nakagawa, T., Higashi, N., Nakagawa, N., 2008. Detection of antigenic variants of the
influenza B virus by melting curve analysis with LCGreen. Journal of Virological
Methods 148, 296-299.
Reed, G.H., Kent, J.O., Wittwer, C.T., 2007. High-resolution DNA melting analysis for
simple and efficient diagnostics. Pharmacogenomics 8, 597-608.
Riesner, D., Steger, G., Zimmat, R., Owens, R.A., Wagenhöfer, M., Hillen, W., Vollbach,
S., Henco, K., 1989. Temperature-gradient gel electrophoresis of nucleic acids:
Analysis of conformational transitions, sequence variations, and protein-nucleic
acid interactions. Electrophoresis 10, 377-379.
Thai, B.T., Pham, T.A., Austin, C.M., 2006. Genetic diversity of common carp in Vietnam
using direct sequencing and SSCP analysis of the mitochondrial DNA control
region. Aquaculture 258, 228-240.
Thai, B.T., Burridge, C.P., Pham, T.A., Austin, C.M., 2004. Using mitochondrial
nucleotide sequences to investigate diversity and genealogical relationships within
common carp (Cyprinus carpio L.) Animal Genetics 36, 23-28.
Thompson, J.D., Higgins, D.G., Gibson, T.J., 1994. CLUSTAL W: improving the
sensitivity of progressive multiple sequence alignment through sequence weighting,
position-specific gap penalties and weight matrix choice. Nucleic Acids Research
22, 4673-4680.
Vandersteen, J.G., Bayrak-Toydemir, P., Palais, R.A., Wittwer, C.T., 2007. Identifying
common genetic variants by high-resolution melting. Clinical Chemistry 53, 1191-
1198.
Zhou, J.F., Wu, Q.J., Ye, Y.Z., Tong, J.G., 2003. Genetic divergence between Cyprinus
carpio carpio and Cyprinus carpio haematopterus as assessed by mitochondrial
156
DNA analysis, with emphasis on the origin of European domestic carp. Genetica
119.
Zhou, J.F., Wu, Q., Wang, Z., Ye, Y., 2004a. Molecular phylogeny of three subspecies of
common carp Cyprinus carpio, based on sequence analysis of cytochrome b and
control region mtDNA. Journal of Zoological Systematics and Evolutionary
Research 42, 266-269.
Zhou, L., Vandersteen, J., Wang, L., Fuller, T., Taylor, M., Palais, B., Wittwer, C.T.,
2004b. High-resolution DNA melting curve analysis to establish LHA genotypic
identity. Tissue Antigens 64, 156-164.
Zhou, L.M., Myers, A.N., Vandersteen, J.G., Wang, J.G., Wittwer, C.T., 2004c. Closed-
tube genotyping with unlabeled oligonucleotide probes and a saturated DNA dye.
Clinical Chemistry 5, 1328-1335.
157
Chapter 7: General discussion and conclusions
7.1. Summary of findings
The population genetics of common carp in the MDB has been comprehensively
investigated in this Ph.D. The findings of this project are listed below.
1. No fewer than four strains of carp exist in Australia: Boolara, Prospect, Yanco and Koi.
2. The origin of the Yanco, Boolara and Prospect strains has been confirmed as European
(C. carpio carpio). The Koi carp, as expected, belong to the Asian subspecies (C.
carpio haematopterus).
3. The four strains are differently distributed throughout the MDB (Table 7.1).
4. The carp population in the MDB is somewhat structured, owing in part to the
differential distribution of the different strains, and in part to man-made and natural
barriers to dispersal that prevent the population(s) becoming panmictic. The natural
longevity of carp may also have a role in slowing the cap population in the MDB
becoming panmictic. While the younger carp are the result of multiple generations of
inter-strain breeding and presumably are becoming more homogeneous with each
generation, the older individuals are likely similar to the original founding strains. As
the older carp are not evenly distributed throughout the basin, genetic structuring is
detected when these fish are collected and analysed with their cross-bred progeny. The
genetic structuring of carp in the MDB does not follow an isolation-by-distance type
pattern, consistent with a lack of regional equilibrium, and migration and gene flow
play a larger role in shaping genetic structure than genetic drift.
5. A history of the introduction and spread of carp in the MDB is proposed, based on
demographic, historical and genetic data (see Chapter 3 for details).
6. The MDB can be divided into 15 management units.
7. The three east-coast carp populations assessed show strong genetic structuring and
consist of different proportions of the four carp strains (Table 7.1).
8. Of the 14 microsatellite loci used in the project, five can be amplified reliably in
goldfish and are hence suitable for cross-species studies.
9. Low levels of introgression occur between feral carp and goldfish in the MBD.
Goldfish may therefore act as a reservoir of genetic diversity for common carp and vice
versa.
Table 7.1. Distribution of the different strains of common carp in Australia (see Chapters 3 and 4).

158
Strain Range
MDB Coastal waterways Tasmania
Prospect Ubiquitous, dominant above
Burrendong Dam.
All carp in Prospect Reservoir
belong to this strain. Dominant in
Hawkesbury-Nepean River, smaller
contribution to Parramatta and
Hunter Rivers.
Major contribution
Boolara Ubiquitous below major dams;
rare above Wyangala, Burrendong
and Burrinjuck Dams.
Minor contribution to Parramatta,
Hawkesbury-Nepean Rivers; major
contribution to the Hunter River.
Major contribution
Yanco Dominant in the Murrumbidgee
River and several other NSW
rivers. Rare in the Macquarie
River and the rivers in Victoria
and Queensland.
Minor contribution to Parramatta,
Hawkesbury-Nepean and Hunter
Rivers.
Very minor
contribution or absent
Koi Rare.
Dominant in Parramatta River,
minor contribution to Hawkesbury-
Nepean and Hunter Rivers.
Very minor
contribution or absent
7.2. Reinterpretation of previous population genetic studies of carp in Australia
There are two key findings in this study that affect how the results of the previous studies
by Davis et al. (1999) and Shearer and Mulley (1978) are interpreted. These are (1) the
widespread distribution of Prospect-strain carp in the MDB, and (2) the differential
distribution of the different carp strains throughout the MDB.
The abundance of the Prospect-strain individuals in the MDB explains why Davis et al.
(1999) could not differentiate between carp in the MDB that were thought to be Boolara
strain and carp in Potts Point Reservoir which were thought to be Prospect strain. This also
negates the commonly held view (Koehn et al. 2000) that dominance of carp in the MDB is
due solely to the release of the Boolara strain. Additionally, it puts into doubt the accuracy
of measures used by Shearer and Mulley (1978) to differentiate between Yanco, Prospect
and Boolara carp. While Yanco carp could be readily identified by their orange

159
colouration, the individuals used by Shearer and Mulley (1978) to represent the Boolara
carp in this study may have in fact been a mixture of Boolara and Prospect-strain
individuals. This does not put into doubt, however, the existence of the two strains
themselves, as there is abundant historical and genetic evidence to support their
distinctiveness.
The inability of Davis et al. (1999) to discern a clear pattern from the genetic structuring of
carp in the MDB can be explained by the differential distribution of the different strains
detected in this study. The genetic structuring is partially derived from these strains being
present at different proportions in different regions. Without the knowledge that four
strains were present, had been distributed by human activities and were at different
proportions in different regions, the distribution of different alleles and significant genetic
differences between sample sites would appear puzzling.
7.3. Implications of this research
A range of control strategies are currently being used or considered for the control of carp
in Australian waters. These are detailed in Gilligan and Rayner (2007) and can be divided
into two groups: physical controls and biological controls.
Physical controls are the methods that involve physical removal of carp from waterways, or
physical exclusion of carp from breeding sites. They include:
1. Financial subsidisation of commercial carp fisheries.
2. The inclusion of William’s carp separation cages (Stuart et al. 2006a) in fishways.
These cages exploit the tendency of common carp to jump, and fish indigenous to
Australia not to jump, over obstacles while swimming. These cages temporarily
trap migrating fish in the fishways. The carp subsequently jump into a specifically
designated holding cage from which they are later removed, while the native fish
remain in the fishway. The carp separation cage is periodically opened to let the
native fish pass.
3. The use of a Judas fish involves the release of a radio-tagged fish (the ‘Judas’ fish)
into waterways infested with carp. As carp are a schooling species, this fish will
locate and school with other carp. The school of carp can then be located via the
radio tag and fished from waterways.

160
4. Physical exclusion of carp from breeding sites either using mesh too fine for adult
carp to pass through, or manipulation of water levels so that ideal breeding sites
remain dry throughout the carp breeding season.
Gilligan and Rayner (2007) suggest three possible biological controls for the management
of carp in Australia. These are the release of the koi herpes virus, the release of carp pox
and the use of daughterless carp gene technology. The CSIRO Livestock Industries’
Australian Health Laboratory is currently assessing koi herpes virus as a potential
biological control agent, while the daughterless technology is still under development in
CSIRO Marine and Atmospheric Research Laboratories. Carp pox is not currently under
consideration as a biological control, but may be considered in future to be used in
conjunction with other biological control agents. It may be difficult to gain approval for the
release of disease against carp, as these diseases could impact the trade in ornamental koi
and goldfish, and could pose a risk to native species.
The most important achievement of this research has been to devise management units for
control of carp in the MDB. These 15 units can assist in the targeting of the control
programs described above, in such ways as identifying areas where physical removal will
be most effective (smaller management units with limited immigration), identifying
regions from which areas could be recolonized after control (upstream management units
or within the same management unit), and predicting which regions will be affected by the
release of biological controls (downstream management units).
The introgression detected between carp and goldfish in Chapter 5 could affect the
implementation of biological controls. If diseases to which goldfish are immune are
released to control carp, individual alleles conveying immunity carried by goldfish could
spread rapidly through the carp population and negate the effect of the disease. In addition,
the goldfish could act as a reservoir of genetic diversity that undermines the effect of the
daughterless-gene technology.
Ultimately, control of carp in Australia requires an integrated approach that incorporates
physical controls, biological controls, public education and remediation of MDB habitats
and flow regimes to make habitats more suitable for native species and less so for common
carp.

161
7.4. Future research
There are a range of future research possibilities for the study of carp in Australia. These
include improving the accuracy and resolution of this study, further investigating the
population genetics of the many coastal populations of carp, further study of introgression
between carp and goldfish, and investigating the presence of crucian carp (Carassius
carassius).
7.4.1. Improving accuracy and power of this study
In all genetic studies, the accuracy and power of statistical analysis is proportional to the
number of genetic markers used. More loci means more accuracy and power, and hence
more confidence in the findings. The inclusion of more microsatellite or other types of
DNA markers would therefore increase the resolution of the research reported in this
thesis.
The inclusion of additional outgroups would also improve the resolution of future studies.
Such outgroups could include:
• 1-2 strains representative of the south-east Asia carp subspecies C carpio.
viridiviolaceus (Kirpichnikov 1981; Zhou et al. 2004b) ;
• 1-2 Chinese strains, which would be better representative of C. carpio.
haematopterus than Koi;
• 1-2 additional European strains;
• a population of Boolara carp that has not been interbred with other carp
varieties (available from Gippsland, Victoria); and
• additional Prospect strain carp, caught from Prospect Reservoir and/or Potts
Point Reservoir (Davis 1996).
Application of the RT-PCR and HRMC analysis protocol detailed in Chapter 5 to all the
carp samples analysed in this Ph.D. would also add to the value of future studies, as novel
mitochondrial variants could be identified and the extent of Asian carp and goldfish
maternal introgression into the MDB carp population could be quantified (this was not
done in this study due to time and budgeting constraints).

162
Improving this study could possibly alter the recommendations made for management.
New management units could be delimited and/or previous units could be found to be
undifferentiated. In addition, the history of introduction and range expansion proposed in
Chapter 3 could be altered. However, a comprehensive sampling regime and a relatively
large number of microsatellite loci were used in this study, to minimise this possibility.
Such improvements would therefore be unlikely to indicate required changes to
management strategy.
7.4.2. Study of coastal populations
A detailed population genetic study of the coastal populations of common carp in Australia
would be useful for control of carp in these regions, for the same reasons that the present
study is useful for control of carp in the MDB. Emphasis would be placed, however, on
genetic structuring between catchments, rather than between regions within the same
catchment, as was the main focus of this Ph.D. research.
7.4.3. Further study of carp-goldfish introgression
In this study, only five loci were used to quantify introgression between carp and goldfish.
Such a small number of loci have limited power and accuracy. However, cross-species
amplification has been optimised for another five loci by Hänfling et al. (2005), making a
total ten such loci available. Simulations by Vähä and Primmer (2006) indicate that at least
12 loci are required for accurate assignment in cross-species studies, so it might be optimal
to optimise cross-species amplification in at least another two microsatellite loci. More
cross-species PCR of microsatellite loci could also be made possible by sequencing
published microsatellites and their flanking regions in both species, identifying conserved
regions and designing primers to anneal in those conserved regions. However, as, the loci
used here and by Hänfling et al. (2005) have been shown to be highly effective at detecting
cross-species introgression, so optimising cross-species PCR in for additional loci may not
be necessary.
7.4.4. Investigating the presence of crucian carp
The presence of crucian carp in the MDB was reported by Whitley (1951), was later
refuted by museum curators in 1980 (Clements 1988), and has recently been confirmed in
the Campaspe River (a tributary to the Murray River) in eastern Victoria, based on
morphological characteristics (MDBC 2008b). Crucian carp are very similar to goldfish in

163
appearance, and the two species can be easily confused. Confirming the presence of
crucian carp with genetics would therefore be worthwhile.
Confirming the presence of crucian carp would require genetic markers that amplify in
carp, goldfish and crucian carp, and a reference sample of crucian carp. The six genetic
markers used by Hänfling et al. (2005) were shown to be effective at distinguishing
between the three species. In addition, mitochondrial sequencing (or screening using the
real-time PCR and HRMC analysis protocol detailed in Chapter 6) would also likely
separate the three species. A reference sample of crucian carp could also be obtained from
the UK in the same manner as described by Hänfling et al. (2005).
Once the genetic markers and reference samples were available, putative crucian carp
could readily be identified by assignment testing (Chapter 5), and inter-species
introgression could be quantified as described in Chapter 5.
7.5. References
Clements J (1988) Salmon at the Antipodes A History and Review of Trout, Salmon and
Char and Introduced Coarse Fish in Australasia, Ballarat, Victoria, Australia,
Published by the author. ISBN: 0731637194.
Davis KM (1996) Investigation into the genetic variation of carp (Cyprinus carpio) in
Southeastern Australia. Sydney, Australia, University of NSW.
Davis KM, Dixon PI, Harris JH (1999) Allozyme and mitochondrial DNA analysis of carp,
Cyprinus carpio L., from south-eastern Australia. Marine and Freshwater
Resources, 50, 253-60. doi: 10.1071/MF97256
Gilligan D, Rayner T (2007) The distribution, spread, ecological impacts, and potential
control of carp in the upper Murray River. NSW Department of Primary Industries,
Sydney.
Hänfling B, Bolton P, Harley M, Carvalho GR (2005) A molecular approach to detect
hybridisation between crucian carp (Carassis carassius) and non-indigenous carp
species (Carassisus cpp. and Cyprinus carpio). Freshwater Biology, 50, 403-417.
doi:10.1111/j.1365-2427.2004.01330.x.
Kirpichnikov VS (1981) Genetic Bases of Fish Selection, Berlin and Heidelberg, Germany,
New York, USA, Springer-Verlag. ISBN: 0387109110.

164
Koehn J, Brumley B, Gehrke P (2000) Managing the Impacts of Carp, Canberra, Australia,
Bureau of Rural Sciences (Department of Agriculture, Fisheries and Forestry).
ISBN 0644292407 (set) 0642732019.
MDBC (2008) Sustainable rivers audit report. Murray-Darling Basin Commission,
Shearer KD, Mulley JC (1978) The introduction and distribution of the carp, Cyprinus
carpio Linnaeus, in Australia. Australian Journal of Marine and Freshwater
Research, 29, 661-563. doi:10.1071/MF9780551
Stuart I, Williams A, McKenzie J, Holt T (2006) The Williams' cage: a key tool for carp
management in Murray-Darling Basin fishways. Arthur Rylah Institute for
Environmental Research, Department of Sustainability and Environment,
Heidelberg, Victoria.
Vähä JP, Primmer CR (2006) Efficiency of model-based Bayesian methods for detecting
hybrid individuals under different hybridization scenarios and with different
numbers of loci. Molecular Ecology, 15, 63–72. doi:10.1111/j.1365-
294X.2005.02773.x
Whitley GP (1951) Introduced Fishes-II. The Australian Museum Magazine, 10, 234-238.
Zhou JF, Wu Q, Wang Z, Ye Y (2004) Molecular phylogeny of three subspecies of
common carp Cyprinus carpio, based on sequence analysis of cytochrome b and
control region mtDNA. Journal of Zoological Systematics and Evolutionary
Research, 42, 266-269. doi: 10.1111/j.1439-0469.2004.00266.x.