popular annual financial report - vbgov.com
TRANSCRIPT
P o p u l a r A n n u a l F i n a n c i a l R e p o r t
F i s c a l Y e a r E n d i n g J u n e 3 0 , 2 0 1 9
T AB L E O F C O N T E N T S
I N T R O D U C T I O N
D E P A R T M E N T O F F I N A N C E
Q U I C K F A C T S
S T A T I S T I C S
V I R G I N I A B E A C H B Y
T H E N U M B E R S
C I T Y - W I D E R E V E N U E S
C I T Y - W I D E R E V E N U E S
& E X P E N S E S
C I T Y - W I D E N E T P O S I T I O N
C I T Y - W I D E L O N G - T E R M
L I A B I L I T I E S
G E N E R A L F U N D
P R I O R I T I E S
Y E A R I N R E V I E W
I N M E M O R I A M
3
4
5
6
7
8
9
1 0
1 2
1 4
1 6
1 7
1 9
The City of Virginia Beach Finance Department is proud to present the Popular Annual Financial Report (PAFR) for the fiscal year ended June 30, 2019. This is a short form report that provides summarized information about the City’s financial activities. It is intended to give readers an overview of the City and its finances. The PAFR provides a picture of the City’s general financial condition, including a brief analysis of where the City’s revenues come from and where those dollars are spent.
Every year, the City of Virginia Beach is required to produce a Comprehensive Annual Financial Report (CAFR) that provides detailed information about the City’s financial position. It is prepared in conformance with generally accepted accounting principles (GAAP). The CAFR includes an audit from an independent firm of licensed certified public accountants.
The information in this report is derived from the FY2019 CAFR; however, while this report gives a summary of financial information for the City and School Board, it does not provide detailed information on all the City’s funds, the Community Development Corporation component unit, or all the necessary financial statements and note disclosures as required by GAAP. For purposes of this report, the term “City-wide” refers to activities of both the City and the School Board.
To view the CAFR in its entirety, please visit:
www.VBgov.com/Finance
I N T R O D U C T I O N
3
MISSION
The Department of Finance serves as a strategic business partner to provide excellent service to internal and external customers, deliver a clear and concise picture of the City’s current and future financial position and promote actions to achieve the City’s goals and priorities.
D E P A R T M E N T O F F I N A N C E
OUTSTANDING ACHIEVEMENT IN PAFR REPORTING
The City of Virginia Beach received an Award for Outstanding Achievement in Popular Annual Financial Reporting from the Government Finance O�icers Association of the United States and Canada (GFOA) for its Popular Annual Financial Report for the fiscal year ended June 30, 2018. This prestigious national award recognizes conformance with the highest standards for preparation of state and local government popluar reports.
In order to receive an Award for Oustanding Achievement in Popular Annual Financial Reporting, a government unit must publish a Popular Annual Financial Report whose contents conform to program standards of creativity, presentation, understandability and reader appeal.
An Award for Outstanding Achievement in Popular Annual Financial Reporting is valid for a period of one year only. We believe our current report continues to conform to the Popular Annual Financial Reporting requirements, and we are submitting it to GFOA to determine its eligilibilty for another award.
The Comprehensive Annual Financial Report (CAFR), one of the supporting documents for this report, also represents award-winning work, with the City of Virginia Beach receiving the GFOA’s Certificate of Achievement for Excellence in Financial Reporting for the 40th time.
4

Located in the southeastern corner of Virginia along the shores of the Atlantic
Ocean and Chesapeake Bay, Virginia Beach is only a four-hour drive to
Washington D.C. and within a day’s drive from two-thirds of the U.S. population.
VERMONT
NEWHAMPSHIRE
VIRGINIA BEACH
WASHINGTON D.C.
ATLANTA
MIAMI
CHARLOTTE
NEW YORK CITY
BOSTON
ORLANDO
T O P 1 0 E M P L O Y E R S
City of Virginia Beach/Schools
Naval Air Station Oceana and Dam Neck Annex
Sentara Healthcare
Joint Expeditionary Base Little Creek – Ft. Story
GEICO General Insurance Company
1.
2.
3.
4.
5.
Lynnhaven Mall
Gold Key/PHR Hotels and Resorts
STIHL Inc.
Amerigroup (Anthem)
Navy Exchange Service Command
6.
7.
8.
9.
10.
VIRGINIA BEACH,
FORMED
JANUARY 1, 1963,
IS THE LARGEST
CITY IN THE
COMMONWEALTH &
43RD LARGEST CITY
IN THE COUNTRY BY
POPULATION.
Q U I C K F A C T S
5

H I G H S C H O O L 2 2 . 2 %
S O M E C O L L E G E 1 0 . 6 %
A S S O C I A T E ’ S D E G R E E 1 0 . 6 %
B A C H E L O R ’ S D E G R E E 2 2 . 5 %
G R A D U A T E D E G R E E + 1 1 . 8 %
G E O G R A P H YL A N D 2 5 8 . 7 S Q . M I .
W A T E R 5 1 . 3 S Q . M I .
D E M O G R A P H I C S
P O P U L A T I O N 4 5 5 , 0 9 0
M E D I A N A G E 3 5 . 6
P E R C A P I T A P E R S O N A L I N C O M E $ 5 8 , 3 0 8
E D U C A T I O N
S T A T I S T I C S
6
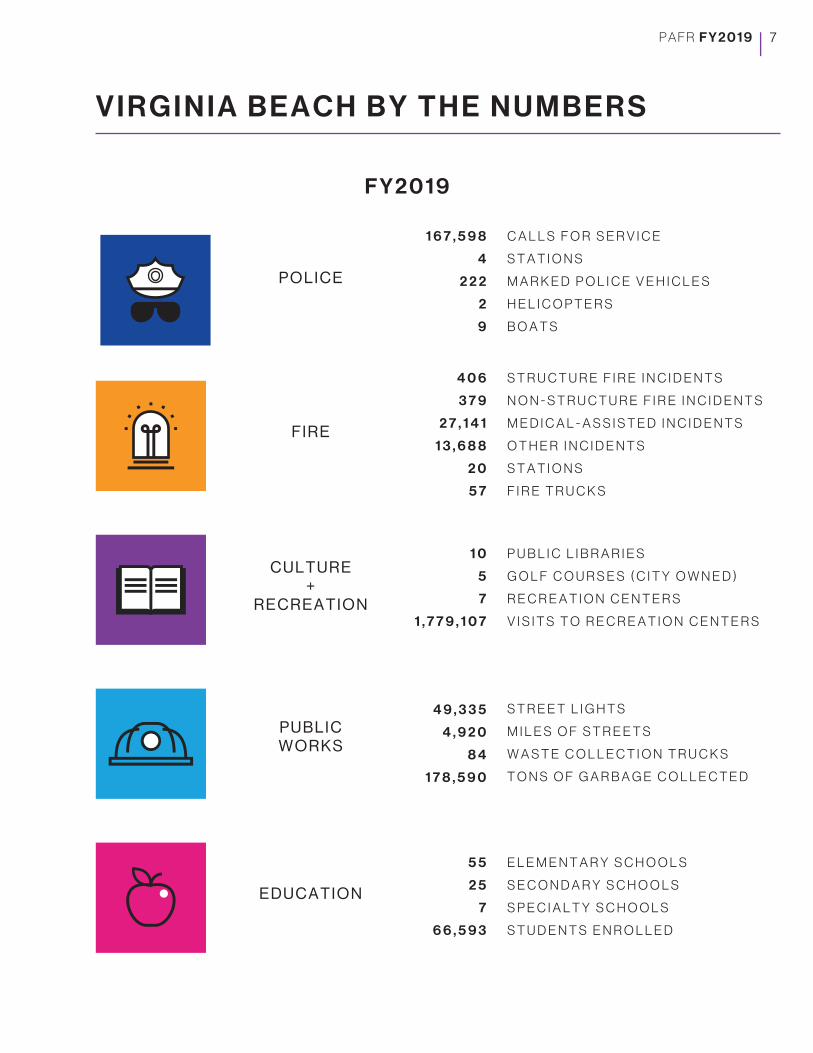
V I R G I N I A B E A C H B Y T H E N U M B E R S
P O L I C E
C A L L S F O R S E R V I C E
S T A T I O N S
M A R K E D P O L I C E V E H I C L E S
H E L I C O P T E R S
B O A T S
1 6 7 , 5 9 8
4
2 2 2
2
9
F I R E
S T R U C T U R E F I R E I N C I D E N T S
N O N - S T R U C T U R E F I R E I N C I D E N T S
M E D I C A L - A S S I S T E D I N C I D E N T S
O T H E R I N C I D E N T S
S T A T I O N S
F I R E T R U C K S
4 0 6
3 7 9
2 7 , 1 4 1
1 3 , 6 8 8
2 0
5 7
P U B L I C W O R K S
S T R E E T L I G H T S
M I L E S O F S T R E E T S
W A S T E C O L L E C T I O N T R U C K S
T O N S O F G A R B A G E C O L L E C T E D
4 9 , 3 3 5
4 , 9 2 0
8 4
1 7 8 , 5 9 0
E D U C A T I O N
E L E M E N T A R Y S C H O O L S
S E C O N D A R Y S C H O O L S
S P E C I A L T Y S C H O O L S
S T U D E N T S E N R O L L E D
5 5
2 5
7
6 6 , 5 9 3
C U L T U R E+
R E C R E A T I O N
P U B L I C L I B R A R I E S
G O L F C O U R S E S ( C I T Y O W N E D )
R E C R E A T I O N C E N T E R S
V I S I T S T O R E C R E A T I O N C E N T E R S
1 0
5
7
1 , 7 7 9 , 1 0 7
F Y 2 0 1 9
7
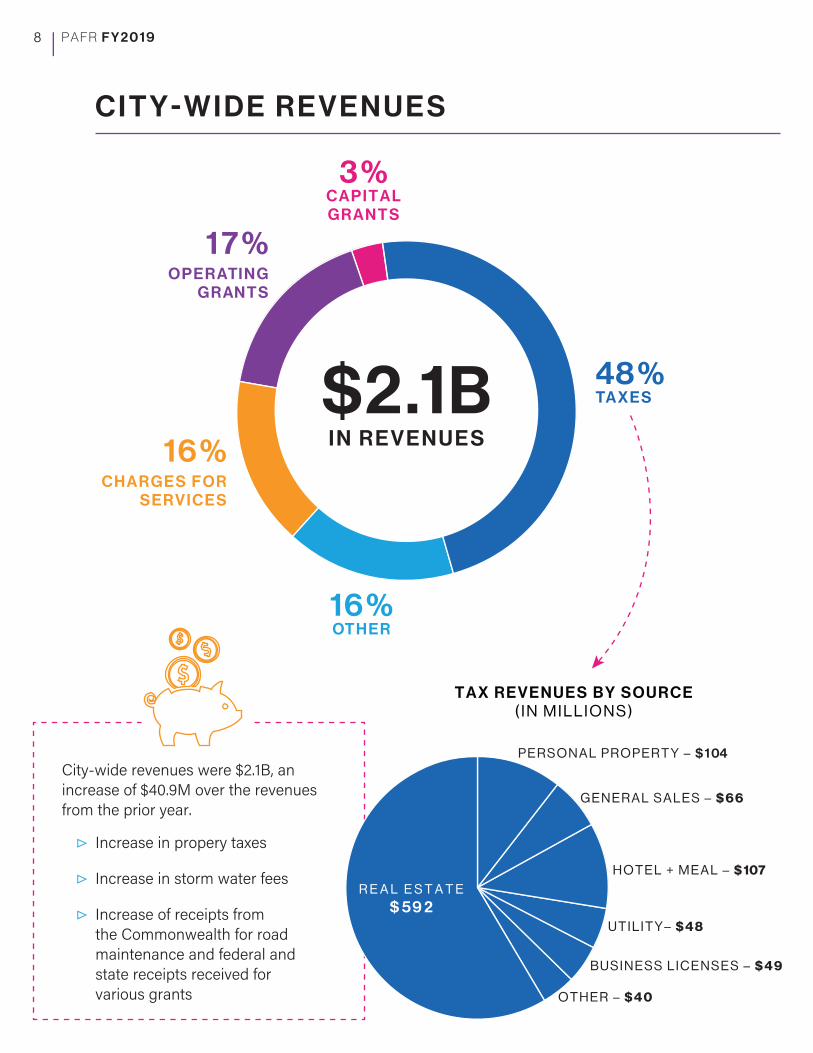
48 %TA X E S
16 % OT H E R
16 %C H A R G E S F O R
S E R V I C E S
1 7 %O P E R ATI N G
G R AN T S
3 %C A P I T A L G R A N T S
C I T Y - W I D E R E V E N U E S
$2.1BI N R E V E N U E S
T A X R E V E N U E S B Y S O U R C E ( I N M I L L I O N S )
O T H E R – $ 4 0
U T I L I T Y – $ 4 8
H O T E L + M E A L – $ 107
G E N E R A L S A L E S – $ 6 6
P E R S O N A L P R O P E R T Y – $ 1 04
R E A L E S T A T E$ 59 2
B U S I N E S S L I C E N S E S – $ 4 9
City-wide revenues were $2.1B, an increase of $40.9M over the revenues from the prior year.
Increase in propery taxes
Increase in storm water fees
Increase of receipts from the Commonwealth for road maintenance and federal and state receipts received for various grants
▷
▷
▷
8
C I T Y - W I D E R E V E N U E S & E X P E N S E S
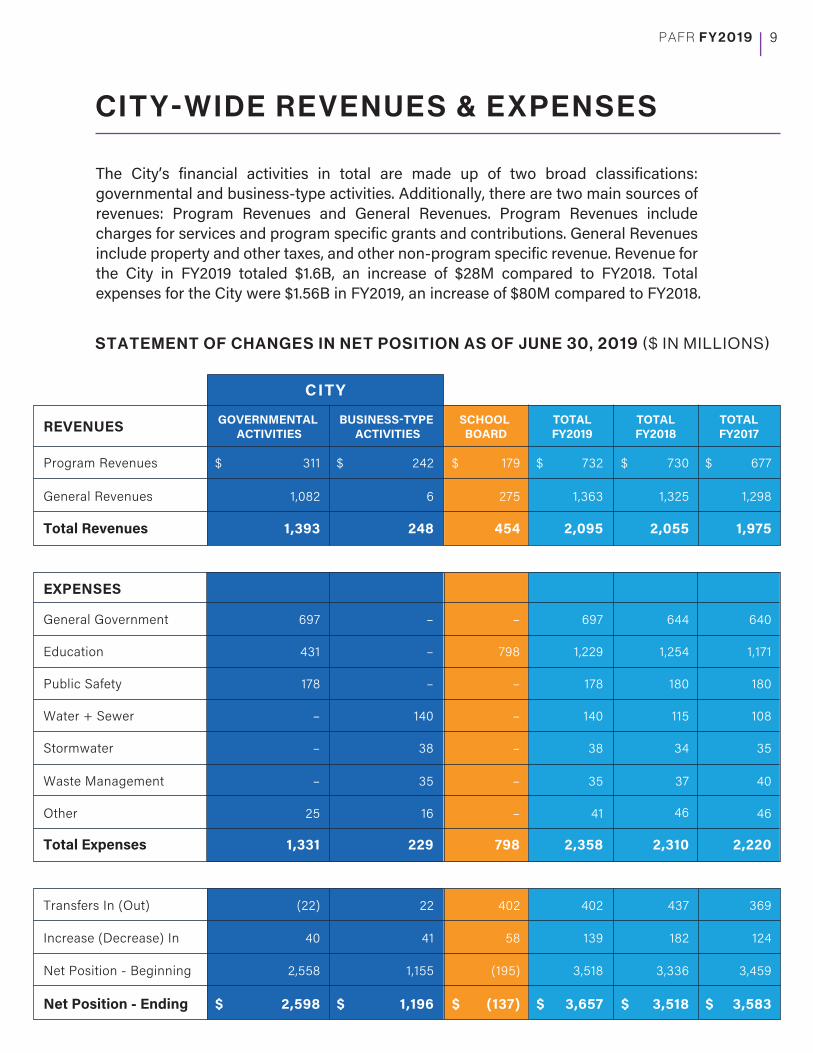
The City’s financial activities in total are made up of two broad classifications: governmental and business-type activities. Additionally, there are two main sources of revenues: Program Revenues and General Revenues. Program Revenues include charges for services and program specific grants and contributions. General Revenues include property and other taxes, and other non-program specific revenue. Revenue for the City in FY2019 totaled $1.6B, an increase of $28M compared to FY2018. Total expenses for the City were $1.56B in FY2019, an increase of $80M compared to FY2018.
CITY
SCHOOL BOARD
GOVERNMENTAL ACTIVITIES
BUSINESS-TYPE ACTIVITIES
TOTALFY2019
TOTALFY2018
TOTALFY2017
(22)
40 58
2,558
2,598
22
41
1,155
1,196
402
(195)
(137)
402
139
3,518
3,657
369
124
3,459
3,583
437
182
3,336
3,518
311 242 179 732 677
1,082 6 275 1,363 1,298
1,393 248 454 2,095 1,975
730
1,325
2,055
697 –
431
178 –
– –
– 38
– – 35
25 – 41
1,331
–
–
–
38
35
16
229
798
798
697
1,229
178
140
2,358
640
1,171
180
108
40
46
2,220
140
35–
644
1,254
180
115
2,310
34
37
46
Transfers In (Out)
Increase (Decrease) In
Net Position - Beginning
Net Position - Ending
General Revenues
Total Revenues
REVENUES
Program Revenues
EXPENSES
Education
Public Safety
Water + Sewer
Stormwater
Other
Total Expenses
General Government
Waste Management
$ $ $ $ $ $
$ $ $ $ $ $
STATEMENT OF CHANGES IN NET POSITION AS OF JUNE 30, 2019 ($ IN MILLIONS)
9
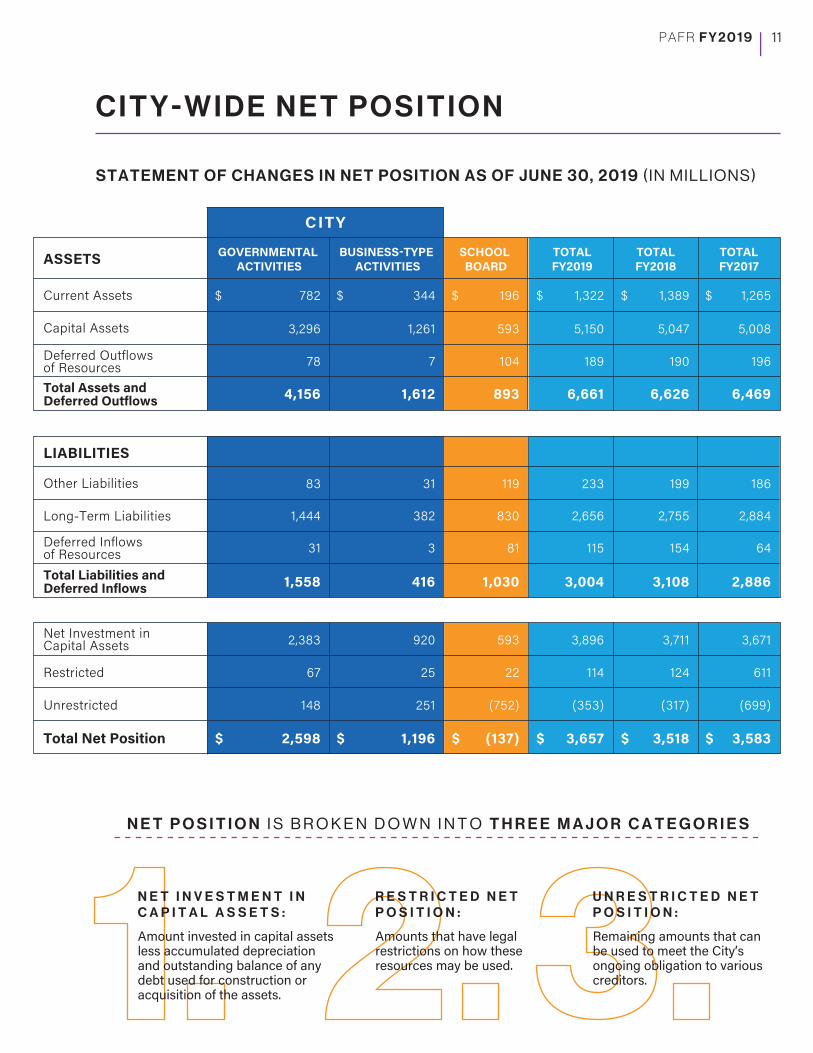
C I T Y - W I D E N E T P O S I T I O N
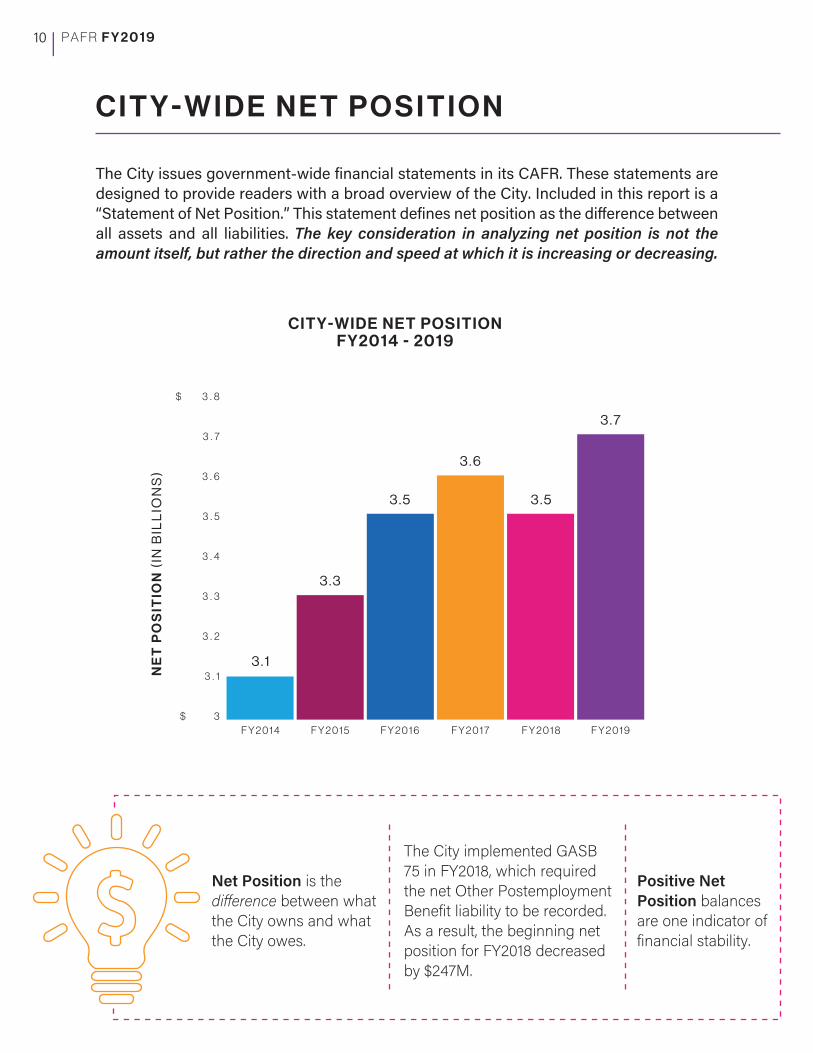
The City issues government-wide financial statements in its CAFR. These statements are designed to provide readers with a broad overview of the City. Included in this report is a “Statement of Net Position.” This statement defines net position as the di�erence betweenall assets and all liabilities. The key consideration in analyzing net position is not the amount itself, but rather the direction and speed at which it is increasing or decreasing.
CITY-WIDE NET POSITIONFY2014 - 2019
NE
T P
OS
ITIO
N (
IN B
ILL
ION
S)
3 . 1
3 . 3
3 . 5
3 . 6
3 . 5
$ 3 . 8
3 . 7
3 . 6
3 . 5
3 . 4
3 . 3
3 . 2
3 . 1
$ 3
3 . 7
F Y 2 0 1 4 F Y 2 0 1 9F Y 2 0 1 5 F Y 2 0 1 6 F Y 2 0 1 7 F Y 2 0 1 8
Net Position is the di�erence between what the City owns and what the City owes.
The City implemented GASB 75 in FY2018, which required the net Other Postemployment Benefit liability to be recorded. As a result, the beginning net position for FY2018 decreased by $247M.
Positive Net Position balances are one indicator of financial stability.
10
CITY
Restricted
Unrestricted
Total Net Position $ $ $ $ $ $
22
920
25
251
1,196
593
(752)
(137)
3,896
114
(353)
3,657
3,671
611
(699)
3,583
3,711
124
(317)
3,518
LIABILITIES
119
81
31
382
3
416
830
1,030
233
2,656
115
3,004
186
2,884
64
2,886
199
2,755
154
3,108
ASSETS
$ $ $ $ $ $
SCHOOL BOARD
GOVERNMENTAL ACTIVITIES
BUSINESS-TYPE ACTIVITIES
TOTALFY2019
TOTALFY2018
TOTALFY2017
344 196 1,322 1,265
1,261 593 5,150 5,008
1,612 893 6,661 6,469
1,389
5,047
6,626
Current Assets
Capital Assets
Deferred Outflows of ResourcesTotal Assets and Deferred Outflows
Other Liabilities
Long-Term Liabilities
Deferred Inflows of ResourcesTotal Liabilities and Deferred Inflows
Net Investment in Capital Assets 2,383
67
148
2,598
83
1,444
31
1,558
782
3,296
4,156
78 7 104 189 196190
C I T Y - W I D E N E T P O S I T I O N
$ $ $ $ $ $
STATEMENT OF CHANGES IN NET POSITION AS OF JUNE 30, 2019 (IN MILLIONS)
N E T I N V E S T M E N T I N C A P I T A L A S S E T S :
Amount invested in capital assets less accumulated depreciation and outstanding balance of any debt used for construction or acquisition of the assets.
R E S T R I C T E D N E T P O S I T I O N :
Amounts that have legal restrictions on how these resources may be used.
U N R E S T R I C T E D N E T P O S I T I O N :
Remaining amounts that can be used to meet the City’s ongoing obligation to various creditors.
N E T P O S I T I O N I S B R O K E N D O W N I N T O T H R E E M A J O R C A T E G O R I E S
11
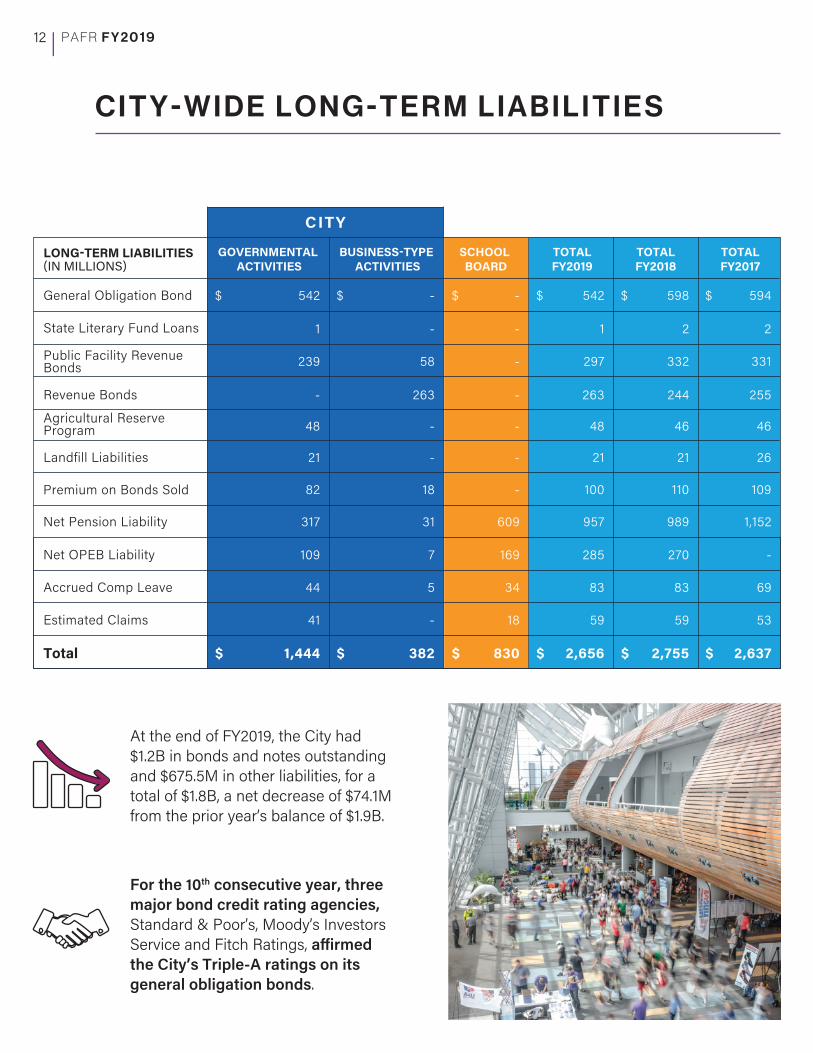
At the end of FY2019, the City had $1.2B in bonds and notes outstanding and $675.5M in other liabilities, for a total of $1.8B, a net decrease of $74.1M from the prior year’s balance of $1.9B.
C I T Y - W I D E L O N G - T E R M L I A B I L I T I E S
CITY
Accrued Comp Leave
Estimated Claims
Total $ $ $ $ $ $
34
7
5
-
382
169
18
830
285
83
59
2,656
-
69
53
2,637
270
83
59
2,755
-
609
-
18
31
-
21
100
957
26
109
1,152
21
110
989
$ $ $ $ $ $
SCHOOL BOARD
GOVERNMENTAL ACTIVITIES
BUSINESS-TYPE ACTIVITIES
TOTALFY2019
TOTALFY2018
TOTALFY2017
- - 542 594
- - 1 2
598
2
General Obligation Bond
State Literary Fund Loans
Public Facility Revenue Bonds
Premium on Bonds Sold
109
44
41
1,444
21
82
317
542
1
239 58 - 297 331332
LONG-TERM LIABILITIES(IN MILLIONS)
Revenue Bonds 263 - 263 255244-
48 - - 48 4646Agricultural ReserveProgram
Landfill Liabilities
Net OPEB Liability
Net Pension Liability
For the 10th consecutive year, three major bond credit rating agencies, Standard & Poor’s, Moody’s Investors Service and Fitch Ratings, a�irmed the City’s Triple-A ratings on its general obligation bonds.
12
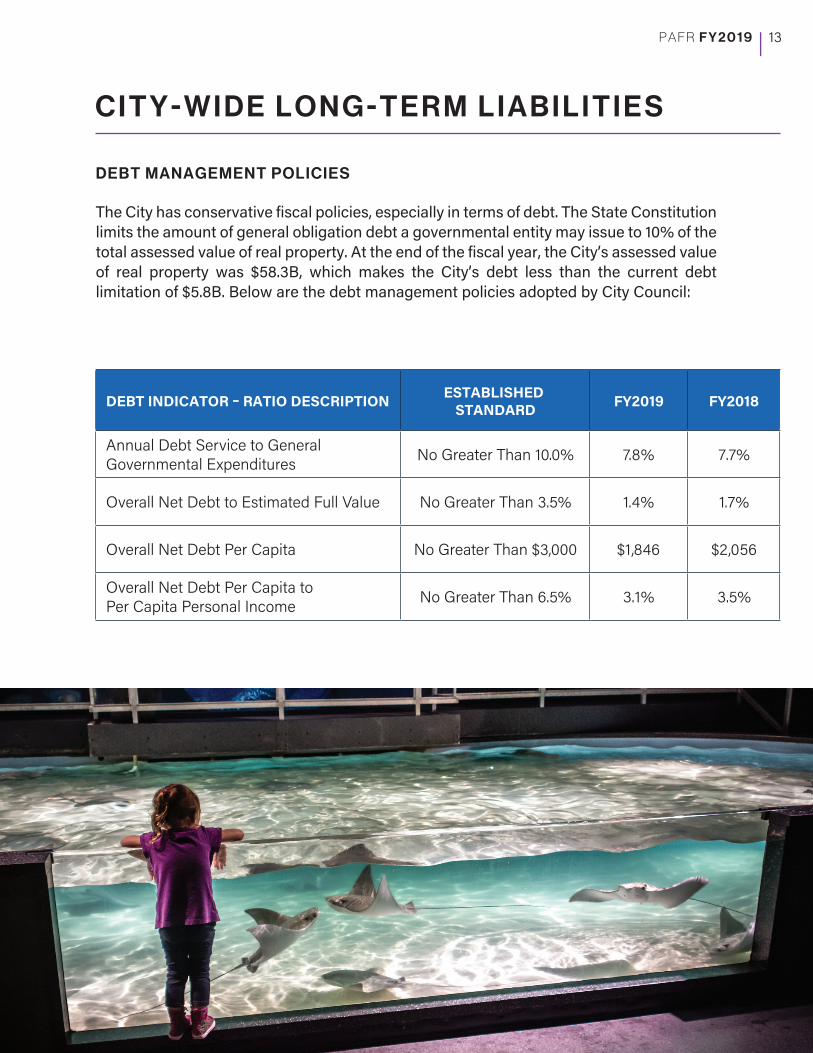
DEBT MANAGEMENT POLICIES
The City has conservative fiscal policies, especially in terms of debt. The State Constitution limits the amount of general obligation debt a governmental entity may issue to 10% of the total assessed value of real property. At the end of the fiscal year, the City’s assessed value of real property was $58.3B, which makes the City’s debt less than the current debt limitation of $5.8B. Below are the debt management policies adopted by City Council:
DEBT INDICATOR – RATIO DESCRIPTION ESTABLISHED STANDARD FY2019 FY2018
Annual Debt Service to General Governmental Expenditures No Greater Than 10.0% 7.8% 7.7%
Overall Net Debt to Estimated Full Value No Greater Than 3.5% 1.4% 1.7%
Overall Net Debt Per Capita No Greater Than $3,000 $1,846 $2,056
Overall Net Debt Per Capita to Per Capita Personal Income No Greater Than 6.5% 3.1% 3.5%
C I T Y - W I D E L O N G - T E R M L I A B I L I T I E S
13
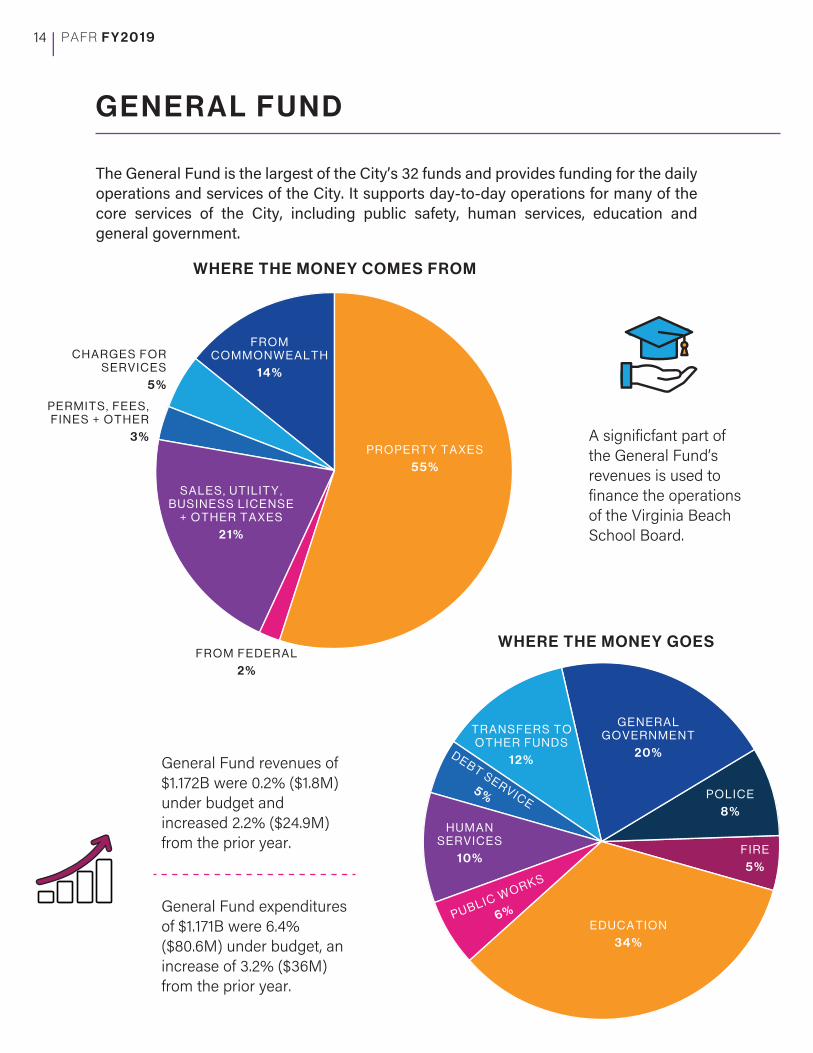
G E N E R A L F U N D
The General Fund is the largest of the City’s 32 funds and provides funding for the daily operations and services of the City. It supports day-to-day operations for many of the core services of the City, including public safety, human services, education and general government.
WHERE THE MONEY GOESF R O M F E D E R A L
2 %
C H A R G E S F O R S E R V I C E S
5 %
P E R M I T S , F E E S , F I N E S + O T H E R
3 %
WHERE THE MONEY COMES FROM
P R O P E R T Y T A X E S
5 5 %
S A L E S , U T I L I T Y , B U S I N E S S L I C E N S E
+ O T H E R T A X E S
2 1 %
F R O M C O M M O N W E A L T H
1 4 %
E D U C A T I O N
3 4 %
F I R E
5 %
P O L I C E
8 %
G E N E R A L G O V E R N M E N T
2 0 %D E B T S E R V I C E5%
H U M A N S E R V I C E S
1 0 %
P U B L I C W O R K S
6 %
T R A N S F E R S T O O T H E R F U N D S
1 2 %
A significfant part of the General Fund’s revenues is used to finance the operations of the Virginia Beach School Board.
General Fund revenues of $1.172B were 0.2% ($1.8M) under budget and increased 2.2% ($24.9M) from the prior year.
General Fund expenditures of $1.171B were 6.4% ($80.6M) under budget, an increase of 3.2% ($36M) from the prior year.
14
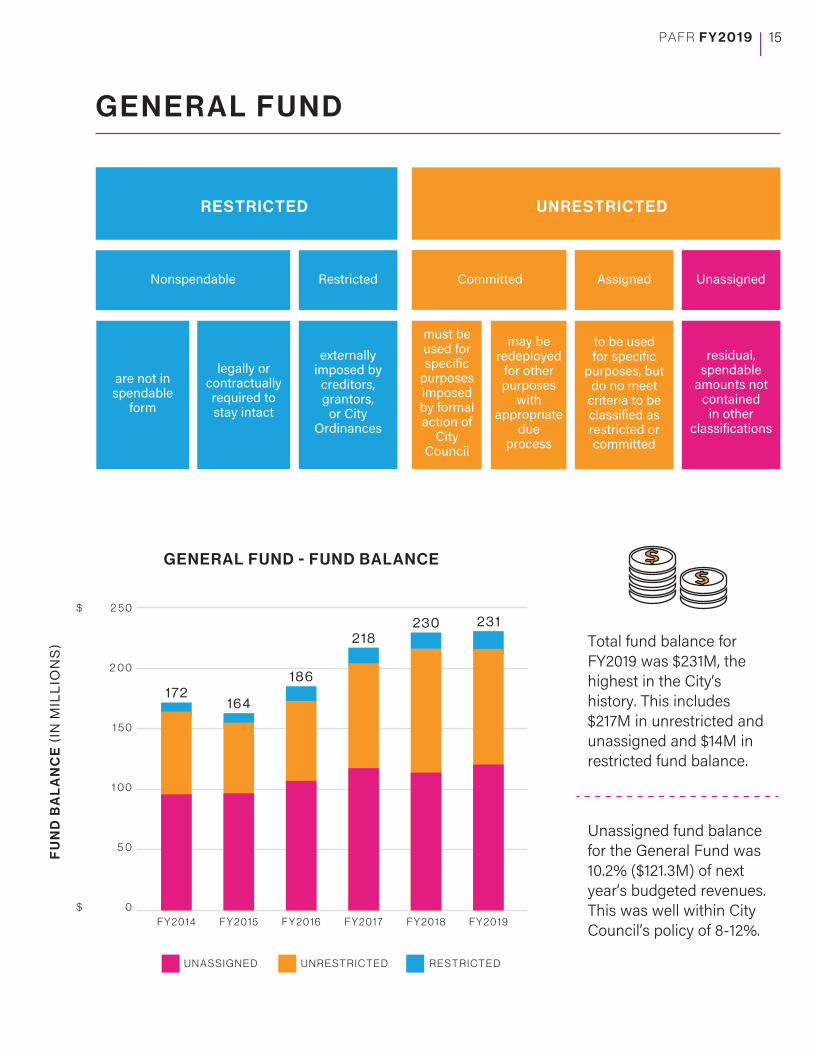
Total fund balance for FY2019 was $231M, the highest in the City’s history. This includes $217M in unrestricted and unassigned and $14M in restricted fund balance.
Restricted
RESTRICTED UNRESTRICTED
Nonspendable Committed
are not in spendable
form
legally or contractually required to stay intact
externally imposed by creditors, grantors,
or City Ordinances
must be used for specific
purposes imposed by formal action of
City Council
Assigned Unassigned
may be redeployed
for other purposes
with appropriate
due process
to be usedfor specific
purposes, but do no meet
criteria to be classified as restricted or committed
residual, spendable
amounts not containedin other
classifications
FU
ND
BA
LA
NC
E (
IN M
ILL
ION
S)
GENERAL FUND - FUND BALANCE
$ 2 5 0
2 0 0
1 5 0
1 0 0
5 0
$ 0
1 7 2
F Y 2 0 1 4
2 3 1
F Y 2 0 1 9
1 6 4
F Y 2 0 1 5
1 8 6
F Y 2 0 1 6
2 1 8
F Y 2 0 1 7
2 3 0
F Y 2 0 1 8
U N R E S T R I C T E D R E S T R I C T E DU N A S S I G N E D
Unassigned fund balance for the General Fund was 10.2% ($121.3M) of next year’s budgeted revenues. This was well within City Council’s policy of 8-12%.
G E N E R A L F U N D
15
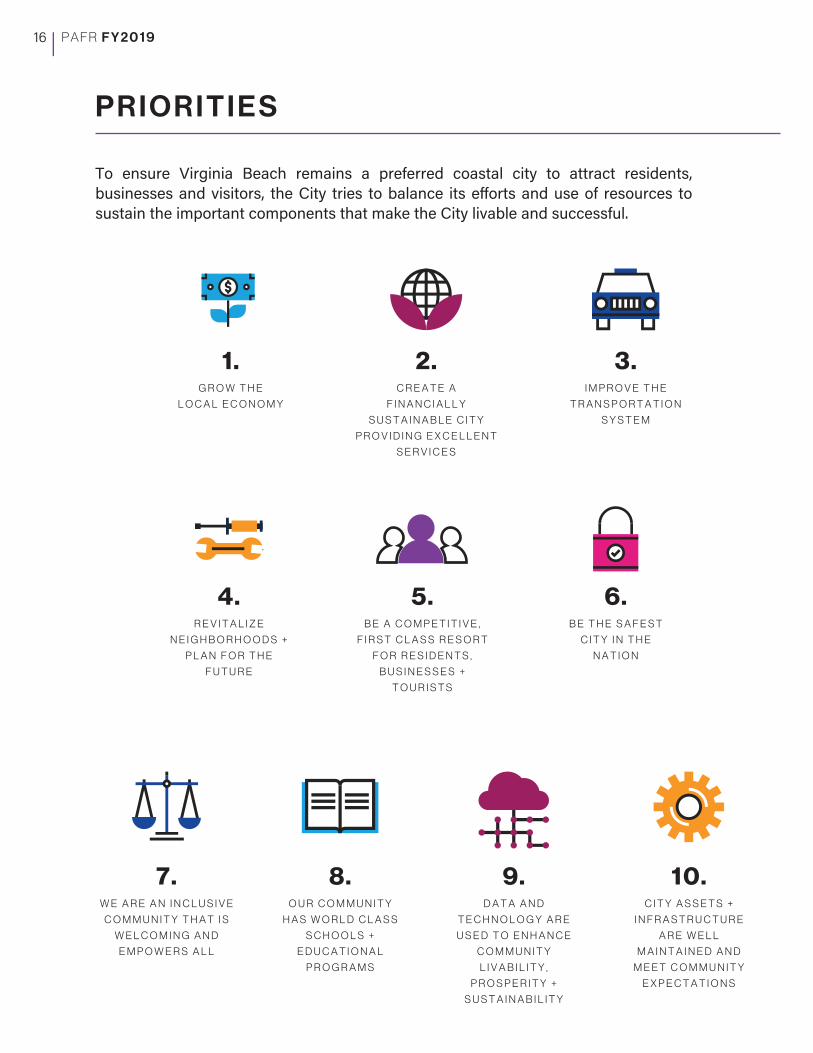
P R I O R I T I E S
To ensure Virginia Beach remains a preferred coastal city to attract residents, businesses and visitors, the City tries to balance its e�orts and use of resources to sustain the important components that make the City livable and successful.
1. G R O W T H E
L O C A L E C O N O M Y
3.I M P R O V E T H E
T R A N S P O R T A T I O N
S Y S T E M
4.R E V I T A L I Z E
N E I G H B O R H O O D S +
P L A N F O R T H E
F U T U R E
2.C R E A T E A
F I N A N C I A L L Y
S U S T A I N A B L E C I T Y
P R O V I D I N G E X C E L L E N T
S E R V I C E S
5.B E A C O M P E T I T I V E ,
F I R S T C L A S S R E S O R T
F O R R E S I D E N T S ,
B U S I N E S S E S +
T O U R I S T S
6. B E T H E S A F E S T
C I T Y I N T H E
N A T I O N
7.W E A R E A N I N C L U S I V E
C O M M U N I T Y T H A T I S
W E L C O M I N G A N D
E M P O W E R S A L L
8.O U R C O M M U N I T Y
H A S W O R L D C L A S S
S C H O O L S +
E D U C A T I O N A L
P R O G R A M S
9.D A T A A N D
T E C H N O L O G Y A R E
U S E D T O E N H A N C E
C O M M U N I T Y
L I V A B I L I T Y ,
P R O S P E R I T Y +
S U S T A I N A B I L I T Y
10.C I T Y A S S E T S +
I N F R A S T R U C T U R E
A R E W E L L
M A I N T A I N E D A N D
M E E T C O M M U N I T Y
E X P E C T A T I O N S
16
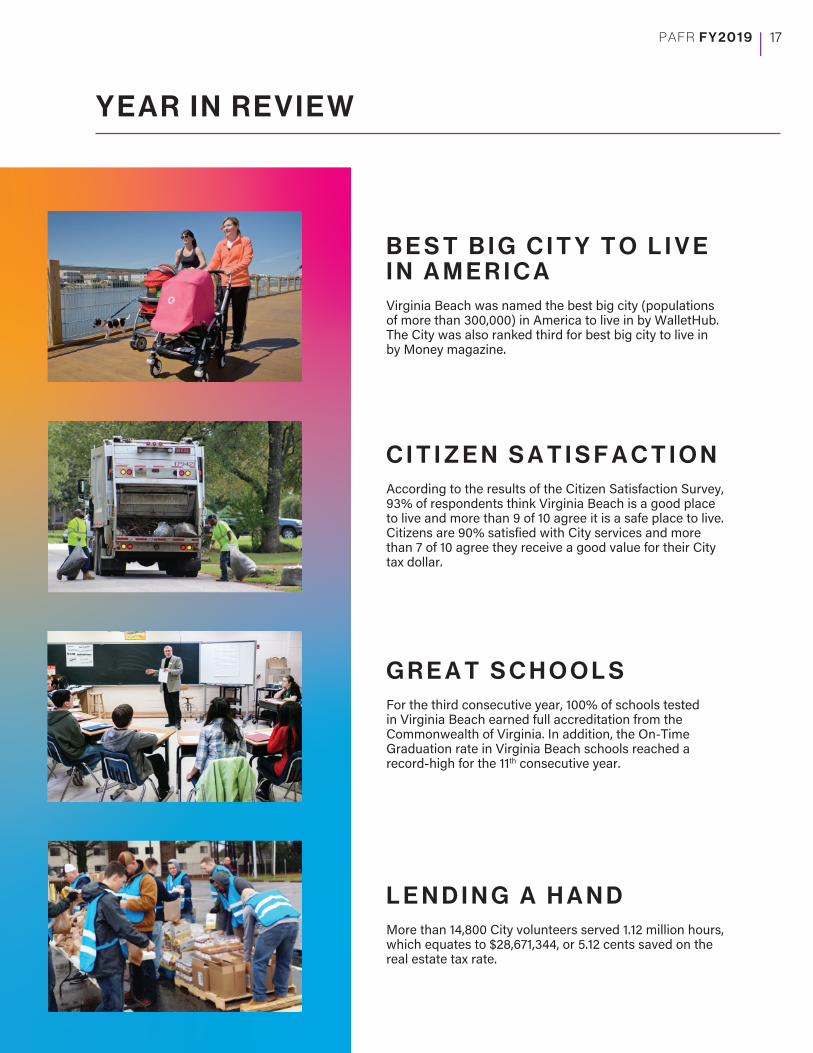
Y E A R I N R E V I E W
G R E A T S C H O O L SFor the third consecutive year, 100% of schools tested in Virginia Beach earned full accreditation from the Commonwealth of Virginia. In addition, the On-Time Graduation rate in Virginia Beach schools reached a record-high for the 11th consecutive year.
B E S T B I G C I T Y T O L I V E I N A M E R I C AVirginia Beach was named the best big city (populations of more than 300,000) in America to live in by WalletHub. The City was also ranked third for best big city to live in by Money magazine.
C I T I Z E N S A T I S F A C T I O NAccording to the results of the Citizen Satisfaction Survey, 93% of respondents think Virginia Beach is a good place to live and more than 9 of 10 agree it is a safe place to live. Citizens are 90% satisfied with City services and more than 7 of 10 agree they receive a good value for their City tax dollar.
L E N D I N G A H A N DMore than 14,800 City volunteers served 1.12 million hours, which equates to $28,671,344, or 5.12 cents saved on the real estate tax rate.
17
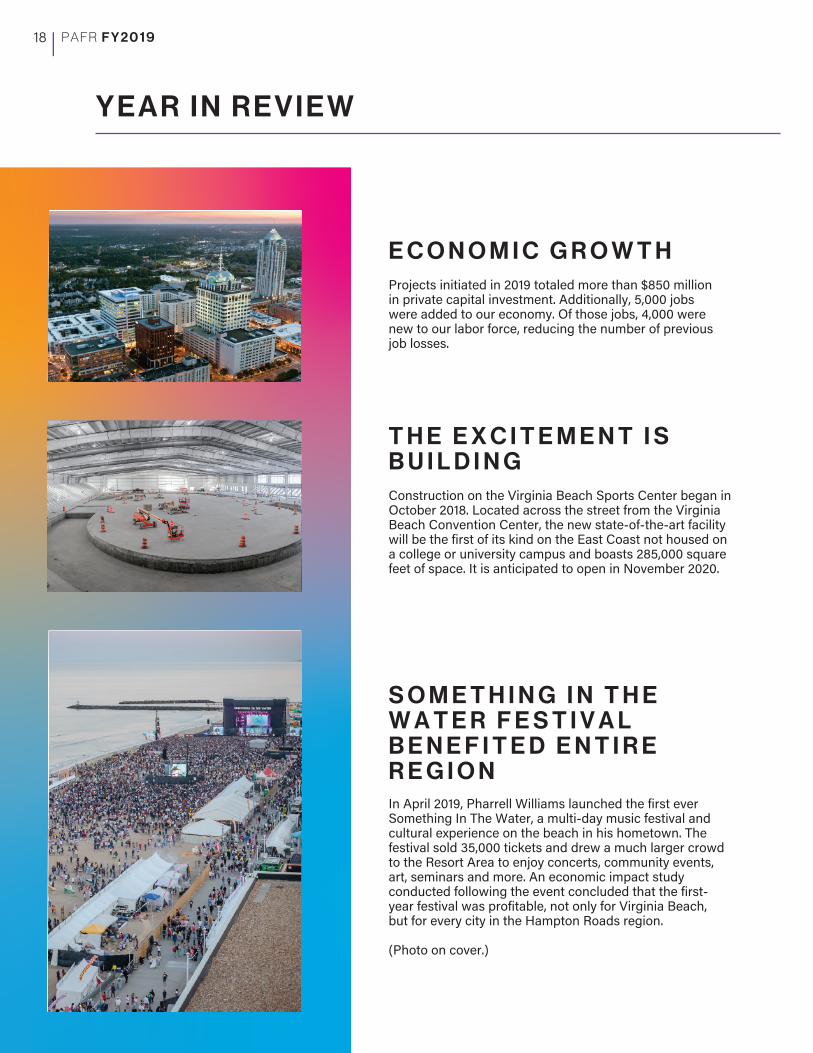
Y E A R I N R E V I E W
E C O N O M I C G R O W T HProjects initiated in 2019 totaled more than $850 million in private capital investment. Additionally, 5,000 jobs were added to our economy. Of those jobs, 4,000 were new to our labor force, reducing the number of previous job losses.
S O M E T H I N G I N T H E W A T E R F E S T I V A L B E N E F I T E D E N T I R E R E G I O NIn April 2019, Pharrell Williams launched the first ever Something In The Water, a multi-day music festival and cultural experience on the beach in his hometown. The festival sold 35,000 tickets and drew a much larger crowd to the Resort Area to enjoy concerts, community events, art, seminars and more. An economic impact study conducted following the event concluded that the first-year festival was profitable, not only for Virginia Beach, but for every city in the Hampton Roads region.
(Photo on cover.)
T H E E X C I T E M E N T I S B U I L D I N GConstruction on the Virginia Beach Sports Center began in October 2018. Located across the street from the Virginia Beach Convention Center, the new state-of-the-art facility will be the first of its kind on the East Coast not housed on a college or university campus and boasts 285,000 square feet of space. It is anticipated to open in November 2020.
18

# V B S T R O N G # L O V E F O R V B
The City of Virginia Beach honors and remembers those who lost their lives and those who were injured on May 31, 2019 in a mass shooting in Building 2 on the City’s Municipal Center campus.
“You never know how strong you are until being strong is the only choice you have.” ~Bob Marley
LaQuita C. Brown • Ryan Keith Cox • Tara Welch Gallagher
Mary Louise “Mary Lou” Crutsinger Gayle • Alexander Mikhail Gusev
Joshua O. Hardy • Michelle “Missy” Langer • Richard “Rich” Nettleton
Katherine Anne Marie Lusich-Nixon • Christopher Kelly Rapp
Herbert Ray “Bert” Snell ing, Jr. • Robert Thomas “Bobby” Wil l iams
19
C I T Y OF V I R GI N I A B E A C H , V I R G I N I A
P o p u l a r A n n u a l F i n a n c i a l R e p o r t f o r F i s c a l Y e a r E n d i n g J u n e 3 0 , 2 0 1 9