polyolefins overview - fpa · nick vafiadis, senior director – global polyolefins and plastics...
TRANSCRIPT

Nick Vafiadis, Senior Director – Global Polyolefins and Plastics
1(281)752-3206
FPA: September 2013
Polyolefins Overview
© 2012, IHS Inc. No portion of this presentation may be reproduced, reused, or otherwise distributed in any form without prior written consent.
•Ethylene
•Polyethylene
•Propylene
•Polypropylene
2
Agenda
© 2012, IHS Inc. No portion of this presentation may be reproduced, reused, or otherwise distributed in any form without prior written consent.
•Feedstock Cost Advantage
− Relationship of crude/natural gas …. & coal
• Shale based NGL’s in North America
• Abundant feedstock in Middle East
• Coal in China
•Proximity to Derivative Demand− Adding capacity to supply domestic demand (China)
3
Ethylene Capacity Drivers
© 2012, IHS Inc. No portion of this presentation may be reproduced, reused, or otherwise distributed in any form without prior written consent.
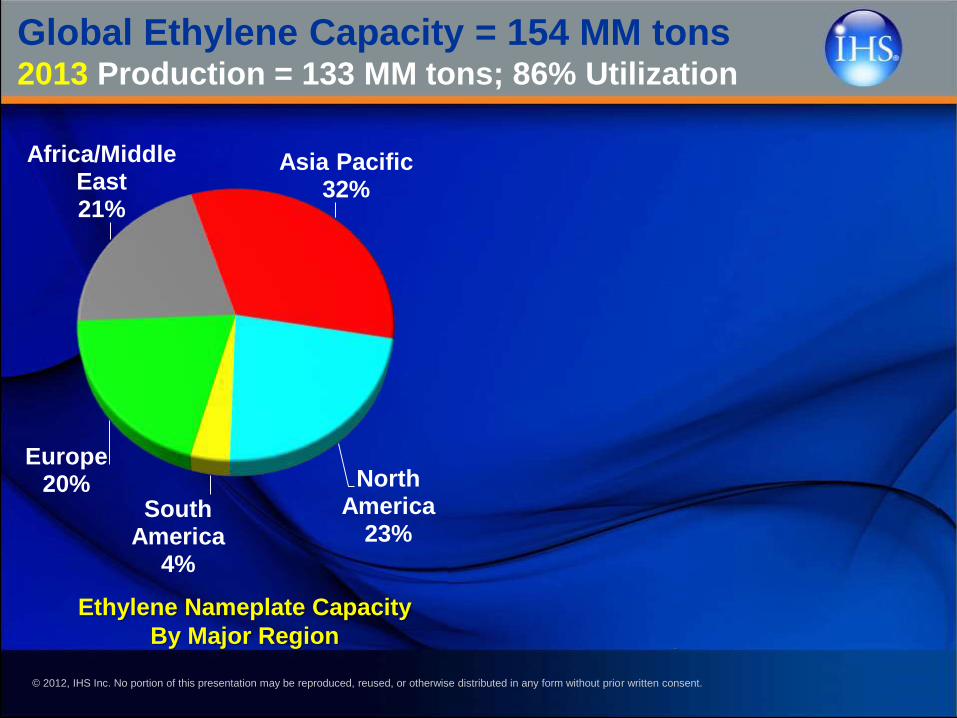
Ethylene Nameplate Capacity
By Major Region
Ethylene Production
By Feedstock
Global Ethylene Capacity = 154 MM tons2013 Production = 133 MM tons; 86% Utilization
North America
23%South
America4%
Europe20%
Africa/Middle East21%
Asia Pacific32%
Ethane36%
Propane9%
Butane4%
Naphtha47%
Gas Oil3%
Coal to
Olefins0.2%
Others1%
© 2012, IHS Inc. No portion of this presentation may be reproduced, reused, or otherwise distributed in any form without prior written consent.
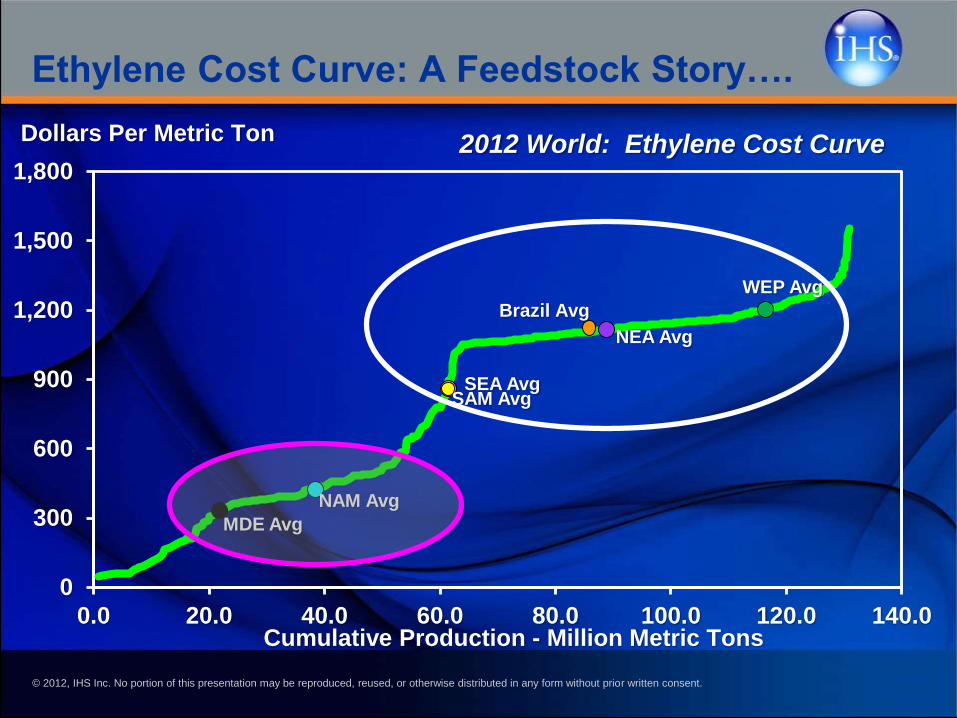
Ethylene Cost Curve: A Feedstock Story….
MDE Avg
NAM Avg
NEA Avg
SAM AvgSEA Avg
WEP Avg
0
300
600
900
1,200
1,500
1,800
0.0 20.0 40.0 60.0 80.0 100.0 120.0 140.0
2012 World: Ethylene Cost Curve
Cumulative Production - Million Metric Tons
Dollars Per Metric Ton
Brazil Avg
© 2012, IHS Inc. No portion of this presentation may be reproduced, reused, or otherwise distributed in any form without prior written consent. 6
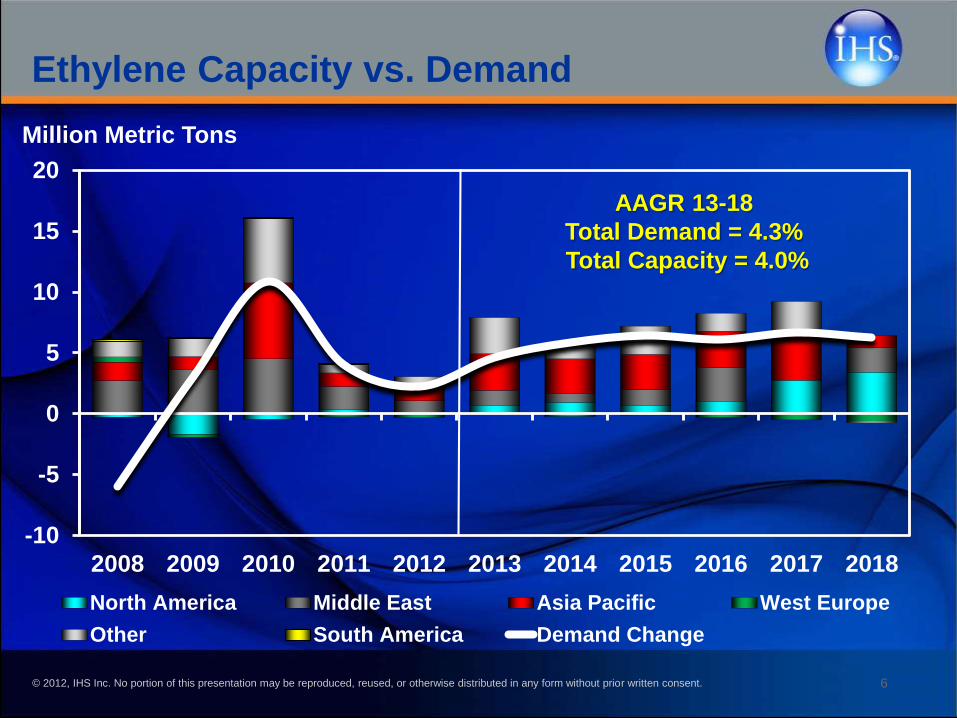
Ethylene Capacity vs. Demand
-10
-5
0
5
10
15
20
2008 2009 2010 2011 2012 2013 2014 2015 2016 2017 2018
Million Metric Tons
North America Middle East Asia Pacific West Europe
Other South America Demand Change
AAGR 13-18
Total Demand = 4.3%
Total Capacity = 4.0%
© 2012, IHS Inc. No portion of this presentation may be reproduced, reused, or otherwise distributed in any form without prior written consent.
0%
20%
40%
60%
80%
100%
120%
0
3
6
9
12
15
18
00 01 02 03 04 05 06 07 08 09 10 11 12 13 14 15 16 17 18
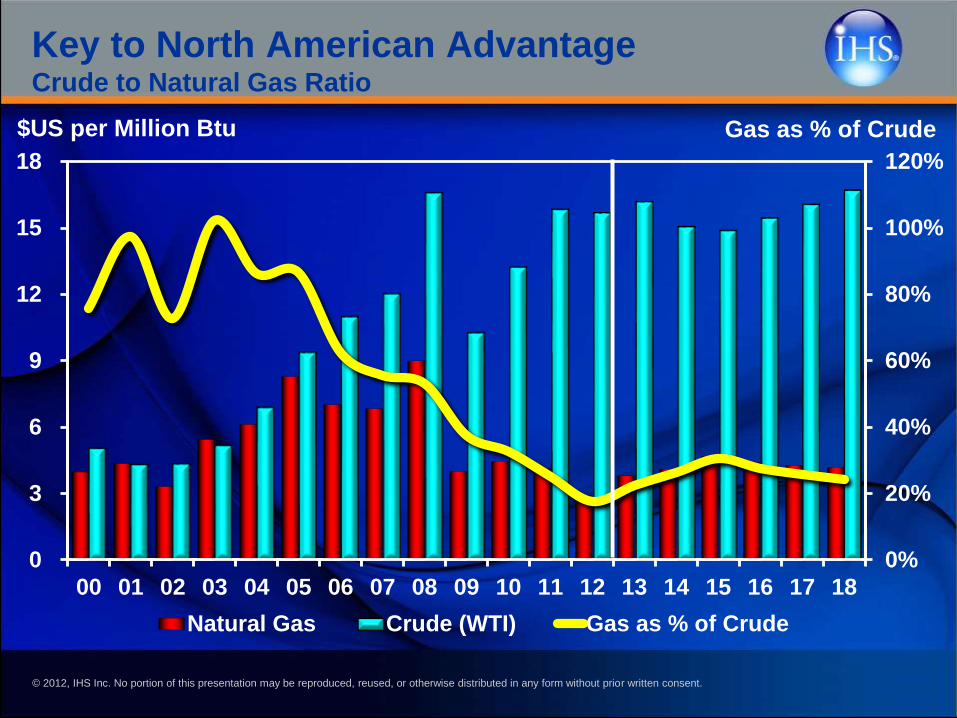
Natural Gas Crude (WTI) Gas as % of Crude
Gas as % of Crude $US per Million Btu
Key to North American AdvantageCrude to Natural Gas Ratio
© 2012, IHS Inc. No portion of this presentation may be reproduced, reused, or otherwise distributed in any form without prior written consent.
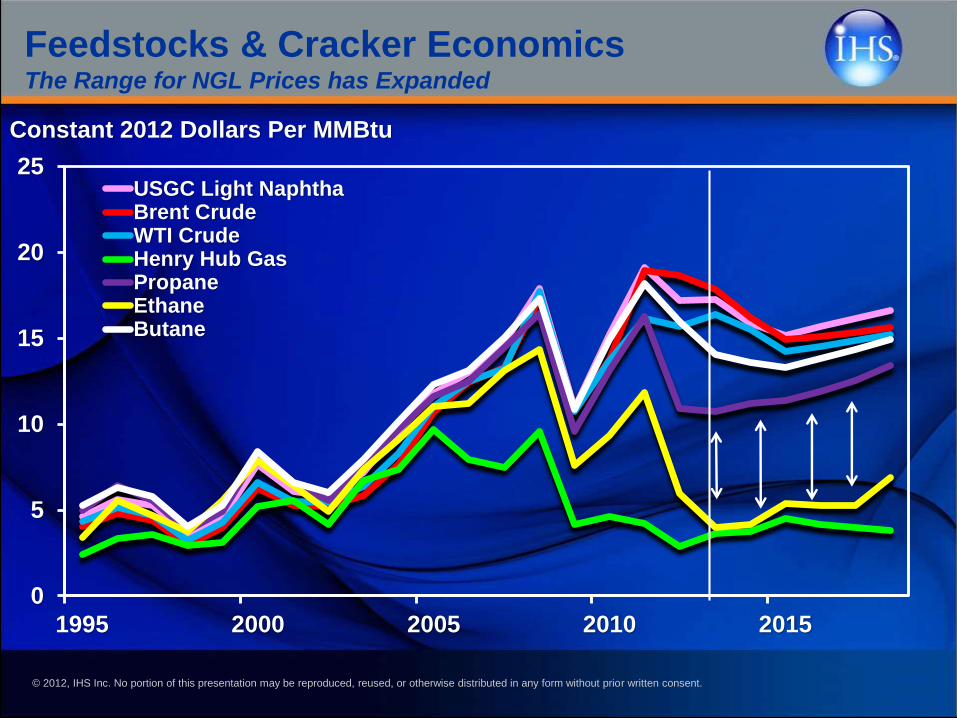
Feedstocks & Cracker Economics The Range for NGL Prices has Expanded
0
5
10
15
20
25
1995 2000 2005 2010 2015
USGC Light NaphthaBrent CrudeWTI CrudeHenry Hub GasPropaneEthaneButane
Constant 2012 Dollars Per MMBtu
© 2012, IHS Inc. No portion of this presentation may be reproduced, reused, or otherwise distributed in any form without prior written consent.
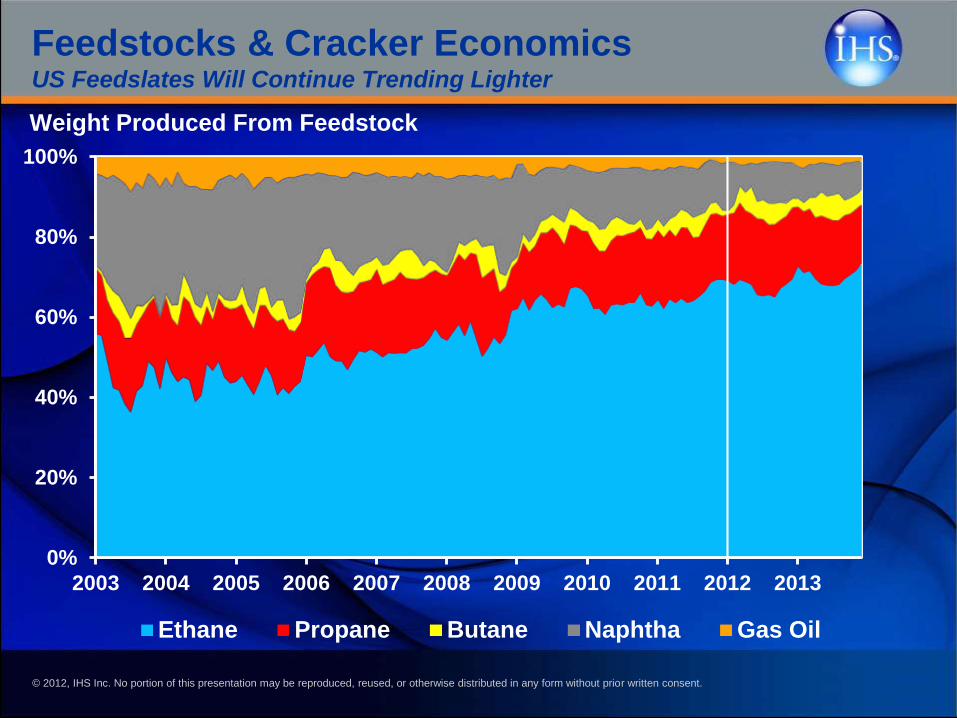
Feedstocks & Cracker EconomicsUS Feedslates Will Continue Trending Lighter
0%
20%
40%
60%
80%
100%
2003 2004 2005 2006 2007 2008 2009 2010 2011 2012 2013
Ethane Propane Butane Naphtha Gas Oil
Weight Produced From Feedstock
© 2012, IHS Inc. No portion of this presentation may be reproduced, reused, or otherwise distributed in any form without prior written consent.
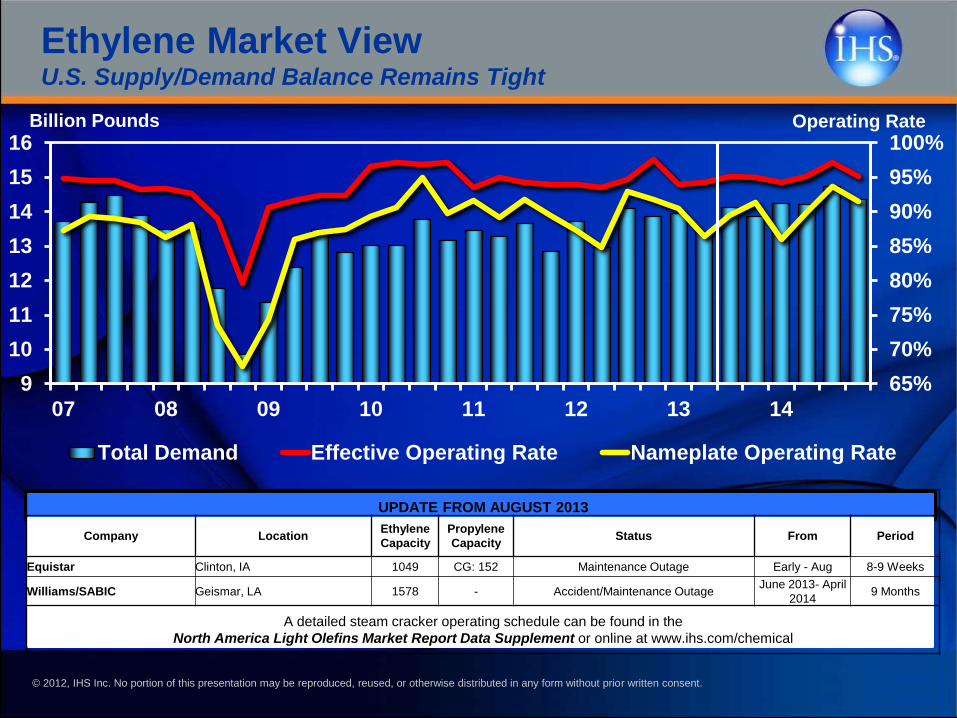
65%
70%
75%
80%
85%
90%
95%
100%
9
10
11
12
13
14
15
16
07 08 09 10 11 12 13 14
Operating RateBillion Pounds
Total Demand Effective Operating Rate Nameplate Operating Rate
Ethylene Market ViewU.S. Supply/Demand Balance Remains Tight
UPDATE FROM AUGUST 2013
Company LocationEthylene
Capacity
Propylene
CapacityStatus From Period
Equistar Clinton, IA 1049 CG: 152 Maintenance Outage Early - Aug 8-9 Weeks
Williams/SABIC Geismar, LA 1578 - Accident/Maintenance OutageJune 2013- April
20149 Months
A detailed steam cracker operating schedule can be found in the
North America Light Olefins Market Report Data Supplement or online at www.ihs.com/chemical
© 2012, IHS Inc. No portion of this presentation may be reproduced, reused, or otherwise distributed in any form without prior written consent.11
0
220
441
661
882
1102
1323
1543
0
10
20
30
40
50
60
70
80
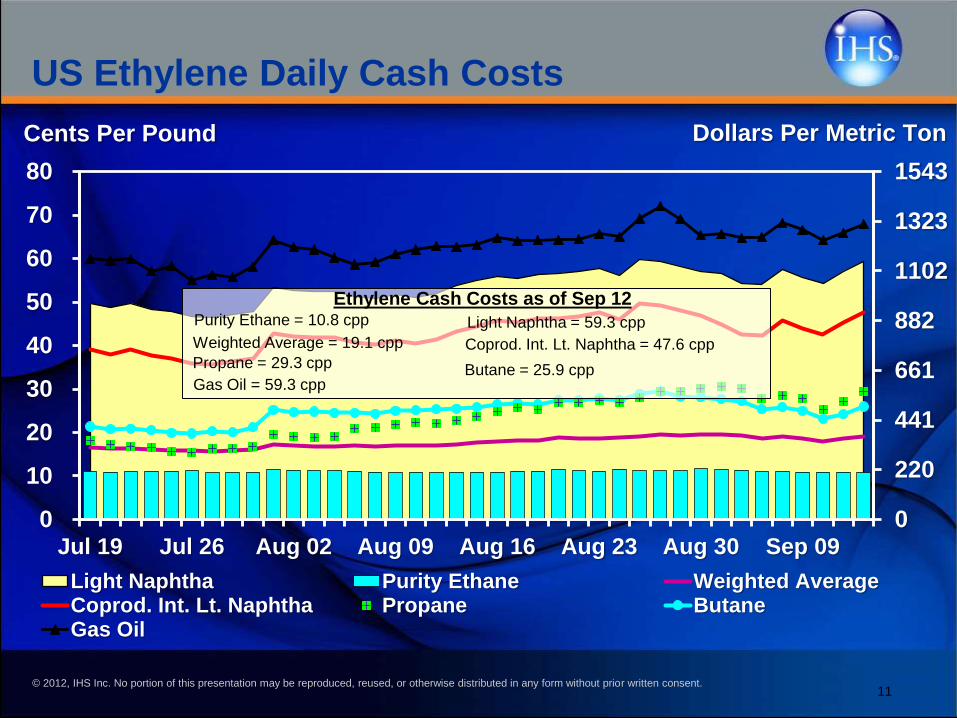
Jul 19 Jul 26 Aug 02 Aug 09 Aug 16 Aug 23 Aug 30 Sep 09
Light Naphtha Purity Ethane Weighted AverageCoprod. Int. Lt. Naphtha Propane ButaneGas Oil
Dollars Per Metric Ton
Ethylene Cash Costs as of Sep 12 Purity Ethane = 10.8 cpp
Weighted Average = 19.1 cpp
Propane = 29.3 cpp
Light Naphtha = 59.3 cpp
Coprod. Int. Lt. Naphtha = 47.6 cpp
Butane = 25.9 cppGas Oil = 59.3 cpp
Cents Per Pound
US Ethylene Daily Cash Costs
© 2012, IHS Inc. No portion of this presentation may be reproduced, reused, or otherwise distributed in any form without prior written consent.
0
10
20
30
40
50
60
70
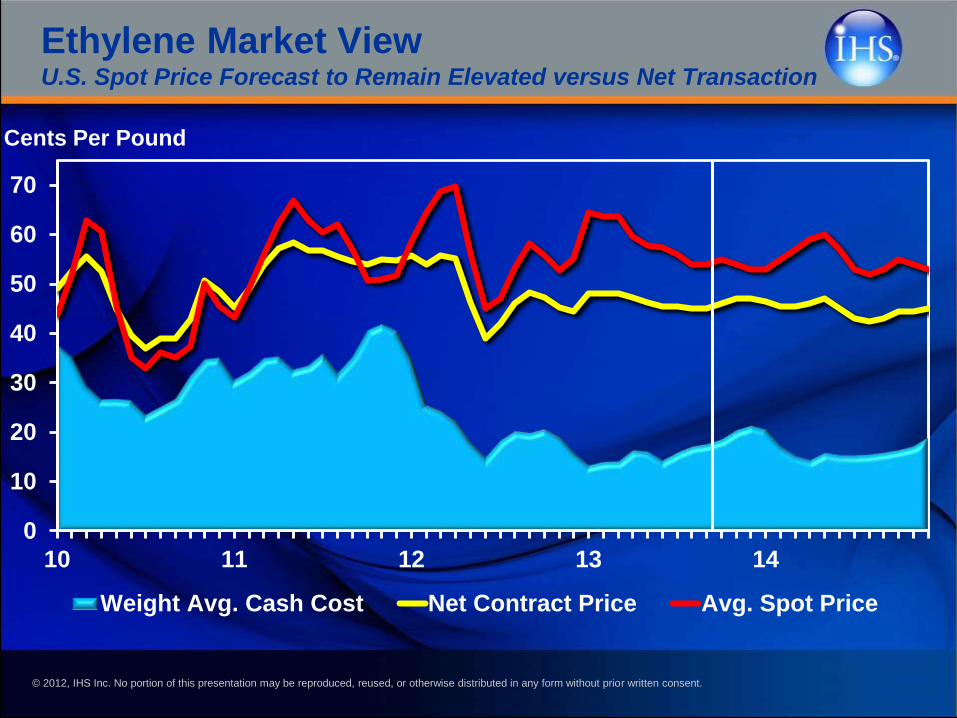
10 11 12 13 14
Cents Per Pound
Weight Avg. Cash Cost Net Contract Price Avg. Spot Price
Ethylene Market ViewU.S. Spot Price Forecast to Remain Elevated versus Net Transaction
© 2012, IHS Inc. No portion of this presentation may be reproduced, reused, or otherwise distributed in any form without prior written consent.
-200
0
200
400
600
800
1,000
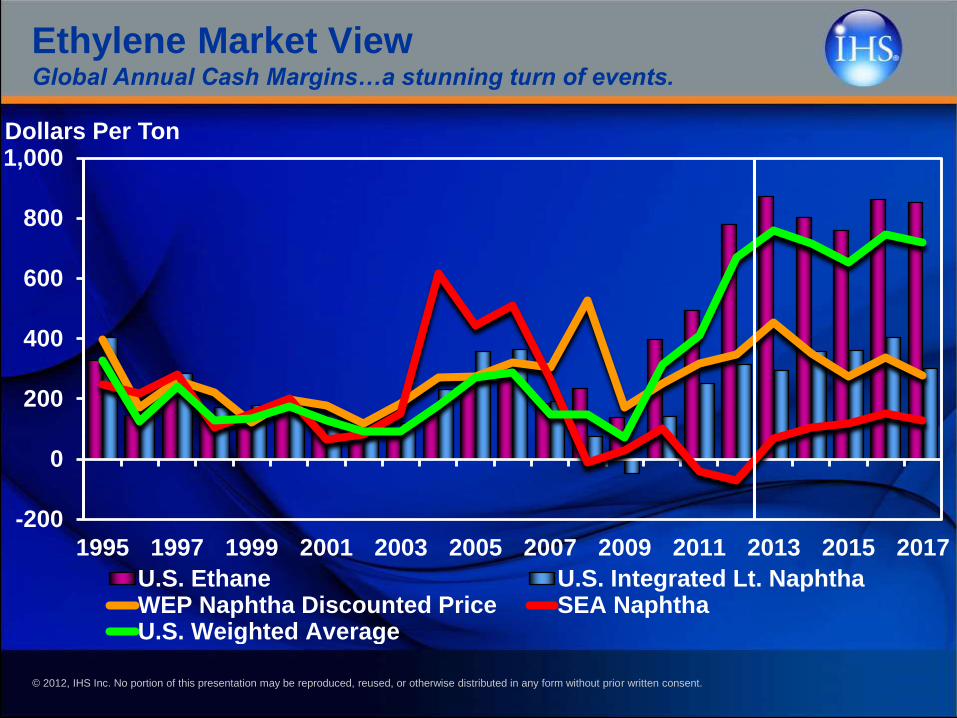
1995 1997 1999 2001 2003 2005 2007 2009 2011 2013 2015 2017
Dollars Per Ton
U.S. Ethane U.S. Integrated Lt. NaphthaWEP Naphtha Discounted Price SEA NaphthaU.S. Weighted Average
Ethylene Market ViewGlobal Annual Cash Margins…a stunning turn of events.
© 2012, IHS Inc. No portion of this presentation may be reproduced, reused, or otherwise distributed in any form without prior written consent.
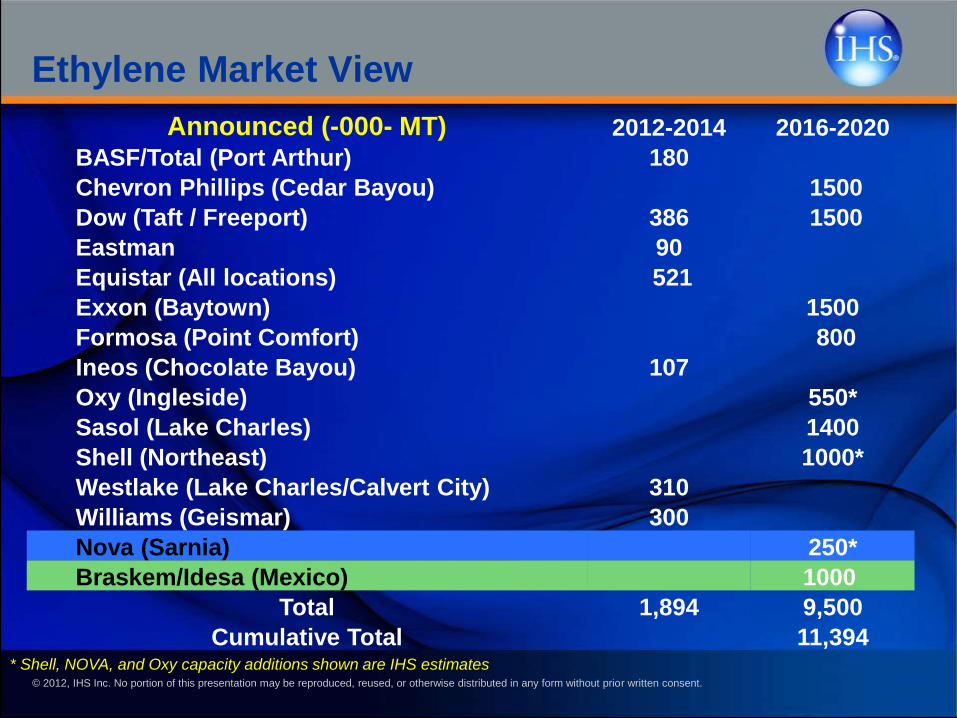
Announced (-000- MT) 2012-2014 2016-2020
BASF/Total (Port Arthur) 180
Chevron Phillips (Cedar Bayou) 1500
Dow (Taft / Freeport) 386 1500
Eastman 90
Equistar (All locations) 521
Exxon (Baytown) 1500
Formosa (Point Comfort) 800
Ineos (Chocolate Bayou) 107
Oxy (Ingleside) 550*
Sasol (Lake Charles) 1400
Shell (Northeast) 1000*
Westlake (Lake Charles/Calvert City) 310
Williams (Geismar) 300
Nova (Sarnia) 250*
Braskem/Idesa (Mexico) 1000
Total 1,894 9,500
Cumulative Total 11,394* Shell, NOVA, and Oxy capacity additions shown are IHS estimates
Ethylene Market View
© 2012, IHS Inc. No portion of this presentation may be reproduced, reused, or otherwise distributed in any form without prior written consent.
Polyethylene
15
© 2012, IHS Inc. No portion of this presentation may be reproduced, reused, or otherwise distributed in any form without prior written consent.
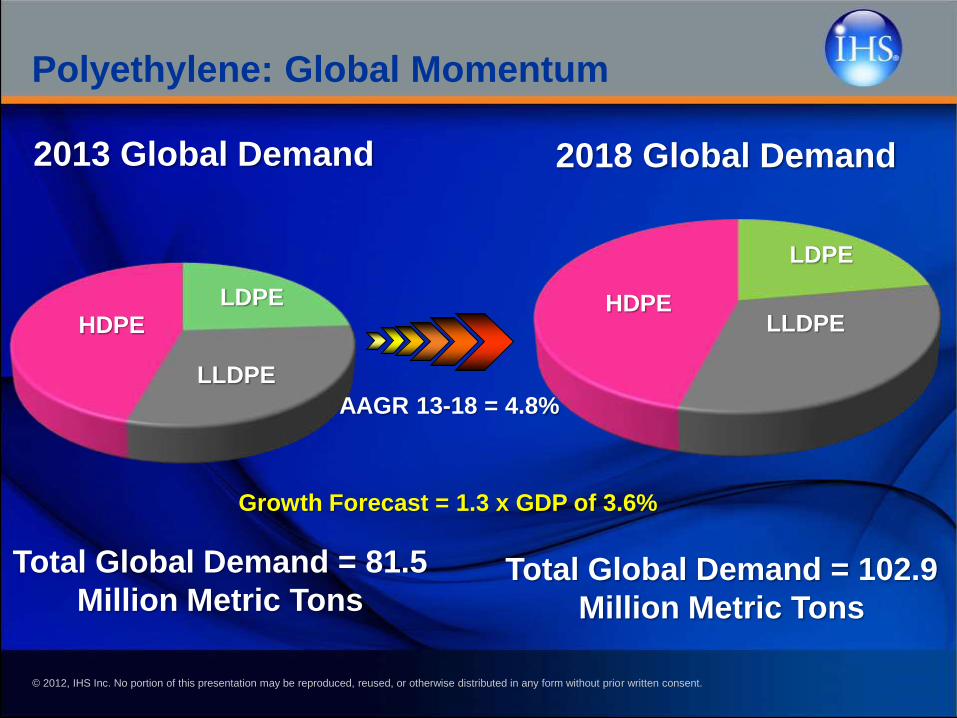
Polyethylene: Global Momentum
LDPEHDPE
LLDPE
Total Global Demand = 81.5
Million Metric Tons
2013 Global Demand
LDPE
LLDPEHDPE
Total Global Demand = 102.9
Million Metric Tons
2018 Global Demand
AAGR 13-18 = 4.8%
Growth Forecast = 1.3 x GDP of 3.6%
© 2012, IHS Inc. No portion of this presentation may be reproduced, reused, or otherwise distributed in any form without prior written consent.
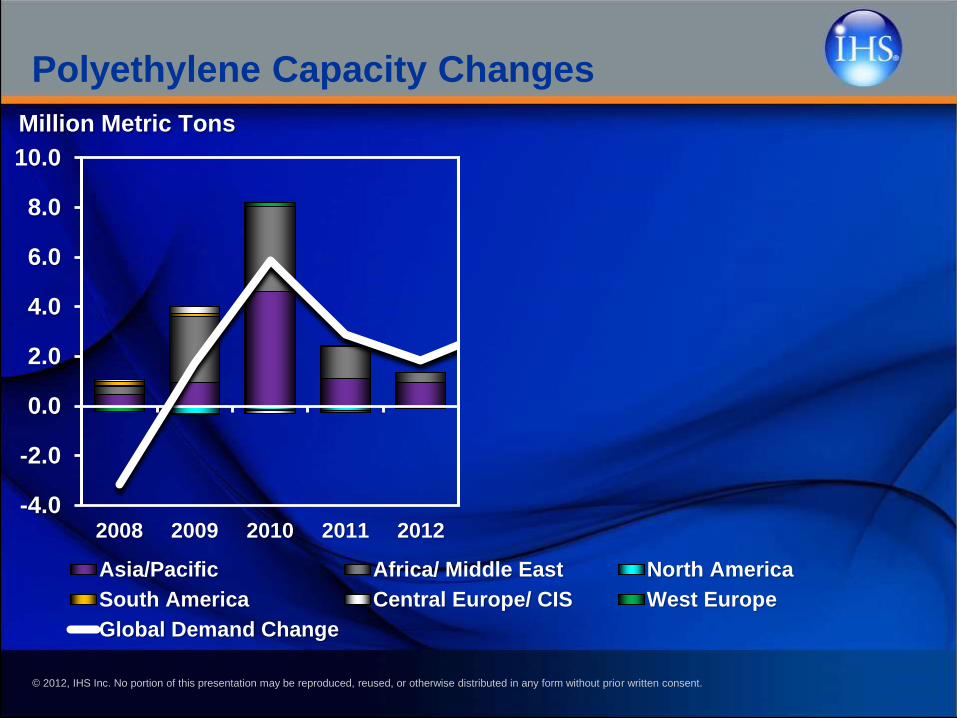
-4.0
-2.0
0.0
2.0
4.0
6.0
8.0
10.0
2008 2009 2010 2011 2012 2013 2014 2015 2016 2017 2018
Asia/Pacific Africa/ Middle East North America
South America Central Europe/ CIS West Europe
Global Demand Change
Million Metric Tons
2013 – 2018 AAGR
Total Capacity = 4.6%
Total Demand = 4.8%
Polyethylene Capacity Changes
© 2012, IHS Inc. No portion of this presentation may be reproduced, reused, or otherwise distributed in any form without prior written consent.
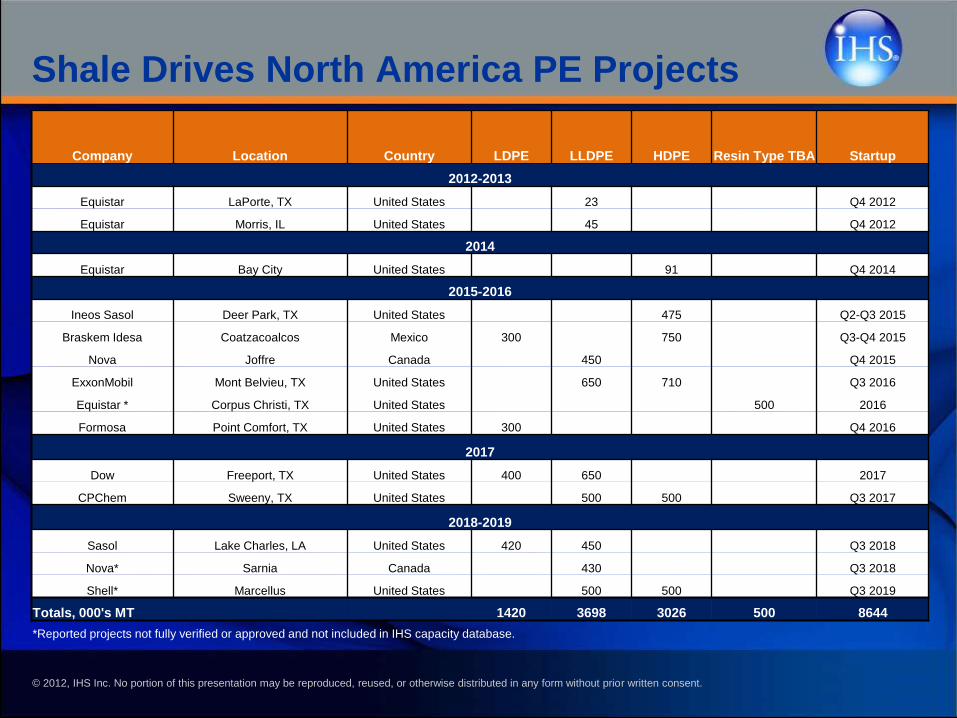
Shale Drives North America PE Projects
Company Location Country LDPE LLDPE HDPE Resin Type TBA Startup
2012-2013
Equistar LaPorte, TX United States 23 Q4 2012
Equistar Morris, IL United States 45 Q4 2012
2014
Equistar Bay City United States 91 Q4 2014
2015-2016
Ineos Sasol Deer Park, TX United States 475 Q2-Q3 2015
Braskem Idesa Coatzacoalcos Mexico 300 750 Q3-Q4 2015
Nova Joffre Canada 450 Q4 2015
ExxonMobil Mont Belvieu, TX United States 650 710 Q3 2016
Equistar * Corpus Christi, TX United States 500 2016
Formosa Point Comfort, TX United States 300 Q4 2016
2017
Dow Freeport, TX United States 400 650 2017
CPChem Sweeny, TX United States 500 500 Q3 2017
2018-2019
Sasol Lake Charles, LA United States 420 450 Q3 2018
Nova* Sarnia Canada 430 Q3 2018
Shell* Marcellus United States 500 500 Q3 2019
Totals, 000's MT 1420 3698 3026 500 8644
*Reported projects not fully verified or approved and not included in IHS capacity database.
© 2012, IHS Inc. No portion of this presentation may be reproduced, reused, or otherwise distributed in any form without prior written consent.
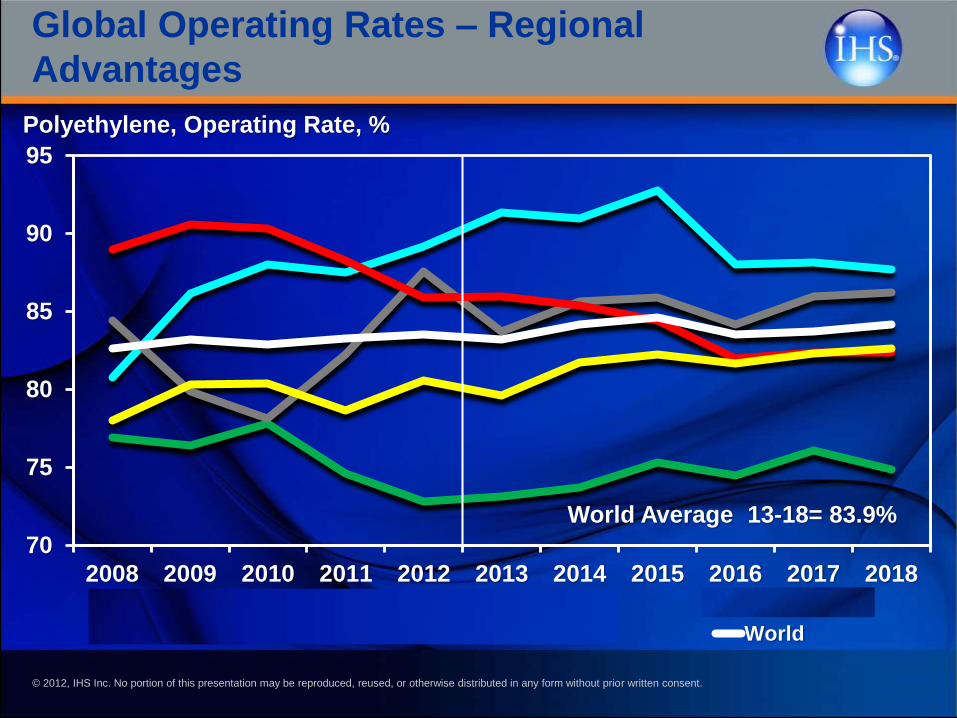
70
75
80
85
90
95
2008 2009 2010 2011 2012 2013 2014 2015 2016 2017 2018
North America West Europe Middle East
Northeast Asia South America World
Polyethylene, Operating Rate, %
Global Operating Rates – Regional
Advantages
World Average 13-18= 83.9%
© 2012, IHS Inc. No portion of this presentation may be reproduced, reused, or otherwise distributed in any form without prior written consent. 20
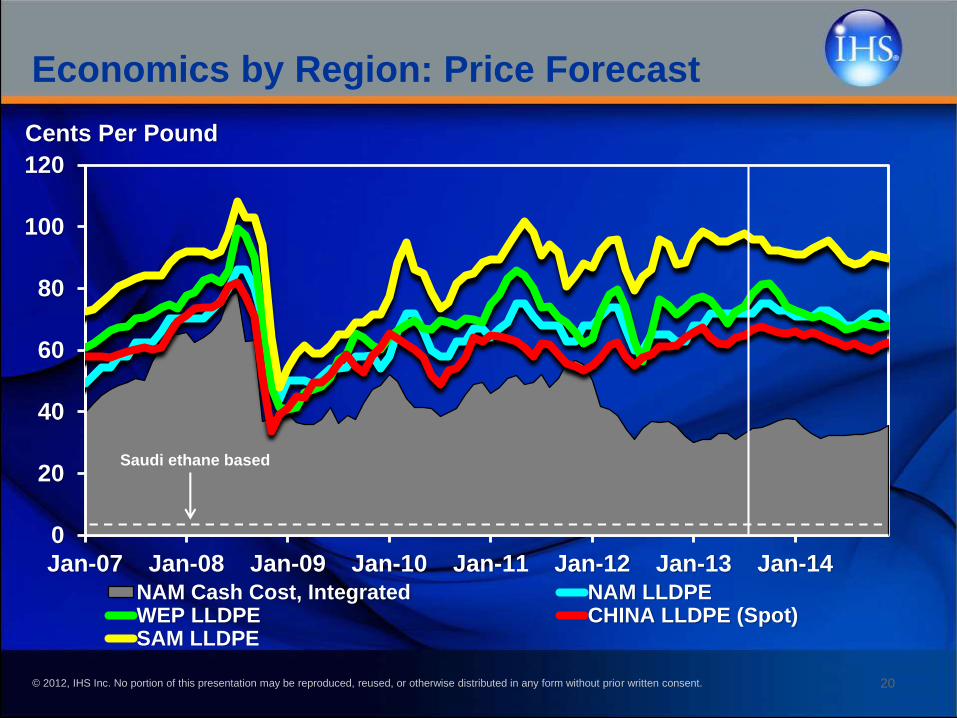
Economics by Region: Price Forecast
0
20
40
60
80
100
120
Jan-07 Jan-08 Jan-09 Jan-10 Jan-11 Jan-12 Jan-13 Jan-14NAM Cash Cost, Integrated NAM LLDPEWEP LLDPE CHINA LLDPE (Spot)SAM LLDPE
Cents Per Pound
Saudi ethane based
© 2012, IHS Inc. No portion of this presentation may be reproduced, reused, or otherwise distributed in any form without prior written consent.
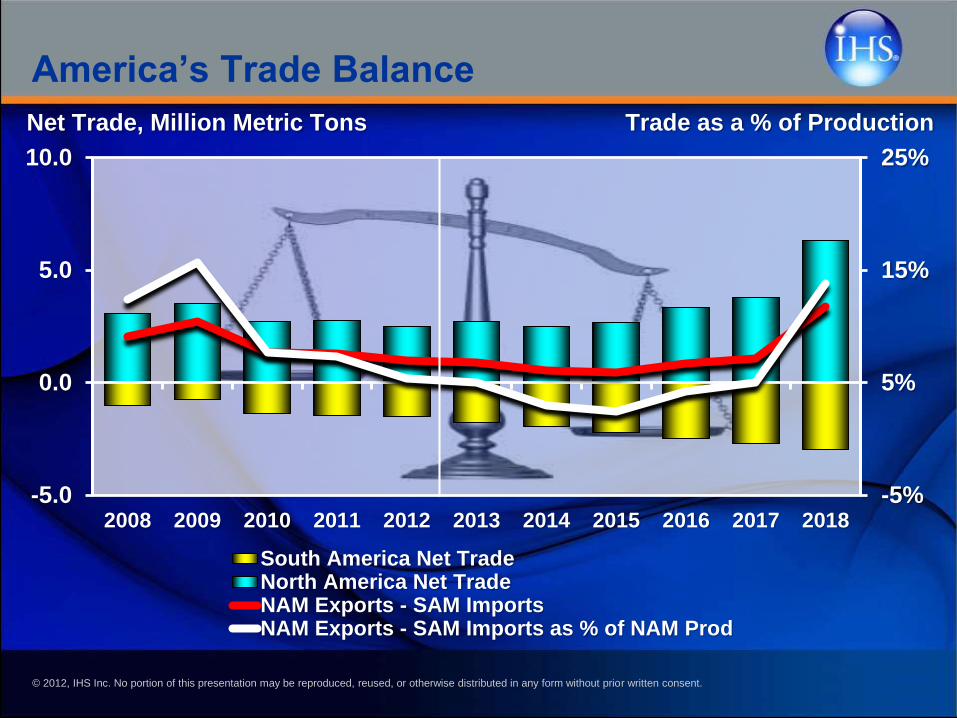
-5%
5%
15%
25%
-5.0
0.0
5.0
10.0
2008 2009 2010 2011 2012 2013 2014 2015 2016 2017 2018
South America Net TradeNorth America Net TradeNAM Exports - SAM ImportsNAM Exports - SAM Imports as % of NAM Prod
Net Trade, Million Metric Tons Trade as a % of Production
America’s Trade Balance
© 2012, IHS Inc. No portion of this presentation may be reproduced, reused, or otherwise distributed in any form without prior written consent.
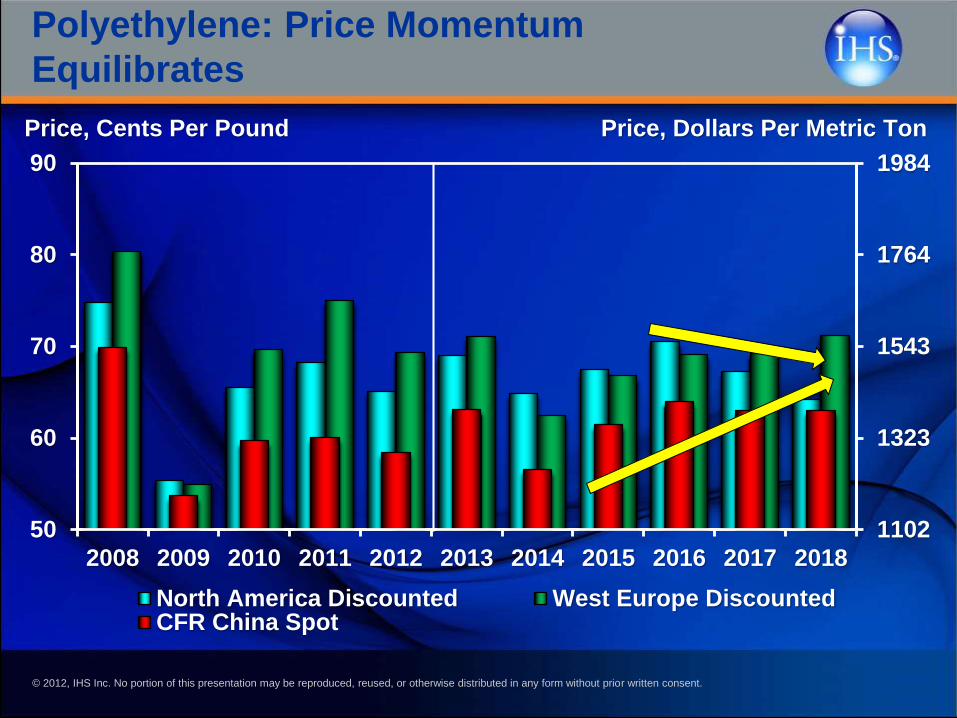
Polyethylene: Price Momentum
Equilibrates
1102
1323
1543
1764
1984
50
60
70
80
90
2008 2009 2010 2011 2012 2013 2014 2015 2016 2017 2018
North America Discounted West Europe DiscountedCFR China Spot
Price, Dollars Per Metric TonPrice, Cents Per Pound
© 2012, IHS Inc. No portion of this presentation may be reproduced, reused, or otherwise distributed in any form without prior written consent.
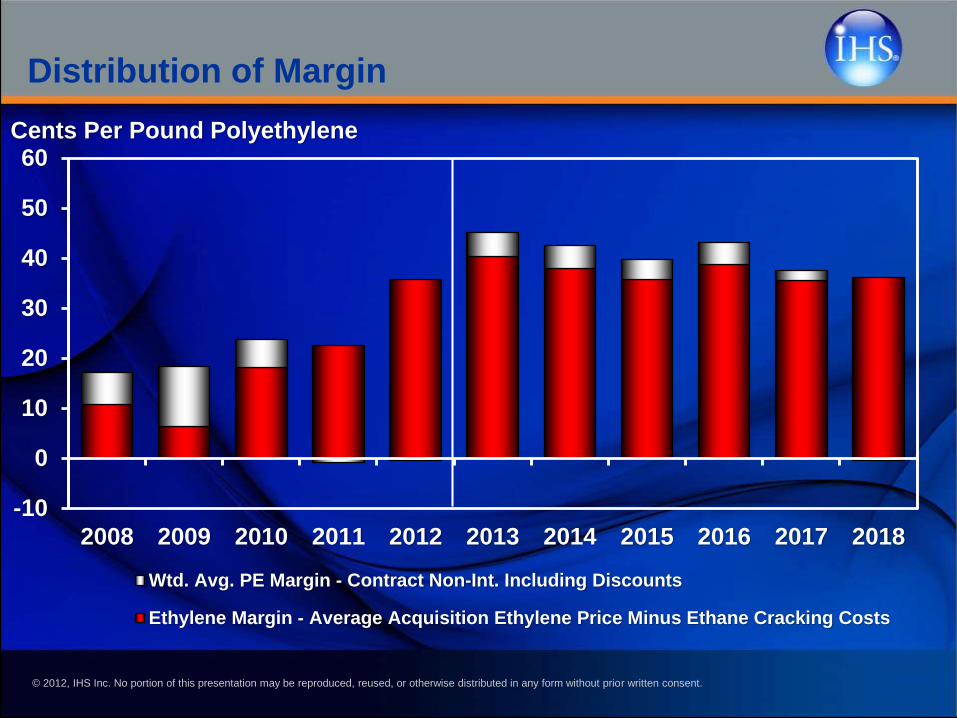
Distribution of Margin
-10
0
10
20
30
40
50
60
2008 2009 2010 2011 2012 2013 2014 2015 2016 2017 2018
Wtd. Avg. PE Margin - Contract Non-Int. Including Discounts
Ethylene Margin - Average Acquisition Ethylene Price Minus Ethane Cracking Costs
Cents Per Pound Polyethylene
© 2012, IHS Inc. No portion of this presentation may be reproduced, reused, or otherwise distributed in any form without prior written consent.
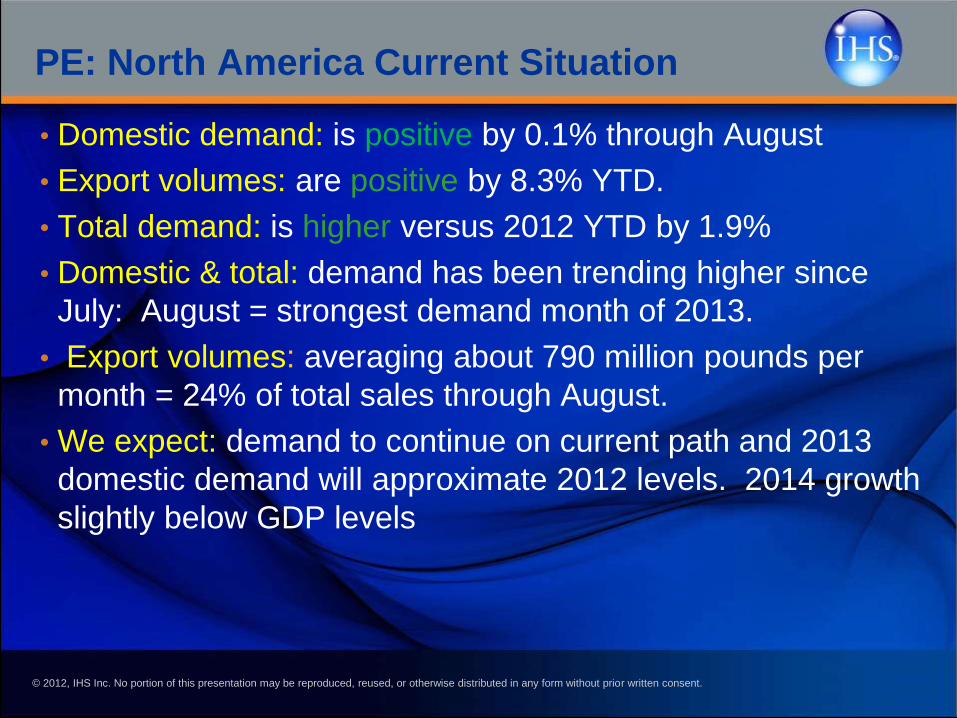
PE: North America Current Situation
• Domestic demand: is positive by 0.1% through August
• Export volumes: are positive by 8.3% YTD.
• Total demand: is higher versus 2012 YTD by 1.9%
• Domestic & total: demand has been trending higher since
July: August = strongest demand month of 2013.
• Export volumes: averaging about 790 million pounds per
month = 24% of total sales through August.
• We expect: demand to continue on current path and 2013
domestic demand will approximate 2012 levels. 2014 growth
slightly below GDP levels
© 2012, IHS Inc. No portion of this presentation may be reproduced, reused, or otherwise distributed in any form without prior written consent.
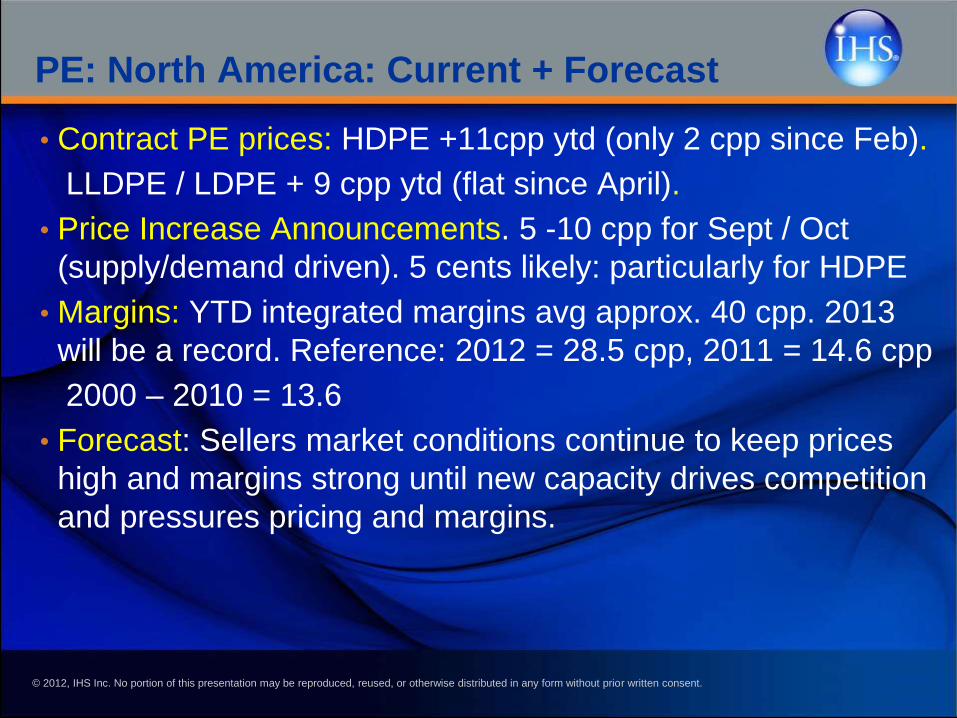
PE: North America: Current + Forecast
• Contract PE prices: HDPE +11cpp ytd (only 2 cpp since Feb).
LLDPE / LDPE + 9 cpp ytd (flat since April).
• Price Increase Announcements. 5 -10 cpp for Sept / Oct
(supply/demand driven). 5 cents likely: particularly for HDPE
• Margins: YTD integrated margins avg approx. 40 cpp. 2013
will be a record. Reference: 2012 = 28.5 cpp, 2011 = 14.6 cpp
2000 – 2010 = 13.6
• Forecast: Sellers market conditions continue to keep prices
high and margins strong until new capacity drives competition
and pressures pricing and margins.
© 2012, IHS Inc. No portion of this presentation may be reproduced, reused, or otherwise distributed in any form without prior written consent. 26
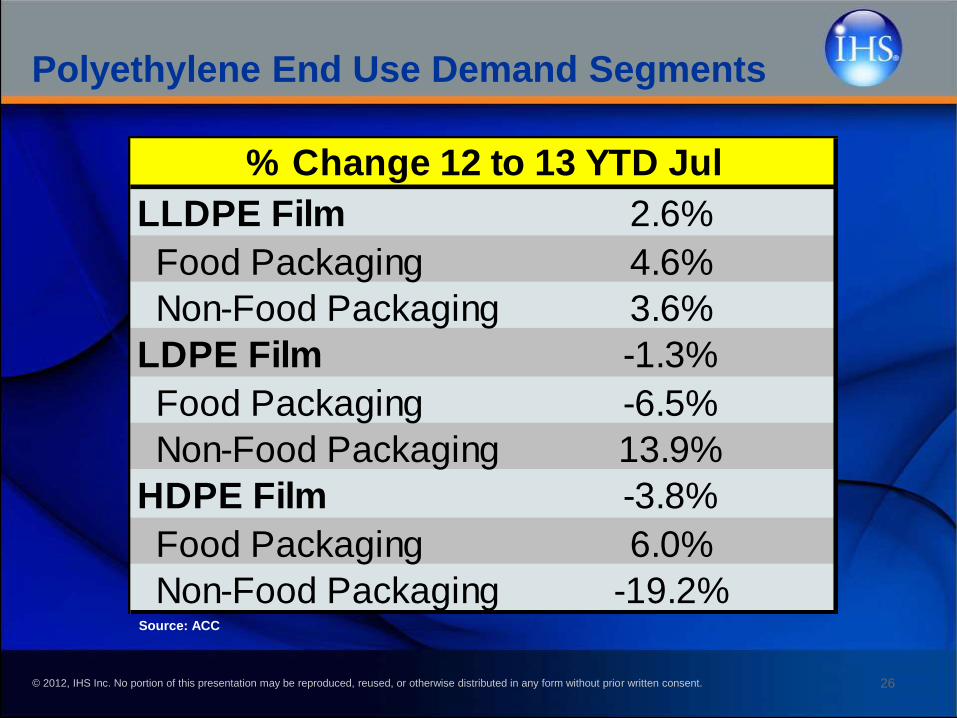
Polyethylene End Use Demand Segments
LLDPE Film 2.6%
Food Packaging 4.6%
Non-Food Packaging 3.6%
LDPE Film -1.3%
Food Packaging -6.5%
Non-Food Packaging 13.9%
HDPE Film -3.8%
Food Packaging 6.0%
Non-Food Packaging -19.2%
% Change 12 to 13 YTD Jul
Source: ACC
© 2012, IHS Inc. No portion of this presentation may be reproduced, reused, or otherwise distributed in any form without prior written consent.
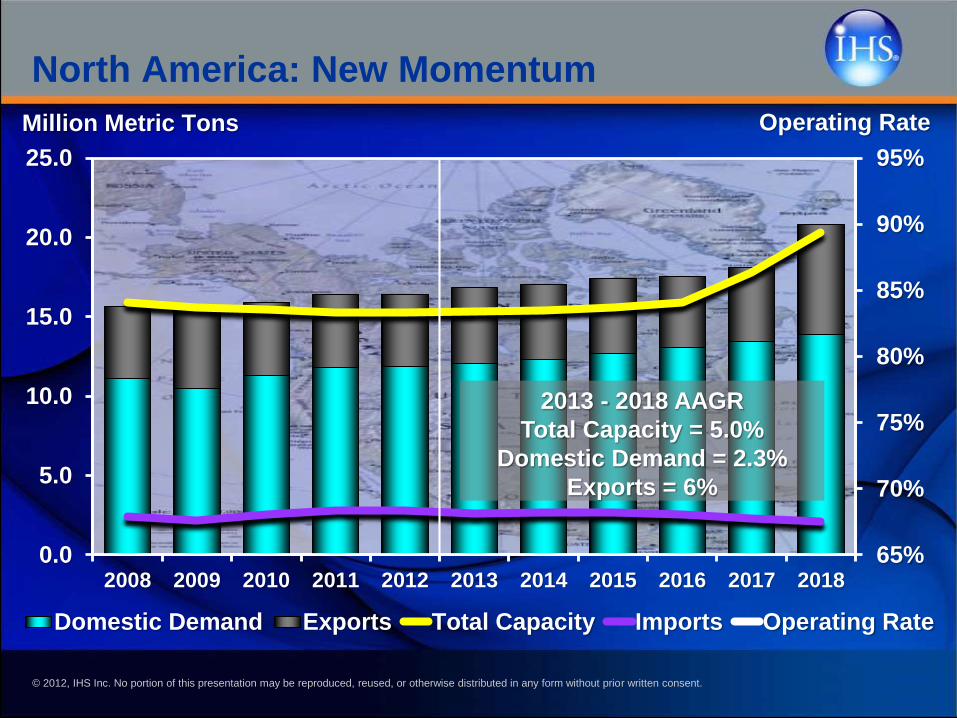
North America: New Momentum
65%
70%
75%
80%
85%
90%
95%
0.0
5.0
10.0
15.0
20.0
25.0
2008 2009 2010 2011 2012 2013 2014 2015 2016 2017 2018
Domestic Demand Exports Total Capacity Imports Operating Rate
Million Metric Tons Operating Rate
2013 - 2018 AAGR
Total Capacity = 5.0%
Domestic Demand = 2.3%
Exports = 6%
© 2012, IHS Inc. No portion of this presentation may be reproduced, reused, or otherwise distributed in any form without prior written consent. 28
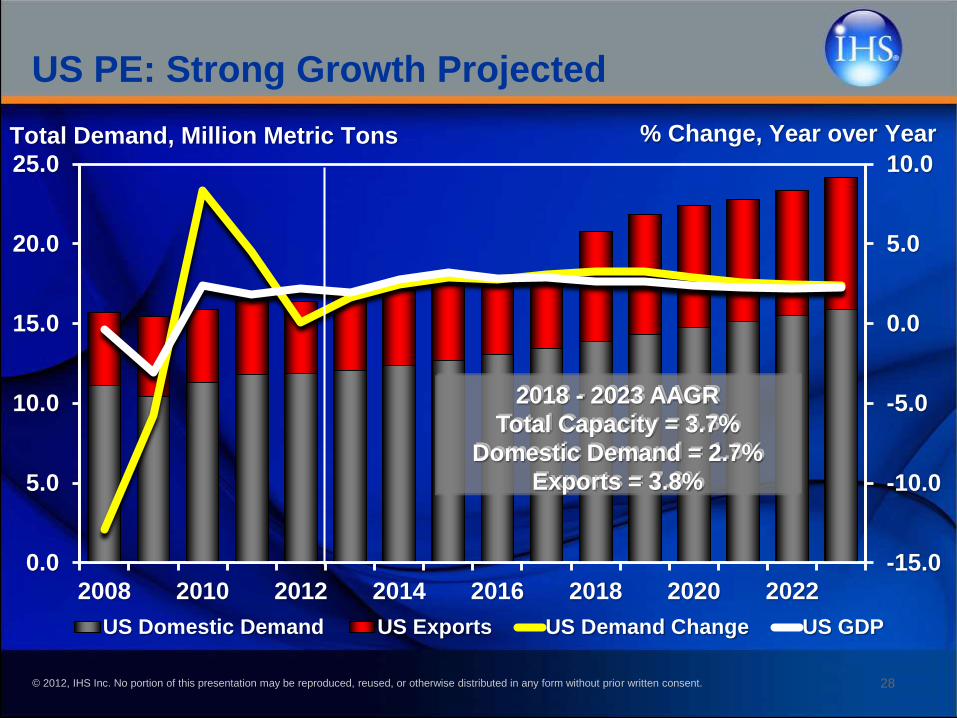
US PE: Strong Growth Projected
-15.0
-10.0
-5.0
0.0
5.0
10.0
0.0
5.0
10.0
15.0
20.0
25.0
2008 2010 2012 2014 2016 2018 2020 2022
US Domestic Demand US Exports US Demand Change US GDP
Total Demand, Million Metric Tons % Change, Year over Year
2013 - 2018 AAGR
Total Capacity = 5.8%
Domestic Demand = 1.9%
Exports = 7.6%
2018 - 2023 AAGR
Total Capacity = 3.7%
Domestic Demand = 2.7%
Exports = 3.8%
© 2012, IHS Inc. No portion of this presentation may be reproduced, reused, or otherwise distributed in any form without prior written consent.
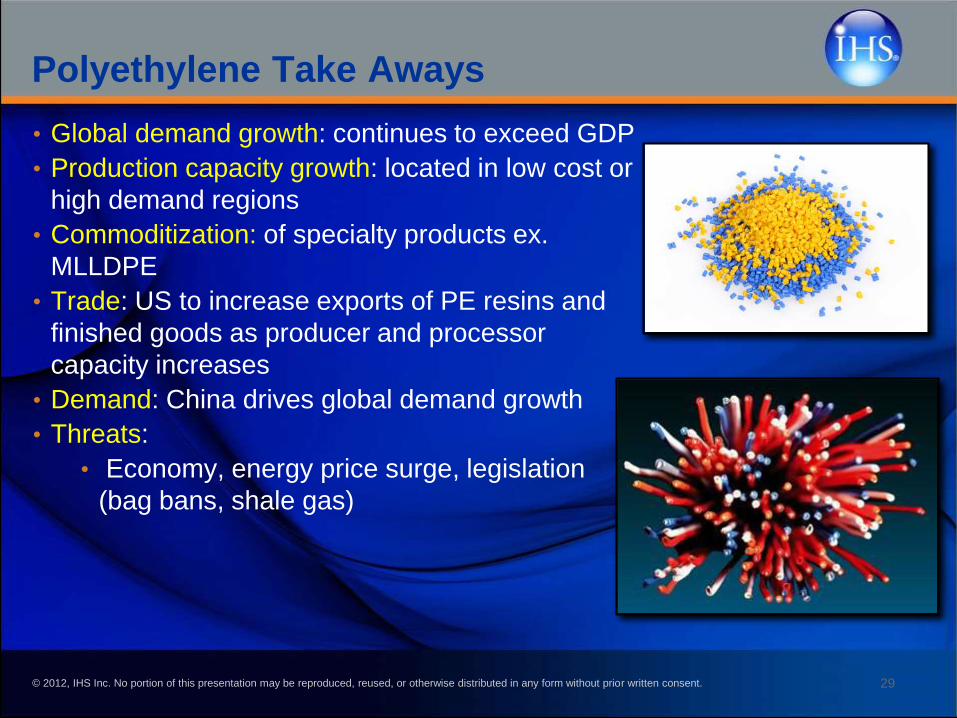
• Global demand growth: continues to exceed GDP
• Production capacity growth: located in low cost or
high demand regions
• Commoditization: of specialty products ex.
MLLDPE
• Trade: US to increase exports of PE resins and
finished goods as producer and processor
capacity increases
• Demand: China drives global demand growth
• Threats:
• Economy, energy price surge, legislation
(bag bans, shale gas)
29
Polyethylene Take Aways
© 2012, IHS Inc. No portion of this presentation may be reproduced, reused, or otherwise distributed in any form without prior written consent.
Propylene / Polypropylene
30
© 2012, IHS Inc. No portion of this presentation may be reproduced, reused, or otherwise distributed in any form without prior written consent.
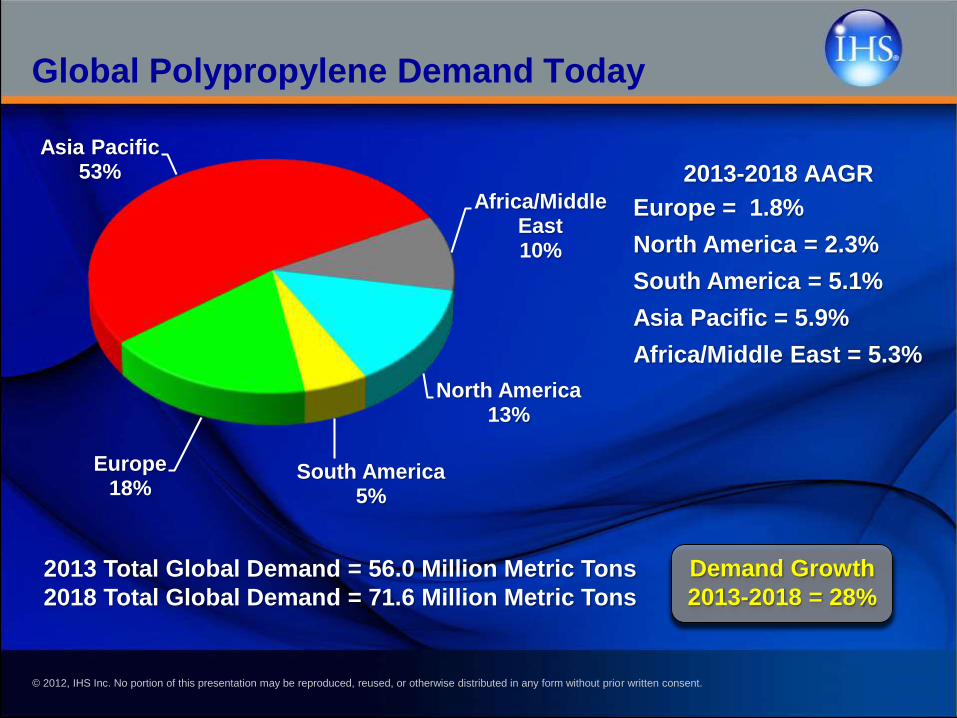
North America13%
South America 5%
Europe18%
Asia Pacific53%
Africa/Middle East10%
2013-2018 AAGR
Europe = 1.8%
North America = 2.3%
South America = 5.1%
Asia Pacific = 5.9%
Africa/Middle East = 5.3%
2013 Total Global Demand = 56.0 Million Metric Tons
2018 Total Global Demand = 71.6 Million Metric Tons
Global Polypropylene Demand Today
Demand Growth
2013-2018 = 28%
© 2012, IHS Inc. No portion of this presentation may be reproduced, reused, or otherwise distributed in any form without prior written consent.
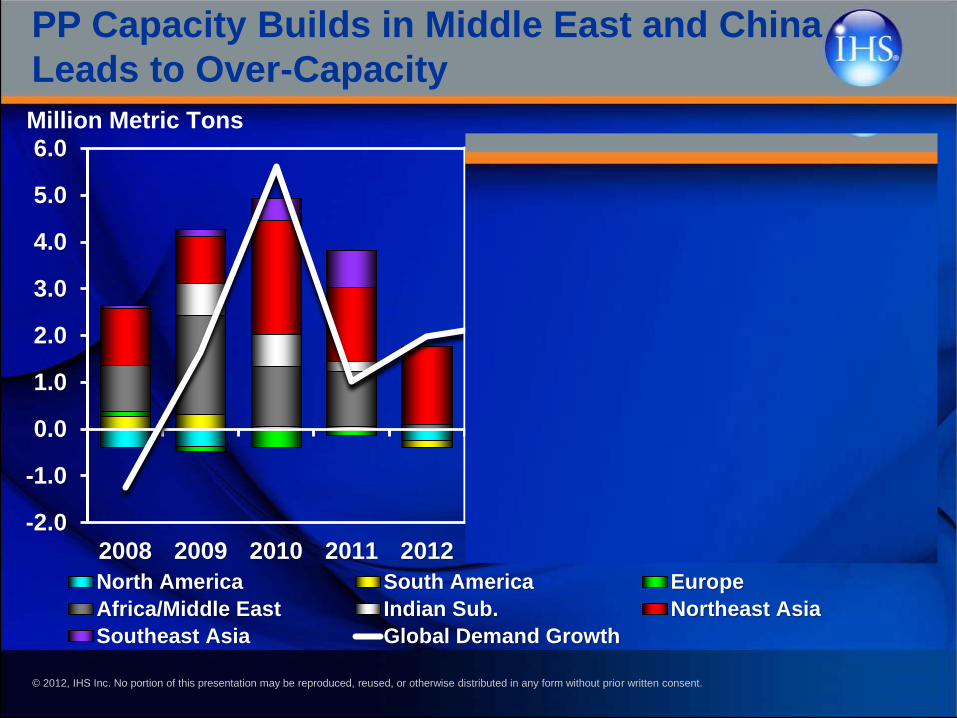
2013 – 2018 AAGR
Total Capacity = 4.9%
Total Demand = 5.0%-2.0
-1.0
0.0
1.0
2.0
3.0
4.0
5.0
6.0
2008 2009 2010 2011 2012 2013 2014 2015 2016 2017 2018
North America South America Europe
Africa/Middle East Indian Sub. Northeast Asia
Southeast Asia Global Demand Growth
Million Metric Tons
PP Capacity Builds in Middle East and China
Leads to Over-Capacity
© 2012, IHS Inc. No portion of this presentation may be reproduced, reused, or otherwise distributed in any form without prior written consent.
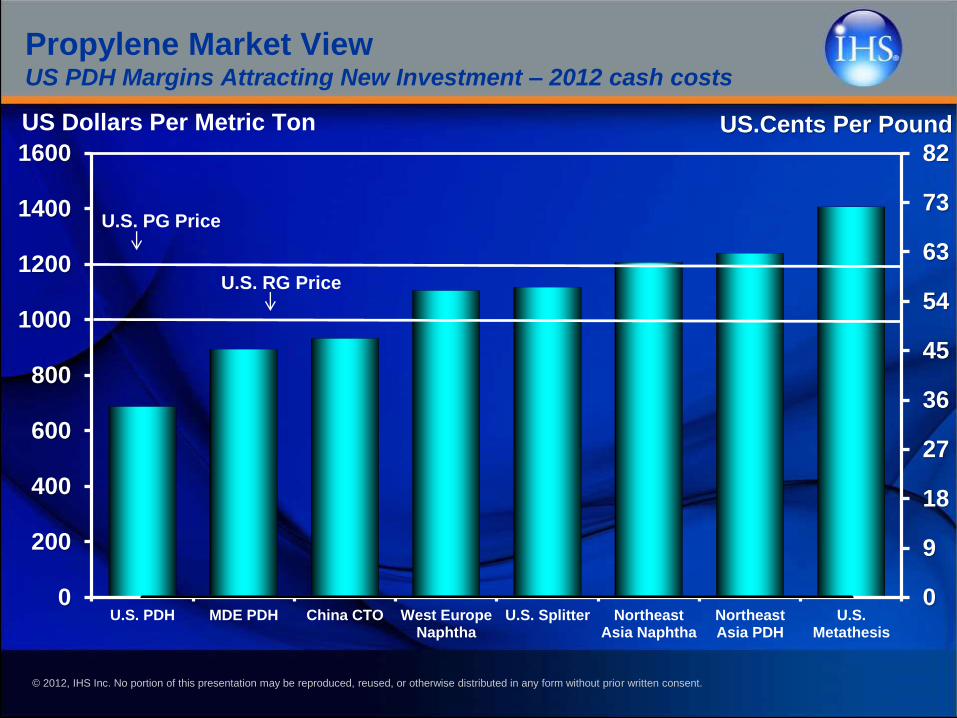
Propylene Market ViewUS PDH Margins Attracting New Investment – 2012 cash costs
0
9
18
27
36
45
54
63
73
82
0
200
400
600
800
1000
1200
1400
1600
U.S. PDH MDE PDH China CTO West EuropeNaphtha
U.S. Splitter NortheastAsia Naphtha
NortheastAsia PDH
U.S.Metathesis
US Dollars Per Metric Ton US.Cents Per Pound
U.S. RG Price
U.S. PG Price
© 2012, IHS Inc. No portion of this presentation may be reproduced, reused, or otherwise distributed in any form without prior written consent.
• PP supply constrained since June due to unplanned
disruptions in both monomer and PP production.
• Phillips 66 has been preparing for a 45 day outage in
October, resulting in sales allocation and an exit from spot
sales.
• PP op. rates since April have been above 90% in May, July,
and August.
• PP producers are pushing for margin improvement on the
back of very tight supply and demand fundamentals. IHS
has forecasted at least one cent of margin improvement
effective 1 January 2014.
Short Term Price Outlook: N. AmericaThe Price Spike Pattern Continues as propylene is structurally tight
34
© 2012, IHS Inc. No portion of this presentation may be reproduced, reused, or otherwise distributed in any form without prior written consent.
• Prices fcst. to erode in Nov. and Dec in line with C3
before moving up in Q14 (refinery ta’s) peaking in April.
• Post April: prices forecast to moderate through the
remainder of the year.
• Demand destruction in PP is likely to be the main lever
to impact propylene price spikes until on-purpose
propylene production comes on stream in 2015.
35
Short Term Price Outlook Continued
© 2012, IHS Inc. No portion of this presentation may be reproduced, reused, or otherwise distributed in any form without prior written consent.
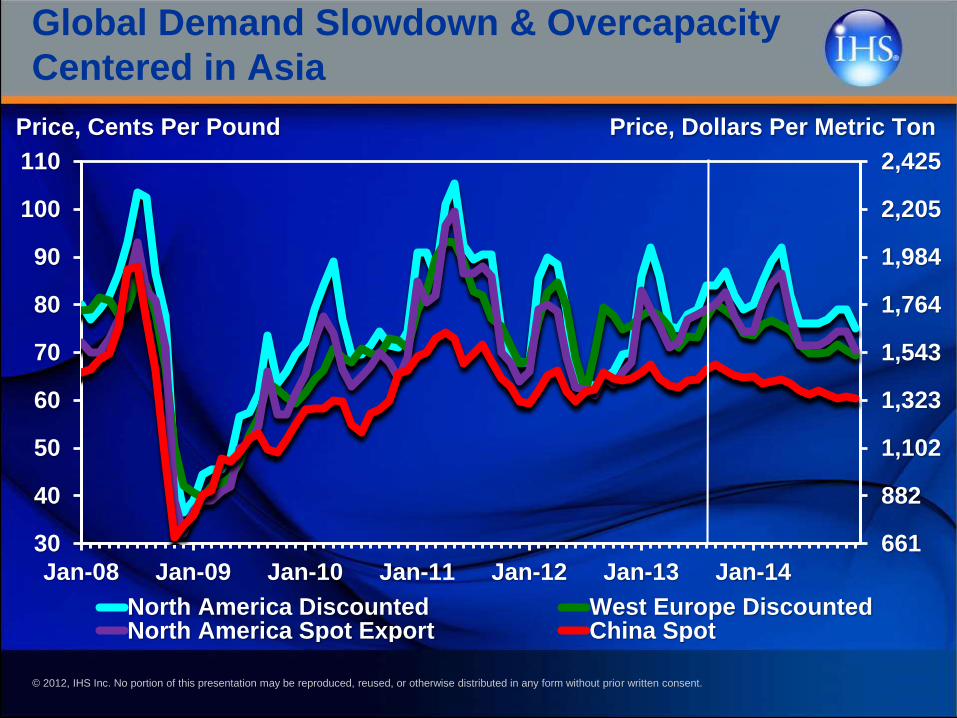
Global Demand Slowdown & Overcapacity
Centered in Asia
661
882
1,102
1,323
1,543
1,764
1,984
2,205
2,425
30
40
50
60
70
80
90
100
110
Jan-08 Jan-09 Jan-10 Jan-11 Jan-12 Jan-13 Jan-14
North America Discounted West Europe DiscountedNorth America Spot Export China Spot
Price, Dollars Per Metric TonPrice, Cents Per Pound
© 2012, IHS Inc. No portion of this presentation may be reproduced, reused, or otherwise distributed in any form without prior written consent.
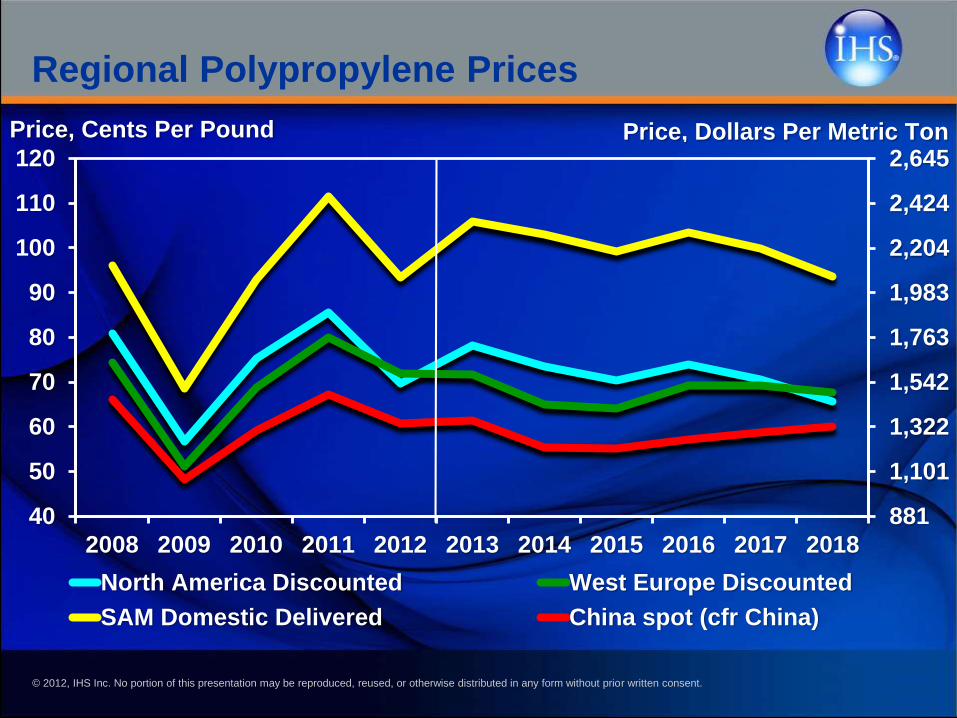
Regional Polypropylene Prices
881
1,101
1,322
1,542
1,763
1,983
2,204
2,424
2,645
40
50
60
70
80
90
100
110
120
2008 2009 2010 2011 2012 2013 2014 2015 2016 2017 2018
North America Discounted West Europe Discounted
SAM Domestic Delivered China spot (cfr China)
Price, Dollars Per Metric TonPrice, Cents Per Pound
© 2012, IHS Inc. No portion of this presentation may be reproduced, reused, or otherwise distributed in any form without prior written consent.
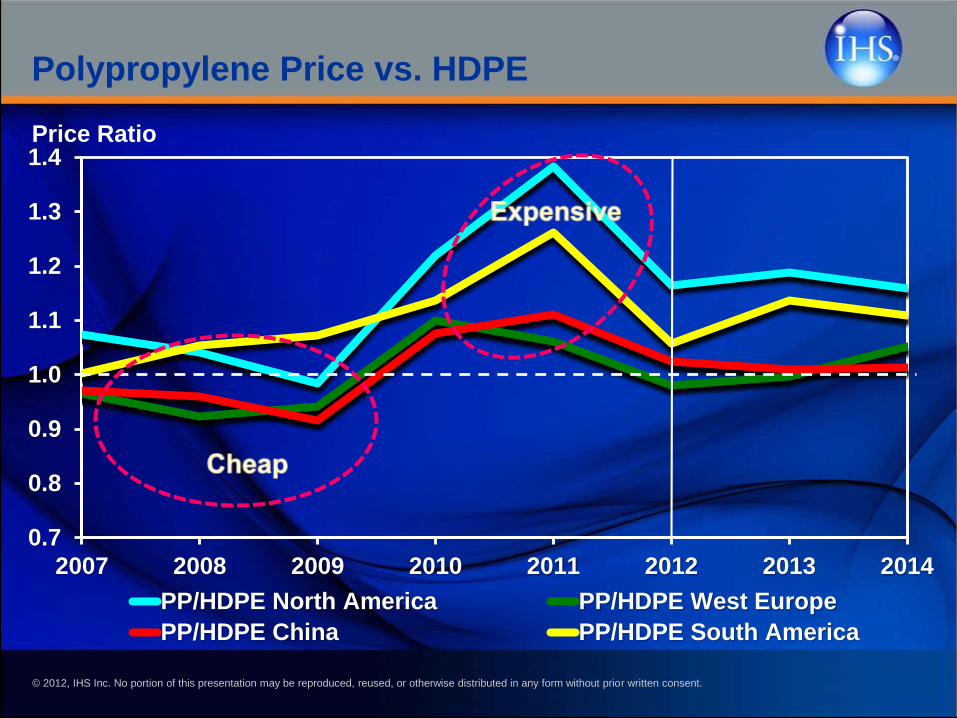
Polypropylene Price vs. HDPE
0.7
0.8
0.9
1.0
1.1
1.2
1.3
1.4
2007 2008 2009 2010 2011 2012 2013 2014
PP/HDPE North America PP/HDPE West Europe
PP/HDPE China PP/HDPE South America
Price Ratio
© 2012, IHS Inc. No portion of this presentation may be reproduced, reused, or otherwise distributed in any form without prior written consent. 39
N. America: Propylene Market ViewFuture North America Propylene Production
• Steam cracker propylene production will trend slightly lower
as additional ethane comes to market and is preferentially
processed versus other feedstocks
• FCC (refinery grade propylene supply) operating rates are
down as refiners optimize diesel production - decreasing
refinery grade propylene supplies.
• IHS view: six new PDH units being added through the 2018
timeframe in North America….Dow (2), Enterprise, Formosa,
Williams (Canada), and Ascend.
• Enterprise and Petrologistics (along with other companies)
are exploring additional PDH units due to abundance of
propane.
© 2012, IHS Inc. No portion of this presentation may be reproduced, reused, or otherwise distributed in any form without prior written consent. 40
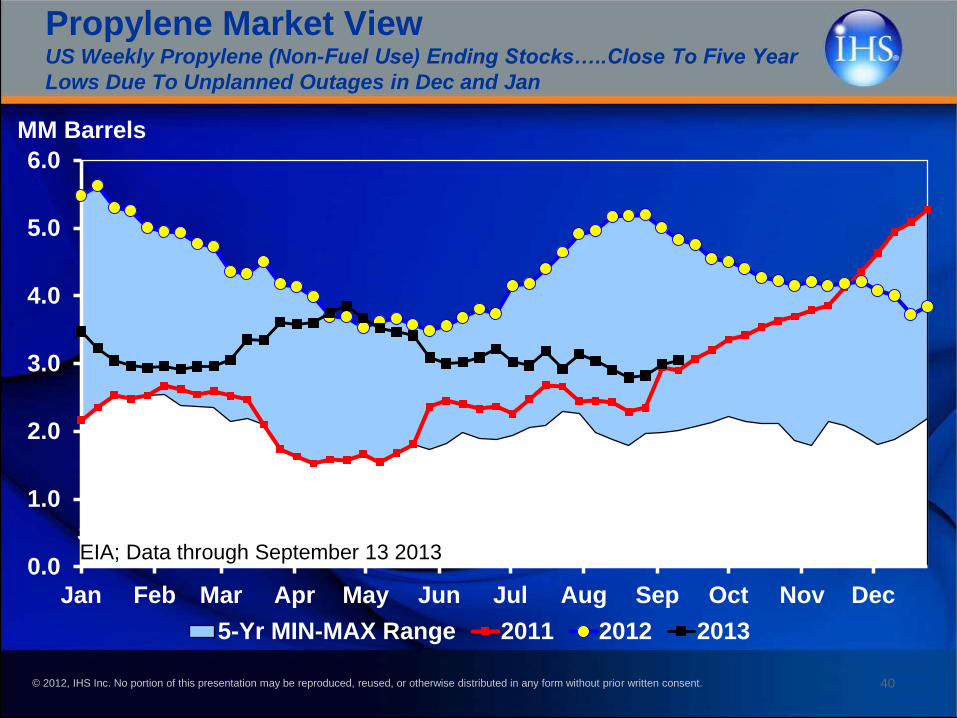
Propylene Market ViewUS Weekly Propylene (Non-Fuel Use) Ending Stocks…..Close To Five Year
Lows Due To Unplanned Outages in Dec and Jan
Source: EIA, Data Through 26-October-12
0.0
1.0
2.0
3.0
4.0
5.0
6.0
Jan Feb Mar Apr May Jun Jul Aug Sep Oct Nov Dec
MM Barrels
5-Yr MIN-MAX Range 2011 2012 2013
EIA; Data through September 13 2013
© 2012, IHS Inc. No portion of this presentation may be reproduced, reused, or otherwise distributed in any form without prior written consent.
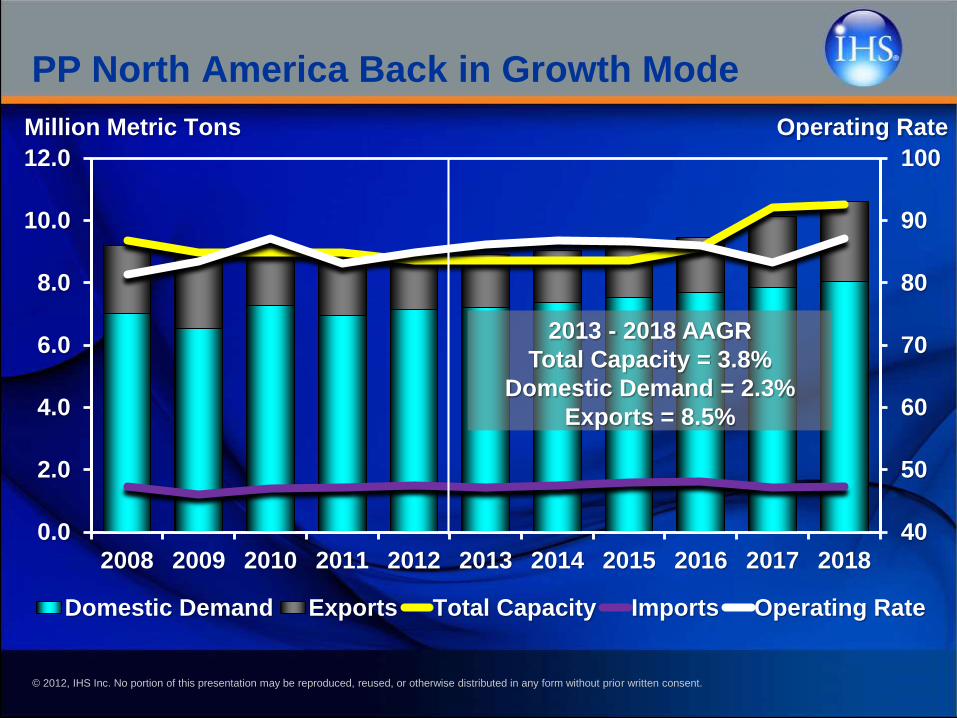
PP North America Back in Growth Mode
40
50
60
70
80
90
100
0.0
2.0
4.0
6.0
8.0
10.0
12.0
2008 2009 2010 2011 2012 2013 2014 2015 2016 2017 2018
Domestic Demand Exports Total Capacity Imports Operating Rate
Million Metric Tons Operating Rate
2013 - 2018 AAGR
Total Capacity = 3.8%
Domestic Demand = 2.3%
Exports = 8.5%
© 2012, IHS Inc. No portion of this presentation may be reproduced, reused, or otherwise distributed in any form without prior written consent.
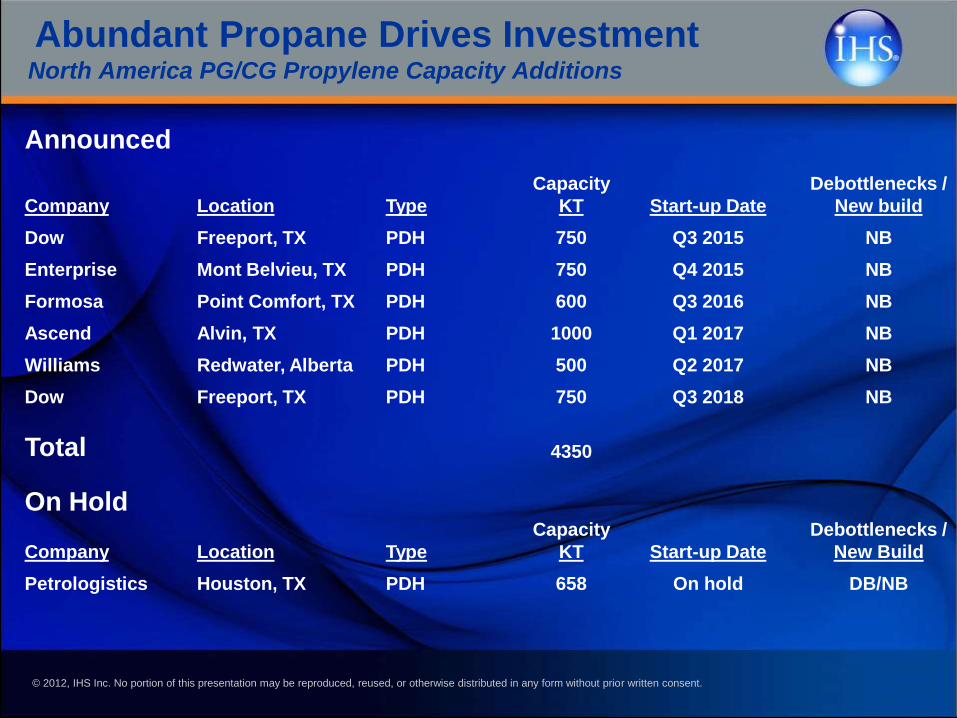
Abundant Propane Drives InvestmentNorth America PG/CG Propylene Capacity Additions
Announced
Company Location Type
Capacity
KT Start-up Date
Debottlenecks /
New build
Dow Freeport, TX PDH 750 Q3 2015 NB
Enterprise Mont Belvieu, TX PDH 750 Q4 2015 NB
Formosa Point Comfort, TX PDH 600 Q3 2016 NB
Ascend Alvin, TX PDH 1000 Q1 2017 NB
Williams Redwater, Alberta PDH 500 Q2 2017 NB
Dow Freeport, TX PDH 750 Q3 2018 NB
Total 4350
On Hold
Company Location Type
Capacity
KT Start-up Date
Debottlenecks /
New Build
Petrologistics Houston, TX PDH 658 On hold DB/NB
© 2012, IHS Inc. No portion of this presentation may be reproduced, reused, or otherwise distributed in any form without prior written consent.
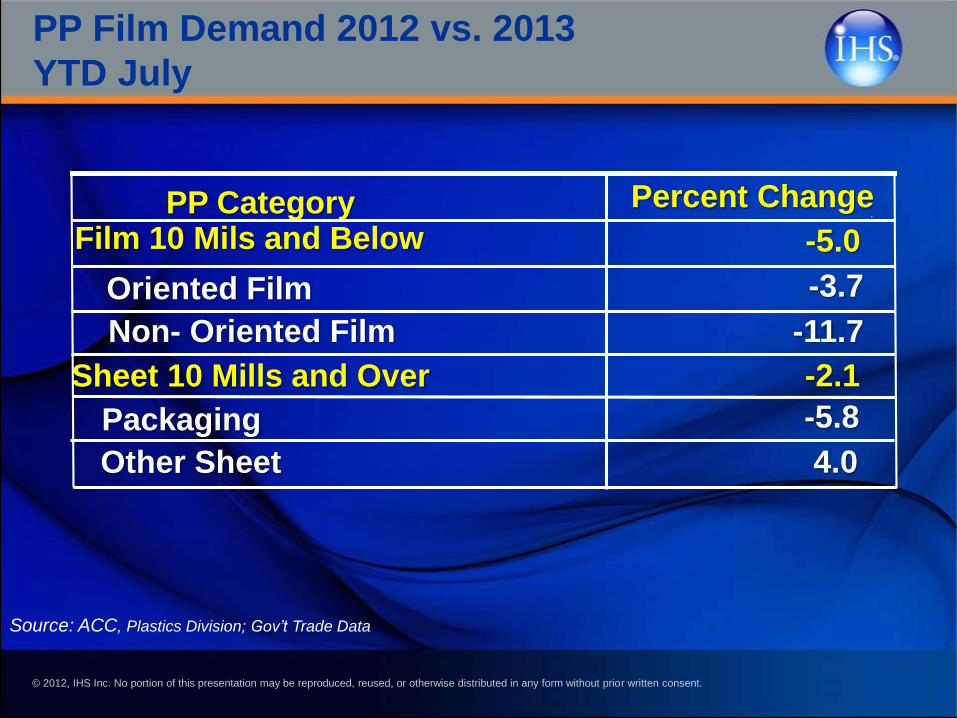
PP Category Percent Change
Film 10 Mils and Below -5.0
Oriented Film -3.7
Non- Oriented Film -11.7
Sheet 10 Mills and Over
Packaging
4.0Other Sheet
Source: ACC, Plastics Division; Gov’t Trade Data
PP Film Demand 2012 vs. 2013
YTD July
-2.1
-5.8
© 2012, IHS Inc. No portion of this presentation may be reproduced, reused, or otherwise distributed in any form without prior written consent.
• Cost position to dampen short term domestic demand
• Ratio of PP/HDPE price and volatility restricting growth
• Excess propane from shale will drive new investments in on-purpose
propylene capacity
• A portion of that new propylene capacity will need to be monetized in the form of
polypropylene. Exports of PP will be concentrated within the America’s
• Prior to new on-purpose propylene capacity additions, volatility to
continue
• Propylene supply not expected to improve until late 2015
• Loss in PP capacity combined with decreased demand and increased propylene
inventory has helped rebalance the propylene market.
• Still, supply demand remains tight, and any unplanned outages have immediate
affects
North America Key Issues: Polypropylene