polycyclic aromatic hydrocarbons in fishes and sediments from the guanabara bay, brazil
TRANSCRIPT

This article was downloaded by: [University of California Santa Barbara]On: 30 September 2013, At: 12:38Publisher: Taylor & FrancisInforma Ltd Registered in England and Wales Registered Number: 1072954 Registered office: Mortimer House,37-41 Mortimer Street, London W1T 3JH, UK
Environmental ForensicsPublication details, including instructions for authors and subscription information:http://www.tandfonline.com/loi/uenf20
Polycyclic Aromatic Hydrocarbons in Fishes andSediments from the Guanabara Bay, BrazilTaís Freitas da Silva a , Débora de Almeida Azevedo a & Francisco Radler de Aquino Neto aa Departamento de Química Orgânica, Instituto de Química, Universidade Federal do Rio deJaneiro, Rio de Janeiro, BrazilPublished online: 01 Oct 2007.
To cite this article: Taís Freitas da Silva , Débora de Almeida Azevedo & Francisco Radler de Aquino Neto (2007) PolycyclicAromatic Hydrocarbons in Fishes and Sediments from the Guanabara Bay, Brazil, Environmental Forensics, 8:3, 257-264, DOI:10.1080/15275920701506433
To link to this article: http://dx.doi.org/10.1080/15275920701506433
PLEASE SCROLL DOWN FOR ARTICLE
Taylor & Francis makes every effort to ensure the accuracy of all the information (the “Content”) containedin the publications on our platform. However, Taylor & Francis, our agents, and our licensors make norepresentations or warranties whatsoever as to the accuracy, completeness, or suitability for any purpose of theContent. Any opinions and views expressed in this publication are the opinions and views of the authors, andare not the views of or endorsed by Taylor & Francis. The accuracy of the Content should not be relied upon andshould be independently verified with primary sources of information. Taylor and Francis shall not be liable forany losses, actions, claims, proceedings, demands, costs, expenses, damages, and other liabilities whatsoeveror howsoever caused arising directly or indirectly in connection with, in relation to or arising out of the use ofthe Content.
This article may be used for research, teaching, and private study purposes. Any substantial or systematicreproduction, redistribution, reselling, loan, sub-licensing, systematic supply, or distribution in anyform to anyone is expressly forbidden. Terms & Conditions of access and use can be found at http://www.tandfonline.com/page/terms-and-conditions
Environmental Forensics, 8:257–264, 2007
Copyright C© Taylor & Francis Group, LLC
ISSN: 1527–5922 print / 1527–5930 online
DOI: 10.1080/15275920701506433
Polycyclic Aromatic Hydrocarbons in Fishes and Sediments fromthe Guanabara Bay, Brazil
Taıs Freitas da Silva, Debora de Almeida Azevedo, and Francisco Radler de Aquino Neto
Departamento de Quımica Organica, Instituto de Quımica, Universidade Federal do Rio de Janeiro, Rio de Janeiro, Brazil
Polycyclic aromatic hydrocarbons (PAHs) were identified and quantified in sediment and fish samples. The samples were analyzedby gas chromatography/mass spectrometry to gather information about the degree of contamination. PAH total concentration rangedfrom 79 to 487 μg/kg dry weight in surficial sediment samples and from 4 to 53 μg/kg in fish samples. Most sediment samples wereclassified as fairly contaminated (at 250–500 μg/kg of total PAH). The lowest and highest �PAH concentrations in fish (4 to 53 μg/kg)were found for Mugil lisa and Micropogonias furniere, respectively. The PAHs in sediment and fish samples are derived primarily frommixed sources.
Keywords: PAHs, fish, sediment
Introduction
Polycyclic aromatic hydrocarbons (PAH) are widespread con-taminants throughout the environment (Notar et al., 2001). Thehydrocarbons present in environmental samples internationallyare mainly due to the use of petroleum as one of the most im-portant sources of energy. However, it must be highlighted thatthere are many different mechanisms by which hydrocarbonscan be introduced into the environment, other than oil spills(Meniconi et al., 2002). Once formed, PAHs are known to en-ter the near-shore marine environment through the spillage ofpetroleum, industrial discharges, atmospheric fallout, and ur-ban runoff. Because of their low water solubility (10−7 to 10−10
mol·m−3), and their hydrophobicity, PAHs in the aquatic envi-ronment rapidly become associated with inorganic and organicsuspended particles with subsequent deposition in sediments.The favorable partition coefficients and greater persistence ofsedimentary PAH compared with PAHs in solution means that,in general, sediments contain a PAH concentration that is a fac-tor of 1,000 or more higher than in the overlying water column.Therefore, sediments can be used to monitor PAH inputs to theaquatic environment (Notar et al., 2001).
Some PAHs have been widely studied because of their car-cinogenic and mutagenic properties (Aas et al., 2000; 2001). Forthis reason, some PAHs are included on the lists of priority pol-
Received 22 March 2006; accepted 8 December 2006.Address correspondence to D. A. Azevedo, Departamento de
Quımica Organica, Instituto de Quımica, Universidade Federal do Riode Janeiro, Avenida Athos da Silveira Ramos 149, Centro de Tech-nologia (CT), Bloco A, Sala 603, 21941-909, Ilha do Fundao, CidadeUniversitaria, Rio de Janeiro, RJ, Brazil. E-mail: [email protected]
lutants in the United States and European Union. Toxic hepaticlesions in fish have been related to the PAH exposure (Viveset al., 2004).
Depending on the case, an oil spill in an aquatic compartmentcan affect the bentonic and planktonic biota. In another regard,the nekton seldom suffers long-term harm from oil spill expo-sure. Their contamination following an oil spill can happen dueto the presence of known toxic and carcinogenic compounds inpetroleum products, the PAHs, especially the 3- to 7-ring com-pounds (Rand, 1995).
However, the literature reports that the nekton contaminationwith PAHs usually does not represent a significant human healthrisk, even for subsistence consumers of fish (Gesamp, 1993;EPA, 1997). Specific data for free-swimming fish revealed rela-tively rapid PAH depuration rates, preventing their accumulationin fish tissue (E&P FORUM, 1994; Saxton et al., 1993; Varanasiet al., 1990; 1993). After the molecules are taken up by fish theyare biotransformed into polar metabolites and thereby enhancethe efficiency of excretion (Haugland et al., 2005). In addition,fish are generally well known to be able to detect oil even atextremely low concentrations and thus may avoid oil spills byswimming away.
The factors determining PAH accumulation in fish tissues arestill to be elucidated. PAH in fish can be metabolized rapidly tointermediates that either bind to liver DNA or from conjugatesfor ultimate transfer to bile (Collier and Varanasi, 1991). In somestudies, the occurrence of PAH in fish organs has been relatedto recent episodes of pollution exposure (Pointed and Milliet,2000). The problem of determining acceptable limiting levels ofcontamination of fish by oil is usually dealt with in workshopsestablished by the occasion of the spill, with participation of
257
Dow
nloa
ded
by [
Uni
vers
ity o
f C
alif
orni
a Sa
nta
Bar
bara
] at
12:
38 3
0 Se
ptem
ber
2013

258 T. F. Da Silva et al.
representatives of state and federal environmental agencies, thefood and agriculture administration, and the responsible party.To date, no agency in Brazil has adopted clear guidelines forclosing or reopening a fishery after a major spill.
This article describes the results of the chemical analyses forPAHs conducted on composite samples of edible tissue of twofish species (Mugil lisa and Micropogonias furnieri) collected innets and fish traps in the most affected area of the Guanabara Bay.A great percentage of the local population consumes these fishcaught widely throughout the area. Fat-binding PAHs are capableof accumulating in the food chain; therefore, the amount of PAHsper gram of fish consumed are important data to help determineon the long-term implication on human health (Anyakora et al.,2005).
Materials and Methods
Description of Studied Area
Guanabara Bay comprises approximately 391 km2, between22◦ 24′ and 22◦ 57′ south latitude and 42◦ 33′ and 43◦ 19′ westlongitude. In addition to the high concentration of populationin the Guanabara Bay area, this region has one of the greatestindustrial parks of the country, a refinery, two commercial ports(Rio de Janeiro and Niteroi cities), 16 oil maritime terminalsand 12 shipyards, which are potential sources of oil pollution.According to the IBGE/2003 census data (Brazilian Geographyand Statistics Institute) more than 6 million inhabitants live inthe area directly influenced by the bay. The central channel thatconnects the bay to the ocean has a maximum depth of 50 m.The bay houses the second most important commercial harborin Brazil with 1,700 ships/year (Fernandez et al., 2005).
Alterations to the Guanabara Bay drainage basin initiatedat the beginning of the 19th century have resulted in severeenvironmental degradation. Highly eutrophic conditions, highsedimentation rates, elevated concentrations of toxic metals andhydrocarbons in sediments, and changes in the pelagic and ben-thic communities are some of the most important environmen-tal problems. The uneven distribution of non-point sources ofsewage has resulted in pronounced spatial gradients of contam-ination in water and sediments from the bay. The environmentalmonitoring programs conducted in Guanabara Bay have beendiscontinuous and are based on conventional biological indica-tors (total and fecal coliform) and/or water quality standards(e.g., dissolved oxygen concentration, nutrients; Carreira et al.,2004).
Sampling
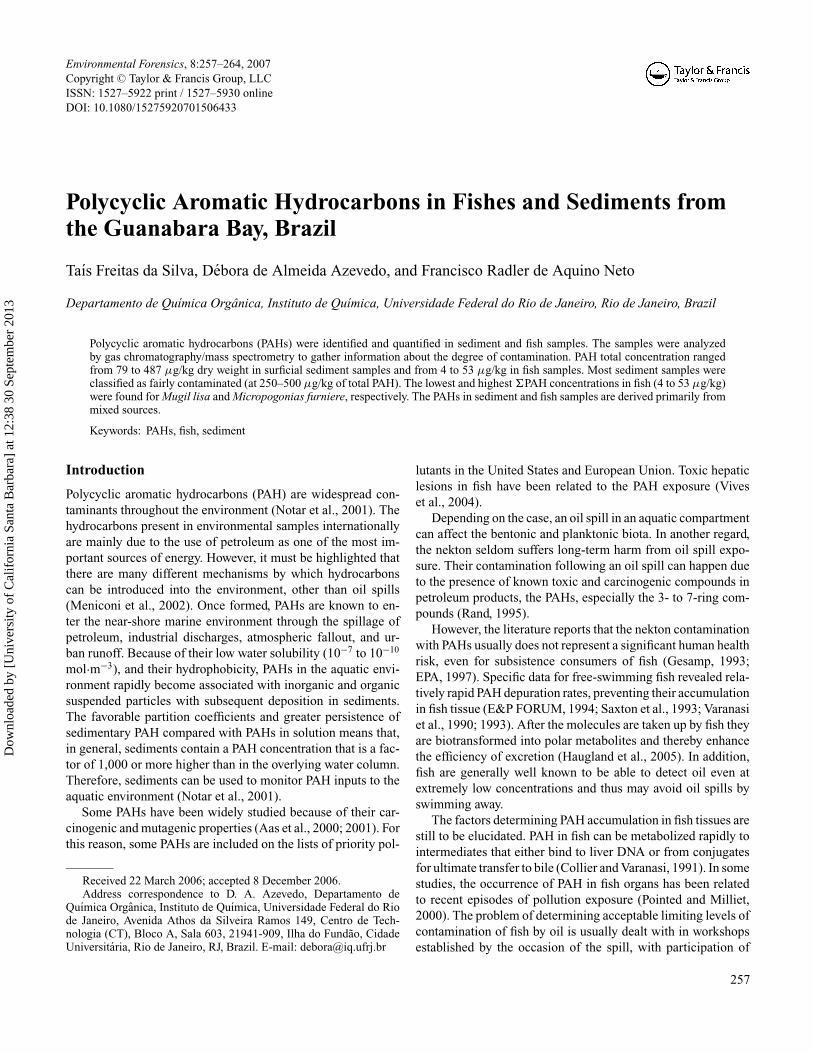
Sample stations were chosen based not only on the sheen dis-persion boundaries, located on the north and northern regionof the bay (adjacent to the Refinery, Figure 1), but also on theresults of chemical analyses of the water and sediment sam-ples (Meniconi et al., 2002). The sediment and fish sampleswere collected in July and August 2002, two sites each month(Figure 1), in the north-northeast region of Guanabara Bay (Riode Janeiro, Brazil).
Table 1. Total number of fish samples, stations, species, and capturemode for each studied month (July and August 2002)
Capture modeSpecies Total for month
SLI BLC
trap net trap net
Mugil lisa 05 05 05 05 20Micropogonias furnieri 05 05 05 05 20Total of samples 10 10 10 10 40
Sediment Samples
A total of four surface sediment samples were collected, onefrom each of the two sites, in both months, July and August.Surface sediment samples were collected with a grab samplerand kept in an aluminum box after carefully removing the top1-cm surface layer with a stainless steel spoon. After returningto the laboratory, the sediments were then stored at –20◦C untillyophilization to dryness, extraction, and analyses (Silva, 2004).
Fish Samples
Chemical analyses were performed on 40 composite samples ofedible tissue of each of two species (Mugil lisa and Micropogo-nias furnieri), a total of 80 fish samples (Table 1). The compos-ite samples analyzed consisted of organisms collected from netsand fish traps in the north-northeast region of Guanabara Bay.They were collected from two sites and for two months, Julyand August. The species were chosen based on their abundance,marketability and different feeding habits. The Micropogoniasfurnieri is a tertiary consumer, feeding on bentonic organismssuch as small fishes and crustaceans. In another regard, the Mugillisa is herbivorous (primary consumer), feeding on vegetationpresent in the water column or over the bottom sediment. Bothspecies have high fat content, in which the PAHs tend to accumu-late, with the Mugil lisa being the fattest (Meniconi et al., 2001).The average natural PAH concentration is lower in fish musclethan in mollusk liver and tissues because, in contrast to bivalves,fish have the ability to oxidize and further metabolize PAHs towater-soluble compound that are excreted by the living organ-ism (Stolyhwo and Sikorski, 2005). Fish samples for chemicalanalysis were wrapped in aluminum foil and kept frozen untilanalysis. They were lyophilized to dryness prior to extraction.
Chemical Standards
Deuterated internal standard, (pyrene-d10 98%, from CambridgeIsotope Laboratories, Inc., Andover, MA), and a referencemixture of PAHs (EPA 610), from Supelco (Bellefonte,PA; part n◦ 4-8743) containing 100 mg/L of anthracene(Ant), benzo[a]anthracene (BaA), benzo[a]pyrene (BaP),benzo[k]fluoranthene (BkF), chrysene (Cry), indeno[1,2,3-cd]pyrene (InP), phenanthrene (Phe), and pyrene (Py); 200 mg/Lof benzo[b]fluoranthene (BbF), benzo[g,h,i]perylene (BPe),
Dow
nloa
ded
by [
Uni
vers
ity o
f C
alif
orni
a Sa
nta
Bar
bara
] at
12:
38 3
0 Se
ptem
ber
2013
PAHs from Guanabara Bay 259
Figure 1. Map from Guanabara Bay showing the location of the two sampling sites (1-SLI; 2-BLC), a few major pollution sources of the area affectedby the 2000 REDUC spill and the environmental protection mangrove area. SLI = South Limao Island; BLC = Boca Larga Channel.
dibenzo[a,h]anthracene (DBA), fluoranthene (Flt), and fluo-rene (Flu); 1000 mg/L of acenaphthene (Ace) and naphtha-lene (Nap); and 2000 mg/L of acenaphthylene (Acpt) wereused as external standards. The PAH mixture was further di-luted with hexane to prepare calibration solutions for gas chro-matography/mass spectrometry (GC/MS) analyses in the rangeof 0.0025–4 μg/mL. All solvents used for sample processingand analyses (dichloromethane, acetonitrile, hexane) were chro-matographic grade from TediaBrazil (Rio de Janeiro, Brazil).
Silica gel (Kieselgel 40, 70–230 mesh) and alumina (alu-minum 90 active, 70–230 mesh) were obtained from Merck (Riode Janeiro, Brazil). Silica and alumina were cleaned by extrac-tion with dichloromethane in a Soxhlet apparatus for 24 hr and,after solvent evaporation, were heated overnight for activationto 120 and 300◦C, respectively. After cooling in a desiccator,they were deactivated by adding suitable amounts of water (5%)on a w/w basis. Homogenization was conducted by mechanicalshaking for 2 hr (Aceves et al., 1988).
Sample Extraction
Sediment and Fish Samples ExtractionThe PAH fraction was extracted from approximately 10 g
of freeze-dried sediment or fish by ultrasonication in 50 mLdichloromethane for 20 min. Pyrene-d10 (100 mL at 1 ng/mL)was added to each sediment sample prior to extraction. Thesamples were then centrifuged, the dichloromethane extractdecanted, and the extraction process repeated twice. The li-pidic content was reduced through a cleanup on an aluminumcolumn (5 g) by using 75 mL of dichloromethane for fishsamples.
The extracts were combined and concentrated to 1 mL in arotary evaporator and the concentrate fractionated into aliphaticand aromatic hydrocarbon fractions in a silica gel column (1.5 g).The column was eluted first with 6 mL of hexane to removethe aliphatic hydrocarbon fraction. Further elution with 8 mLhexane/dichloromethane (1:1) was undertaken to extract the
Dow
nloa
ded
by [
Uni
vers
ity o
f C
alif
orni
a Sa
nta
Bar
bara
] at
12:
38 3
0 Se
ptem
ber
2013

260 T. F. Da Silva et al.
Table 2. Polycyclic aromatic hydrocarbons (PAHs) average recoveries(Rec), standard deviation (SD), and limit of detection (LOD) fromsediment and fish samples
Sediment Fish
Rec (%) LOD Rec (%) LOD(n = 9) SD (μg·Kg−1) (n = 15) SD (μg·Kg−1)
Nap 80 2.7 0.30 71 1.2 0.003Ace 69 1.6 0.10 81 0.8 0.003Acpt 74 2.2 0.30 87 1.4 0.03Fluo 62 7.3 0.03 94 0.3 0.06Phen 78 6.1 0.03 84 0.3 0.06Ant 75 2.5 0.01 72 0.1 0.03Flt 71 5.5 0.06 67 0.3 0.06Py 62 5.2 0.40 73 0.1 0.03Chry 75 1.2 0.10 92 0.1 0.09BaA 81 1.1 0.09 90 0.2 0.06BbF 92 6.2 0.30 90 0.2 0.03BkF 79 2.2 0.70 96 0.1 0.03BaP 108 7.4 0.30 92 0.1 0.03DBA 74 7.8 0.03 84 0.1 0.03BPe 67 8.1 0.40 81 0.1 0.03InP 82 3.1 0.50 72 0.2 0.03
PAHs (Zhou et al., 2000). All the extracts were concentrated,transferred to an autosampler microvial (250 μL), blown downwith N2 almost to dryness and finally made up to a volume of100 μL with hexane.
Gas Chromatographic—Mass Spectrometric Conditions
GC-MS analyses were carried out on a Hewlett-Packard Model5972 MSD coupled to a HP5890 GC (Agilent Technologies,Avondale, USA) using a capillary column coated with DB-5(J&W Scientific, 30 m × 0.25 mm i.d., 0.25 μm film thick-ness [Folson, CA, USA]). The column temperature for analyses
Table 3. Range of concentrations (μg/kg) of parent polycyclic aromatic hydrocarbons (PAHs) in fish andsediments from the two stations at the Guanabara Bay
Fish Sediment
South Limao Island Boca Larga Channel South Limao Island Boca Larga Channel
Compounds Min Max Mean Min Max Mean Min Max Mean Min Max Mean
Nap 0.02 27.4 4.1 1.44 2.7 0.6 0.1 4.3 2.2 0.1 1.3 0.7Acpt 0.1 5.9 1.8 0.1 10.9 2.5 1.4 1.5 1.5 0.3 1.3 0.8Ace 0.5 5.4 2.0 0.5 25.3 2.8 0.8 88.4 44.6 0.5 25.5 13.0Fluo 0.4 10.1 1.1 0.4 3.5 0.9 1.4 7.1 4.3 0.8 7.9 4.3Phen 0.6 27.4 2.3 0.5 32.3 2.8 15.0 23.4 19.2 11.4 26.6 19.0Ant 0.02 25.0 2.3 0.1 9.5 1.3 8.1 39.9 24.0 4.7 11.8 8.2Flt 0.01 39.3 4.4 0.2 22.3 2.6 2.4 42.2 22.3 36.9 65.1 51.0Py 0.04 14.2 1.9 0.1 8.6 1.0 28.2 34.2 31.2 25.2 29.9 27.6BaA 0.04 16.0 1.6 0.01 3.3 0.8 30.3 34.2 32.2 4.9 18.4 11.6Chry 0.03 9.0 2.0 0.02 5.2 1.2 27.8 48.9 38.4 4.3 22.1 13.2BbF 0.1 15.9 2.1 0.06 2.5 0.7 22.3 42.6 32.5 5.1 18.9 12.0BkF 0.1 46.5 5.1 0.03 8.3 2.9 16.0 28.1 22.0 3.2 13.3 8.3BaP 0.01 2.5 0.6 0.1 3.1 0.8 21.7 34.4 28.1 5.8 19.0 12.4InP 0.1 0.7 0.4 0.2 0.5 0.4 12.4 23.9 18.2 6.6 7.2 6.9DBA 0.6 2.3 1.7 0.6 2.3 1.6 1.6 7.3 4.5 0.4 1.7 1.1BPe 0.4 0.7 0.5 0.4 0.8 0.6 7.6 10.1 8.9 2.3 4.2 3.3
was programmed from 60 to 300◦C at a rate of 8◦C.min−1, andheld at 300◦C for 15 min. The injector was heated at 290◦C. Hewas used as carrier gas. Data acquisition was in electron impact(70 eV) and selected ion monitoring (SIM) mode was used. Thestandard PAH mixture was also analyzed in linear scan mode inthe mass range of 50–400 Daltons. Two characteristic ions wereselected for each compound, which together with their reten-tion times, allowed for their identification in SIM mode. Beforeanalysis, relevant standards were run to check column perfor-mance, peak height, and resolution. With each set of samples tobe analyzed, a solvent blank and a standard mixture were runin sequence to check for contamination, peak identification, andquantification.
Recoveries
Sediment and fish previously exhaustively extracted in a Soxhletapparatus were used for extraction recovery evaluation and tocalculate detection limits with five different concentrations. Thestandards were spiked in 8 g of dry sediment or fish to givefinal concentrations (n = 3 each concentration) in a range of1–20 μg/kg, 10–200 μg/kg, and 100–2000 μg/kg for the PAHmixture. For the fish samples the concentration (n = 3 eachconcentration) range was 1–20 μg/kg, 5–100 μg/kg, and 10–200 μg/kg. Internal calibration with pyrene-d10 was used forquantification of the extracts.
Quantification
External standard calibration curves were used for quantifica-tion of the extracts in addition to the pyrene-d10 internal standard.Calibration graphs for SIM mode were plotted using four to six
Dow
nloa
ded
by [
Uni
vers
ity o
f C
alif
orni
a Sa
nta
Bar
bara
] at
12:
38 3
0 Se
ptem
ber
2013

PAHs from Guanabara Bay 261
points in the range of concentration 0.0025–4 μg/mL for thestandard solution mixture. PAHs average recoveries (Rec), stan-dard deviation (SD) and limit of detection (LOD) from sedimentand fish samples are presented in Table 2.
Recoveries for each individual PAH in fish samples were67%–96% (Table 3). According to the United States Environ-mental Protection Agency (US EPA) methods general charac-teristics, acceptable recovery values should be between 70 and130% with a maximum relative standard deviation of 30% (Hen-nion et al., 1994; Azevedo et al., 2000).
The calibration curves constructed were linear over therange of interest and the correlation coefficients for most com-pounds were >0.99, indicating good performance of the chro-matographic method. As shown in Table 2, detection limitsfor most compounds in fish samples were in the range of0.003–0.09 μg/kg. Good results were also observed for sedi-ment samples, with recoveries values between 62 and 108% anddetection limits in the range 0.01–0.7 μg/kg.
Results and Discussion
Sediment Pollution Levels
The total concentration of PAH in the four sediment samples var-ied from 79 to 487 μg/kg dry weight. Samples may be classifiedas highly contaminated if total PAH is >500 μg/kg, fairly con-taminated at 250 μg/kg to 500 μg/kg of total PAH, and slightlycontaminated samples if total PAH <250 μg/kg (Notar et al.,2001). Thus, the studied samples are considered slightly to fairlycontaminated.
For all 16 PAH studied, the maximum individual concen-tration determined was 88 μg/kg dry weight for acenaphthene,followed by fluoranthene and chrysene (Table 3). These PAHsare main compounds from combustion (Yunker and Macdonald,1995). On average, the sediment samples contained predomi-nantly high molecular weight PAHs (73% of total), which alsoindicates combustion sources.
The concentration of individual PAHs were less than thesediment quality criteria proposed by US EPA (1993) for thethree PAHs: fluoranthene (3,000 μg/kg dry wt.), acenaphthylene(2,400 μg/kg) and phenanthrene (2,400 μg/kg), hence sedimentPAH would not be anticipated to cause any adverse biologicaleffect (Silva, 2004).
A full evaluation of PAH contents in sediments in this areawere undertaken previously by Meniconi et al. (2002) and Silvaet al. (2006, 2007). The total sedimentary PAH levels in thisstudy, 79–487 μg/kg, have decreased since 2000. In 2000, 10days after the oil spill accident, Meniconi et al. (2002) found 91–8,035 μg/kg total PAHs. Comparison of the present results withcoastal sediments both Brazilian and worldwide shows that thepresent Guanabara Bay results are also lower than the observed inPatos Lagoon Estuary, 39–11,780 μg/kg (Medeiros et al., 2005)and Santos, 80–15,389 μg/kg (Medeiros and Bıcego, 2004).
A review of published studies of PAH in near-shore surfacemarine sediments from Australia indicated concentrations of
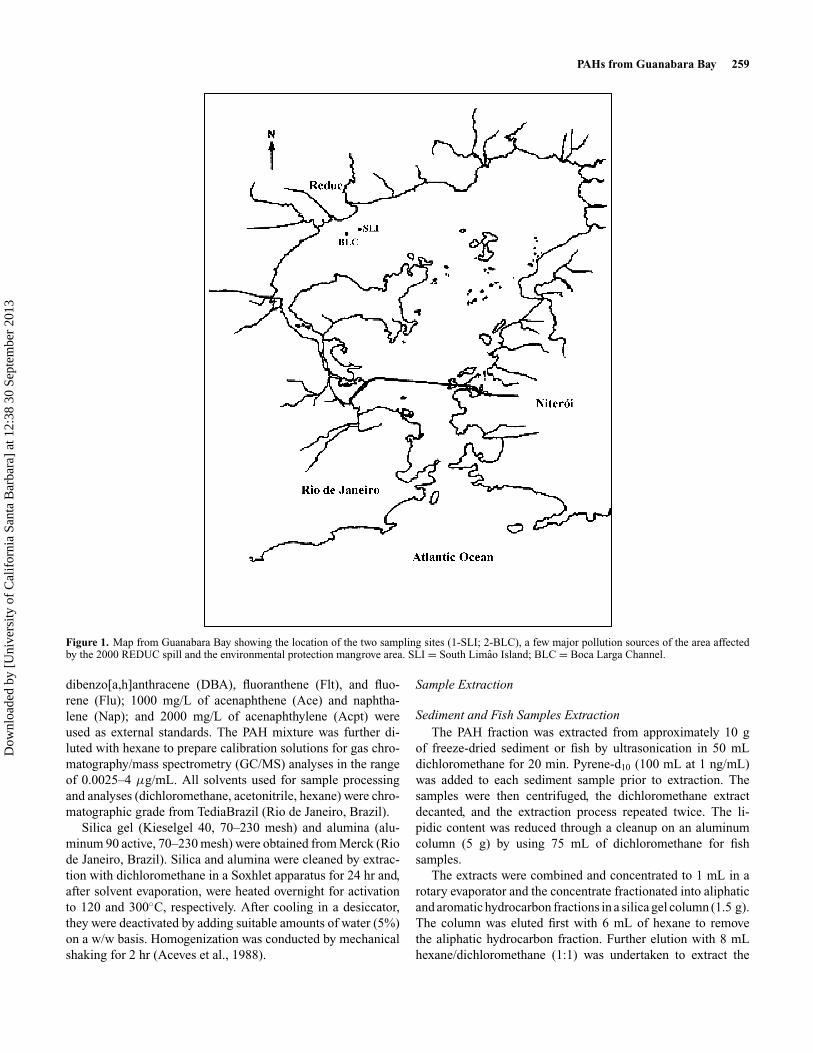
Figure 2. Average individual polycyclic aromatic hydrocarbon (PAH)distribution in fish samples: (A) July; (B) August; 1. Naphthalene;2. Acenaphtylene; 3. Acenaphthene; 4. Fluorene; 5. Phenanthrene;6. Anthracene; 7. Fluoranthene; 8. Pyrene; 9. Benzo[a]anthracene;10. Chrysene; 11. Benzo[b]fluoranthene; 12. benzo[k]fluoranthene; 13.Benzo[a]pyrene; 14. Indeno[1,2,3-cd]pyrene; 15. Dibenzo[a,h]anthracene;and 16. Benzo[g,h,i]perylene.
4-ring PAHs in the thousands of μg/kg, with pyrene as highas 4970 μg/kg dry weight in urbanized and/or industrializedcatchments; such areas were considered to be highly polluted.In the present study, the maximum concentration determinedwas 34 μg/kg dry weight for pyrene (Table 3).
Polycyclic Aromatic Hydrocarbon in Fish
The concentration ranges of individual PAHs in fish and sedi-ment samples from Guanabara Bay analyzed for this study areshown in Table 3. The individual PAH concentrations in 80 sam-ples of fish tissue ranged from 0.01 to 46 μg/g dry weight, withthe highest concentrations detected in Micropogonias furnieri.In both months, Micropogonias furnieri showed higher averagePAH values over Mugil lisa (Figure 2, Table 4). The lowest andhighest total PAH concentrations in fish (sum of all detectedPAH; 3.7–52.6 μg/Kg, Table 4) were found for Mugil lisa (net)and Micropogonias furniere (trap), respectively.
Dow
nloa
ded
by [
Uni
vers
ity o
f C
alif
orni
a Sa
nta
Bar
bara
] at
12:
38 3
0 Se
ptem
ber
2013

262 T. F. Da Silva et al.
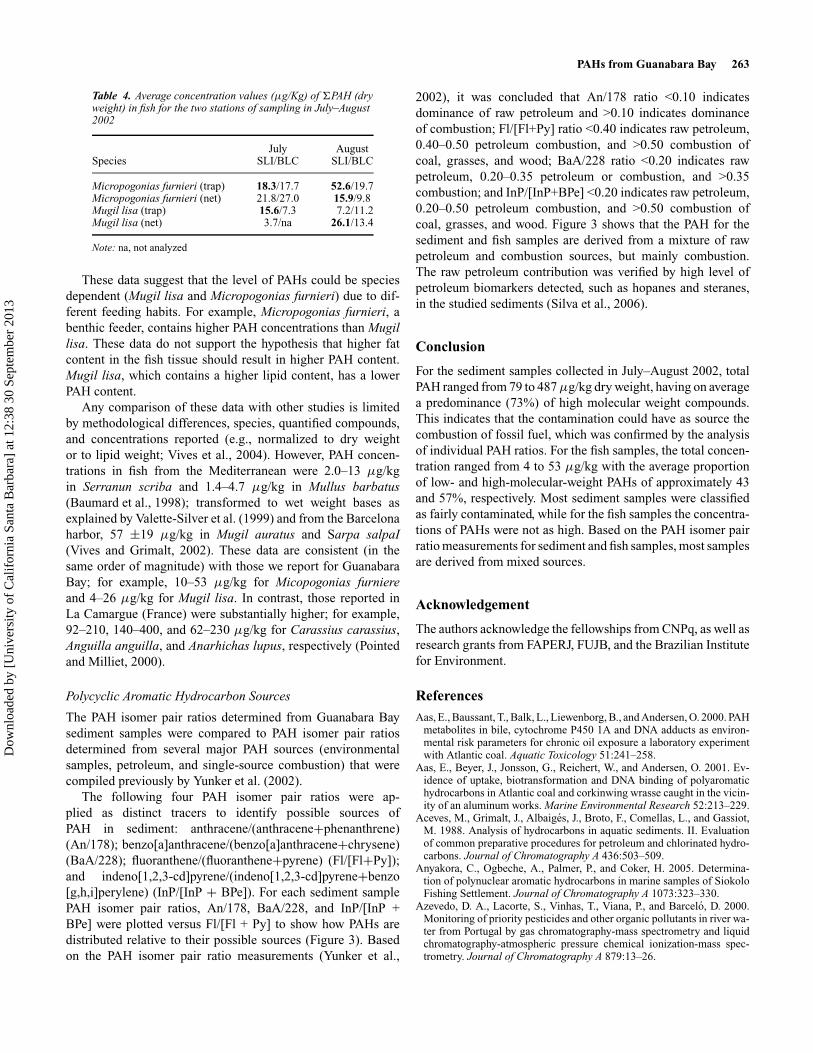
Figure 3. Plots of polycyclic aromatic hydrocarbon (PAH) isomer pair ratios for source identification in sediment samples: (I) An/178 versus Fl/[Fl+Py];(II) BaA/228 versus Fl/[Fl+Py], and (III) InP/[InP+BPe] versus Fl/[Fl+Py]. Isomer pair ratios were calculated for all individual stations. Sources boundarylines based on Yunker et al. (2002).
Dow
nloa
ded
by [
Uni
vers
ity o
f C
alif
orni
a Sa
nta
Bar
bara
] at
12:
38 3
0 Se
ptem
ber
2013
PAHs from Guanabara Bay 263
Table 4. Average concentration values (μg/Kg) of �PAH (dryweight) in fish for the two stations of sampling in July–August2002
July AugustSpecies SLI/BLC SLI/BLC
Micropogonias furnieri (trap) 18.3/17.7 52.6/19.7Micropogonias furnieri (net) 21.8/27.0 15.9/9.8Mugil lisa (trap) 15.6/7.3 7.2/11.2Mugil lisa (net) 3.7/na 26.1/13.4
Note: na, not analyzed
These data suggest that the level of PAHs could be speciesdependent (Mugil lisa and Micropogonias furnieri) due to dif-ferent feeding habits. For example, Micropogonias furnieri, abenthic feeder, contains higher PAH concentrations than Mugillisa. These data do not support the hypothesis that higher fatcontent in the fish tissue should result in higher PAH content.Mugil lisa, which contains a higher lipid content, has a lowerPAH content.
Any comparison of these data with other studies is limitedby methodological differences, species, quantified compounds,and concentrations reported (e.g., normalized to dry weightor to lipid weight; Vives et al., 2004). However, PAH concen-trations in fish from the Mediterranean were 2.0–13 μg/kgin Serranun scriba and 1.4–4.7 μg/kg in Mullus barbatus(Baumard et al., 1998); transformed to wet weight bases asexplained by Valette-Silver et al. (1999) and from the Barcelonaharbor, 57 ±19 μg/kg in Mugil auratus and Sarpa salpaI(Vives and Grimalt, 2002). These data are consistent (in thesame order of magnitude) with those we report for GuanabaraBay; for example, 10–53 μg/kg for Micopogonias furniereand 4–26 μg/kg for Mugil lisa. In contrast, those reported inLa Camargue (France) were substantially higher; for example,92–210, 140–400, and 62–230 μg/kg for Carassius carassius,Anguilla anguilla, and Anarhichas lupus, respectively (Pointedand Milliet, 2000).
Polycyclic Aromatic Hydrocarbon Sources
The PAH isomer pair ratios determined from Guanabara Baysediment samples were compared to PAH isomer pair ratiosdetermined from several major PAH sources (environmentalsamples, petroleum, and single-source combustion) that werecompiled previously by Yunker et al. (2002).
The following four PAH isomer pair ratios were ap-plied as distinct tracers to identify possible sources ofPAH in sediment: anthracene/(anthracene+phenanthrene)(An/178); benzo[a]anthracene/(benzo[a]anthracene+chrysene)(BaA/228); fluoranthene/(fluoranthene+pyrene) (Fl/[Fl+Py]);and indeno[1,2,3-cd]pyrene/(indeno[1,2,3-cd]pyrene+benzo[g,h,i]perylene) (InP/[InP + BPe]). For each sediment samplePAH isomer pair ratios, An/178, BaA/228, and InP/[InP +BPe] were plotted versus Fl/[Fl + Py] to show how PAHs aredistributed relative to their possible sources (Figure 3). Basedon the PAH isomer pair ratio measurements (Yunker et al.,
2002), it was concluded that An/178 ratio <0.10 indicatesdominance of raw petroleum and >0.10 indicates dominanceof combustion; Fl/[Fl+Py] ratio <0.40 indicates raw petroleum,0.40–0.50 petroleum combustion, and >0.50 combustion ofcoal, grasses, and wood; BaA/228 ratio <0.20 indicates rawpetroleum, 0.20–0.35 petroleum or combustion, and >0.35combustion; and InP/[InP+BPe] <0.20 indicates raw petroleum,0.20–0.50 petroleum combustion, and >0.50 combustion ofcoal, grasses, and wood. Figure 3 shows that the PAH for thesediment and fish samples are derived from a mixture of rawpetroleum and combustion sources, but mainly combustion.The raw petroleum contribution was verified by high level ofpetroleum biomarkers detected, such as hopanes and steranes,in the studied sediments (Silva et al., 2006).
Conclusion
For the sediment samples collected in July–August 2002, totalPAH ranged from 79 to 487 μg/kg dry weight, having on averagea predominance (73%) of high molecular weight compounds.This indicates that the contamination could have as source thecombustion of fossil fuel, which was confirmed by the analysisof individual PAH ratios. For the fish samples, the total concen-tration ranged from 4 to 53 μg/kg with the average proportionof low- and high-molecular-weight PAHs of approximately 43and 57%, respectively. Most sediment samples were classifiedas fairly contaminated, while for the fish samples the concentra-tions of PAHs were not as high. Based on the PAH isomer pairratio measurements for sediment and fish samples, most samplesare derived from mixed sources.
Acknowledgement
The authors acknowledge the fellowships from CNPq, as well asresearch grants from FAPERJ, FUJB, and the Brazilian Institutefor Environment.
References
Aas, E., Baussant, T., Balk, L., Liewenborg, B., and Andersen, O. 2000. PAHmetabolites in bile, cytochrome P450 1A and DNA adducts as environ-mental risk parameters for chronic oil exposure a laboratory experimentwith Atlantic coal. Aquatic Toxicology 51:241–258.
Aas, E., Beyer, J., Jonsson, G., Reichert, W., and Andersen, O. 2001. Ev-idence of uptake, biotransformation and DNA binding of polyaromatichydrocarbons in Atlantic coal and corkinwing wrasse caught in the vicin-ity of an aluminum works. Marine Environmental Research 52:213–229.
Aceves, M., Grimalt, J., Albaiges, J., Broto, F., Comellas, L., and Gassiot,M. 1988. Analysis of hydrocarbons in aquatic sediments. II. Evaluationof common preparative procedures for petroleum and chlorinated hydro-carbons. Journal of Chromatography A 436:503–509.
Anyakora, C., Ogbeche, A., Palmer, P., and Coker, H. 2005. Determina-tion of polynuclear aromatic hydrocarbons in marine samples of SiokoloFishing Settlement. Journal of Chromatography A 1073:323–330.
Azevedo, D. A., Lacorte, S., Vinhas, T., Viana, P., and Barcelo, D. 2000.Monitoring of priority pesticides and other organic pollutants in river wa-ter from Portugal by gas chromatography-mass spectrometry and liquidchromatography-atmospheric pressure chemical ionization-mass spec-trometry. Journal of Chromatography A 879:13–26.
Dow
nloa
ded
by [
Uni
vers
ity o
f C
alif
orni
a Sa
nta
Bar
bara
] at
12:
38 3
0 Se
ptem
ber
2013

264 T. F. Da Silva et al.
Baumard, P., Budzinski, H., Garrigues, P., Sorbe, J. C., Burgeot, T., andBellocq, J. 1988. Concentrations of PAHs (polycyclic aromatic hydrocar-bons) in various marine organisms in relation to those in sediments andto trophic level. Marine Pollution Bulletin 12:951–960.
Carreira, R. S., Wagener, A. L. R, and Readman, J. W. 2004. Sterols asmarkers of sewage contamination in a tropical urban estuary (GuanabaraBay, Brazil): Space-time variations. East Coast and Shelf Science 60:587–598.
Collier, T., and Varanasi, U. 1991. Hepatic activities of xenobiotic metabo-lizing enzymes and biliary levels of xenobiotics in English sole (Paraphrysvetulus) exposed to environmental contaminants. Archives of Environmen-tal Contamination and Toxicology 29:462–473.
E&P Forum. 1994. North Sea produced water: Fate and effects in the marineenvironment. E&P Forum Report No 2.62/204, London, UK. EuropeanEnergy Forum Bruxelles, Belgium.
EPA. 1997. Guidance for assessing chemical contamination data for usein fish advisories. In ONU–International Maritime Organization (IMO)–Implementation of the OPRC convention and the OPPR conference reso-lutions/Guidelines for fisheries management during and after oil pollutionincident. April 1999.
Fernandez, M. A., Wagener, A. L. R., Limaverde, A. M., Scofield, A. L.,Pinheiro, F. M., and Rodrigues, E. 2005. Imposex and surface sedimentspeciation: A combined approach to evaluate organotin contamination inGuanabara Bay, Rio de Janeiro, Brazil. Marine Environmental Research59:435–452.
GESAMP. 1993. Impact of oil and related chemicals and wastes on themarine environment. GESAMP Reports and Studies No. 50. InternationalMaritime Organization Publisher. (IMO) London, UK.
Haugland, C., Ugland, K. Y., Borseth, J. F., and Aas, E. 2005. Polycyclicaromatic hydrocarbons in capelin (Mallotus villosus) in the Barents Seaby use of fixed wavelength fluorescence measurements of bile samples.Marine Pollution Bulletin 50:95–104.
Hennion, M. C., Pichon, V., and Barcelo, D. 1994. Surface water analysis(trace-organic contaminants) and EC regulations. Trends in AnalyticalChemistry 13:361–372.
IBGE, 2003. Census. 2000. Instituto Brasileiro de Georgrafia e Estatistica.Rio de Janeiro, Brazil.
Medeiros, P. M., and Bıcego, M. C. 2004. Investigation of natural and an-thropogenic hydrocarbon inputs in sediments using geochemical marker.I. Santos, SP–Brazil. Marine Pollution Bulletin 49:761–769.
Medeiros, P. M., Bıcego, M. C., Castelao, R. M., Rosso, C. D., Fillmann, G.,and Zamboni, A. J. 2005. Natural and anthropogenic hydrocarbon inputsto sediments of Patos Lagoon Estuary, Brazil. Environment International31:77–87.
Meniconi, M. F. G., Gabardo, I. T., Carneiro, M. E. R., Barbanti, S. M.,Silva, G. C., and Massoni, C.G. 2002. Brazilian oil spill chemical char-acterization case studies. Environmental Forensics 3:303–321.
Meniconi, M. F. G., Santos, A. F., Salmito, T. M. C., et al. 2001. Fisheriessafety monitoring in the Guanabara Bay, Brazil, following a marine fuel.In Proceedings of the Oil Spill International Oil Spill Conference, March26–29, American Petroleum Institute, Tampa, FL.
Notar, M., Leskovsek, H., and Faganeli, J. 2001. Composition, distributionand sources of polycyclic aromatic hydrocarbons in sediment of the Gulfof Trieste, Northern Adriatic Sea. Marine Pollution Bulletin 42:36–44.
Pointed, K., and Milliet, A. 2000. PAHs analysis of fish whole gall bladdersand liver from the Natural Reserve of Camargue by GC/MS. Chemosphere40:293–299.
Rand, G. M. 1995. Fundamentals of aquatic toxicology—Effects, environ-mental fate, and risk assessment, 2nd ed. Philadelphia, PA: Taylor andFrancis.
Saxton WL, Newton R. T., Rorberg J., Sutton J., and Johnson L. E. 1993.Polycyclic aromatic hydrocarbons in seafood from the gulf of Alaska fol-lowing a major crude oil spill. Bulletin of Environmental Contaminationand Toxicology 50:515–522.
Silva, T. F. 2004. Monitoramento de Hidrocarbonetos PolicıclicosAromaticos na Baia de Guanabara: Sedimentos, Aguas e Peixes. Mas-ter’s dissertation, Federal University of Rio de Janeiro, Brazil .
Silva, T. F., Azevedo, D. A., and Aquino Neto, F. R. 2007. Distribution ofpolycyclic aromatic hydrocarbons in surface sediments and water fromGuanabara Bay, Brazil. Journal of the Brazilian Chemistry Society (inpress).
Silva, T. F., Medeiros, C. M., Azevedo, D. A., and Aquino Neto, F. R. 2006.Hydrocarbons in surface sediments from Guanabara Bay, Brazil.In Pro-ceedings of the 10th Latin American Congress on Organic Geochemistry,Extended Abstract Volume, 269–272, Salvador: Brazil.
Stolyhwo, A., and Sikorski, Z. E. 2005. Polycyclic aromatic hydro-carbons in smoked fish—A critical review. Food Chemistry 91:303–311.
US EPA. 1993. Proposed sediment quality criteria for the protection ofbenthic organisms. EPA-882-R-93-012, EPA-882-R-93-013, EPA-882-R-93-014, Washington, DC: US Environmental Protection Agency, Officeof Water.
Vallette-Silver, N., Hameedi, M. J., Efurd, D. W., and Robertson, A. 1999.Status of the contamination in sediment and biota from the Western Beau-ford sea (Alaska). Marine Pollution Bulletin 38:702–722.
Varanasi, U., Brown, D. W., Hom, T., Burrows, D. G., Sloan, C. A., Field,L. J., Stein, J. E., Tilbury, K. L., McCain, B. B., and Chan, S., 1993. Vol. I.Survey of Alaskan Subsistence fish, Marine mammal, and invertebratesamples collected 1989–91 for exposure to oil spilled from the ExxonValdez. U.S. Dept. of Commerce, NOAA Technical Memorandum, NMFS-NWFSC-12, 110 p. Northwest Fisheries Science Center. Seattle, WA,USA.
Varanasi, U., Chan, S., MacLeod Jr., W. D., Stein, J. E., Brown, D. W.,Burrows, D. G., Tilbury, K. L., Landahl, J. T., Wigren, C. A., Hom, T.,and Pierce, S. M. 1990. Survey of Subsistence fish and shellfish for expo-sure to oil spilled from the Exxon Valdez First Year: 1989. U.S. Dept. ofCommerce, NOAA Technical Memorandum, NMFS-F/NWC-191, 151 p.Northwest Fisheries Science Center. Seattle, WA, USA.
Vives, I., and Grimalt, J. 2002. Method of integrated analysis of polycyclicaromatic hydrocarbons and organochlorine compounds in fish liver. Jour-nal of Chromatography B 768:247–254.
Vives, I., Grimalt, J. O., Fernandez, P., and Rosserand, B. 2004. Polycyclicaromatic hydrocarbons in fish from remote and high mountain lakes inEurope and Greenland. Science of the Total Environment 324:67–77.
Yunker, M. B., and Macdonald, R. W. 1995. Composition and origins ofpolyclyclic aromatic hydrocarbons in the Mackenzie River and on theBeaufort Sea shelf. Artic 48:118–129.
Yunker, M. B., Macdonald, R. W., Vingarzon, R., Mitchell, R. H., Goyette,D., and Sylvestre S. 2002. PAHs in the Fraser River basin: A criticalappraisal of PAH ratios as indicators of PAH source and composition.Organic Geochemistry 33:489–515.
Zhou, J. L., Hong, H., Zhang, Z., Maskaoui, K., and Chen, W. 2000. Multi-phase distribution of organic micropollutants in Xiamen Harbour, China.Water Research 34:2132–2150.
Dow
nloa
ded
by [
Uni
vers
ity o
f C
alif
orni
a Sa
nta
Bar
bara
] at
12:
38 3
0 Se
ptem
ber
2013