polychlorinated biphenyls (pcbs) in fish tissue from u.s ......sample collection collected one fish...
TRANSCRIPT
Polychlorinated Biphenyls (PCBs) in FishTissue from U.S. Fresh Waters:
Results from Major Rivers, the Great Lakesand other U.S. Lakes
NWQMC
May 4, 2016
Tampa, Florida
1U.S. Environmental Protection Agency
Authors
John Wathen, presenting author & Leanne Stahl
U.S. Environmental Protection Agency
Office of Water/Office of Science and Technology
Washington, DC
Anthony Olsen and Thomas Kincaid
U.S. Environmental Protection Agency
Office of Research and Development
National Ecological Exposure Research Laboratory,
Western Ecology Division, Corvallis, OR
Blaine Snyder Harry McCarty
Tetra Tech, Inc. CSGov, LLC, a CSRA Company
Owings Mills, MD Alexandria, VA
The views expressed in this presentation are those of the authors and do notnecessarily reflect the views or policies of the U.S. EPA or those of the U.S.
Government2
Context
U.S. Environmental Protection Agency 3
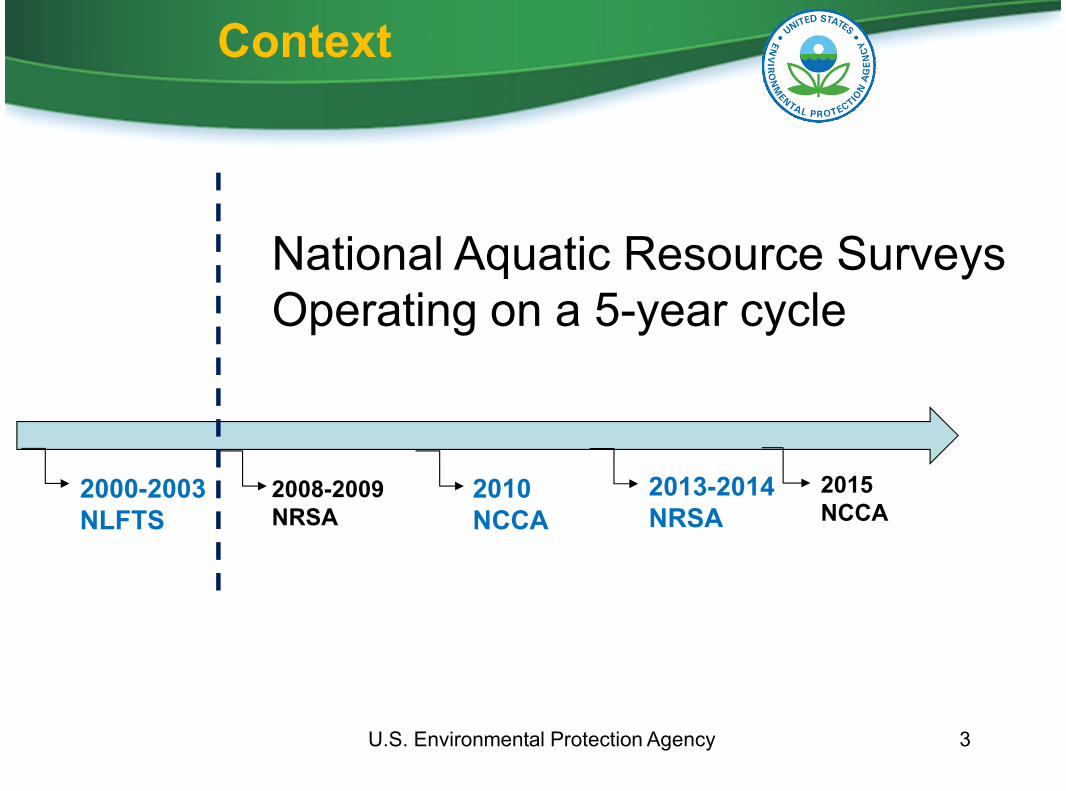
2015NCCA
2008-2009NRSA
2010NCCA
2013-2014NRSA
2000-2003NLFTS
National Aquatic Resource SurveysOperating on a 5-year cycle
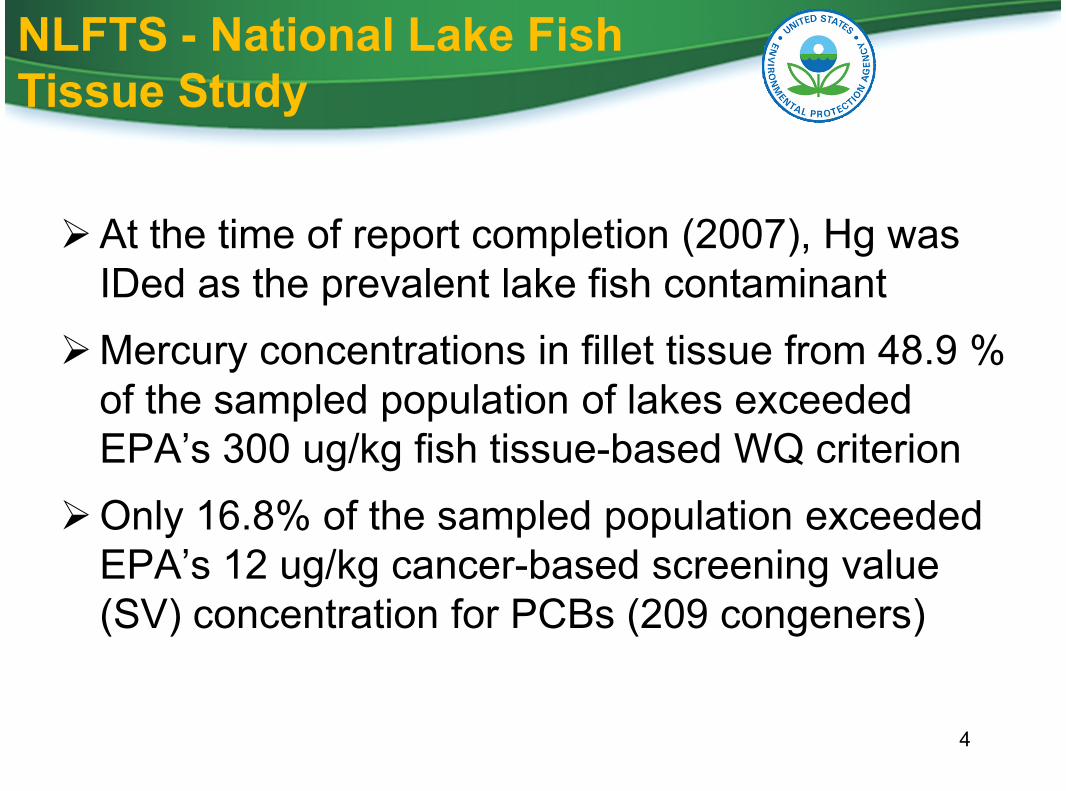
At the time of report completion (2007), Hg wasIDed as the prevalent lake fish contaminant
Mercury concentrations in fillet tissue from 48.9 %of the sampled population of lakes exceededEPA’s 300 ug/kg fish tissue-based WQ criterion
Only 16.8% of the sampled population exceededEPA’s 12 ug/kg cancer-based screening value(SV) concentration for PCBs (209 congeners)
4
NLFTS - National Lake FishTissue Study
PCB fish tissue concentration results wereelevated relative to other waters
There was not a comparable Great Lakesdata set (w/statistical sampling) with which tocompare across U.S. waters
SVs applied to the data were expanded toinclude EPA non cancer SV (47ug/kg) andtwo SVs developed by the Great Lakes SportFish Advisory Task Force (60 ug/kg- 1meal/week and 210 ug/kg- 1 meal/monthadvisory levels) 5
Great Lakes Human Health Fish Tissue Study
2010 NCCA - National CoastalCondition Assessment
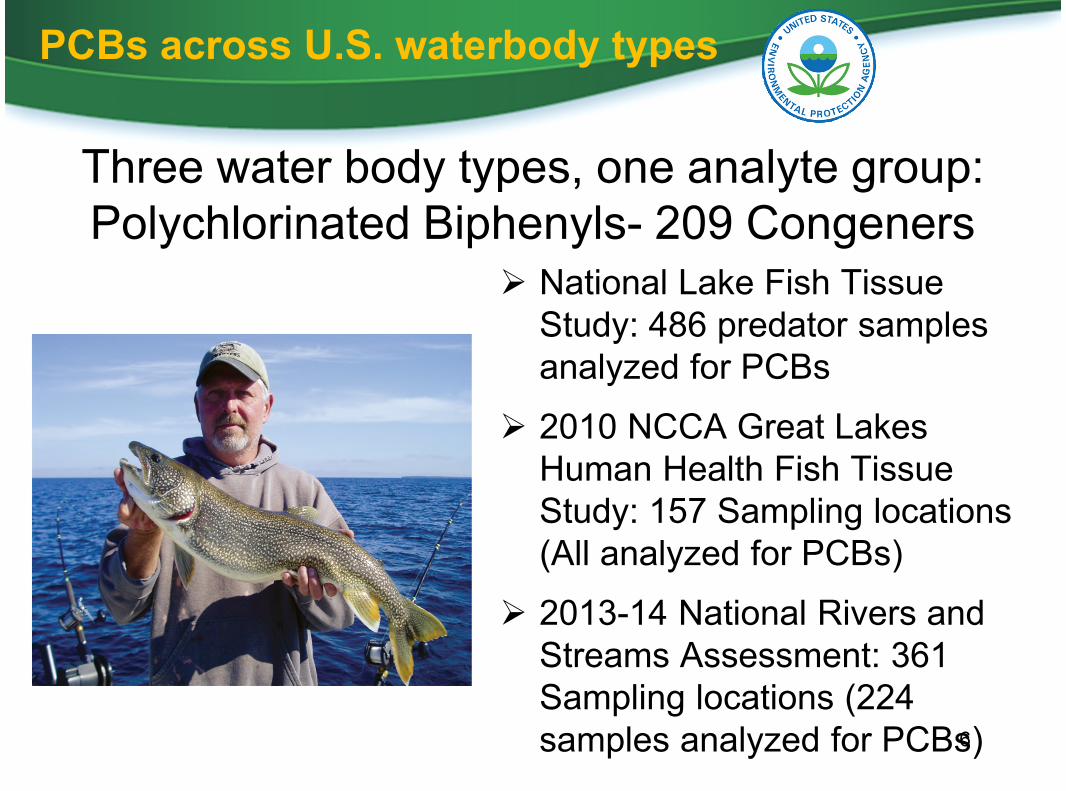
Three water body types, one analyte group:Polychlorinated Biphenyls- 209 Congeners
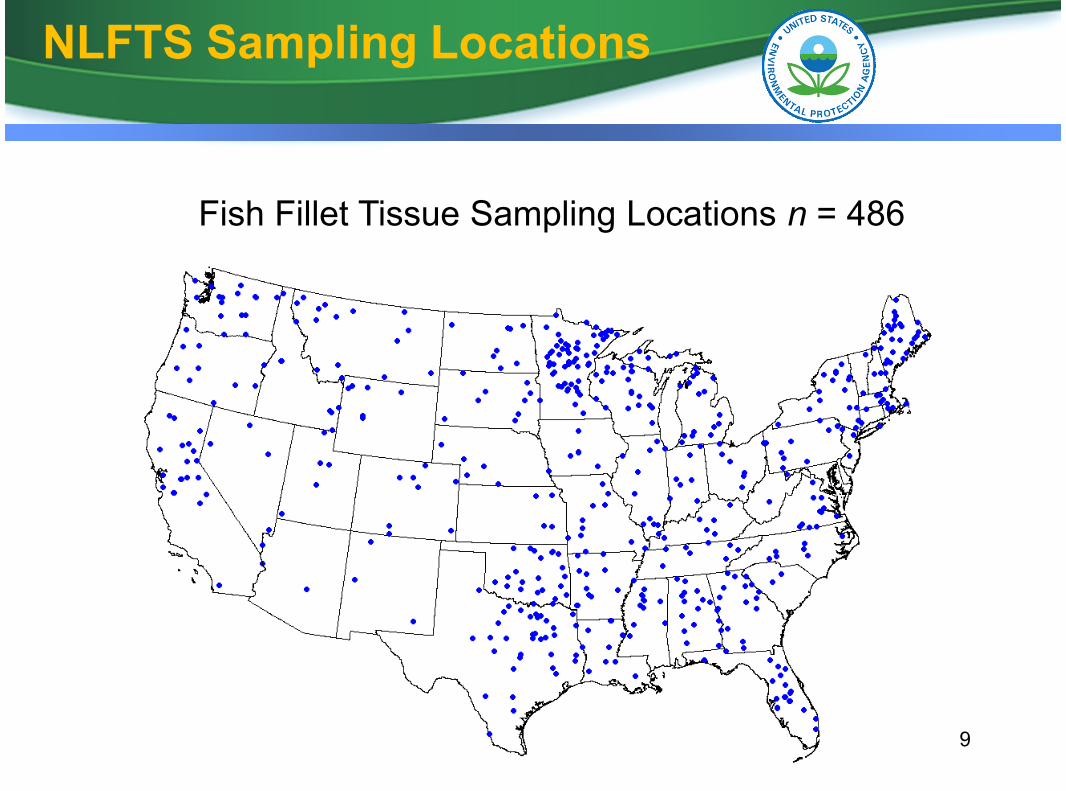
National Lake Fish TissueStudy: 486 predator samplesanalyzed for PCBs
2010 NCCA Great LakesHuman Health Fish TissueStudy: 157 Sampling locations(All analyzed for PCBs)
2013-14 National Rivers andStreams Assessment: 361Sampling locations (224samples analyzed for PCBs)6
PCBs across U.S. waterbody types
7
Random selection of lakes and reservoirs in 4national annual statistical subsets
500 lakes and reservoirs in the lower 48 statessampled over 4 years (2000-2003)
Lake criteria:
Permanent water body with permanent fish populationMinimum surface area of one hectare (~2.5 acres)1000 square meters of open, unvegetated waterDepth of at least one meter
National Lake Fish Tissue Study
National Lake Fish Tissue Study
Was the first national-scale statisticallyrepresentative freshwater fish contamination studyconducted in the U.S.
Other analytes included PBDEs, Hg, As, dioxinsand furans, organochlorine pesticides, organo-phosphate pesticides, SVOCs, not reported here.
8
9
NLFTS Sampling Locations
Fish Fillet Tissue Sampling Locations n = 486
Out of 1,808 sites on rivers and streams within theconterminous United States- 361 sites sampledon rivers 5th order or greater in size
Fillet tissue samples were analyzed for PCBsfrom fish samples collected at 224 of the sites,which represents a sampled population of 25,574river miles.
Other analyses not reported here:
Mercury
Perfluorinated compounds (PFCs)
10
2013-14 National Rivers andStreams Assessment
2013-14 National Rivers and StreamsAssessment
Randomized site selection process yieldsnationally and regionally representativeweighted results based on the study’sunequal probability design
Ecoregions: Eastern Highlands (EHIGH) Plains and Lowlands (PLNLOW) Western Mountains (WMTS)
Also nationally representative by urban andnon-urban census tract.
11
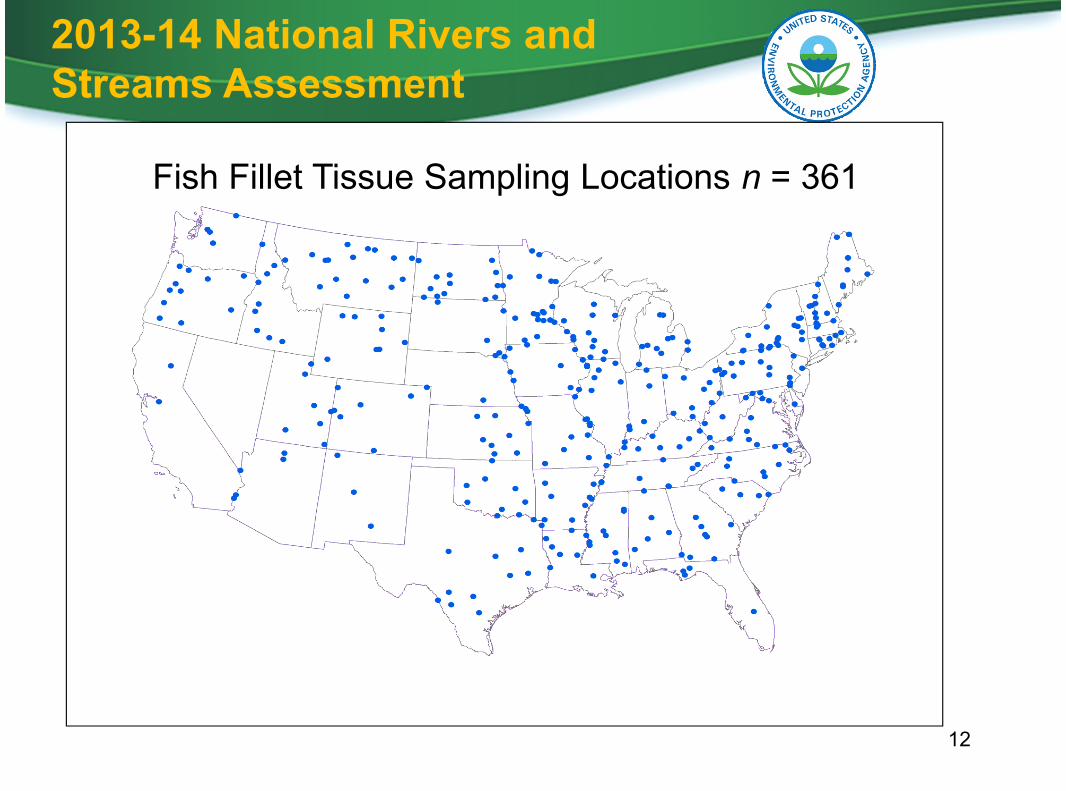
NRSA Sampling Locations n = 36112
2013-14 National Rivers andStreams Assessment
Fish Fillet Tissue Sampling Locations n = 361
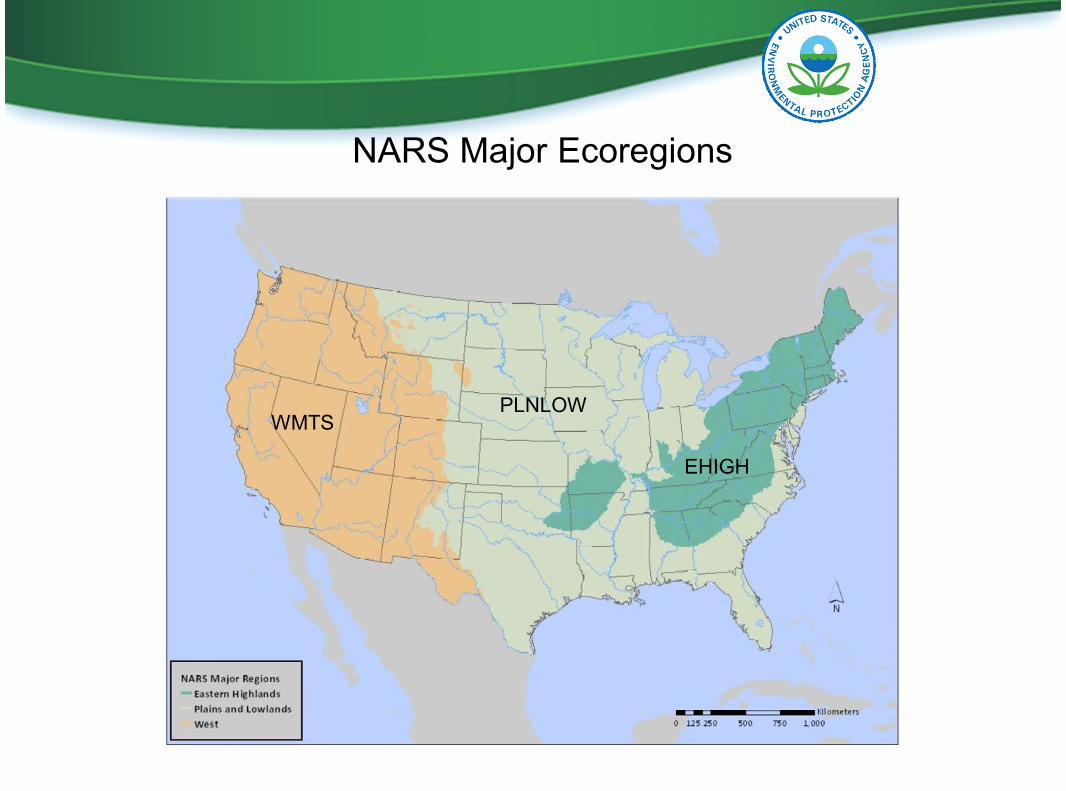
NARS Major Ecoregions
WMTSPLNLOW
EHIGH
U.S. Environmental Protection Agency 14
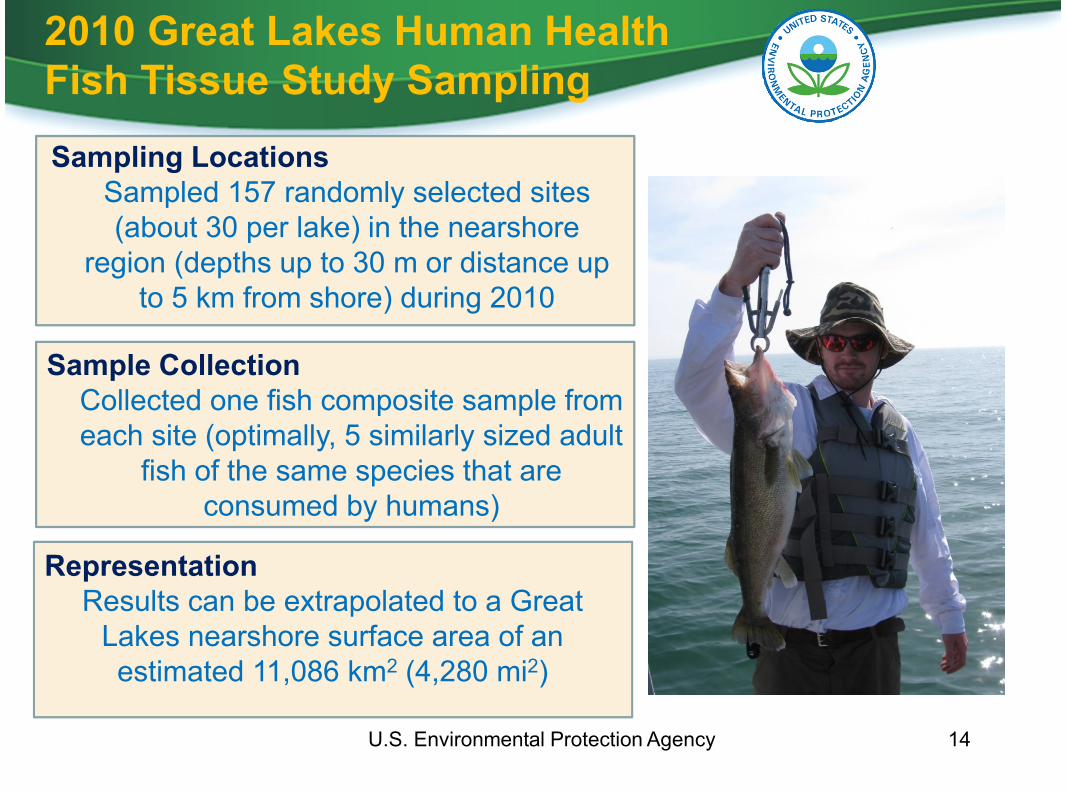
Sampling LocationsSampled 157 randomly selected sites(about 30 per lake) in the nearshore
region (depths up to 30 m or distance upto 5 km from shore) during 2010
Sample CollectionCollected one fish composite sample fromeach site (optimally, 5 similarly sized adult
fish of the same species that areconsumed by humans)
2010 Great Lakes Human HealthFish Tissue Study Sampling
RepresentationResults can be extrapolated to a Great
Lakes nearshore surface area of anestimated 11,086 km2 (4,280 mi2)
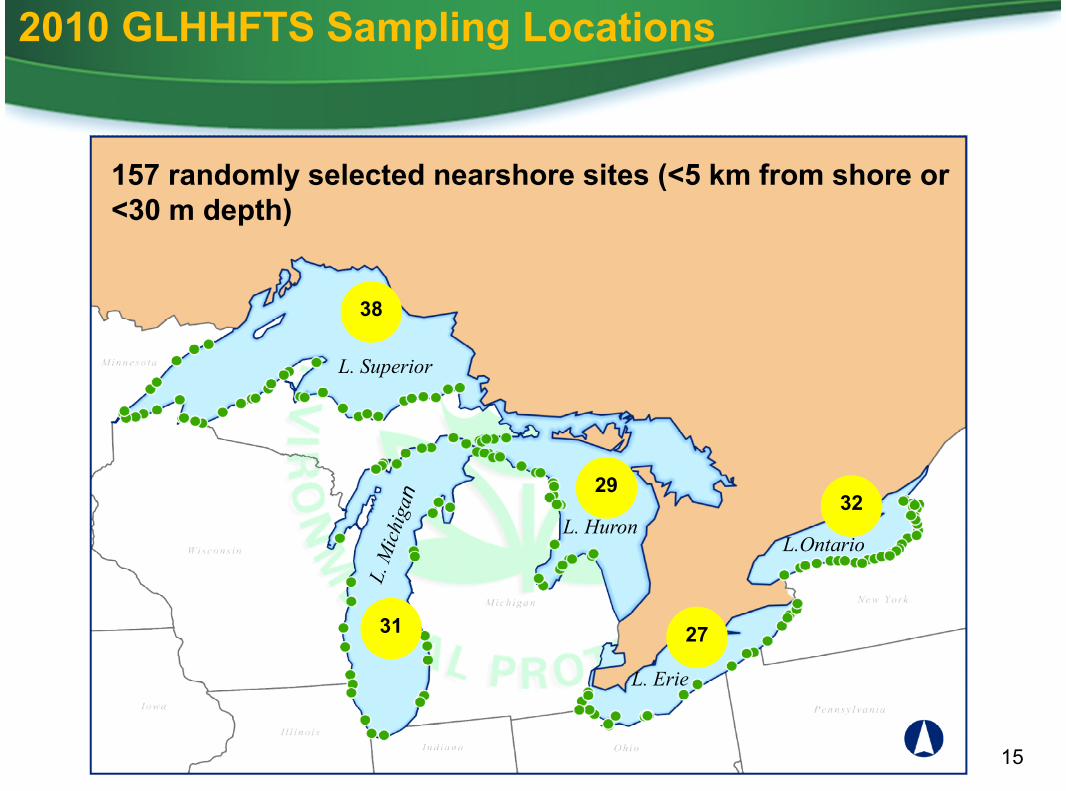
2010 GLHHFTS Sampling Locations
38
31 27
2932
157 randomly selected nearshore sites (<5 km from shore or<30 m depth)
15
L. Superior
L. HuronL.Ontario
L. Erie
16
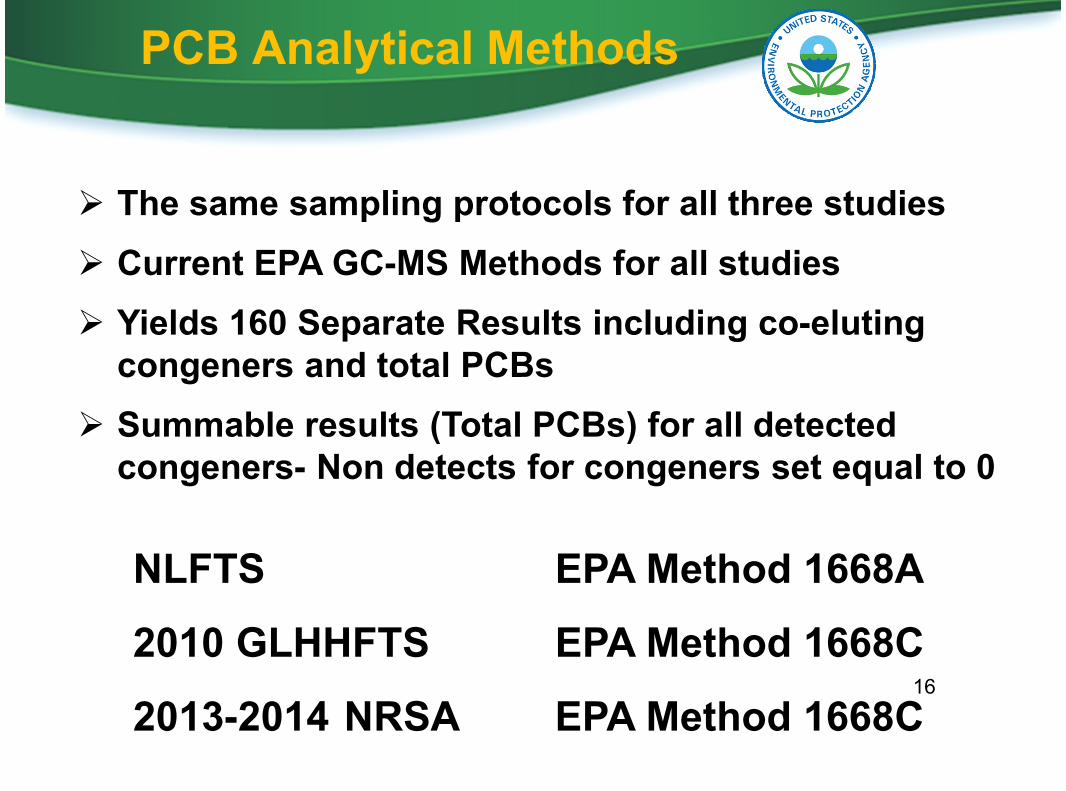
NLFTS EPA Method 1668A
2010 GLHHFTS EPA Method 1668C
2013-2014 NRSA EPA Method 1668C
PCB Analytical Methods
The same sampling protocols for all three studies
Current EPA GC-MS Methods for all studies
Yields 160 Separate Results including co-elutingcongeners and total PCBs
Summable results (Total PCBs) for all detectedcongeners- Non detects for congeners set equal to 0
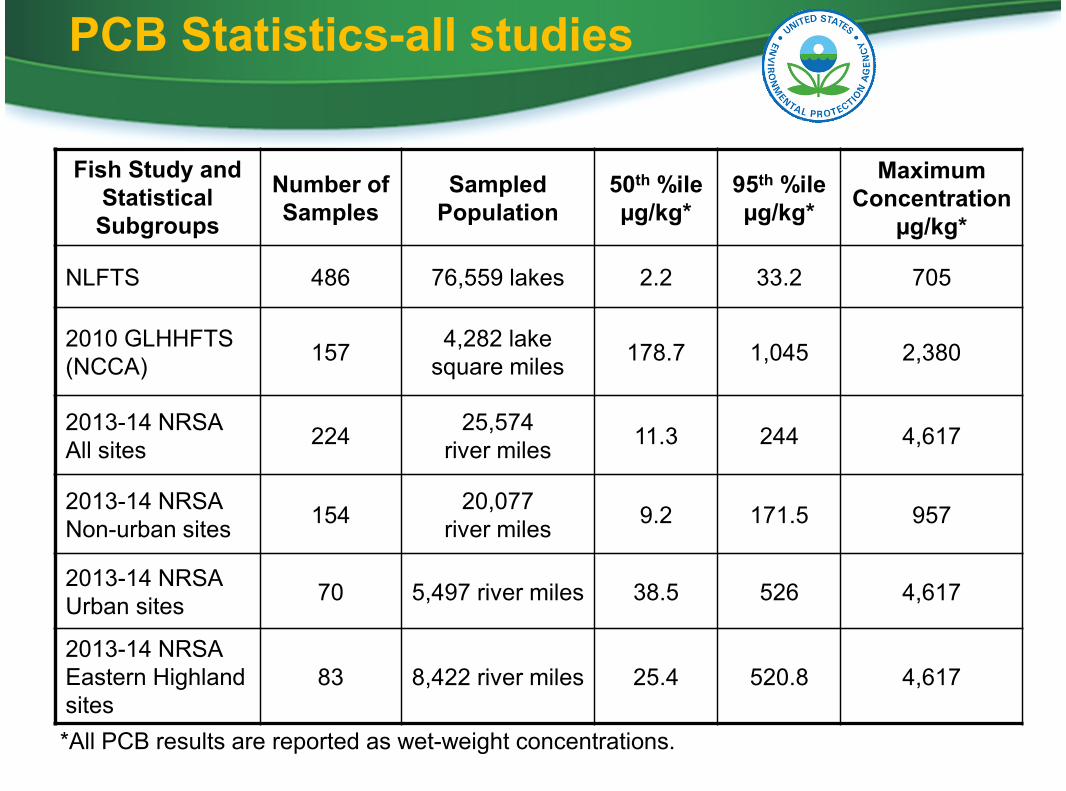
Fish Study andStatisticalSubgroups
Number ofSamples
SampledPopulation
50th %ileµg/kg*
95th %ileµg/kg*
MaximumConcentration
µg/kg*
NLFTS 486 76,559 lakes 2.2 33.2 705
2010 GLHHFTS(NCCA)
1574,282 lake
square miles178.7 1,045 2,380
2013-14 NRSAAll sites
22425,574
river miles11.3 244 4,617
2013-14 NRSANon-urban sites
15420,077
river miles9.2 171.5 957
2013-14 NRSAUrban sites
70 5,497 river miles 38.5 526 4,617
2013-14 NRSAEastern Highlandsites
83 8,422 river miles 25.4 520.8 4,617
PCB Statistics-all studies
*All PCB results are reported as wet-weight concentrations.
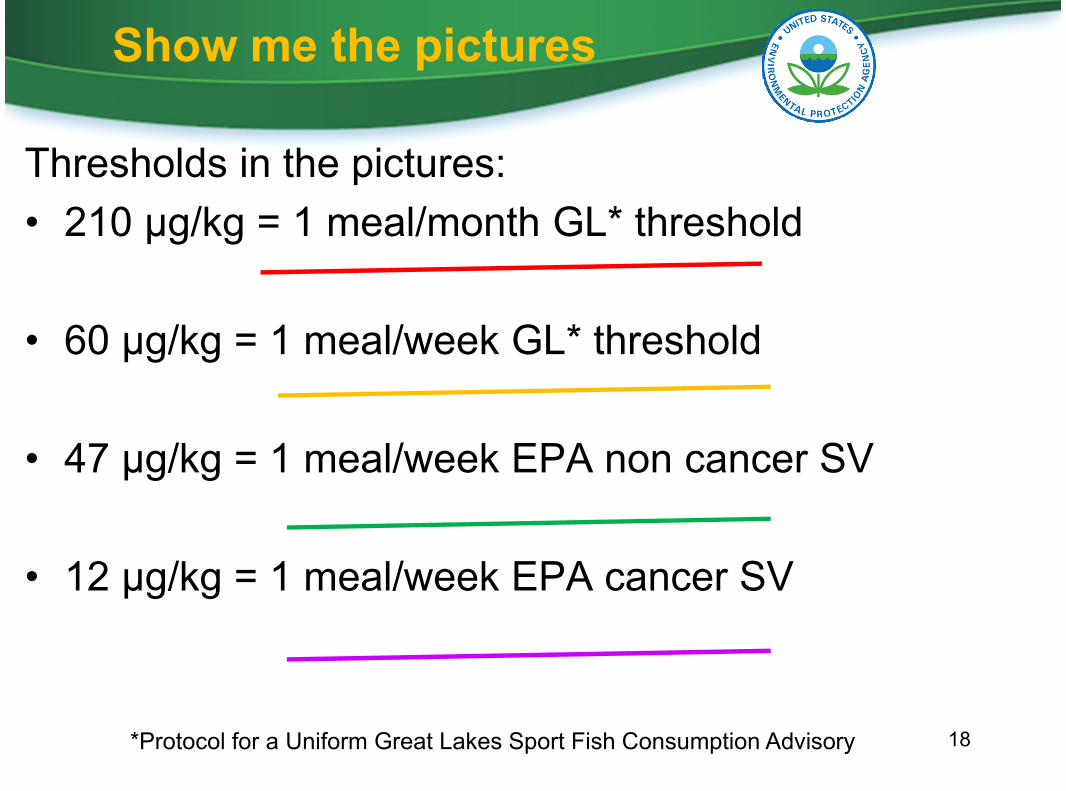
Show me the pictures
Thresholds in the pictures:
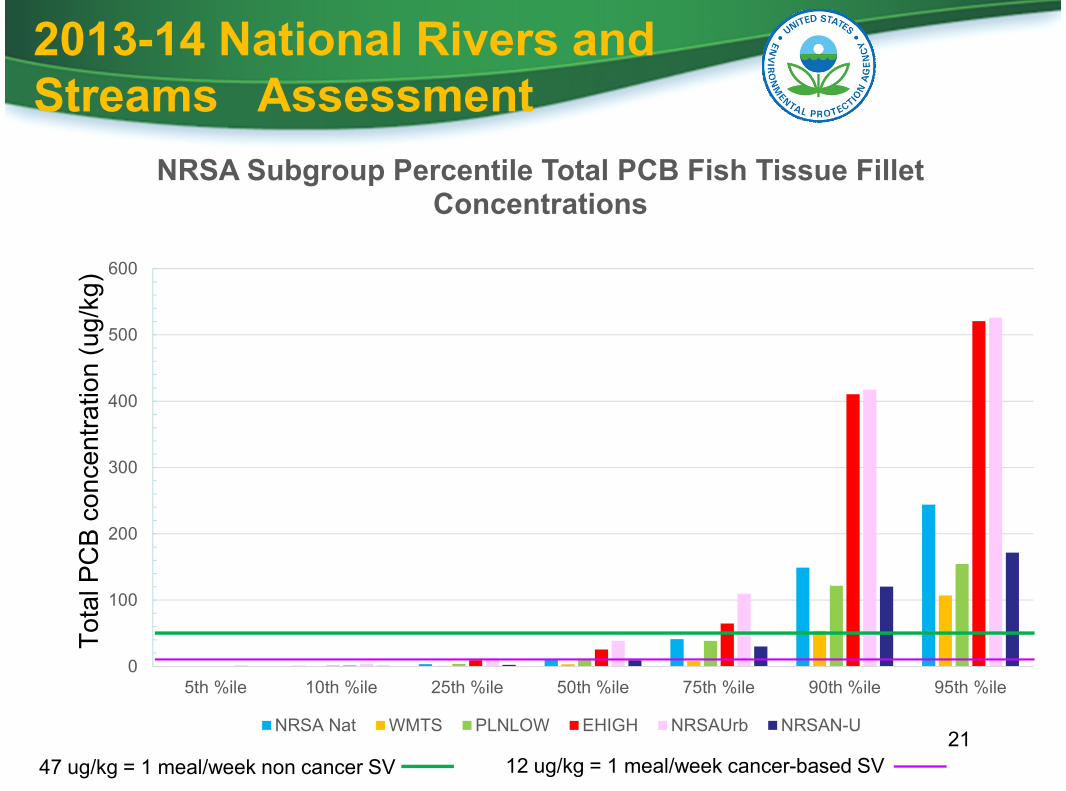
• 210 µg/kg = 1 meal/month GL* threshold
• 60 µg/kg = 1 meal/week GL* threshold
• 47 µg/kg = 1 meal/week EPA non cancer SV
• 12 µg/kg = 1 meal/week EPA cancer SV
*Protocol for a Uniform Great Lakes Sport Fish Consumption Advisory 18
19
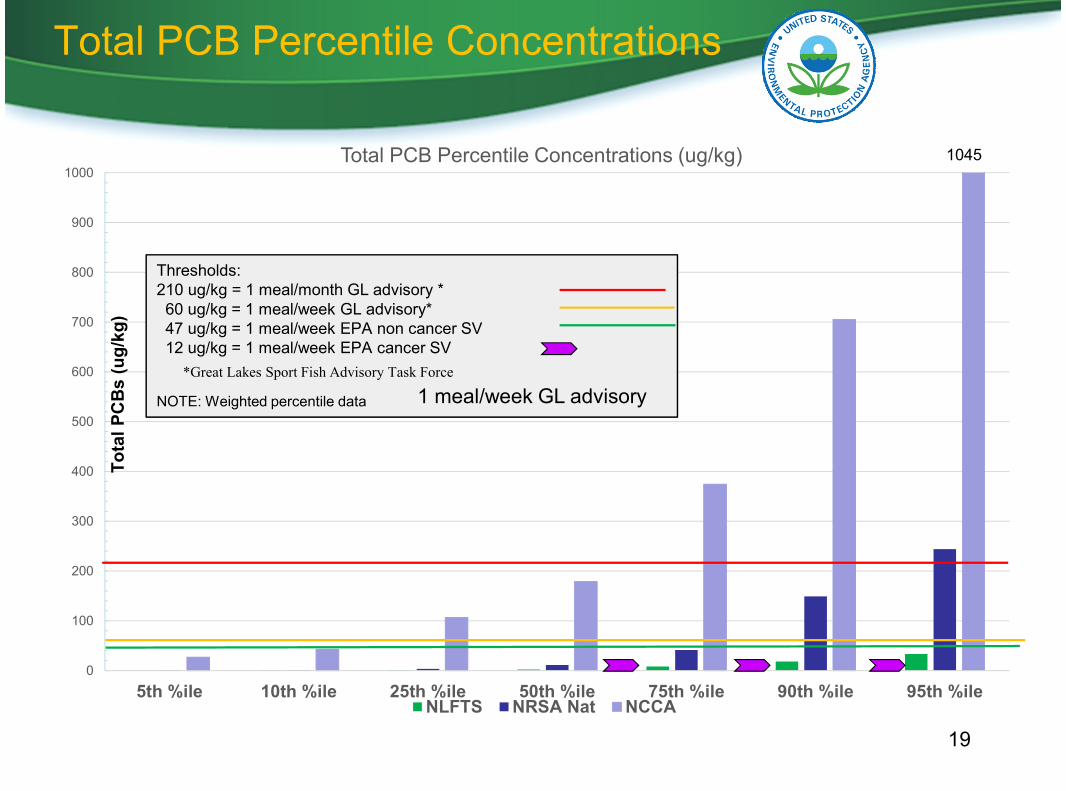
Total PCB Percentile Concentrations
0
100
200
300
400
500
600
700
800
900
1000
5th %ile 10th %ile 25th %ile 50th %ile 75th %ile 90th %ile 95th %ile
Total PCB Percentile Concentrations (ug/kg)
NLFTS NRSA Nat NCCA
Thresholds:210 ug/kg = 1 meal/month GL advisory *60 ug/kg = 1 meal/week GL advisory*47 ug/kg = 1 meal/week EPA non cancer SV12 ug/kg = 1 meal/week EPA cancer SV
NOTE: Weighted percentile data
1045
To
tal
PC
Bs
(ug
/kg
)
1 meal/week GL advisory
*Great Lakes Sport Fish Advisory Task Force
20
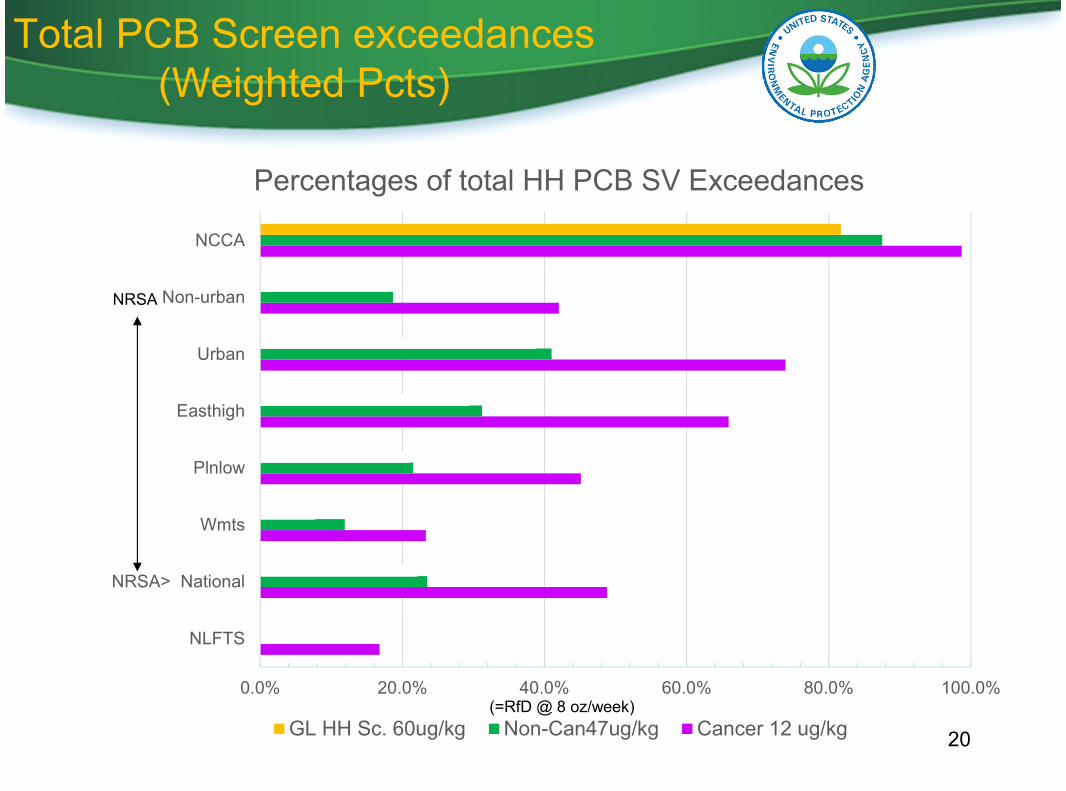
Total PCB Screen exceedances(Weighted Pcts)
0.0% 20.0% 40.0% 60.0% 80.0% 100.0%
NLFTS
NRSA> National
Wmts
Plnlow
Easthigh
Urban
Non-urban
NCCA
Percentages of total HH PCB SV Exceedances
GL HH Sc. 60ug/kg Non-Can47ug/kg Cancer 12 ug/kg(=RfD @ 8 oz/week)
NRSA
2013-14 National Rivers andStreams Assessment
21
0
100
200
300
400
500
600
5th %ile 10th %ile 25th %ile 50th %ile 75th %ile 90th %ile 95th %ile
NRSA Subgroup Percentile Total PCB Fish Tissue FilletConcentrations
NRSA Nat WMTS PLNLOW EHIGH NRSAUrb NRSAN-U
To
talP
CB
co
nce
ntr
atio
n(u
g/k
g)
47 ug/kg = 1 meal/week non cancer SV 12 ug/kg = 1 meal/week cancer-based SV
Summary
PCB concentrations in fish fillet tissue varymarkedly across types of U.S. waters:
Lakes and reservoirs<major rivers<Great Lakes
PCBs in fish tissue from major rivers vary byecoregion and between urban/non-urbansites
Application of additional human healthscreening values is useful for interpretingGreat Lakes PCB fish tissue data andcomparing concentrations among waters. 22
PCBs in U.S. Waters
That’s about it.Thanks for your attention
23