political persecution or economic deprivation? a time
TRANSCRIPT

1
Political Persecution or Economic Deprivation? A Time-Series Analysis of Haitian Exodus, 1990-2004
Stephen M. Shellman Department of International Affairs
University of Georgia [email protected]
&
Brandon Stewart Department of Government College of William & Mary
Authors’ Note: Stephen Shellman is an Assistant Professor in the Department of International Affairs at the University of Georgia, and previously held the rank of Visiting Assistant Professor at the College of William & Mary. Brandon Stewart is an undergraduate Government major at the College of William & Mary. We would like to thank Hongri Jiang and Andrew Reeves for their research assistance. We also wish to acknowledge support from several sources that made this study possible. The American Political Science Association’s Small Research Grant Program and the Chappell Faculty-Student Research Fellowship awarded by the Charles Center at William & Mary facilitated the completion of the study. Grants awarded by the National Science Foundation (SES 0516545 & 0214287) supported generation of the domestic and foreign conflict-cooperation data used in the study.
2
Abstract This study addresses the factors that lead individuals to flee their homes in search of
refuge. Many argue that individuals abandon their homes in favor of an uncertain life
elsewhere because of economic hardship, while others argue that threats to their lives,
physical person, and liberty cause them to flee. This study engages the debate by
analyzing flight patterns over time from Haiti to the United States as a function of
economic and security factors. Which factors have the largest influence on Haitian-U.S.
migratory patterns? Our results show that both economics and security play a role,
however, our analyses are able to distinguish between the effects of different individual
economic and security indicators on Haitian-U.S. migration. In particular, the time-series
analyses assess the impacts of important events in Haitian history on flight patterns such
as the 1991 and 2004 coups d'état.
3
This study explores the determinants of migration and attempts to differentiate the
impact of economic and political causes. More specifically, we focus on the economic
and security push and pull factors that cause people to flee their homes and seek refuge
abroad. Our motivating question is: What factors explain the variation in migration
movements over time? This study builds on previous work done at the global level; we
apply the arguments from that work to Haitian migrants over the period 1990-2004, and
test the implied hypotheses using time series data and methods. Moreover, we
independently model the short-run and long-run impacts of key political and economic
events (e.g. coups and sanctions) during the last 15 years on Haitian flight.
Skepticism over the label “refugee” used to describe Haitian immigrants to the
United States is common. Instead, many view such immigrants as fleeing economic
deprivation rather than political persecution. The view of Haitian migrants as
economically motivated contorts the meaning of the word “refugee” in the popular
lexicon. For example, in May of 2004, George W. Bush proclaimed that the U.S. “will
turn back any [Haitian] refugee that attempts to reach our shores.”1 At the time, a violent
uprising in Haiti causing bloodshed, death, and destruction had erupted. Many went so
far as to call it a coup. Yet, the Bush administration’s spin would have you believe that
those fleeing the country were “economic migrants.” According to the UN definition of a
refugee (one who, owing to a fear of persecution, has abandoned his or her home in favor
of relocating abroad) the US policy constitutes a direct violation of the 1951 Geneva
Convention and the principle of ‘nonrefoulment.’ State parties to the Convention are
legally bound to provide refuge to such persons and cannot forcibly return them to their
homeland if such a fear is demonstrable.
1 http://www.refintl.org/content/article/detail/3897
4
Just as the debate over what distinguishes “political refugees” from “economic
migrants/refugees” exists within policy communities, it also surfaces in the academic
literature. For example, both Moore and Shellman (2004a) and Schmeidl (1997) show
that while the size of the economy matters, violence in the country of origin has a larger
effect on refugee flows than macro-economic variables. Alternatively, Neumayer (2005a)
argues that economic hardship and economic discrimination lead to higher flows of
asylum seekers (to Western Europe) than political oppression and violent conflict. This
leads him to conclude that many asylum seekers are best described as “bogus refugees” in
search of a better life and economic well-being rather than genuine refugees fleeing
persecution.
Nevertheless, as Neumayer (2005a; 2005b) points out, this debate is an important
topic for myriad reasons. Asylum migration creates conflict within developed countries
as asylum and native populations clash. Moreover, origin and asylum countries’
governments may criticize each other for their policy choices. On the one hand, origin
governments may criticize receiving states for sheltering their dissidents. On the other
hand, receiving governments may be criticized by their own citizens for caring for
foreigners while not caring adequately for their own citizens. These scenarios can even
escalate to international and civil war (Saleyhan & Gleditsch 2004). Finally, many accuse
refugees of draining the economy because they often agree to work for lower wages than
the natives and generate unemployment for the state’s citizens (UNHCR 2002).
As a result, policy-makers face a decision as to how to respond to such
humanitarian crises. Loescher (1993) contends that all countries make asylum policies in
their own self-interest. Backlash policies to reduce immigration and asylum seekers are
often justified with the statements that many individuals seeking asylum and fleeing their
5
countries are not doing so in response to persecution, but instead, to economic
deprivation. Throughout history, the United States enforced a ‘stiff‘ policy towards
Haitian migrants. For example, once the Clinton Administration changed its policy on
interviewing interdicted persons at sea, National Security advisor, Samuel Berger,
commented that he was confident that 19 of every 20 Haitians would be found to be
economic refugees. 2 The statement illustrates the heart of the debate and its potential
policy implications.
This article builds on the Moore & Shellman (2004a; 2004b) global studies by
applying the argument contained therein and systematically evaluating its predictions in a
particular case over time. This study assesses the impacts that different economic and
security variables have on Haitian migration to the United States. Previous systematic
empirical investigations of asylum and refugee trends analyze annual-level data for many
countries, which only reveal the aggregate tendencies of migratory populations over
space and time.3 We argue that these data mask the details of the migration process.
Instead, we employ a longitudinal design to capture “an empirically rich dynamic
underlying the process tendencies” (Wood 1988, 229). We divide the temporal units into
weeks to provide a closer look at the migration process. This fine-grained temporal unit
provides better resolution for sensing the causal mechanisms at work (Wood 1988, 215).
Moreover, we use a quasi-experimental design (Campbell & Stanley 1966; Wood 1988)
to trace the impacts of particular events on migration over time. Using this method, we
can more readily detect the sequences, magnitudes, and durations of key events –like
policy shifts, coups d'état, and economic sanctions– on the migratory process. Finally, the
2 http://www.wpunj.edu/~newpol/issue17/dow17.htm 3 See Schmeidl (1997, 1998, 2000), Davenport, Moore & Poe (2003), Moore & Shellman (2004a), Neumayer (2005).

6
case study compliments other global studies and serves as one opportunity to evaluate the
applicability of general global models to a particular case.
The article proceeds as follows. First, we begin with a general argument about
when we should observe migration and the implied hypotheses. Then we discuss Haiti’s
politics and economics, as well as key events and their predicted effects on Haitian
migration. We then present our research design, which covers issues related to
measurement, specification, and estimation of statistical equations. Finally, we report our
results and conclude by discussing the implications of those results in terms of policy and
the literature.
The Argument & Hypotheses
In this study, we apply an argument consistent with that of Moore and Shellman
(2004a; 2004b) and Neumayer (2005a). In short, both arguments contend that individuals
will flee their homes when the costs of staying exceed the benefits. Moore and Shellman
(2004b) take it a step further and factor the costs and benefits of fleeing to another
country into the equation, such that the individual compares the costs and benefits of
staying in the origin country to those of going to the potential asylum country. We
similarly assume that to make such decisions, individuals examine the information
available to them in the origin and potential asylum environments.
We also assume that individuals are purposive and value their liberty, physical
person, and life in addition to economic prosperity. Moreover, they monitor their
environments and those around them to develop expectations about becoming a victim of
persecution as well as potential economic distress or opportunity. When economic
distress and/or the probability of being persecuted rises, the expected utility of staying
7
decreases while the utility of leaving increases. Finally, origin domestic policies and
asylum foreign policies will also affect individuals’ decisions. Below, we hypothesize
how economics, security, and domestic and foreign policies should influence migratory
flows.
Security
We identify two main sources of threat to the physical person of an individual. The first
is state-sponsored violence and the second is dissident/rebel violence. Most of the
literature tends to focus on state-sponsored violence. Some scholars focus on human
rights abuses (e.g. Gibney, Apodaca, and McCann 1996), while others focus on genocide
(e.g. Rummel 1994) or ethnic victimization (e.g. Kaufman 1998). Yet, others focus on
dissident violence and its threat to the population at large (e.g. Moore & Shellman
2004a). Previous studies find that human rights abuses and dissident violence increase the
annual expected number of asylum applicants in Western Europe (Neumayer 2005a) and
annual expected number of refugees around the globe (Moore & Shellman 2004a;
Davenport, et al. 2003). We similarly contend that as the publicly visible behavior of the
government and/or the dissidents becomes increasing hostile, larger numbers of
individuals will attempt to flee the country.
Economics
The second broad factor that should impact migration decisions is the economy. Bauer &
Zimmermann (1994) suggest that wage differential in the origin and destination countries
will be a key factor in international migration decisions. As the economy declines in the
origin country, potential foreign destination choices appear more attractive. Borjas (1994)

8
and Massey et al (1993) contend that workers migrate if they feel they can increase their
standards of living. As such, we submit that economic opportunity (or lack thereof) in the
origin country should affect migration, as well as economic opportunity in the potential
destination country. As the origin economy decreases in size, larger numbers of
individuals will migrate abroad. In contrast, as the potential destination country’s
economy increases in size, more individuals will migrate to that destination country.
Domestic Politics
Origin countries' emigration policies may aid or hinder refugees attempting to
leave the country. On the one hand, not all individuals subject to unbearable conditions in
their homelands are allowed to escape them. For example, few refugees were free to
leave Cambodia between 1975 and 1978 due to the sealing of the borders by the Khmer
Rouge. Similarly, in the mid-1920's the Soviet Union adopted a "no-exit" policy, which,
with minor exceptions, was maintained until the fall of the empire. Consequently,
following the initial large flows of refugees generated from the Russian Revolution, over
the long-term the Revolution generated smaller numbers than if it had not implemented
the no-exit policy. Zolberg et al. (1989, 17) believe that many would have left during the
“murderous collectivization drives and purges of the 1930's.” however, records indicate
that few did. On the other hand, many countries enact policies that provoke the exodus of
citizens and/or put no restrictions on exit. For example, Idi Amin, Uganda's dictator,
decided in 1972 to rid his country of the minority Indian population and put no
restrictions on emigration of the Indians. Given the argument, we expect that harsh exit
policies will lead to decreased migration, while liberal exit policies (especially those in
combination with repression) will facilitate migration.

9
Foreign Policy
Additionally, foreign policy should impact an individual’s decision to flee. In
particular, the potential destination country’s immigration policies may aid or hinder
refugees attempting to enter. Countries with strict entrance policies tend to turn refugees
away, whereas countries with liberal entrance policies allow more refugees to cross the
borders.
As Zolberg (1989, 6) correctly points out, "people cannot leave their country if
they have no place to go." Thus, government policies of potential host countries
determine the ease with which refugees can enter a particular country. Some policies
place restrictions on granting asylum even if individuals meet the UN declaration
definition. Zolberg (1989, 7) reports that some countries attempt to avert, flows and that
the best way to accomplish this is for both sending and receiving states to "slam the door
shut."
Still other countries have political motivations. For example, U.S. foreign policy
during the Cold War was extremely "anticommunist." Consequently over 95% of
refugees admitted to the United States between 1945 and 1989 were from communist
countries (Ferris 1998, 72). As a result, other peoples were denied asylum.
Thus implies that the degree to which countries restrict or open their borders to
migrants/refugees influences the number of migrants/refugees that flow between dyads
(origin to destination).
Similarly, if the origin and destination country are engaged in a political conflict
(armed or diplomatic), the flow of migrants between origin country and destination
country will decrease. Schmeidl (1997) argues that international conflict leads to a
decrease in refugee flight and an increase in internally displaced persons (those who flee
10
persecution but remain within their own borders). In the case of an armed conflict,
individuals are deterred from fleeing either into the conflict or to the rival state. When
hostilities cease, flows should increase from origin country to destination country.
Natural Disasters
Finally, natural disasters, like hurricanes, earthquakes, and volcanic eruptions, affect
one’s probability of dying and thus lead to changes in one’s cost/benefit calculus of
staying or going. Such disasters kill and injure many people, demolish homes and
buildings, and destroy crops and ultimately economies. As such we expect migration to
increase following natural disasters.
We choose to test these hypotheses with regard to Haitian migration to the United
States. So before we delve into the research design we briefly discuss the history of the
case. The Haiti discussion also generates a number of case-specific security and
economic hypotheses to test.
Haiti’s History & Case-Specific Hypotheses
The small Caribbean nation has an unfortunate history of political instability, social
unrest, and widespread poverty. In fact, 80% of the people live in poverty and in the last
15 years experienced two coups.4 As such, the case yields an interesting laboratory in
which to explore the effects of economics and security on migration.
Our analysis begins in the 1990’s, so we provide a more detailed overview of
Haiti’s history from 1990-2004 below and depict some major events during that period in
Figure 1. Within this overview, we hypothesize the effects of particular events on Haitian
4 CIA World Factbook http://www.cia.gov/cia/publications/factbook/print/ha.html

11
migration to the United States. We begin in the 1990’s with the time leading up to the
1991 coup and its hypothesized impact, and close by discussing the impact of the 2004
coup.
[Insert Figure 1 here]
The Duvaliers
To understand the current situation, we return to October 22, 1957 and the rise of
Francois Duvalier, also known as ‘Papa Doc.’ He rose to power following a string of
short-lived and politically unstable leaders and established the Tonton Macoutes, a militia
that terrorized the general public and enforced his will. After his death in April 1971, his
son Jean-Claude ‘Baby Doc’ Duvalier assumed control of the government. During Baby
Doc’s reign of political terror and oppression, migrants from Haiti frequently entered the
United States (legally and illegally), which led Ronald Reagan to enter into an
interdiction agreement with Jean-Claude Duvalier in 1981.
Prosper Avril
During the beginning of the 1990’s, Prosper Avril, a Duvalierist military general, headed
the regime. Avril rose to power in September of 1988 following a series of military
generals who had seized control of the government after Baby Doc’s exile. In the two
years from 1988 to 1990, he presided over a regime marked by political terror, which
managed to estrange almost every segment of Haitian society. Neither he nor the military
generals that preceded him took action against the remaining Tonton Macoutes. The
Haitian people were left to hunt them down themselves, beginning a trend of lawlessness
and vigilantism that would shape future resolutions of political affairs.5 In March 1990,
5 Sobaka Dossier http://www.diacritica.com/sobaka/dossier/pavril.html

12
Avril was forced from power by intense civil unrest, and General Herard Abraham
assumed the presidency until he could hand it over to Ertha-Pascal Trouillout, the
Supreme Court President, a few days later. President Trouillout remained president until
elections could be held.
Aristide’s First Term
In 1990, Jean Bertrand Aristide, a Catholic priest who was working in the slums of Port-
au-Prince, won the election with 67% of the vote. He had made a significant name for
himself by denouncing the Duvalierists and the Tonton Macoutes. He promised to act on
behalf of the poor in Haiti and to strive for national reconciliation. During the election he
formed the coalition “Lavalas Family,” which became one of the principle political
parties in Haiti. His inauguration was threatened by a coup attempt on January 6, 1991
led by Roger Lafontant, Interior Minister under Avril and former member of the Tonton
Macoutes. Former President Abraham condemned the coup and restored the government,
allowing the inauguration of Aristide to go ahead as planned.
After assuming office, Aristide began a program of careful reform. He retired
seven top military officials, replacing them with younger officers. He also began a
process of economic reform, pushing for the break-up of monopolies and curbing the
rampant tax evasion among the wealthy, while constantly reassuring the business
community. During his first months in office, Aristide accepted $511 million dollars in
grants and loans to facilitate economic growth.6 In the seven months between February 7
and September 30, 1991 there was a significant drop in Haitian emigrants, due most
likely, to Aristide’s enormous popularity.
6 White, Robert. “Haiti: Policy Lost, Policy Regained.” http://www.cosmos-club.org/journals/1996/robertwhite.html
13
1991 Coup
On September 30, 1991 a military coup led by Raoul Cédras, one of the generals
appointed to the high command by Aristide, deposed the government. Aristide fled to
exile in the United States while Cédras established control of the country. There was
widespread political violence in the first days following the coup. Haitian elites and
Cédras’ soldiers began destroying all the vestiges of Aristide’s regime and hunting down
Aristide supporters. Cédras appointed a provisional president, Joseph Nérette, October 8,
1991, but continued to maintain de facto control of the country.
We expect that the violent coup should generate a large number of migrants to
flee to the U.S. The probability of one’s persecution should rise as the military violently
takes over the government. However, as violence subsides and the situation stabilizes
itself, the number of migrants should decline. In sum, we hypothesize an inverted-U
relationship between time and migrants in the short-run following the 1991 coup. In other
words, we suspect that just after the coup, the number of migrants will rise sharply and
then fall over time.
OAS v. UN Economic Sanctions
Following the 1991 coup, economic sanctions were placed on Haiti by the Organization
of American States (OAS). The sanctions were implemented on October 4, 1991, with
the issuance of Executive Order No.12775, which declared a national emergency after the
overthrow of President Aristide and imposed limited sanctions on the acting regime.7 At
this time the OAS recommended that all member states "suspend their economic,
7 http://www.ndu.edu/inss/books/Books%20-%201997/Imposing%20International%20Sanctions%20-%20March%2097/chapter2.html
14
financial, and commercial ties with Haiti.”8 However, unlike UN sanctions under the UN
Charter, OAS sanctions are not binding to all members. The U.S., in particular, loosely
enforced the embargo and did not attempt to freeze the de facto regime’s assets (per the
OAS resolution) until late 1993. Other OAS members similarly did not enforce the
embargo. As a result, we suspect that the de facto regime was able to maintain power.
In contrast, on June 23, 1993, “the U.N. Council transformed a strictly voluntary
program of OAS regional sanctions into mandatory worldwide sanctions under Chapter
VII of the U.N. Charter.”9 This resolution led to an increase in monitoring and
enforcement activity. After all, the embargo was binding for all UN members. The U.S.
took things further by limiting air traffic to and from Haiti and offering assistance to the
Dominican Republic to facilitate their efforts enforcing the embargo. Over time,
multilateral cooperative efforts froze the de facto regime’s assets. Such sanctions brought
the coup plotters to the negotiating table, resulting in Aristide’s return.
Under foreign economic sanctions an individual’s economic prosperity suffers. As
such, we hypothesize that the OAS sanctions increase Haitian migration to the U.S.
However, the UN Sanctions should have an even greater impact on migrants seeking
refuge in the U.S. Specifically, we argue that immediately following the implementation
of the UN sanctions, the number of Haitian migrants will increase to a point and then
decrease as negotiations between the de facto regime and the U.S. increase and the
reinstallation of Aristide nears. Similar to our hypothesis about the effect of the 1991
coup on migration, we contend that the functional form of the relationship between time
and migration during the UN sanction period should be inverted-U shaped.
8 Ibid. 9 Ibid.
15
Operation Able Manner
Up until this point, the U.S. policy for Haitian migrants was to pick them up and
interview them regarding their fears of political persecution. In May 1992, President
Bush changed the national policy by giving an executive order that Haitian migrants were
to be picked up and returned without any interview. Finally, just five days before leaving
office, President Bush initiated Operation Able Manner, a reinforcement of the coast
guard designed to drastically decrease the number of Haitian migrants reaching the U.S.
At its height, Operation Able Manner involved 17 Coast Guard cutters, 9 aircraft and 5
navy ships patrolling the waters between Haiti and Cuba. We believe that this U.S. anti-
immigration policy/US Coast Guard operation will decrease migration to the U.S. In
other words, the Coast Guard presence should deter migration to the U.S.
Aristide’s Re-instatement
President Clinton maintained the policy outlined in the executive order, as well as
Operation Able Manner, upon his inauguration. On September 19, 1994, under
increasing international and domestic pressure to intervene in the current conflict,
President Clinton ordered 23,000 U.S. troops into Haiti as part of a multinational effort.
Operation “Restore Democracy” forced the surrender of Raoul Cédras and the military-
backed government and restored Aristide to the presidency. Shortly thereafter, President
Clinton ended operation Able Manner, and Aristide disbanded the Haitian National
Army. On March 31, 1995, President Clinton withdrew the vast majority of U.S. forces
from Haiti.
We hypothesize that the presence of foreign troops and the wall of “defense” that
the U.S. set up when returning Aristide to power should lead to an initial decline in
16
migration to the United States. It poses tremendous difficulty to get off the island past the
U.S. occupation force and then the U.S. Coast Guard. As individuals are interdicted and
returned at such high rates, fewer should flee to the United States. However, after U.S.
troops leave in 1995, we should see emigration levels rise as Aristide restores his rule.
Thus, we expect a U-shaped relationship between time and Haitian migration to the U.S.
during the 1994-1996 Aristide period.
The Préval Regime
Aristide, under pressure from the U.S. government, respected the constitutional rule that a
president cannot serve consecutive 5-year terms, despite the fact that the majority of his
term was spent in exile. His party, the Lavalas Family, put forward Rene Préval as a
candidate for the presidency. The 1995 elections went smoothly, with no reported
incidents of violence or voter intimidation, although only a little less than 30% of the
electorate voted. Rene Préval won the election with 87% of the votes. In 1996, Préval’s
inauguration became the first successful transition of power in Haiti between two
democratically elected leaders. During his administration, the economy improved as he
was able to turn attention towards it and away from security oriented issues. In particular,
the economy gained momentum throughout 1999 and 2000.
Back in 1996, the Lavalas Party began to rupture as conflicts broke out over
political power. Parliamentary elections in 1997 failed, and a struggle to confirm a new
prime minister occurred. In January of 1999, Préval dissolved the parliament and ruled
by decree, ignoring the constitution. In March of that year, he appointed a prime minister
without seeking confirmation.
17
Préval’s administration was one of the few periods in recent Haitian history where
the government was able to turn their attention towards the economy as opposed to public
security. After all, both the Avril and Cédras regimes were marked by political
oppression. Aristide’s first brief presidency was turbulent, as was his return to power,
and his second term was marked by armed militias and imposed order through
repression. Ceteris paribus, during the Préval administration migratory flows from Haiti
to the U.S. should decline relative to other Haiti Administrations.
Hurricane Georges
In September of 1998, a disastrous hurricane hit Haiti, bringing with it winds up to
100mph. The government declared a state of emergency, shut down the airport, and
closed all the schools. Estimates show that about 150 people were killed by the hurricane
and its aftermath. The poorest individuals were hit the hardest, as they are the ones who
live in poorly constructed housing.
Due to the nature of the disaster and its ramifications, we expect that migration
from the U.S. to Haiti rapidly increases and then falls off following the hurricane. Thus,
we expect an inverted U-shaped relationship between time and Haitian migration in the
short-run following the hurricane.
Aristide’s 2000 Election & Second Term
Unlike the 1996 elections, there was a great deal of political violence leading up
to the 2000 elections. OAS reported 70 violent incidents between January 1 and the
election. The death of Jean Dominique, a renowned journalist, on April 3 brought the
attention and condemnation of the world to the events in Haiti. Just days later on April 8,

18
100 protesters burned down a Lavalas-Opposition Coalition headquarters. Police were on
the scene, but neither moved to stop the protestors, nor arrest any of them. Subsequently,
many foreign countries, including the U.S. and the E.U., pulled their aid from Haiti,
causing the economy to shrink. Following the election, the police arrested 35 opposition
activists, many of whom, ironically, were protesting election fraud.
Later in 2000, the Lavalas Family succeeded in winning 67% of the seats in the
parliament. Aristide stood for the presidency again and was elected. During Aristide’s
second term the socio-economic quality of life for the slum dwellers continued to
decrease. Aristide began to rule with heavy influence from patronage and enforcing his
dictates with armed gangs. Aristide also began to draw political criticism from foreign
powers, including the U.S., for not including more opposition leaders in his coalition.
Aristide’s return to power should quickly reduce migrant levels as he begins to
solidify his power base and employ the use of his armed gangs to maintain control.
Moreover, the economy improves during his time in office. Yet, over time and towards
the end of his reign, the economy worsens and protest increases. We expect that towards
the end of his term, the economy and political protests should increase the number of
migrants fleeing the country. As such, we expect a U-shaped relationship between time
and Haitian Migration from Aristide’s inauguration until the 2004 coup.
2004 Coup
In February of 2004, the discontent of the people reached a boiling point as protestors in
the street began arming themselves. The failing economy and increased gang violence
pushed the opposition to the edge. Popular support began to erode and with the army
disbanded, the Front for Haitian Advancement and Progress (FRAPH) took advantage of
19
a political opportunity.10 A group of 700 rebels or so seized roughly half of the country
and eventually forced Aristide into exile. The coup in February 2004 was a difficult time
for the already struggling economy. Refugees International estimates that $500 million
dollars of damage was done to the infrastructure in Haiti.11 In February 2004, President
George W. Bush began Operation Able Sentry (similar to Able Manner) to stem the tide
of refugees. After Aristide abdicated the presidency, Boniface Alexandre was installed as
the provisional president, until elections could take place.
Similar to the 1991 coup, we expect increasing numbers of Haitian migrants
following the 2004 coup followed by an overall reduction of migrants as the country
stabilizes.
U.S. & Haiti Domestic Politics
Last, while we discussed the hypothesized impact of specific U.S. policies enacted over
the 1990-2004 period such as Able Manner and the different Executive Orders advanced
by different U.S. Presidents, are their party/administration differences in how different
Presidents handled the Haiti immigration issue? During this time, three different
presidents held office in the U.S., yet none differ dramatically in the way they
approached the Haiti immigration issue. For example, Bush Sr. enacted Able Manner just
prior to leaving office and Clinton maintained it. Similarly, Bush Jr. continued the
rhetoric that Haitian immigrants were fleeing poor economic conditions not persecution
and enacted Operation Able Sentry. Therefore, we expect to find no difference in levels
of Haitian migration across the different Presidents’ terms.
10 See McAdam (1982, Chapter 2) for a description of his “political process model.” 11 Refugee International http://www.refintl.org/content/country/detail/2949
20
In terms of Haitian politics, we have covered the major regime changes and their
hypothesized effects. However, we should describe the general Haitian emigration
policies before moving to test all of our hypotheses. We previously noted that harsh
policies should decrease migration while liberal policies should increase migration.
Overall, the Haitian government’s policies during the 1990’s were fairly ‘liberal.’ While
police did catch people trying to leave, they would often allow them to go, especially if
the migrants paid them off.
Research Design
To test our hypotheses, we employ a longitudinal design to analyze Haitian migration to
the United States. The final mathematical construction of some of our indicators depends
on the results of Augmented Dickey-Fuller (ADF) stationarity tests. So, before we
describe each of the variables, we discuss the general issue and later refer to the impact of
the ADF tests on some of the constructed variables.
When estimating regression models, it is important that time-series variables
entering the equation are stationary (i.e., have a constant mean and variance). We
perform ADF tests on each variable entering the statistical equations described below.
Initial tests of the economic series revealed non-stationary series. However, we took the
first difference of each series and ADF tests on each of the differenced series show that
they are all stationary. Tests convey that all of the interval-level constructed variables
entering the equations below are stationary, minimizing the chances of finding spurious
relationships.

21
Dependent Variable
We developed a sample using the week as our unit of observation. Our temporal domain
is January 1990 through June 2004. To test our hypotheses about Haiti-U.S. migration,
we chose to model weekly Haitian interdictions at sea by the U.S. Coast Guard. The data
themselves come from the U.S. Coast Guard’s publicly obtainable interdiction logs.12 To
demonstrate the indicator’s construct and external validity, we correlated the annual sums
of interdictions with the available Moore & Shellman (2004b) measure of refugee flows
(obtained from the UNHCR) and found a .67 correlation between the two annually
aggregated series.13 This tells us that our measure reflects other similar aggregate
measures. With respect to reliability, the U.S. Coast Guard records interdictions at sea
each day by the migrant’s country of origin. The record-keeping process implies a highly
reliable measure.
Of course, the measure is not without its limitations. To begin, the measure only
captures those individuals who are caught trying to enter the U.S. and ignores those who
successfully enter the U.S. illegally. Second, it only captures those individuals traveling
to the U.S. by boat (however, boats are the dominant form of transportation) and ignores
individuals applying for refugee and asylum status in the U.S. “in-country” office located
in Port-Au-Prince (established in 1994 under the Clinton Administration). However,
given its relatively strong correlation to annual refugee flows, we feel it serves as a good
indicator of weekly migratory flows from the U.S. to Haiti.
Security Indicators
To measure the threat to one’s physical person, we used event data from Project Civil
12 We filed a written request to obtain the US Coast Guard’s logs. 13 Weekly-level refugee data is unheard of.

22
Strife (PCS).14 According to Goldstein (1992, 369) event data are “day-by-day coded
accounts of who did what to whom as reported in the open press,” and offer the most
detailed record of interactions between and among actors. To utilize event data in
statistical models, one must first aggregate the events in a way that requires some method
of combining different event types into a “single theoretically meaningful measure (in
one or more dimensions)” of the relationships among actors (Goldstein 1992, 370). Most
event data projects convert events into a measure of conflict-cooperation.15 The conflict-
cooperation variable is said to measure the intensity of one actor’s behavior directed
towards another actor.
A machine-coding procedure that converts English-language reports into event
data by assigning particular numerical codes to actors, targets, and verbs generates the
PCS data. Specifically, the project uses a modified version of Text Analysis By
Augmented Replacement Instructions (TABARI), developed by Phil Schrodt, to generate
domestic political event data.16 TABARI uses a “sparse- parsing” technique to extract the
subject, verb, and object from a sentence and performs pattern matching using actor and
verb dictionaries.17 In short, TABARI matches words from an electronic text file (news
story) to words contained in the actor and verb dictionaries and assigns a corresponding
code to each actor and verb, and finally, spits out the date.18 Machine-coded data are only
as good as the dictionaries, so each of the actor dictionaries is customized for each case.
Our verb dictionary is a modified KEDS verb dictionary. Verbs and verb phrases are
14 See Shellman, Stewart, and Reeves (2005) for more information on coding rules and procedures. 15 Such projects include: Cooperation and Peace Data Bank – COPDAB, World Events Interaction Survey – WEIS, Integrated Data for Events Analysis – IDEA, Protocol for the Assessment of Nonviolent Direct Action – PANDA, Intranational Political Interactions Project. 16 See http://raven.cc.ukans.edu/~keds/index.html for information on the KEDS and TABARI projects. 17 TABARI recognizes pronouns and dereferences them. It also recognizes conjunctions and converts passive voice to active voice (Schrodt 1998). 18 These particular data are coded from Associated Press reports available from Lexis-Nexis.
23
assigned a category based on the WEIS coding scheme.19 Then, these categories are
scaled on an interval conflict-cooperation continuum using the Goldstein (1992) scale.
However, KEDS has introduced new codes in addition to those used by McClelland and
the WEIS project. Most of these are borrowed from the Protocol for the Assessment of
Nonviolent Direct Action (PANDA) project.20 The KEDS project investigators assigned
weights to the new codes that are comparable to the Goldstein weights, and we used those
weights in tandem with the Goldstein weights to create the scaled event data series
analyzed in this study.21 These data now represent a conflict-cooperation measure of
behavior by one actor directed towards another.
Our theory contends that individuals monitor the behavior of government forces
and guerrillas and flee when the perceived threat is heightened. Thus, we aggregated
rebel actors together, government actors together, rebel targets together, and government
targets together.22 Finally we averaged the conflict-cooperation values associated with
each directed dyad (rebels to government and government to rebels) by week. In the end,
we created directed dyadic event scores on a -10 (hostility) to +10 (cooperation)
continuum that summarize the weekly level of behavior directed by the rebels towards
the government and the government towards the rebels.
In converting events to a time-series, one must choose an appropriate level of
aggregation (Freeman 1989). Many contend that high levels of aggregation such as
monthly, quarterly, and annual data tend to diminish the important dynamics evident in
day-to-day conflict and cooperation, and Shellman (2004a) provides some evidence of
this empirical artifact. On the other hand, daily data prove to be too small of a unit. There
19 See "World Event/Interaction Survey (WEIS) Project, 1966-1978," ICPSR Study No. 5211. 20 See http://www-vdc.fas.harvard.edu/cfia//pnscs/panda.htm for information on the PANDA project. 21 See http://www.ukans.edu/~keds/data.html for WEIS codes and adaptations PANDA. 22 We also experimented with separating out the military from the government.
24
is almost certainly a lag effect at the daily level between conflict and migration and it is
difficult to model such a lag structure. As a result, we choose to aggregate our conflict
data and interdiction data by the week.
Domestic Politics
To measure Haiti’s political climate aside from what the event data will capture on the
government side, we use dummy variables to record the presence and absence of each
regime’s/leader’s period in power (e.g., Aristide, Cédras, and Préval).
Economic Indicators
To measure the economic environment in Haiti, we use the monthly Consumer
Price Index from the International Labor Organization (ILO) LABORSTAT database.23
The CPI measures changes in the prices of goods and services that are directly purchased
in the marketplace. Most think of the CPI as measuring the inflation rate, while others
refer to it as a cost of living index. While many point out the distinctions between CPI
and a complete cost of living index, the CPI can convey the changes in the prices of
goods and services, such as food and clothing. Therefore, it serves as a good indicator of
the monthly economic environment in Haiti over time.
Unfortunately, the data came in two series, each having a different base year,
which do not overlap.24 Furthermore, there were 8 months of missing data in 1996. The
first series runs from Jan 1990 to December 1995 (1990=100). The second series runs
from September 1996 to June 2004 (2000=100). To begin, we linearly extrapolated the
first series through August 1996. Then, we merged the two together and created a dummy
23 See http://laborsta.ilo.org/. 24 However, the data range from similar starting and ending values and have similar means.

25
variable set equal to 1 from September 1996 through the end of the time-series. The
dummy variable will tell us if the level of the time-series changes as a result of the
second series. We also interact Haitian CPI with the dummy variable to see if the
estimated effect of CPI changes as a result of the “new” series. After constructing the
“level” indicator, we tested it for stationarity using the ADF test. We found that it was not
stationary. So we took the first difference (∆ HAITICPI). We chose to do this in the
original monthly dataset such that when we merged the monthly change series with our
weekly dependent variable, each week in each month would have the same value of
∆HAITICPI associated with it.25 An ADF test confirmed that the newly created “change”
series is stationary. Moreover, the differenced variable makes the series more comparable
than the two “level” series.26 As such, we expect our dummy variable representing the
second series to be insignificant.
To measure the U.S. economic environment, we used monthly U.S. CPI as well as
monthly U.S. wages. These measures capture the economic pull of the United States. We
expect inflation to be negatively signed and wages to be positively signed. We
downloaded both series from the ILO LABORSAT website. Both series were
determined to be nonstationary using ADF tests. Like ∆HAITICPI, we took the first
difference in the monthly series and merged them into our weekly master dataset. ADF
tests of both differenced series confirmed that they are both stationary.
Foreign Pressures
Not only will domestic conflict and cooperation affect migration, but foreign pressures
25 If we had merged the level in first and then taken the first difference, this would not be the case as several observations would be zero since the monthly value did not change from week 3 to week 4. 26 To illustrate, a change from 0 to 5 and a change from 50 to 55 both result in a five unit change, while 0 and 50 and 5 and 55 are very different levels.
26
should also affect Haitian migration, especially U.S. foreign policy towards Haiti. To
measure U.S. foreign policy we use event data summarizing the U.S.’s net conflict-
cooperation directed towards Haiti. These data were also generated using TABARI but
instead of coding domestic conflict and cooperation, they represent international conflict-
cooperation levels and events. We originally sought to use Goldstein and Pevehouse’s
dataset available on the KEDS website. However, the temporal span of the data ends in
mid-1997. We chose to use the existing dictionaries to regenerate data for 1990-1997 and
extend the series through 2004 using full-text AP news reports.27 We then created U.S. to
Haiti Government, U.S. to Haiti Military, U.S. to Haiti Rebels and U.S. to Haiti (all)
directed dyads. Finally, we averaged the Goldstein weighted event scores for each
directed dyad by the week.
In addition, we controlled for each U.S. President’s policies by recording the
presence and absence of each leader in power over the time period (e.g. Bush Sr, Clinton,
and Bush Jr.).
Impact Assessments
We also sought to measure the short-term impacts of particular events – both economic
and violent – on Haitian migration to the U.S. over time. In particular, we assess the
impact that the 1991 and 2004 coups have on Haitian flight to the U.S. We also analyze
the impact of Aristide’s return to Haiti in 1994 with the U.S. military presence and his
second term in office on migration patterns. Third, we analyze the impact of both the
Organization of American States (OAS) and United Nations (UN) economic sanctions on
Haitian migration. Finally, we assess the impact that hurricane Georges had on Haitian
27 The leadership and groups remain consistent from 1997-2004 so we feel that using the existing dictionaries rather than creating new ones does not pose great threat to the data’s reliability and validity.
27
flight. To do so, we employ a form of multiple interrupted time-series (MITS) analysis
which uses a series of dummy and counter variables to assess the impacts of such events
on our dependent variable. While a visual inspection may confirm or deny our
hypotheses, this method allows one to assess “whether the observed change is statistically
significant thereby reducing the likelihood of chance differences” (Lewis-Beck and
Alford 1979, 474). Consider the following simple regression equation:
0 1 2 3 41 2 3 4t t t t t tY X X X X eβ β β β β= + + + + + 1.0
where Yt = weekly interdictions; X1t = a counter for weeks (1 to N); X2t = a dichotomous
variable representing the presence of UN Sanctions scored 0 for observations from Jan
1990 till week four September 1991 and 1 from week four September 1994 through week
two October 1994; X3t = a counter for weeks during the sanction period (1 to 62); X4t =
X3t2; β0, β1, β2, β3, β4 = parameters to be estimated, et = error.
The parameters β0 and β1 indicate the level and slope of the time-series prior to
implementation of the UN Sanctions in September of 1993. To analyze whether or not
the level and/or slope of the relationship change under UN sanctions, we examine β2, β3,
and β4. If the estimate for β2 is not statically significant, then we infer that the level of the
time-series is unaltered by the intervention. We then examine β3 and β4 in tandem. We
include the squared term to capture the curvilinear nature of our hypothesized
relationship. Our inverted-U-shaped hypothesis is supported if β1+β3 > 0 and β1+β4 < 0.
The predicted slope will rise (+) and then fall (-). On the other hand, if the slope is
unaltered by the sanctions, neither coefficient will be significant. The model would
support a U-shaped hypothesis if β3 is statistically significant and the sum of β1+β3 < 0
and the sum of β1+β4 > 0. Alternatively, we could detect a linear relationship in the time-
series given an intervention. To model a linear relationship we would remove the squared
28
term form the model, re-estimate the equation, and check the significance of β3 and the
sum of β1+β3. We can introduce interventions and take them out by adding a series of
dummy variables and counter variables.
We generated dummy, counter, and counter-squared variables for the 1991 coup,
1993 UN Sanctions period, the Aristide 1994-96 period, Hurricane George, the Aristide
2001-2004 period, and the 2004 coup to test our curvilinear hypotheses. For the coups
and the hurricane, we wanted to see if there was a short-run impact in Haitian flight over
a period of a few months in the instance of the coups and a period of a few weeks
following the 1998 Hurricane. In some sense this became an empirical model-fitting
exercise, yet all consistent with our general hypothesis about the slope of the time-series
following and during each event period. Similar to trying different lag lengths in fitting a
vector autoregression model, we introduced the stimulus and examined its impacts over
different lengths of time. We examined the model fit based on the Wald Chi-Squared
values, Vuong Tests, and the correlation between the actual and model-predicted values.
We ultimately settled on 28 weeks for the 1991 coup, 11 weeks for the 2004 coup (the
temporal sample constrained us going much beyond this), and 8 weeks for the hurricane.
We report the descriptive statistics for each of our variables in Table 1.
[Insert Table 1 about here]
Estimation & Method
Our dependent variable is a count and is not normally distributed. To illustrate this
property observe the histograms displayed in Figures 2A and 2B. Figure 2A displays the
histogram for the whole sample, while Figure 2B shows the histogram for the zero-
excluded sample. We plotted the second histogram so that one can observe the variation
of lower frequency counts masked by our zero-inflated distribution. We discuss the zero-
29
inflated property below and how we choose to model it. Both histograms reveal Poisson-
like distributions which are “derived from a simple stochastic process…where the
outcome is the number of times something has happened” (Long 1997, 219). However,
most situations in the social sciences rule out the Poisson statistical model because it
assumes that each event is independent of one another; each event has no effect on the
probability of the event occurring in the future. Moreover, the model assumes that the
conditional mean of the outcome is equal to the conditional variance. We argue that
decisions are linked via a common set of information such that they are not independent.
As such our theory excludes the use of a Poisson model to estimate our dependent
variable.
The appropriate statistical technique used to analyze such a distribution is the
negative binomial regression (NBREG) model. This model includes a parameter, α,
which enables one to estimate the extent to which the events influence one another within
each observation (King 1989a:764-9). Our argument implies that α will be positively
signed and statistically significant. We choose the NBREG model because the use of a
linear regression model on these data can result in inefficient, inconsistent, and biased
estimates (Long 1997, 217).
In addition, two-thirds of our dependent variable’s observations are zero. This is
evident in the large spike in the histogram displayed in Figure 2A. To model this
characteristic in our data, we use a zero modified estimation strategy. We use the zero-
inflated model to model the probability of a zero count using a separate logit equation.
Given our argument, our negative binomial distribution, and our zero-inflated counts, the
30
most appropriate model is the Zero-Inflated Negative Binomial (ZINB) regression model.
Finally, we report robust standard errors.28
[Insert Table 2 about here] Results We report the coefficient estimates for the model in Table 2 and we graphically display
the substantive effects in Figures 3, 4, and 5. We also report the incidence rate ratios
(IRR), which represent the change in interdictions given a one unit increase in the
independent variable, holding all other variables constant. In the case of a dummy
variable, such as UN Sanctions, the IRR is the relative rate of interdictions in a week
given the presence of the sanctions relative to the absence of the UN sanctions. An IRR
of 1.0 is equal to no change; values below 1.0 indicate a reduction in the expected count,
holding all other variables constant.
The first thing to inspect is our model choice and fit. Our alpha parameter, in
Table 2, is statistically significant and positively signed as expected, indicating the
appropriate choice is the negative binomial model over the Poisson. In addition, we
performed two different Voung (1989) (likelihood ratio) tests to determine if our
specification fit the data better than alternative specifications.29 The first Vuong test
reported in Table 2 compares the vanilla negative binomial model to the ZINB model.
The second reported test compares the restricted ZINB model containing only interval
level variables and the CPI dummy to the unrestricted ZINB MITS model. Taken
together, the ZINB MITS model outperforms its alternatives.
28 We also performed some robustness checks using autoregressive moving average (ARMA) modeling techniques. Such techniques control for series noise and address the autocorrelation problem. Yet they do not take into consideration the truncated distribution and in our case predict lots of negative values. That said, the impact assessments were all supported and many other variables remained significant and in the right direction using a (1, 0, 1) ARIMA specification. 29 The test basically compares the log-likelihood values from restricted and unrestricted model.
31
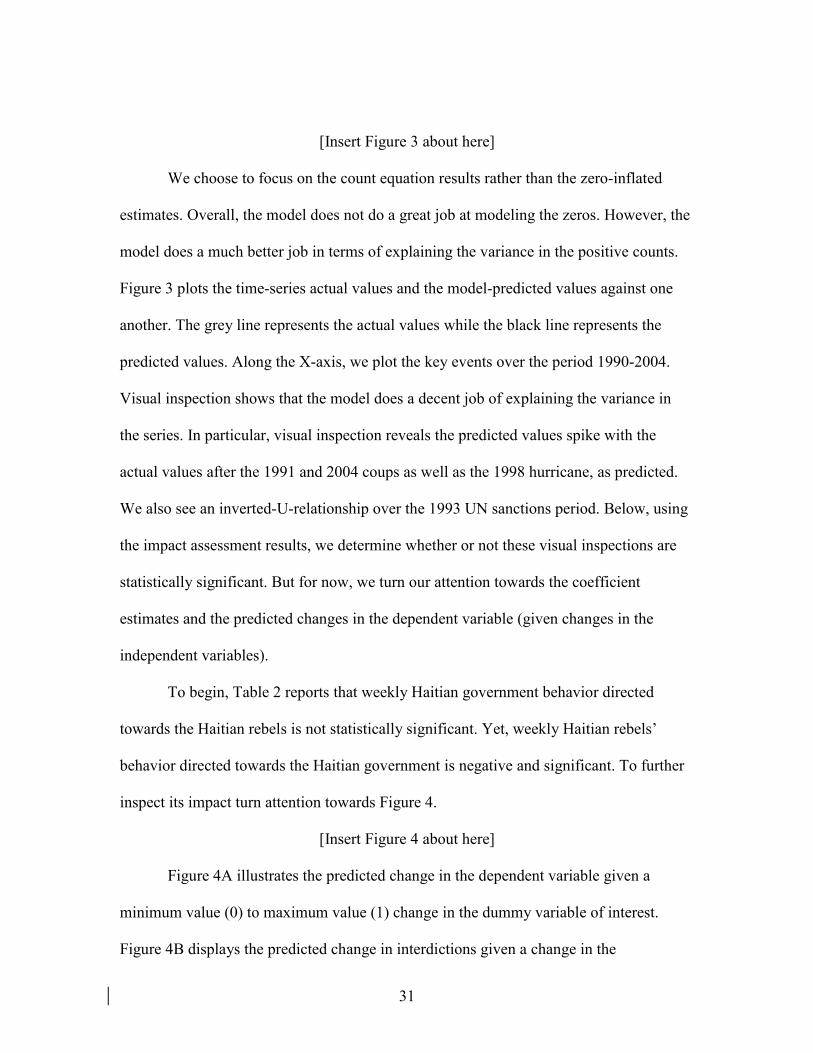
[Insert Figure 3 about here]
We choose to focus on the count equation results rather than the zero-inflated
estimates. Overall, the model does not do a great job at modeling the zeros. However, the
model does a much better job in terms of explaining the variance in the positive counts.
Figure 3 plots the time-series actual values and the model-predicted values against one
another. The grey line represents the actual values while the black line represents the
predicted values. Along the X-axis, we plot the key events over the period 1990-2004.
Visual inspection shows that the model does a decent job of explaining the variance in
the series. In particular, visual inspection reveals the predicted values spike with the
actual values after the 1991 and 2004 coups as well as the 1998 hurricane, as predicted.
We also see an inverted-U-relationship over the 1993 UN sanctions period. Below, using
the impact assessment results, we determine whether or not these visual inspections are
statistically significant. But for now, we turn our attention towards the coefficient
estimates and the predicted changes in the dependent variable (given changes in the
independent variables).
To begin, Table 2 reports that weekly Haitian government behavior directed
towards the Haitian rebels is not statistically significant. Yet, weekly Haitian rebels’
behavior directed towards the Haitian government is negative and significant. To further
inspect its impact turn attention towards Figure 4.
[Insert Figure 4 about here]
Figure 4A illustrates the predicted change in the dependent variable given a
minimum value (0) to maximum value (1) change in the dummy variable of interest.
Figure 4B displays the predicted change in interdictions given a change in the
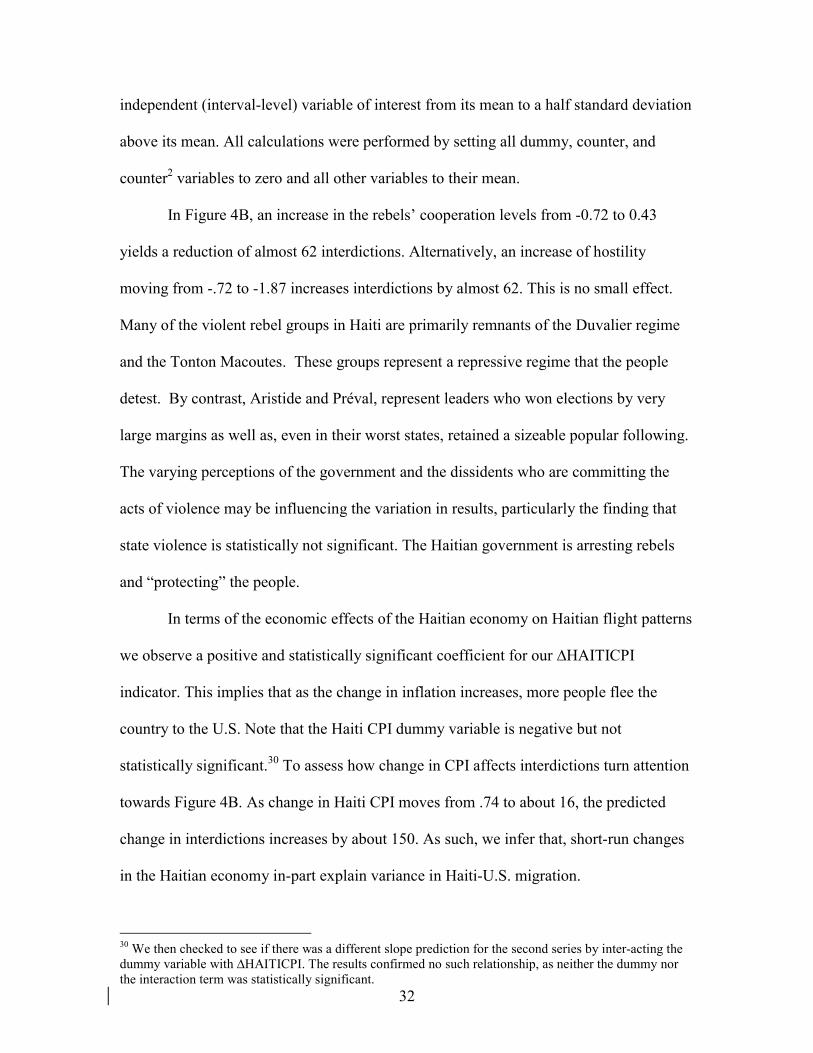
32
independent (interval-level) variable of interest from its mean to a half standard deviation
above its mean. All calculations were performed by setting all dummy, counter, and
counter2 variables to zero and all other variables to their mean.
In Figure 4B, an increase in the rebels’ cooperation levels from -0.72 to 0.43
yields a reduction of almost 62 interdictions. Alternatively, an increase of hostility
moving from -.72 to -1.87 increases interdictions by almost 62. This is no small effect.
Many of the violent rebel groups in Haiti are primarily remnants of the Duvalier regime
and the Tonton Macoutes. These groups represent a repressive regime that the people
detest. By contrast, Aristide and Préval, represent leaders who won elections by very
large margins as well as, even in their worst states, retained a sizeable popular following.
The varying perceptions of the government and the dissidents who are committing the
acts of violence may be influencing the variation in results, particularly the finding that
state violence is statistically not significant. The Haitian government is arresting rebels
and “protecting” the people.
In terms of the economic effects of the Haitian economy on Haitian flight patterns
we observe a positive and statistically significant coefficient for our ∆HAITICPI
indicator. This implies that as the change in inflation increases, more people flee the
country to the U.S. Note that the Haiti CPI dummy variable is negative but not
statistically significant.30 To assess how change in CPI affects interdictions turn attention
towards Figure 4B. As change in Haiti CPI moves from .74 to about 16, the predicted
change in interdictions increases by about 150. As such, we infer that, short-run changes
in the Haitian economy in-part explain variance in Haiti-U.S. migration.
30 We then checked to see if there was a different slope prediction for the second series by inter-acting the dummy variable with ∆HAITICPI. The results confirmed no such relationship, as neither the dummy nor the interaction term was statistically significant.

33
However, the U.S. economy does not appear to be much of a pull factor for
Haitians. For example, in Table 2 neither the coefficient on wages nor the coefficient on
∆ U.S. CPI are statistically significant. This is consistent with Moore & Shellman’s
(2004b) global finding in their directed-dyad study of annual origin to asylum refugee
flows. They found that asylum GNP did not have a statistically significant impact on
destination choices. Neumayer (2005b) on the other hand finds that asylum applicants in
Western Europe are attracted to richer countries when controlling for fixed effects.
The finding herein suggests that Haitians may not necessarily be attracted to the
short-run increases and decreases in the U.S. economy. We know that US wealth is much
greater than Haiti and so perhaps its wealth is so great in comparison to Haiti that
changes up and down are relatively unimportant. That said, the ebb and flow of the US
economy has no impact on the variation in weekly Haitian migration to the US. Of
course, a better test would look at migration from Haiti to Canada, the Dominican
Republic, and France. Perhaps then, we could more accurately test whether or not Haitian
migrants were particularly drawn to the U.S. economy over the French, Canadian, and/or
Dominican Republic economies (controlling for distance). However, given these data and
our design, Haitian-U.S. migration levels are virtually unaltered by rising U.S. wages and
decreasing inflation.
Next, we turn attention towards U.S. foreign policy and the other foreign pressure
variables. To begin, we experimented by creating U.S. to Haiti military, U.S. to Haiti
Government, U.S. to Haiti Rebels, and U.S. to Haiti ALL variables. Different
combinations revealed similarly signed and similarly sized coefficients. Joint F-tests
indicated that the effects were the same across our different combinations. As such, we
chose to report the U.S. to Haiti ALL findings. This variable represents all conflict and

34
cooperation sent by the U.S. towards the Haitian rebels, government, military, and
general society in each week from 1990-2004. Table 2 indicates a negatively signed and
statistically significant coefficient estimate and Figure 4 shows a similar but smaller
effect on interdictions than rebel behavior. An increase in U.S. cooperation directed
towards Haiti from .04 to about 2 (on a scale from -10 to +10) yields a predicted decrease
in the interdiction count of about 50. Of course, the opposite holds true if the U.S.
government increases its hostility from .04 to about -2. This results in an increase of
about 50 interdictions. Thus, coercive U.S. foreign policy, increases the number of
weekly Haitian-U.S. migrants. However, this may be misleading. The variable measures
all types of actions and policies towards Haiti, from asylum policy to restoring Aristide to
power, to economic aid. As such, it may be difficult to sort out how migration is affected
by each of these particular arenas of US foreign policy towards Haiti. All we can ay is
that in the aggregate, hostile US foreign policy increases migration and friendly US
policy decreases migration.
One particular type and example of hostile U.S. foreign policy towards Haiti is
the U.S. Coast Guard Operation Able Manner. This operation actually decreased
interdictions over the course of the period as expected as the coefficient in Table 2 is
negative and statistically significant. The IRR indicates that Able Manner reduced
interdictions almost 19 percent. Figure 4A illustrates that the variable has a predicted
negative change of 160 individuals associated with the level of the series, holding all
other variables at their means and counter and dummy variables at zero. This is evidence
that, though migrants were responding to increased migrant flows following the 1991
coup, their presence became known and overall the operation reduced Haitian migration
to the U.S.

35
As for OAS sanctions, they increased the level of the time-series by about 600
holding all other variables constant at their means and all other dummy variables and
counter variables at zero. This implies that the sanctions negatively affected the economy
and in turn led to an increase in migration. Yet, that increase was not as much as the
predicted increase in migration once the UN made the sanctions binding for all its
members in 1993. Figure 4A, as expected, illustrates that the UN Sanctions increased
Haiti to U.S. migration levels more than the OAS Sanctions. Similarly, a comparison of
the IRRs suggests that OAS sanctions increased interdictions by almost 23 percent,
whereas UN sanctions increased them by more than 28 percent. We come back to the UN
Sanctions in the context of our impact assessments discussed below.
However, before we move to that discussion, we should note that the Préval
dummy variable is negative and significant indicating that his relatively stable regime is
associated with lower levels of Haiti to U.S. migration. Finally, though our reported
results do not include the estimates for the Clinton and Bush Jr. variables, neither was
statistically significant (i.e. different from Bush Sr.). The other coefficients remained
unaltered by the inclusion of the U.S. President dummy variables and Vuong tests
revealed a better fit with the restricted model (i.e. no presidential dummies).
[Insert Figure 5 about here]
Impact Assessments
Figure 5 graphs the results of the impact assessments. Specifically, they show the
predicted impacts for each event on Haitian interdictions. It is important to note that these
predictions are calculated by setting all of the interval level variables at their means and
all non-event-associated dummy variables at zero. The dummy variable applicable to
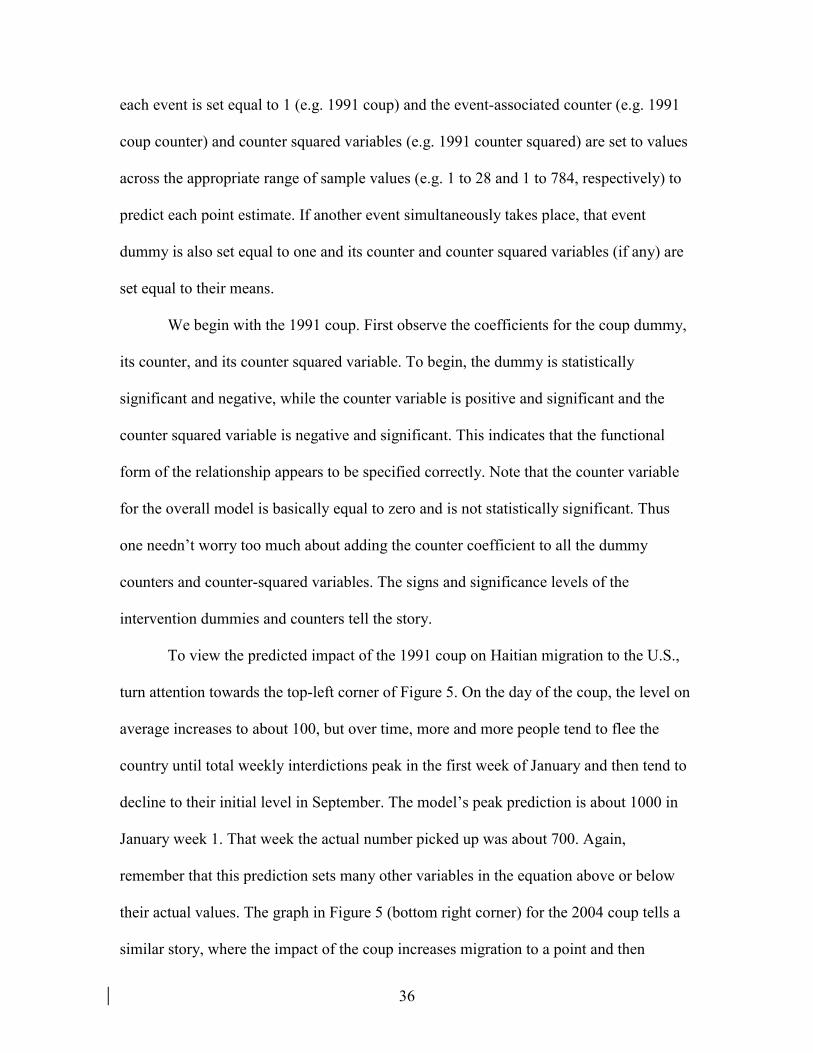
36
each event is set equal to 1 (e.g. 1991 coup) and the event-associated counter (e.g. 1991
coup counter) and counter squared variables (e.g. 1991 counter squared) are set to values
across the appropriate range of sample values (e.g. 1 to 28 and 1 to 784, respectively) to
predict each point estimate. If another event simultaneously takes place, that event
dummy is also set equal to one and its counter and counter squared variables (if any) are
set equal to their means.
We begin with the 1991 coup. First observe the coefficients for the coup dummy,
its counter, and its counter squared variable. To begin, the dummy is statistically
significant and negative, while the counter variable is positive and significant and the
counter squared variable is negative and significant. This indicates that the functional
form of the relationship appears to be specified correctly. Note that the counter variable
for the overall model is basically equal to zero and is not statistically significant. Thus
one needn’t worry too much about adding the counter coefficient to all the dummy
counters and counter-squared variables. The signs and significance levels of the
intervention dummies and counters tell the story.
To view the predicted impact of the 1991 coup on Haitian migration to the U.S.,
turn attention towards the top-left corner of Figure 5. On the day of the coup, the level on
average increases to about 100, but over time, more and more people tend to flee the
country until total weekly interdictions peak in the first week of January and then tend to
decline to their initial level in September. The model’s peak prediction is about 1000 in
January week 1. That week the actual number picked up was about 700. Again,
remember that this prediction sets many other variables in the equation above or below
their actual values. The graph in Figure 5 (bottom right corner) for the 2004 coup tells a
similar story, where the impact of the coup increases migration to a point and then
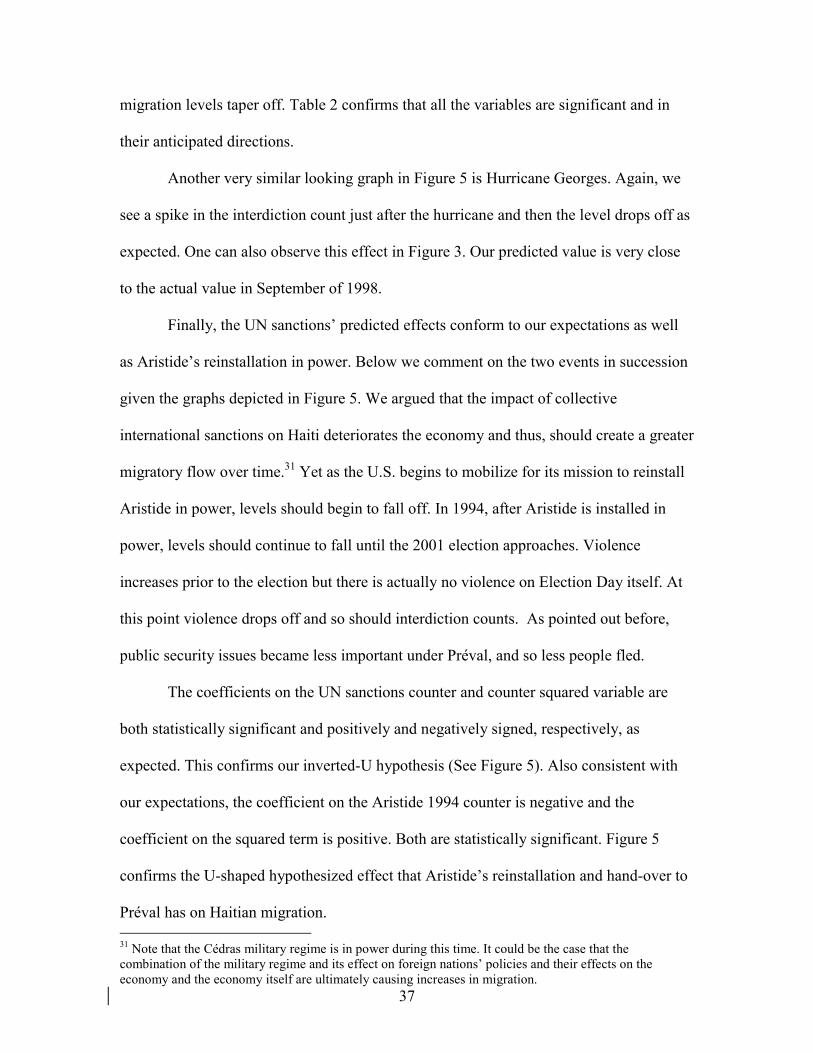
37
migration levels taper off. Table 2 confirms that all the variables are significant and in
their anticipated directions.
Another very similar looking graph in Figure 5 is Hurricane Georges. Again, we
see a spike in the interdiction count just after the hurricane and then the level drops off as
expected. One can also observe this effect in Figure 3. Our predicted value is very close
to the actual value in September of 1998.
Finally, the UN sanctions’ predicted effects conform to our expectations as well
as Aristide’s reinstallation in power. Below we comment on the two events in succession
given the graphs depicted in Figure 5. We argued that the impact of collective
international sanctions on Haiti deteriorates the economy and thus, should create a greater
migratory flow over time.31 Yet as the U.S. begins to mobilize for its mission to reinstall
Aristide in power, levels should begin to fall off. In 1994, after Aristide is installed in
power, levels should continue to fall until the 2001 election approaches. Violence
increases prior to the election but there is actually no violence on Election Day itself. At
this point violence drops off and so should interdiction counts. As pointed out before,
public security issues became less important under Préval, and so less people fled.
The coefficients on the UN sanctions counter and counter squared variable are
both statistically significant and positively and negatively signed, respectively, as
expected. This confirms our inverted-U hypothesis (See Figure 5). Also consistent with
our expectations, the coefficient on the Aristide 1994 counter is negative and the
coefficient on the squared term is positive. Both are statistically significant. Figure 5
confirms the U-shaped hypothesized effect that Aristide’s reinstallation and hand-over to
Préval has on Haitian migration. 31 Note that the Cédras military regime is in power during this time. It could be the case that the combination of the military regime and its effect on foreign nations’ policies and their effects on the economy and the economy itself are ultimately causing increases in migration.
38
This same U-shaped relationship for Aristide’s second term (2001-2004) is also
apparent in Figure 5. The effect is not as pronounced as the 1994 effect but Table 2
reports that the coefficients associated with the counter and counter squared variables are
statistically significant at the .10 level.
Conclusion This article set out to examine the debate over whether or not migrants were political
refugees fleeing persecution or bogus refugees fleeing failing economies, particularly
within the context of Haitian migration to the U.S. We found evidence for both factors.
To begin, the Haitian economy tends to push people out as it worsens. Yet, we failed to
find evidence that short-run changes in the U.S. economy attract Haitians. In contrast, we
found that rebel violence has a large substantive and statistically significant impact on
Haitian migration. Moreover, we observed large flows of Haitian migrants following
coups. Finally, economic sanctions, foreign pressures, and Hurricane Georges also tended
to increase migratory flows.
Our results are consistent with most of the studies in the literature. For example,
dissident violence has a large impact on migration as reported in Davenport et al (2003),
Moore & Shellman (2004a), and Neumayer (2005a; 2005b). On the contrary, state-
sponsored violence did not have a statistically significant impact. However, military
coups generated large flows of Haitian migrants to the U.S. As for the U.S. economy,
neither changes in wages nor inflation appear to impact Haitian migration to the U.S.
However, change in Haiti’s inflation rate does alter flows. Specifically, as inflation
climbs, Haiti to U.S. migration also climbs. Moreover, UN sanctions seemed to
dramatically increase Haitian interdiction counts. Yet, those sanctions overlapped with a

39
repressive military regime. Such facts make it difficult to separate out the economic and
political factors.
In terms of its impact on the literature, the study expands the literature by using
the week as the unit of analysis. We contend that this choice allows detection of more
nuanced changes in the migratory process. Furthermore, the study yields insight into a
particular case. Interestingly, the results of the study resemble the results generated from
large-N pooled-time-series designs. Finally, it opens new avenues for exploration. Our
study in many places assumes indirect effects of some of the variables yet tests them as
direct effects. In the future for example, we can model government-dissident dynamics
(Moore 1998; Moore 1998; Shellman 2006) which would lead to predictions in the
escalation of conflict and serve as an early-warning mechanism for subsequent Haitian
flight. Similarly, we can model the impact that foreign policy has on domestic policy and
subsequently on migration. In short, the study opens up the possibility of exploring the
migration process using multiple-equation modeling techniques.
That said, our study provides evidence that many Haitian migrants are in fact
refugees under the 1951 UN Convention’s definition. U.S. foreign policy continues to
reject the notion that the Haitian people flee their homeland in fear of persecution.
Rather, the U.S. government promotes the idea that such people are fleeing economic
deprivation. Although it is difficult to separate the impact of the failing economy from
the impacts of security, there appears to be a direct impact of violence on Haitian
migrants even when the economy is not fluctuating so rapidly. This suggests that while
there are economic concerns there are also distinct security concerns that cause Haitians
to flee. However, for the most part, the U.S. policy of rejecting Haitian migrants on the
grounds that they are economic migrants, calls into question whether or not they are often
40
violating the UN’s principle of ‘nonrefoulment.’ The U.S. “gets away with it” by
claiming that Haitians are “bogus refugees” and not acknowledging the evidence of
security concerns.
Aside from calling in to question U.S. policy on the handling of Haitian migrants,
the study has additional implications. For example, we found that rebel violence and the
status of the Haitian economy were the two strongest factors in determining the number
of Haitian migrants to the U.S. These factors provide insight into the refugee question as
well as a basis for long-term policy advice on handling the large influx of Haitian
migrants. These findings support policy which would seek to stabilize the government in
Haiti as well facilitate the growth of their economy in an attempt to decrease the number
of Haitian migrants to the U.S.

41
References
Bauer, Thomas, and Klaus Zimmermann. 1994. “Modeling International Migration:
Economic and Econometric Issues.” In Causes of International Migration, edited
by Rob van der Erf and Liesbeth Heering, 95-115. Brussels: Statistical Office of
the European Communities.
Borjas, George J.1994. “The Economics of Immigration.” Journal of Economic Literature
32 (4):1667-1717.
Campbell, Donald T. and Julian C. Stanley. 1966. Experimental and Quasi-Experimental
Designs for Research. Chicago: Rand McNally.
Davenport, Christian, Will H. Moore & Steven C. Poe. 2003. “Sometimes You Just Have
to Leave: Domestic Threats and Forced Migration, 1964-1989.” International
Interactions 29:27-55.
Ferris, Elizabeth G. 1998. Uprooted! Refugees and Forced Migrants. Cincinatti:
Friendship Press.
Freeman, John R. 1989. "Systematic Sampling, Temporal Aggregation, and the Study of
Political Relationships." Political Analysis 1: 61-88.
Gibney, Mark, Clair Apodaca & James McCann. 1996. “Refugee Flows, The Internally
Displaced and Political Violence (1980-1993): An Exploratory Analysis.” In
Whither Refugee? The Refugee Crisis: Problems and Solution, edited by A.P.
Schmid. Leiden: PIOOM.
Goldstein, Joshua S. 1992. "A Conflict-Cooperation Scale for WEIS Events Data."
Journal of Conflict Resolution 36: 369-85.

42
Kaufmann, Chaim. 1998. "When All Else Fails: Ethnic Population Transfers and
Partitions in the Twentieth Century." International Security 23(2): 120-156.
King, Gary. 1989a. “Variance Specification in Event Count Models: From Restrictive
Assumptions to a Generalized Estimator.” American Journal of Political Science
33(3): 762-84.
Lewis-Beck, Michael S. and John R. Alford. 1980. “Can Government Regulate Safety?
The Coal Mine Example.” The American Political Science Review. 74(3): 745-
56.
Loescher, Gil. 1993. Beyond Charity: International Cooperation and the Global Refugee
Crisis. New York: Oxford University Press.
Loescher, Gil & Ann Loescher. 1994. The Global Refugee Crisis: A Reference
Handbook. Santa Barbara: ABC-CLIO.
Long, J. Scott. 1997. Regression Models for Categorical and Limited Dependent
Variables. Thousand Oaks: Sage.
Massey, Douglas S., Joaquín Arango, Graeme Hugo, Ali Kouaouci, Adela Pellegrino and
J. Edward Taylor. 1993. "Theories of International Migration: A Review and
Appraisal." Population and Development Review 19(3):431-466.
McAdam, Doug. 1982. Political Process and the Development of Black Insurgency,
1930-1970. University of Chicago Press.
Moore, Will H. and Stephen M. Shellman. 2004a. “Fear of Persecution, 1952-1995.”
Journal of Conflict Resolution 48(5): 723-745.
Moore, Will H. & Stephen M. Shellman. 2004b. “Whither Will They Go? A Global
Analysis of Refugee Flows, 1955-1995.” Paper presented at the annual meeting of
the Midwest Political Science Association, Chicago, 15-17 April.

43
Neumayer, Eric. (2005a). “Bogus Refugees? The Determinants of Asylum Migration to
Western Europe,” Forthcoming in International Studies Quarterly.
Neumayer, Eric. (2005b). “Influences on Asylum Recognition Rates in Western Europe.”
Journal of Conflict Resolution 49(1): 43-66.
Saleyhan, Idean & Kristian Gleditsch. 2004. “Refugee Flows and the Spread of Civil
War,” working paper, University of California, San Diego.
Schmeidl, Susanne. 1997. “Exploring the Causes of Forced Migration: A Pooled Time-
Series Analysis, 1971-1990.” Social Science Quarterly 78(2): 284-308.
Schmeidl, Susanne. 1998. “Comparative Trends in Forces Displacement: IDPs and
Refugees, 1964-96.” In Internally Displaced People: A Global Survey, edited by
J. Hampton. London: Earthscan Publications, pp. 24-33.
Schmeidl, Susanne. 2000. “The Quest for Accuracy in the Estimation of Forced
Migration.” In Humanitarian Action: Social Science Connections, edited by
S.C. Lubkemann, L. Minear and T.G. Weis. Providence: Occasional Paper #37,
Thomas J. Watson, Jr. Institute for International Studies, pp. 127-157.
Schrodt, Philip A. 1998. “KEDS: Kansas Event Data System Manual.” Typescript.
Shellman, Stephen M. 2004. “Time Series Intervals and Statistical Inference: The Effects
of Temporal Aggregation on Event Data Analysis.” Political Analysis 12(1): 97-
104.
Shellman, Stephen M., Brandon M. Stewart, and Andrew Reeves. 2005. Project Civil
Strife Codebook, v1.0. Typescript. College of William & Mary.
Vuong, Q. 1989. “Likelihood ratio tests for model selection and non-nested hypotheses.”
Econometrica 57 (2), 307–333.
44
Wood, Dan 1988. “Principals, Bureaucrats, and Responsiveness in Clean Air
Enforcements.” American Political Science Review 82(1): 213-234.
Zolberg, Aristide R., Astri Suhrke & Sergio Aguayo. 1989. Escape From Violence:
Conflict and the Refugee Crisis in the Developing World. New York: Oxford
University Press.
45
Figure 1 Haiti Timeline of Events, 1990-2004

46
Table 1 Descriptive Statistics
Variable Mean Standard Deviation Minimum Maximum
U.S. Interdictions of Haitian Migrants
33.31 96.07 0 758
Monthly ∆Haiti CPI 0.74 15.26 -192.81 25.33 Haiti CPI Dummy 1996-2004 0.53 0.49 0 1 Average Weekly Rebel to Government Behavior -0.73 2.30 -10 10 Average Weekly Government to Rebel Behavior -0.73 2.20 -10 8.3 Coup 1991 Dummy 0.039 0.19 0 1 Coup 1991 Counter 0.545 3.12 0 27 Coup 1991 Counter Squared 10 66.64 0 729 Coup 2004 Dummy 0.02 0.13 0 1 Coup 2004 Counter .10 .85 0 11 Coup 2004 Counter Squared 0.74 7.57 0 121 Aristide Dummy 1994-1996 0.09 0.29 0 1 Aristide Counter 1994-1996 2.81 10.46 0 62 Aristide Counter Squared 1994-1996 117.20 511.39 0 3844 Preval 0 1 Aristide 2001-02 Dummy 0.21 0.41 0 1 Aristide 2001-2002 Counter 15.06 35.012 0 144 Aristide 2001-2002 Counter Squared 1451.256 4012.25 0 20,736 Average Weekly U.S. Foreign Policy towards both Government & Rebels
0.05 2.02 -10 7.87
OAS Economic Sanctions 10/14/1991- 6/22/1993 0.12 0.33 0 1 UN Economic Sanctions 6/23/1993-10/1994 0.09 0.29 0 1 UN Economic Sanctions 1993 Counter 2.82 10.47 0 62 UN Economic Sanctions 1993 Counter Squared 117.42 511.62 0 3,844 Operation ABLE MANNER (1994) 0.13 0.33 0 1 Monthly ∆ U.S. CPI 0.21 0.22 -0.41 0.81 Monthly ∆ U.S. Wages 0.03 0.06 -0.11 0.20 Clinton 1st Administration 0.28 0.45 0 1 Clinton 2nd Administration 0.28 0.45 0 1 Bush Jr. 1st Administration 0.24 0.43 0 1 Hurricane Georges Dummy (1998) 0.05 0.54 0 8 Hurricane Georges Counter (8weeks) 0.01 .11 0 1 Hurricane Georges Counter Squared 0.29 3.55 0 64 Count 348.5 201.06 1 696

47
A: Includes Zeros
0.0
05.0
1.0
15.0
2.0
25D
ensi
ty
0 200 400 600 800 1000Weekly Haitian Interdictions
B: Excludes Zeros
0.0
02.0
04.0
06.0
08D
ensi
ty
0 200 400 600 800Weekly Haitian Interdictions
Figure 2 Histograms of Total Weekly Haitian Interdictions by U.S. Coast Guard, 1990-2004

48
Table 2 Zero Inflated Negative Binomial Estimates of Weekly Haitian Interdictions by U.S. Coast Guard (1990-2004)
Count Inflate Category Variable
Coefficient (SE) IRR Coefficient (SE)
Haiti Economy Monthly ∆Haiti CPI 0.042 (.018)*** --- 0.010 (.043) Haiti CPI Dummy 1996-2004 -0.435 (.378) 0.647 -0.448 (.292)*
Haiti Security Average Weekly Rebel to Government Behavior -0.127 (.035)*** --- -0.029 (.037) Average Weekly Government to Rebel Behavior 0.027 (.047) --- -0.023 (.039) Coup 1991 Dummy -2.39 (1.28)** 0.092** 0.405 (.578) Coup 1991 Counter (28 weeks) 0.392 (.175)** --- --- Coup 1991 Counter Squared -0.014 (.006)*** --- --- Coup 2004 Dummy -3.47 (.806)*** 0.031*** -0.927 (1.15) Coup 2004 Counter (?? weeks) 2.09 (.392)*** --- Coup 2004 Counter Squared -0.231 (.037)*** --- ---
Haiti Politics Aristide 1994-96 Dummy -0.645 (.624) 1.91 -0.441(.392) Aristide 1994-1996 Counter -0.119 (.057)** --- --- Aristide 1994-1996 Counter Squared 0.002 (.001)*** --- --- Préval 1996-2001 Dummy -2.17 (.652)*** 0.114*** 0.637 (.995) Aristide 2001-02 Dummy -1.31 (.623)** 0.269** -0.033 (.991) Aristide 2001-2002 Counter -0.015 (.011)* --- --- Aristide 2001-2002 Counter Squared 0.0001 (.000)* --- ---
Foreign Pressures Average Weekly U.S. Foreign Policy towards both
Government & Rebels -0.067 (.035)** --- 0.012 (.046)
OAS Economic Sanctions 10/14/1991- 6/22/1993 0.819 (.279)*** 2.27*** -0.500 (.418) UN Economic Sanctions 6/23/1993-10/1994 1.04 (.819)* 2.83* -1.218 (.791)* UN Economic Sanctions 1993 Counter 0.074 (.025)*** --- --- UN Economic Sanctions 1993 Counter Squared -0.001 (.000)*** --- --- Operation ABLE MANNER (1994) -1.94 (.802)*** 0.144*** 0.760 (.628)
United States Economy Monthly ∆ U.S. CPI -0.379 (.304) --- 0.463 (.437) Monthly ∆ U.S. Wages 0.092 (1.49) --- 1.89 (1.52)
Natural Disasters Hurricane Georges Dummy (1998) 1.02 (.450)** 2.77** -0.558 (.780) Hurricane Georges Counter (8weeks) 1.189 (.273)*** --- --- Hurricane Georges Counter Squared -0.218 (.033)*** --- ---
Time Count 0.001 (.001) --- ---
Constant 7.24 (.789)*** --- 0.537 (1.06) N (zeros) 692 (490)
Model Fit Alpha (Poisson v. Negative Binomial) 1.12 (.123)*** Wald Chi-Square 757.12*** Vuong Tests (Likelihood Ratio Tests)
Negative Binomial v. ZINB 5.21*** Baseline v. MITS 51.32***
Significance Levels: *** = .01 level; ** = .05 level; * = .10 level (one tail tests)
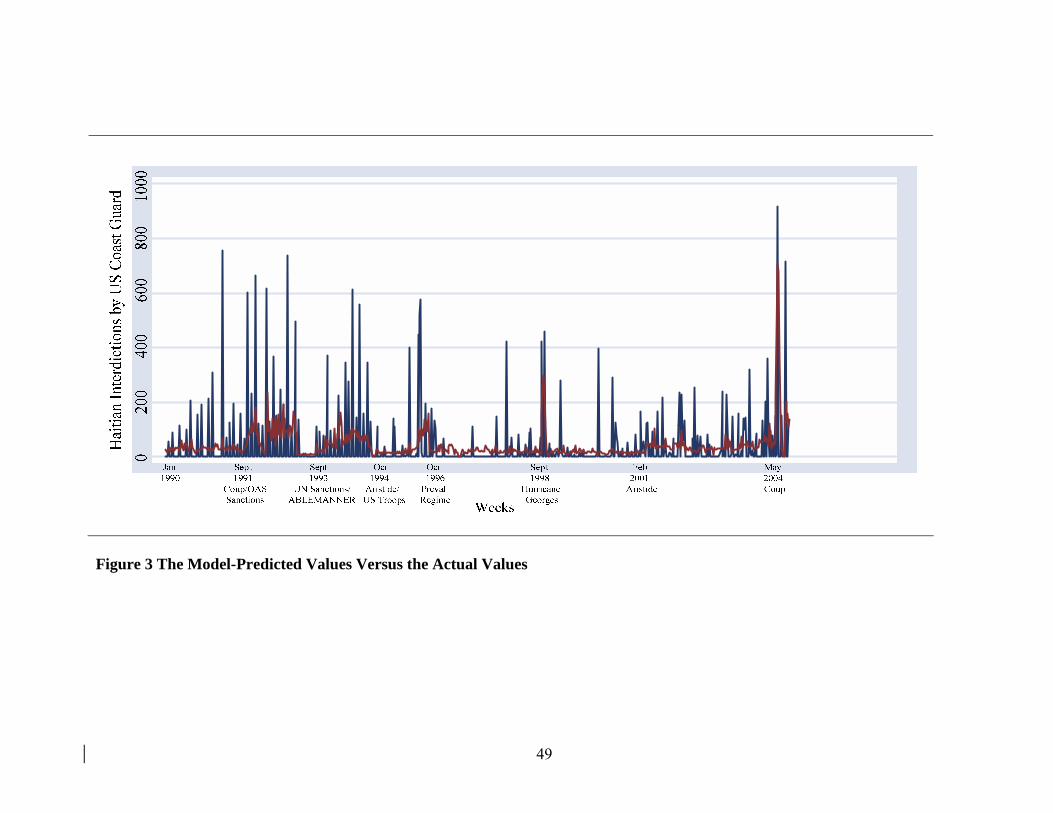
49
Figure 3 The Model-Predicted Values Versus the Actual Values

50
Figure 4 Predicted Change in Interdiction Counts Given Changes in the Independent Variables (IVs)
A. Change from Minimum Value to Maximum Value
-700
-200
300
800
1300
Coup 1991 OAS Sanctions UN Sanctions ABLEMANNER Preval Hurricane Georges
B. Change from Mean to +1/2 SD Above Mean
-75
-50
-25
0
25
50
75
100
125
150
175
∆ Haiti CPI Rebel Behavior GovernmentBehavior
US Foreign Policy ∆ US CPI ∆ US Wages
Note: For the calculations, all dummy and counter variables are held at zero and all other variables at their means.
Hai
tian
Inte
rdic
tions
H
aitia
n In
terd
ictio
ns
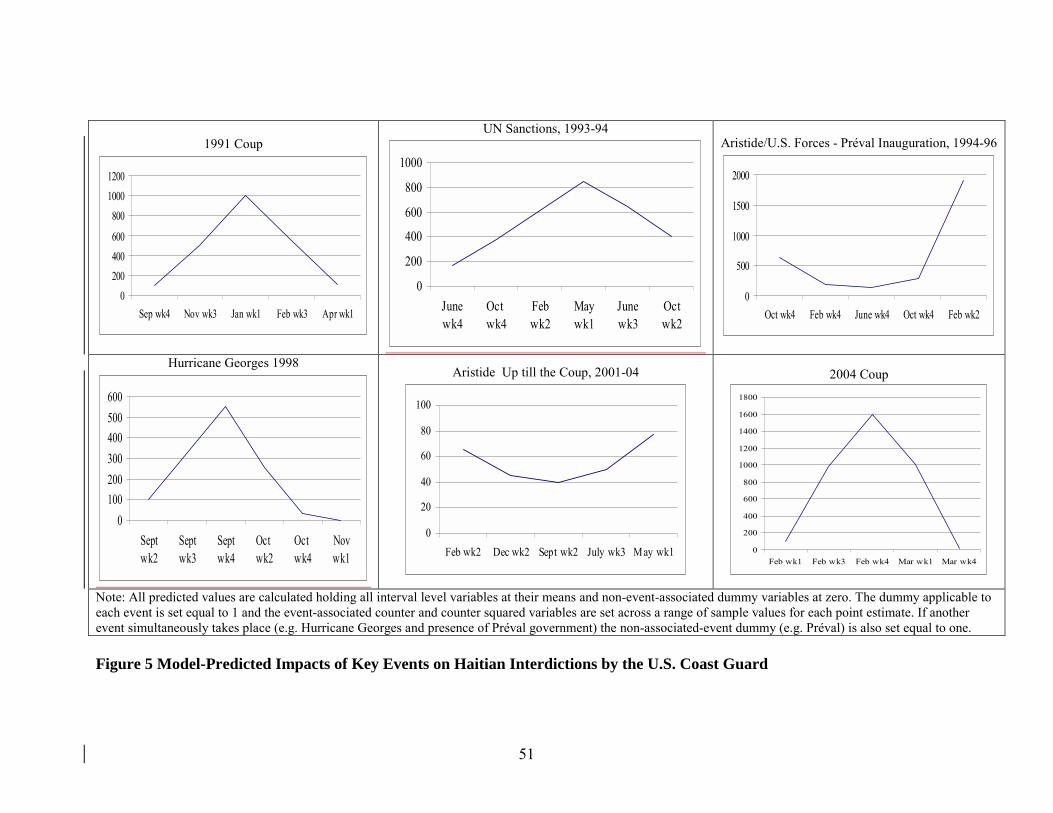
51
1991 Coup
0200400600
80010001200
Sep wk4 Nov wk3 Jan wk1 Feb wk3 Apr wk1
UN Sanctions, 1993-94
0
200
400
600
800
1000
Junewk4
Oct wk4
Feb wk2
Maywk1
Junewk3
Oct wk2
Aristide/U.S. Forces - Préval Inauguration, 1994-96
0
500
1000
1500
2000
Oct wk4 Feb wk4 June wk4 Oct wk4 Feb wk2
Hurricane Georges 1998
0100200300400500600
Septwk2
Septwk3
Septwk4
Oct wk2
Oct wk4
Novwk1
Aristide Up till the Coup, 2001-04
0
20
40
60
80
100
Feb wk2 Dec wk2 Sept wk2 July wk3 May wk1
2004 Coup
0
200
400
600
800
1000
1200
1400
1600
1800
Feb wk1 Feb wk3 Feb wk4 Mar wk1 Mar wk4
Note: All predicted values are calculated holding all interval level variables at their means and non-event-associated dummy variables at zero. The dummy applicable to each event is set equal to 1 and the event-associated counter and counter squared variables are set across a range of sample values for each point estimate. If another event simultaneously takes place (e.g. Hurricane Georges and presence of Préval government) the non-associated-event dummy (e.g. Préval) is also set equal to one. Figure 5 Model-Predicted Impacts of Key Events on Haitian Interdictions by the U.S. Coast Guard