political economy of industrial policy in turkey: the case ... · political economy of industrial...
TRANSCRIPT

email: [email protected] Effective States and Inclusive Development Research Centre (ESID) Global Development Institute, School of Environment, Education and Development, The University of Manchester, Oxford Road, Manchester M13 9PL, UK www.effective-states.org
ESID Working Paper No. 90
Political economy of industrial policy in Turkey: The case of the automotive industry
Erol Taymaz1 and Kamil Yilmaz2
September, 2017
1Middle East Technical University (METU) Email correspondence: [email protected] 2 Koç University Email correspondence:[email protected]
ISBN: 978-1-908749-91-8

Political economy of industrial policy in Turkey: The case of the automotive industry
1
Abstract
In this paper, we analyse the industrial and trade policies in Turkey in relation to their impact on the automotive industry. Established during the import substituting industrialisation era of the 1960s and 1970s, the Turkish automotive industry had seized the opportunities opened up with the customs union agreement between Turkey and the EU that went into effect in 1996. As such, it provides a good example of how an industry with an initially protected home market can be transformed into a competitive and increasingly export-oriented industry through foreign direct investment (FDI) inflows.
In one of the important conclusions of our study, we emphasise the lack of a well-designed, long-term industrial development perspective in place, leading to the current state of the Turkish automotive industry. Rather, the automotive firms that performed well in recent decades did so thanks to their organisational capabilities and experience in international competition. Our analysis of export patterns shows that Turkey’s place in the international division of labour has been determined by the decisions of multinational firms. Motor vehicle manufacturers in Turkey were able to readjust their positions vis-à-vis European value chains by skillfully managing the benefits of geography (proximity to European markets) and the country’s metalworking capability. However, existing tax policies that rely heavily on indirect taxes have created significant obstacles for automotive firms, which in principle can move their production and R&D activities in Turkey towards high quality/high value-added segments of the industry.
Keywords: Automotive industry, industrial policy, foreign direct investment, global
value chains, Turkey-EU customs union, tax policy, R&D policy, trade networks.
Acknowledgements:
The report was funded by the Effective States and Inclusive Development Research Centre (ESID), a project funded by UK Aid from the UK government for the benefit of developing countries. However, the views expressed and information contained in it are not necessarily those of, or endorsed by the UK government, which can accept no responsibility for such views or information or for any reliance placed on them. The report is partially funded by Sabanci University-TUSIAD Competitiveness Forum. We thank Izak Atiyas, Anthony Black and Brian Levy for helpful and constructive comments.
Taymaz, E. and Yilmaz, K. (2017) Political economy of industrial policy in Turkey The case of the automotive industry. ESID Working Paper No. 90. Manchester, UK: The University of Manchester. Available at www.effective-states.org

Political economy of industrial policy in Turkey: The case of the automotive industry
2
1. Introduction
Industrialists, as an interest group, have heavily influenced the trade and industrial policymaking process in Turkey since the 1970s. Even after the country decided to move from an import-substituting strategy towards an export-oriented growth strategy in 1980, key import-competing sectors were able to slow down the trade liberalisation process using their influence on policymakers. The customs union (CU) agreement between Turkey and the EU that came into effect in 1996 was a critical turning point in the Turkish policymaking process. The CU agreement limited the power of domestic interest groups in influencing the trade policymaking process, by committing the government to trade liberalisation vis-à-vis EU members. As such, the CU forced Turkish industry to undertake productivity-enhancing investments in the late 1990s, which would enable it to compete with imports from the EU. When the 2001 financial crisis hit domestic markets hard, Turkish exporters were ready to switch their focus to export markets, and especially to European markets. Turkish aspirations to become a member of the EU go back to the 1950s. According to the 1963 Ankara Agreement, the two sides were expected to form a CU in the 1990s. The European side had already removed all tariff barriers against Turkish manufactured products before the 1990s. In order to signal its good intentions in abiding by the spirit of the Ankara Agreement, at a time when the European side expected Turkey to improve its democracy, and that a free trade agreement between the two sides would suffice to deepen economic ties, Turkey decided to go ahead with the CU. In this study, we analyse the industrial and trade policymaking process in relation to its impact on the automotive industry. 1 There are good reasons to choose the automotive industry for this study. It has been a showcase of import-substituting policies in Turkey since the late 1960s. Turkish automotive companies were jointly owned and managed by domestic investors and multinational corporations (MNCs). Protected behind high tariff walls for at least three decades since the mid-1960s, these companies had undertaken production with old/outdated technology transferred from other MNC factories to produce low-quality products domestically. As long as quota and tariff protection continued, these joint ventures were bound to make profits. In the negotiation stage of the CU agreement, the automotive industry was expected to be one of the industries seriously affected by the CU. However, since the CU came into effect in 1996, the automotive industry has become one of the most vibrant sectors of the Turkish economy.
1 Hereafter, ‘automotive industry’ refers to motor vehicles (ISIC 3410); automobile bodies, trailers, and semi-trailers (ISIC 3420); and parts/accessories for automobiles (ISIC 3430) based on International Standard Industrial Classification (ISIC), Rev. 3.

Political economy of industrial policy in Turkey: The case of the automotive industry
3
The successful development of the Turkish automotive industry since the mid-1990s is a product of several factors that are not necessarily connected. First of all, the import-substituting policies from the 1960s to the 1980s provided the industry with a rather long period during which it was protected from import competition. Furthermore, protection from import competition continued, albeit with a downward trend, even after the country started its trade liberalisation in the 1980s. It was not only the owners of the main motor vehicle producers who benefited from the government policies, but also parts and accessories manufacturers, employees and distributors in the sector. The long period of protection from imports helped these groups achieve higher levels of income relative to their counterparts in other industries, but at the same time accumulate substantial knowledge and experience in the sector. This learning process later proved to be critical for the industry to carry on in the face of macroeconomic uncertainty and increased import competition in the 1990s. When the industry was forced to compete with imports, it showed great resistance. However, it succeeded in making good use of the transition period provided by the CU decision. As a result, the CU decision enabled the successful integration of the industry within global value chains. Furthermore, in the absence of sizeable domestic production in high-tech industries, the increased competitiveness of automotive firms provided an opportunity to develop knowhow and skills in medium-high technology production processes. Along with its successful integration into global auto value chains, the Turkish automotive sector has taken the government’s R&D policy seriously. As a result, major automotive and parts and components manufacturers have invested in new R&D centres. Yet, their R&D efforts are still very meagre – and a success in the R&D field requires many more years of experience and other factors in place, such as the availability of well-educated engineers and specialists. Government policies continue to hinder the growth of the industry. The current tax system, with its heavy reliance on indirect taxes, presents the main challenge for the industry. The tax system forces automotive firms to focus their production on automobiles with smaller engine powers, as well as light commercial vehicles (LCVs), both of which require much less R&D investment compared to cars at the higher end of the market. In order to provide information about the Turkish automotive industry, as well as the institutional background, we start our analysis with a detailed account of the history of the industry and industrial and trade policy implementation in Turkey. Then we show how the industry successfully overcame the challenges introduced with the CU decision. Rather than just focusing on the immediate aftermath of the CU decision, we focus on the structural transformation of the industry throughout the 2000s. Finally, we delve into a discussion of the potential threats, challenges and opportunities facing the industry. In particular, we discuss how the current R&D policy

Political economy of industrial policy in Turkey: The case of the automotive industry
4
enhances investment in the sector, while at the same time, how the current tax policy forces the industry to specialise in the lower segment of the market – which in turn may reduce the future investment potential of the industry, both in production and R&D facilities.
2. Industrial and trade policies and the automotive industry
2.1. Import-substituting industrialisation (1960s and 1970s)
The Turkish automotive industry dates back to the 1950s. Initially, the industry focused on the production of tractors, followed by heavy and light commercial vehicles, to satisfy the demands of the state and private sector. The first tractor plant, Turk Tractor, went into operation in 1954. Domestic automotive production got a serious push from the implementation of the First Five Year Development Plan (FYDP) between 1963 and 1967. The plan foresaw a growth rate of 12.9 percent per annum for the industry. Consistent with this ambitious growth target, the plan also set forth the principles of import substitution policies to develop domestic industry. There was specific reference in the plan to the locomotive role of the automotive industry in the industrialisation process (See Yucel, 2015: 58). Under the guidance of the plan, major bus and truck plants were established from 1963 to 1968 (Otokar in 1963, A.I.O.S., BMC, Karsan and MAN in 1966, and Mercedes Benz in 1968). Domestic automobile production started in the second half of the 1960s, with meagre capacity. After an unsuccessful attempt by the State Railways to commercially produce a domestic car named ‘Devrim’ in 1961, Ford Otosan undertook a similar attempt in 1966 and started producing a domestic car called ‘Anadol’, and made it a commercially successful brand. While encouraging the private sector to produce domestic cars, trucks and buses, the government wanted to make sure that these plants, that were mainly assembling final products from imported bodies, engines and other parts, would increase the domestic content of their products. Otherwise, the high current account deficit problem could not be resolved. As part of its efforts to reduce dependence on imported materials, the government issued the ‘Assembly Industry Order’ in April 1964. The Order’s main objective was to increase the use of domestic parts and intermediate products in the production of final products. The Order did not impose the production of all products domestically. Rather, it foresaw the beginning of the domestic assembly of major final products from imported as well as domestic inputs. Consistent with this objective, it provided detailed lists of parts and intermediate materials that were to be produced domestically or imported. The Order covered products such as refrigerators, washing machines, trucks, tractors, buses and automobiles. It also made it imperative for the producers to increase the domestic content over time.

Political economy of industrial policy in Turkey: The case of the automotive industry
5
The first three development plans were implemented in the period from 1963 to 1977. The policies implemented were successful in generating rapid growth. Over this period, industrial output growth reached 9.5 percent per annum, while the average growth rate for the whole economy was 6.5 percent per annum. During this period, private sector investment, and hence production capacity in the textiles and apparel, food, and consumer durable goods industries increased significantly. The second FYDP of 1968-72 was also critical in the creation of an environment for the development of the automotive industry. Unlike the first development plan of 1962-67, which aimed at the balanced growth of agriculture and industry, the second plan of 1968-72 specifically gave priority to industry. While the state was given the lead in investment and intermediate goods industries, the private sector was encouraged to invest in consumer goods sectors. Furthermore, the plan made sure that the newly established industries would be protected from foreign competition until they attained a minimum level of competitiveness that would help them stand against foreign competition. In addition, the second FYDP provided impetus to the urbanisation process, which would in effect improve both the supply and demand conditions for the fragile domestic industry. The rapidly increasing population of urban areas would increase the supply of labour for the rapidly growing industry. In addition, rapid urbanisation would increase demand for the flourishing consumer durable goods industries. During the implementation of the second FYDP, TOFAŞ and OYAK Renault automobile plants started their production in 1971. Compared to commercial vehicle plants that had started their operations in the 1960s, the two automobile plants involved larger production scales. While fewer than 4,000 cars were produced in 1970, within five years, automobile production jumped to 72,000 units in 1975. The timing of the assembly plant investments was perfect. The early 1970s had proven to be an important turning point for the industry, as demand for cars swelled along with the urban middle-income population. In the first half of the 1970s, production of tractors, trucks and light commercial vehicles also gained momentum. As a result, total production increased from 23,000 in 1970 to reach its peak of 146,000 units in 1976. Approximately 43 percent of production in 1976 was accounted for by cars, 32 percent by commercial vehicles and 25 percent by tractors (see Figure 1). Private sector investment in the 1960s focused mostly on small-scale investments, the undertaking of which would not create a heavy burden on the trade balance. However, as both public and private sector investments grew over time, they imposed a heavier burden on the trade balance. That is why the import substitution policies in effect in the 1970s were more advanced versions of the import substitution policies that had been in effect in the 1960s.

Political economy of industrial policy in Turkey: The case of the automotive industry
6
Figure 1: Automotive industry production (1963-89, thousand units)
Source: TurkStat.
The industrial policies of the 1960s and 1970s included both vertically discriminating and non-discriminating aspects with respect to industrial sectors. Unlike the successful industrial policies of South Korea, Thailand and other Southeast Asian countries, the industrial policies of the planned era were not conditional on firms’ ability to reach specific targets determined by the state (Turel, 2007). Actually, the technocrats in the government that was briefly in power after the 1960 coup wanted economic plans to include binding targets, not only for the public sector, but also for the private sector. As a result, the private sector would have to achieve specific targets in order to enjoy the benefits of the industrial and import-substituting trade policies. However, the centre-right parties that came to power in the second half of the 1960s and throughout the 1970s did not want to follow policies that they viewed as working against market principles. Furthermore, while both politicians and bureaucrats favoured the use of protectionist trade policies to prevent the worsening of the trade balance, until the 1980s they never thought of providing export incentives to improve the trade balance. As an industry that requires the integrated production of the final product, the automotive industry had played a locomotive role in the development of other major manufacturing industries. Automotive manufacturing involved casting, forging, metal removing, sheet-iron bending and cutting, upholstery, painting and serial production techniques. As a result, it had direct backward linkages with many other industries. At the same time, import-substituting policies and the industrial policies of the 1960s and 1970s (the so-called ‘assembly industry order’) were instrumental in the development of an auto parts industry along with the main automotive plants. The first half of the 1970s was also important for the development of the industry, in that the rapid success of domestic assembly plants led to increased investment in auto part plants, mostly in the Marmara region.

Political economy of industrial policy in Turkey: The case of the automotive industry
7
The surge in car demand was taking place in the midst of rapid hikes in global oil prices. The governments of the time decided not to reflect the world oil price increases in the domestic market, which helped keep the number of car sales high. The industry’s robust growth could not last very long, however. Both the demand- and supply-side troubles that affected the Turkish economy in the late 1970s also hampered the prospects of the automotive industry. First, the government’s decision not to increase domestic gasoline prices in the face of increasing global oil prices led to a substantial increase in both the trade deficit as well as the government budget deficit. The rapidly emerging twin deficits finally led to the balance of payments crisis in 1979. At the same time, on the supply side, the industry suffered from significant workday losses, due to the intensification of politically motivated union activity and strikes. As domestic industrial production increased throughout the 1960s and 1970s, labour union membership increased substantially. In the politically charged environment of the second half of the 1970s, unions started using their power and organised stops to increase real wages. The automotive industry suffered significantly from the resulting working day losses. As a result of these demand- and supply-side shocks, total production in the sector, that had reached as high as 146,000 units in 1976, dropped by more than 50 percent to 68,000 in 1980 (see Figure 1). But it was not only the automotive industry that was suffering. The whole economy went into disarray. GDP contracted in both 1979 and 1980. Inflation increased to above 20 percent. The political atmosphere was worsening even faster than economic performance. Extreme right- and left-wing political opponents were on the brink of civil war. Thise political and economic spiral could not last very long.
2.2. Export-oriented policies of the 1980s and 1990s
The year 1980 was one of change in both economic and political spheres. On 24
January 1980, the Demirel government announced a new macroeconomic stabilisation package, which also carried the roots of liberal economic policies. Turkey finally decided to take the route that had been suggested by the IMF and the World Bank in the late 1970s and abandoned its already failed import-substituting policies of the 1960s and 1970s for what was called ‘the export-oriented growth strategy’. Even though the macroeconomic stabilisation package included a set of policy actions in the right direction, in the prevailing political atmosphere its successful implementation was almost impossible. Drastic changes in the political scene that were to take place before the end of the year changed the prospects of the 24 January economic measures. On 12 September 1980, blaming political and economic instability and the state of anarchy in the country, top generals of the military overthrew the democratically elected government and took power. The military takeover changed the scene dramatically. The military supported the economic policies of the Demirel

Political economy of industrial policy in Turkey: The case of the automotive industry
8
government. Turgut Ozal, who was the brainpower behind the 24 January stabilisation package, was appointed as the minister in charge of economic affairs. These developments ensured not only the implementation of the macroeconomic stabilisation package, but also the new export-oriented growth strategy. The exported-oriented growth strategy stood on two main pillars. The first and more urgent one was to provide subsidies to domestic producers to direct them towards selling their products in international markets. Without increasing exports, it was impossible to keep the trade balance under control. The second pillar of the export-oriented growth strategy was to gradually liberalise imports, which involved easing quantitative restrictions and lowering tariffs. In theory, as domestic producers faced more competition from imports, they would be forced to improve their productivity and upgrade their products in order to survive. In terms of the basic principles and the conduct of the trade and industrial policies, 1980 was an important turning point. As the overall economic policy framework switched from import-substituting industrialisation towards the export-oriented growth strategy in the early 1980s, there was a major switch in the implementation of industrial policies as well. While in the import-substituting era, industrial policies were implemented in a vertical fashion across industries, under the export-oriented growth era, industrial policies were implemented in a horizontal fashion. Instead of providing incentives to a select group of sectors, sub-sectors or firms, the industrial policies of post-1980 provided incentives for activities or characteristics of firms that may be observed horizontally in all sectors. Among the policies of the post-1980, one can count investment subsidies provided to small and medium enterprises, or to all firms that undertake research and development (Turel, 2007). In the early years of the strategy (1980-83), exports were encouraged through various direct and indirect measures, such as export tax rebates, preferential export credits, foreign exchange allocations and duty-free access to imports. During this period, the total subsidy rate (which incorporates tax rebates, preferential credit, and foreign exchange allocation for duty-free imports) received by manufactured goods exporters reached 20-23 percent of export value (Milanovic, 1986). The elimination of import barriers gained momentum after 1984. First, quantitative restrictions were rapidly phased out, and a large number of imported goods were allowed without any prior permission (Togan, 1994). Second, there were significant reductions in tariff rates, especially on imports of intermediate and capital goods in the late 1980s and early 1990s. Though tariffs on certain goods (for example, consumer durables) were increased temporarily after the elimination of quantitative restrictions, this did not lead to an increase in overall nominal protection rates, because imports of the goods in these categories were severely restricted before 1984. From a level of 76.9 percent in 1984, the output-weighted average nominal tariff rate for the manufacturing industry declined to 40 percent in 1990 and to 20.7 percent in 1994.

Political economy of industrial policy in Turkey: The case of the automotive industry
9
Figure 2: Exports and imports of automotive subsectors (bn US$, 1969-96)
Source: TurkStat.
Until 1984, imports of motor vehicles and engines amounted to less than $250 million a year. With the liberalisation efforts affecting the sector very little, between 1984 and 1989 imports of motor vehicles and engines fluctuated between $160 and $290 million (Figure 2). Imports of automotive parts and components also stayed very low (less than $50 million) for a long period before 1984. From 1984 to 1989, this steadily increased to $300 million. Compared to imports today, these import figures amount to nothing, but when we consider that for most of 1980s the country’s total exports were less than $10 billion and total automotive exports in 1990 were only $174 million, the steadily increasing automotive imports could be a cause for concern for the government. As part of the trade liberalisation efforts that started in the first half of the 1980s, and in preparation for the CU agreement with the EU, the Turkish government started gradually lowering tariffs on auto imports in 1989. As a result, from 1989 onwards, there was a more significant increase in imports of cars and trucks and their components in the 1990s, from $463 million in 1989 to $2.2 billion in 1993. After a correction during the 1994 crisis, total automotive imports had increased to 3.1 billion by 1996. Over the period, however, motor vehicle and engine imports increased more rapidly. While in 1989, parts and components imports accounted for two-thirds of the total industry imports, their share fell to one-third by1996.2
2 It is interesting to observe that policymakers in Turkey expected that, in spite of the decline in tariffs, motor vehicle imports would remain stable, whereas the share of parts and components imports would increase in the 1990-94 period, as a result of increasing domestic production (SPO, 1989: 243). Apparently, as a result of the rapid increase in the imports of motor vehicles, policymakers were forced to increase tariffs for motor vehicles in 1994 and 1995. The industry’s resilience during the turbulent decade of the 1990s and resistance against imports could be explained by the sensitivity of consumers to repair and maintenance costs. The networks of dealers and after-sales services established by domestic producers have been instrumental in protecting their market shares.
0.0
0.5
1.0
1.5
2.0
2.5
1969 1974 1979 1984 1989 1994
Motor Vehicles and Engines
Exports Imports
0.0
0.2
0.4
0.6
0.8
1.0
1.2
1969 1974 1979 1984 1989 1994
Auto parts, Bodies and Trailers
Exports Imports

Political economy of industrial policy in Turkey: The case of the automotive industry
10
As our four-digit ISIC sector tariff data starts in 1991, we cannot show that the tariffs on motor vehicles (with ISIC sector code 3410) went down more than those on parts and components (Figure 3). However, the fact that imports of motor vehicles increased much more than imports of parts and components provides us with indirect evidence to claim that this was indeed the case. Applied and MFN (most favoured nation) simple average of tariff rates for automotive parts and components (indicated by sector codes 3420 and 3430) were lowered significantly from 1993 to 1996, whereas simple average of tariff rates on imports of motor vehicles were increased several percentage points in preparation for the CU. Figure 3: Applied and MFN tariffs on automotive imports (percent, 1991-2001)
Source: The World Bank.
The divergence between the tariffs facing motor vehicle imports and those facing the imports of parts and components reveals that the government actually increased the effective rate of protection enjoyed by motor vehicle manufacturers. The increase in the average tariff rate facing final product imports, combined with a reduction in the tariff facing parts and components imports, effectively raises the value added in domestic prices further above the value added in foreign prices. Despite this fact, however, motor vehicles and engine imports increased in 1995 and 1996. Perhaps the increase in motor vehicles imports could have been much higher had the government decided to keep the average tariff rates on motor vehicle imports at their 1991-93 levels. The increase in automotive imports in the first half of the 1990s forced automotive manufacturers to undertake new investments to lower costs of production, as well to improve the quality of their products. For almost a decade, the industry’s total investment fluctuated within a band without any sign of upward movement. However, as imports started to pick up from 1989 onwards, the industry’s investment expenditures increased significantly, from around 300 million TL (in 1990 constant prices) in 1989 to 1.2 bn. TL in 1991 and stayed high until 1993. Most of these investments were in the form of machinery and equipment investment, nearly half of which was spent on imported machinery and equipment
0
2
4
6
8
10
12
1991 1992 1993 1994 1995 1996 1997 1998 1999 2000 2001
Percent
Applied Tariffs ‐‐ Simple Average
3410 3420 3430
0
2
4
6
8
10
12
14
16
18
1991 1992 1993 1994 1995 1996 1997 1998 1999 2000 2001
Percent
MFN Tariffs ‐‐ Simple Average
3410 3420 3430

Political economy of industrial policy in Turkey: The case of the automotive industry
11
Figure 4: Investment in the automotive industry (based on Annual Survey of Manufacturing Establishments [ASMI] by TurkStat)
Source: Authors’ calculations, using ASMI conducted by TurkStat.
The quality improvements in return helped a slight increase in exports of domestically produced cars and light-commercial vehicles in the first half of the 1990s, to surpass the $500 million mark by 1996. Exports of parts and components also increased throughout the 1990s, reaching $400 million by 1996. Despite the steady increase in exports, the trade deficit for the industry reached an all-time high figure of $2.1 billion (Figure 2). Along with the steadily increasing imports, the industry’s total production more than doubled, from 146,000 in 1989 to 453,000 in 1993 (Figure 5). The sector was able to increase production so quickly by both increasing installed capacity from 340,000 in 1989 to 590,000 in 1993 and increasing the capacity utilisation rate from 48 percent in 1989 to 77 percent in 1993. However, the 1994 crisis took its toll on the domestic car industry. Domestic production of motor vehicles fell by 41 percent from 1993 to 1994. In spite of the 1994 crisis, the industry was able to attract foreign direct investment (FDI), perhaps thanks to Turkish aspirations to become a member of the EU and the finalisation of the CU agreement. Multinational firms that hitherto had stayed away from undertaking production in Turkey established new plants: Toyota in 1994, Honda and Hyundai Assan in 1997. These were all small plants by international standards, with a capacity ranging from 20,000 to 50,000 units per year. Indeed, this has been the most preferred method of inward FDI flows in the Turkish automotive industry as well as the whole manufacturing sector. All these plants were established as joint ventures with local companies. Due to the presence of heavy bureaucracy, which was biased towards the protection of domestic firms, multinationals in automotive and other industries chose to take a domestic partner who would be politically strong enough to minimise bureaucratic barriers to entry.
0.0
0.2
0.4
0.6
0.8
1.0
1.2
1.4
1.6
1.8
2.0
1982 1984 1986 1988 1990 1992 1994 1996 1998 2000
Mill
ion
199
0 T
Ls
total machinerybuilding & structures Imported M&E

Political economy of industrial policy in Turkey: The case of the automotive industry
12
Figure 5: Automotive industry production (1990-2015, thousand units)
Source: TurkStat.
Figure 6. Installed production capacity and its utilisation
Source: Automotive Manufacturers’ Association (OSD).
Foreign affiliates that had been operating in Turkey increased their production capacity, by establishing new plants (for example, Ford in 2001) or by expanding existing ones (Toyota and Hyundai Assan). As a result, production capacity continued to increase, to reach 815,000 in 1998. Despite investments in the sector, however, the increasing macroeconomic, and political uncertainty and increased import competition between the 1994 and 2001 crises, kept the domestic motor vehicle production fluctuating within a band of 300,000 and 450,000 units. The capacity utilisation rate stayed below 50 percent throughout the rest of the 1990s and early 2000s (Figures 5 and 6).
0
10
20
30
40
50
60
70
80
90
100
0
200
400
600
800
1000
1200
1400
1600
1800
2000
1984 1986 1988 1990 1992 1994 1996 1998 2000 2002 2004 2006 2008 2010 2012 2014Capacity utilization rate (%; right axis) Installed capacity (left scale, 1000 units)

Political economy of industrial policy in Turkey: The case of the automotive industry
13
3. Customs union with the EU and impact on the automotive industry
It was not specific industrial policy measures, but rather the CU decision with the EU that forced domestic producers to fully integrate their production units with global automotive supply chains in the period from 1996 to 2004. As a result, during this period, the Turkish automotive industry emerged as an industry that could sustain its global competitiveness. The CU put an end to the heavily protected domestic auto market and forced auto industry firms to undertake investments. While the industry started to invest in new production facilities first and R&D later, the government and the bureaucracy had to learn to help the auto industry, as well as other sectors, via more subtle means, such as anti-dumping duties, technical standards and industrial policy measures. The agreement to form a CU between Turkey and the EU was signed in March 1995, but its history goes back to September 1963, when the institutions of the EU-Turkey Association Council were established by the Association Agreement, signed in Ankara (also called the ‘Ankara Agreement’). Being the final phase of this process, the CU agreement involved critical trade policy actions from the Turkish side, as the EU had already eliminated tariffs on Turkish imports in the first two phases. By signing the CU agreement, Turkey agreed to completely remove tariffs on EU manufacturing imports. Turkey agreed to impose the common external tariffs of the EU against third countries. The EU, in turn, agreed to eliminate quotas facing Turkish exporters of textiles and clothing. The CU had more serious implications for Turkey compared to other forms of associations, such as free trade agreements (FTA) or preferential trade agreements (PTA). As Turkey’s EU membership process continues, it is expected to include service sectors as well as public procurement and agriculture. As such, the CU also entailed the harmonisation of competition policies with those of the EU. The CU agreement required Turkey to adopt EU competition rules before the agreement went into effect in 1996. As part of the efforts to prepare for the CU, the Turkish parliament passed the competition law in 1994, which also established the Competition Authority. The CU entailed the harmonisation of Turkish sectoral and regional incentives with those of the EU. Finally, the CU required Turkey to be more proactive in the protection of intellectual and industrial property rights.
Following the implementation of the CU, Turkish tariff rates on imports from the EU declined from 10.2 percent in 1994 to 1.34 percent in 2001. Tariff rates on imports from FTA partners of the EU declined even more dramatically, from 22 percent to 1.34 percent (Togan, 2000). As a result of these cuts, the tariff rates applied by Turkey on industrial imports from members of the World Trade Organisation were the lowest among countries at the same level of development as Turkey. Interestingly, Turkey’s weighted and simple average tariff rates on industrial imports are substantially lower compared to tariffs in countries that joined the EU after the CU (Kaminsky and Ng, 2006).

Political economy of industrial policy in Turkey: The case of the automotive industry
14
With its March 1995 decision to sign the CU with the EU, the Turkish government forced domestic industry to confront further competition from European imports in the second half of the 1990s. Before the CU came into effect, there was some visible and less visible opposition in Turkey to its implementation. Visible opposition came from the labour unions, which claimed that as a result of increased competition from imports, the CU would lead to job losses in many sectors. However, as the labour laws that were enacted after the 1980 coup weakened the political power of the labour unions, opposition from the unions did not really have a significant impact on the negotiations. As one of the more sensitive sectors, the automotive industry lobbied forcefully against the CU prior to 1995. Once they realised that there was no way they could block the agreement, they argued that the industry should be provided breathing space before the CU agreement was implemented in the sector. As a result, the Turkish government listed the industry as a sensitive sector, which enabled it to provide the industry a five-year transition period, during which tariffs of imports from third countries would be significantly higher than EU average customs tariffs on cars imported from third countries (which were fixed at 10 percent). While Turkish tariffs on car imports from third countries were between 26.8 and 33 percent in 1996, 10 percent of the applied tariffs were lowered to the level of European Common Customs Tariffs in 1997, bringing down the range of tariffs to 25.1-30.7 percent in 1997. All automotive product import tariffs were subject to a gradual decline, such that the 10 percent of the tariff lines reduced to the EU average in 1997 were followed by another 10 percent in 1998, and 15 percent in 1999 and in 2000. Finally, the remaining 50 percent of the tariffs were reduced to the EU common external tariff in 2001 (Alpay, 1997 s. 9) In addition, and perhaps more importantly, the Turkish government also secured the approval of the EU side to block imports of used cars from the EU for 10 years. At the time, industry representatives feared that Turkey would have become a haven for second-hand car imports from the EU. This decision was critical in avoiding a major threat to the sustainability of the industry immediately after the CU. Finally, the sharp depreciation of the Turkish lira (TL) during the 1994 economic crisis was quite instrumental in keeping the increase in imports under control as the CU went into effect in 1996. As of the end of 1995, the real exchange rate was 18 percent below its level as of the end of 1993. As a result, even though it would appear that the tariff cuts on products from the EU could lead to an increased demand for imports, an undervalued TL curtailed this increase. The fact that tariff cuts had started gradually as early as 1989 allowed the auto industry time and space to prepare itself for competition from imports. From 1989 onwards, the industry started introducing slightly better quality models compared to what it had been producing in the 1980s. Yet, these models were not as good as the European car models and hence could not be exported to Europe. Nevertheless,

Political economy of industrial policy in Turkey: The case of the automotive industry
15
domestic manufacturers introduced these models in order to compete with more-expensive and higher-quality imports. Once the CU came into effect, however, the expected reduction in tariffs was drastic. As a result, the Turkish auto industry could not rely on the models it had introduced in the first half of 1990s to compete with high quality cars imported with very low external tariffs. A new round of investments was to take place in the industry. As can be seen in Figure 4, total investments in the industry almost doubled in four years from 1996 to 2000. A similar picture emerges when we look at the data collected by the Automotive Manufacturers’ Association (OSD) from its members. Total investment of motor vehicle manufacturers went up from $220 million in 1996 to $650 million in 2001. The share of the investment that went into new model development increased significantly, from 20 percent in 1996 to more than 50 percent in 2001. The industry’s total investments (in US$) declined once the main manufacturers had developed new models in the late 1990s and early 2000s and started exporting them following the collapse of the Turkish economy and the TL during the 2001 economic crisis. However, even then the share of new model development in total investment expenditures continued to stay above 50 percent. Figure 7: Investment in the automotive industry
Source: Automotive Manufacturers’ Association (OSD).
As a result of ‘forced’ investments, the Turkish auto industry has successfully integrated into the global automotive industry supply chain. At the moment, it is the number one export industry in Turkey. Furthermore, thanks to its half-century long production experience, the sector has been well placed with successful ventures in both the automobiles/commercial vehicles and the auto-parts segments.
0
200
400
600
800
1000
1200
1400
1600
0
10
20
30
40
50
60
70
80
1992 1995 1998 2001 2004 2007 2010 2013
mil.
US
D
perc
ent
Share of new model development (%, left axis) Total Investment (right axis)

Political economy of industrial policy in Turkey: The case of the automotive industry
16
As emphasised by Kaminski and Ng (2006), the CU changed the Turkish trade policy framework completely, by bringing in predictability, transparency and stability as well as liberalising market access for both preferential and MFN suppliers. As a result of the CU, contestability in Turkish markets for industrial and agricultural goods increased substantially. This increased contestability and competition, in turn, forced domestic producers to be better prepared to undertake productivity-enhancing investment. As the tariff rates on imports were brought down substantially, imports from the EU and total imports were expected to increase and this was actually what happened in the first couple of years. Imports increased from $35.7 billion in 1995 to $54.5 billion in 2000. Over the same period, imports from the EU increased from $23.7 billion to $28.5 billion. The increase in total imports translated into an increase in the import penetration rate from 22.2 percent in 1995 to 27.8 percent in 1996 and to almost 29.6 percent in 2000. The increase in the overall import penetration rate within five years was mostly a result of the CU itself. The EU had been Turkey’s most important trade partner before 1996 and it stayed so for some time afterwards. However, its share in Turkish imports has declined over time and especially after China became a WTO member in 2001 and entered as a major player into world export markets. To be more specific, the share of imports from the EU has declined from 56 percent in 1996 to 52 percent in 2000 and further to 36.9 percent in 2008. After hitting a minimum value of 36.7 percent in 2013 and 2014, the EU’s share in Turkish imports slightly increased to 38 percent in 2015. Turkish imports from China and the other East Asian countries increased rapidly in the 2000s. From 2.2 percent in 2001, the Chinese share in Turkish imports had risen to 9.2 percent by 2010 and 12 percent in 2015. The CU agreement with the EU did not have a significant impact on Turkish exports in the first five years. The compounded annual growth rate of exports between 1996 and 2001 was 6.2 percent, compared to a 14.3 percent growth rate between 1980 and 1995. One of the reasons was that the EU had already removed tariffs on Turkish goods before the CU. In addition, despite the CU, the EU continued to reserve the right to impose antidumping duties on Turkish exports to the EU, as well as keeping technical (regulation) barriers (Togan et al., 2005). Coupled with the appreciation of the TL, it is therefore not surprising that Turkish exports to the EU did not experience a serious surge immediately. The positive impact of the CU on Turkish exports was realised after a long delay, and only after the 2001 crisis. The depreciation of the TL, and the contraction in domestic demand that followed the economic crisis of February 2001, forced domestic producers to search for export markets. Export revenues increased 12.6 percent in 2001. Exports grew faster in 2002 and 2003, even after domestic demand resumed its growth. Better-than-expected export performance in 2002 and 2003 was achieved,

Political economy of industrial policy in Turkey: The case of the automotive industry
17
despite a 25 percent real appreciation of the Turkish lira during this period, in part thanks to the appreciation of the euro against the dollar. The CU helped further open up the Turkish economy to international competition, and trade figures show the changes in the structure of Turkey’s foreign trade after the CU. The track record of the Turkish manufacturing industry in response to the CU has been better than initially expected, especially when one considers that Turkey received very little financial support from the EU to help ease the adjustment burden; in fact, from 1996 to 2000, Turkish industry proved that it had the capacity to cope with competitive pressure from imports. Since 2001, it has become apparent that the transformation of Turkish industry following the CU helped it prepare it for even more formidable competitors, such as China and other East Asian countries. Increased competition from imports led to important changes in the behaviour of domestic producers of manufactured goods. Before the CU, some sectors, such as the automotive, durable home appliances, electrical machinery and basic metals, had continued to receive protection behind high tariff barriers, despite the import liberalisation process that had started a decade previously. However, productivity growth in these and other import-competing sectors was higher compared to export-oriented and non-traded goods sectors (see Özler and Yılmaz, 2009). Taymaz and Yılmaz (2007) have also shown that the total factor productivity in manufacturing industry as a whole did not increase much between 1996 and 2000, but increased substantially in those sectors that experienced significant increases in import penetration rates after the CU. This effect was statistically significant, even after other variables, such as the real exchange rate, the export-output ratio, as well as time variables (time trend or time dummies), were included as explanatory variables for the plant-level total factor productivity. The increase in production and exports of the automotive industry went hand in hand with solid improvements in productivity. From 1989 to 1994, total factor productivity growth in the automotive industry was 7.7 percent per annum (Figure 8). Following the 16.5 percent drop during the 1994 crisis, total factor productivity recovered in the period from 1994 to 1997, to a growth rate of 8 percent per annum. However, the slowdown in the economy, due to the Russian crisis in 1998, the devastating Marmara earthquake in 1999 and the 2001 crisis, led to a serious decline in total factor productivity. Almost all improvements in the industry’s total factor productivity reversed by the end of 2001. From the 2001 crisis to 2004, the industry’s labour productivity grew by 16.5 percent per annum (Figure 8). While the automotive industry was successful in riding the CU tide, differences in characteristics among its subsectors have led to a divergence in their performances since 2005. The motor vehicles industry has been dominated by multinational corporations, and has seized the opportunities opened up by the CU by investing in new product and process technology and learning. The auto parts and components

Political economy of industrial policy in Turkey: The case of the automotive industry
18
Figure 8. Automotive industry – total factor productivity (1989-2000; 2001-15) 3
Source: Authors’ calculations using ASMI data and labour productivity index.
sector, on the other hand, has been dominated by smaller domestic firms, and the majority of these smaller firms have not been integrated with the global value chains. Focusing on trends in the manufacturing industry as a whole, the CU drove the transformation of Turkish industry towards higher productivity more rapidly than it would have otherwise experienced. Most of the productivity gains due to increased competition from the EU were not realised until the early 2000s. Since 2003, the EU’s share in Turkish imports has been decreasing steadily, while the share of East Asian countries, and especially China, has been on the rise. Productivity gains that have been accrued since 2003 are in part due to those sectors that faced increased competition from China. Turkish manufacturing industry achieved higher productivity growth through increased reliance on intermediate input imports from East Asian countries, and especially from China (Yükseler and Türkan, 2006). While Turkey has conducted approximately 50 percent of its export transactions with the euro, the euro’s share in import transactions is less than 35 percent. The appreciation of the euro against the dollar after 2002 enabled Turkish exporters to rely more and more on imported inputs from China and other Asian economies in their quest to keep their production costs under control.
4. Structure of the automotive industry since the late 1990s
So far, we have analysed how the CU affected the automotive industry’s exports and imports, and the industry’s response as revealed in the total factor productivity. In
3 Total factor productivity for the 1989-2001 period was calculated using Olley-Pakes. TFPG series were imputed for 2001-15 by using the index for labour productivity.

Political economy of industrial policy in Turkey: The case of the automotive industry
19
Table 1: Descriptive statistics on the automotive industry in Turkey (1995-2000, 2006-09, 2010-13 averages)
Number of employees(end year)
Employmentshare
(percent)
Value- added share (percent)
Relative labour productivity
Relativewages
1995-2000
Motor vehicles 28,060 2.20 4.11 1.86 1.83
Bodies and trailers 2,762 0.28 0.17 0.59 0.81
Parts and components 18,042 1.65 1.30 0.78 1.11
Automotive Industry 64,313 5.42 7.69 1.42 1.59
2006-09
Motor vehicles 40,229 1.55 6.25 3.11 2.39
Bodies and trailers 10,501 0.40 0.31 0.59 0.68
Parts and components 75,218 2.84 4.38 1.24 1.19
Automotive Industry 125,948 4.79 10.97 1.77 1.46
2010-13
Motor vehicles 43,516 1.31 5.86 3.20 2.42
Bodies and trailers 15,721 0.44 0.46 0.72 0.77
Parts and components 112,358 3.02 5.07 1.20 1.21
Automotive Industry 171,595 4.77 11.64 1.70 1.51
Source: Calculated from UNIDO, Industrial Statistics Database, 2012 for 1995-2000 and TurkStat for 2006-13.
this section, we will take a closer look at how the structure of the automotive industry has evolved since the late 1990s. In the late 1990s, the automotive industry accounted for 7.7 percent of manufacturing value added and 5.4 percent of manufacturing employment (see Table 1). While the industry’s value-added share increased to 11 and 11.6 percent, respectively, in the late 2000s and the early 2010s, its employment share declined to 4.8 percent. Motor vehicles had the highest share in employment and value added in the late 1990s. Motor vehicles’ leading position in employment was taken over by automotive parts
Political economy of industrial policy in Turkey: The case of the automotive industry
20
and components in the late 2000s and early 2010s. In value added, however, auto parts and components’ share increased to close the gap with motor vehicles.
While the automotive industry employed about 64,000 people in 2000, it had almost doubled employment by 2009, followed by another 35 percent increase by 2013. There was a 60 percent increase in the number of production workers in five years (UNIDO).4 When small and informal firms and suppliers in other sectors are taken into account, the automotive industry is undoubtedly one of Turkey’s leading sectors (in terms of employment generation and creation of value added).
4.1. Productivity and wages
Until 2006, the pattern of productivity growth in the automotive industry was very similar to the pattern of output growth. The automotive industry did not increase its labour productivity by a large extent from the early 1990s until the early 2000s, a period dominated by boom and bust cycles. The negative and detrimental effects of domestic and external crises on labour productivity in the automotive industry can be seen in 1994, 1999, 2001 and 2009. Labour productivity recovered rapidly after the 2001 crisis and more than doubled from 2001 to 2006. It fell again during the 2009 recession and recovered quickly in 2010 (Figure 9).
Labour productivity in the automotive industry tracked the average for the manufacturing industry throughout the period. This could be a result of two phenomena. First, the auto industry accounts for a significant share of manufacturing industry output. Second, production processes in the auto industry are classified as requiring medium-level technology. That is why labour productivity in the industry tracks manufacturing productivity from below.
To sum up, the automotive industry’s productivity growth performance is almost equal to the manufacturing average. However, the level of productivity is also important in assessing industrial performance. The data on labour productivity reveal that there are substantial productivity differentials between motor vehicle manufacturers and other manufacturing industries in the 2000s. While, in late 1990s, the motor vehicles industry was 86 per-cent more productive than the manufacturing industry average, its productivity lead increased further to reach 220 percent by the early 2010s (Table 1). The auto parts and components manufacturers industry, which used to be less productive (78 percent of the manufacturing average) in the late 1990s, improved its productivity significantly in the 2000s. In the late 2000s and early 2010s, labour productivity in the auto parts and components sector was around 20 percent higher than labour
4 The Annual Survey of Manufacturing Industries (ASMI) conducted by TurkStat provides basic data for employment, output and value added at the sectoral level. Unfortunately, the latest year for which the data are available is 2001. For the post-2001 period, the short-term statistics (STS) collected quarterly by TurkStat are used to estimate employment and output growth rates. The STS covers only large establishments producing about 90 percent of sectoral value added.

Political economy of industrial policy in Turkey: The case of the automotive industry
21
productivity in manufacturing as a whole. Despite some improvements, labour productivity in automotive bodies and trailers continued to be below the manufacturing average.
Figure 9: Industrial labour productivity index (1980-2010, 1997=100)
Source: TurkStat.
Being more productive relative to other manufacturing industries, automotive firms can afford to pay higher wages. In the second half of the 1990s, wages in the automotive industry were, on average, 59 percent higher than those in the manufacturing industry. The motor vehicles industry paid an even higher premium (83 percent) to its employees, while bodies and trailers producers paid 19 percent less than the average manufacturing wage. Over time, the wage premium paid by the motor vehicles industry increased to reach 140 percent by the early 2010s. Even though the wage premium paid by the parts and components industry also accorded a slight increase to 21 percent over the average manufacturing wage, wages in the bodies and trailers industry continued to stay below the manufacturing industry average.
While the automotive industry in general, and the motor vehicles industry in particular, took a great step forward from the late 1990s to the late 2000s, its relative productivity and wage growth slowed down from the late 2000s to the early 2010s. As we will discuss later, the industry has been facing difficulties in continuing its rapid growth. We think that 2016’s industry-wide labour disputes could be a reflection of the productivity and wage growth slowdown that we have observed through 2010-13.

Political economy of industrial policy in Turkey: The case of the automotive industry
22
Table 2: Relative productivity and wages, selected countries (1998-2002 and 2005-08 average values)
Relative labour productivity
Relative Wage rate
Relative Unit labour cost
1998 2002
2005 2008
1998 2002
2005 2008
1998 2002
2005 2008
3410 Motor vehicles
Turkey 0.28 0.26 0.24 0.39 0.92 1.49
Hungary 0.33 0.52 0.16 0.35 0.48 0.68
Spain 0.27 0.35 0.50 0.70 1.89 2.01
Brazil 0.24 0.38 0.32 0.36 1.36 0.94
India 0.06 0.14 0.07 0.10 1.23 0.76
Indonesia 0.39 0.67 0.06 0.07 0.28 0.11
Korea, Rep. of 0.64 0.92 0.45 0.92 0.77 1.00
Malaysia 0.22 0.12 0.14 0.12 0.63 1.10
Germany 0.31 0.44 0.87 1.23 2.88 2.83
Italy 0.16 0.30 0.43 0.60 2.96 2.09
Japan 1.24 1.36 1.18 1.06 0.96 0.80
3430 Automotive parts and components
Turkey 0.24 0.22 0.17 0.24 0.73 1.06
Czech Rep. 0.14 0.25 0.12 0.21 0.87 0.86
Hungary 0.15 0.31 0.12 0.27 0.79 0.90
Slovak Rep. 0.06 0.16 0.06 0.19 1.01 1.23
Spain 0.42 0.53 0.49 0.77 1.19 1.46
Brazil 0.24 0.29 0.19 0.23 0.80 0.79
India 0.05 0.07 0.04 0.05 0.76 0.76
Indonesia 0.11 0.15 0.04 0.05 0.41 0.38
Korea, Rep. of 0.45 0.76 0.32 0.57 0.71 0.75
Malaysia 0.15 0.11 0.11 0.12 0.73 1.12
Germany 0.53 0.71 0.85 1.24 1.60 1.74
Italy 0.45 0.55 0.49 0.75 1.10 1.38
Japan 0.84 0.93 0.88 0.86 1.05 0.94 Note: Relative to the corresponding value in the US automotive industry. For the following countries, due to missing data, averages are calculated over shorter period: Brazil, 2005-07; Czech Rep., 1998-99, 2001-02; Indonesia, 2006-08; Japan, 2005-07; Malaysia, 2000-02; Turkey, 1998-2001. Source: Calculated from UNIDO, Industrial Statistics Database, 2007 and 2012.

Political economy of industrial policy in Turkey: The case of the automotive industry
23
A comparative analysis is necessary in order to shed light on the determinants of modes of integration with the global economy. Table 2 presents the data on relative labour productivity, relative wages and unit labour cost in Turkey and a group of developing and industrial countries. ‘Labour productivity’ is measured as value added per employee (measured at current prices and exchange rates) relative to the level in the US. Relative wages are calculated in the same way. ‘Unit labour cost’ is simply the ratio between wage bill and value added (divided by the US ratio), which shows the wage cost of producing one unit of value added. In order to reduce the effects of annual changes, the average values for the last four years for which the data are available for most of the countries in the sample are calculated. In order to compare the time series behaviour of relative productivity and wages, we also present the average values for the 1998-2002 period. Motor vehicles (ISIC 3410) and automotive parts and components (ISIC 3430) manufacturers in Turkey were comparably less productive in the late 1990s and early 2000s. Their productivity was about 24-28 percent of the US level. However, European producers were also poorly productive, both in motor vehicles and auto parts and components industries. It is striking to see that, despite increased productivity in Turkey from the late 1990s to the second half of the 2000s, neither motor vehicles nor auto parts and components industries were able to close the gap with the US. Wages, on the other hand, told a different story. Wages increased in both sectors, but more so in the motor vehicles sector. Actually, wages increased almost invariably in all countries considered during the period from the late 1990s to the mid-2000s. Analysing the relative behaviour of relative productivity and wages together, we observe that from late 1990s to the second half of 2000s, unit labour costs in the Turkish automotive industry increased by around 50 percent in both sectors. The productivity differential between Turkish producers, on the one hand, and German and Italian producers, on the other hand, was not substantial. Wages in the Turkish automotive industry seem to be higher than those in Hungary, the Slovak Republic and the Czech Republic, and much lower than those in Italy, Spain and Germany. As a result, the unit labour cost is lower in Turkey than in European countries (with the exception of Hungary in our sample). Turkey has a cost disadvantage against most less developed and rapidly industrialising countries (India, Indonesia, Korea and Malaysia). Changes in the direction of foreign trade in motor vehicles provide useful evidence on the mode of integration into the global economy (see Table 3).5 The direction of foreign trade in the case of automobiles is very interesting. Turkey imports a large part of its automobile components and automobiles (final products) from developed, mainly EU, countries (99 percent in 1995 and 92 percent in 2008). A large proportion of Turkey’s exports of automobile bodies, parts and components goes to developed countries (88 percent in 1995, and 85 percent in 2005 and 2008). Moreover, developed countries have increased their
5 Kaminski and Ng (2006) define automotive network as a ‘producer-driven’ network.

Political economy of industrial policy in Turkey: The case of the automotive industry
24
share in Turkey’s exports of motor vehicles, from 71 percent in 1995 to 84 percent in 2005 and 93 percent in 2008. In other words, intra-industry trade has become more important between Turkey and the EU in automobiles and automobile components.6 Turkey both imports and exports these products at an increasing level to/from the EU, i.e. the Turkish automotive industry has fully integrated with European production chains.
Table 3: Direction of foreign trade in automobiles, 1990 and 2005 (US$ million)
Imports Exports
Dev’ing % Dev’ed % Dev’ing % Dev’ed %
1995
Bodies, parts and comp. 4 1 881 99 43 12 315 88
Motor vehicles 8 1 889 99 128 29 310 71
2000
Bodies, parts and comp. 41 2 1,709 98 103 15 565 85
Motor vehicles 80 2 4,097 98 143 16 741 84
2008
Bodies, parts and comp. 453 8 5,521 92 658 15 3,762 85
Motor vehicles 608 6 8,886 94 982 7 13,749 93
Source: UNIDO, Industrial Demand-Supply Balance Database, 2012. Notes: 1) Dev’ing and Dev’ed denote ‘developing’ and ‘developed’ countries, respectively. 2) ICT components: ISIC 3210; ICT products: ISIC 3000, 3220, and 3230; automobile components: ISIC 3420 and 3430; automobiles: ISIC 3410.
Apparently, Turkey has been increasing its automobile exports to the EU thanks to its low unit labour costs relative to European producers, and its geographical proximity to main markets (and suppliers) that provides cost and delivery advantages over distant low-cost producers. The average unit price of exported and imported passenger cars could be used as a measure of product ‘quality’. The average (fob7) unit price of passenger car exports was about 10–20 percent lower than the average (cif8) unit price of imports in 1999 and 2000. The economic crisis 2001 and the devaluation of the TL in the same year led to a decline in export prices and an increase in import prices (denominated in US dollars). The average unit price of exports tended to increase gradually, from US$7,600 in 2002 to US$12,800 in 2005, whereas the average unit price of imports remained almost the same (US$13,200 in 2002 and 2005; see State Planning Organisation, 2005: 24-27). Thus, the difference
6 Since most automotive manufacturers in Turkey are partially or fully owned by multinational companies operating various manufacturing plants in European countries, a large part of intra-industry trade is indeed intra-firm trade. For example, Ford Otomotiv imported 6.8 billion liras worth of motor vehicles and parts and components (40 percent of sales revenue) from its parent company in 2015 (the Independent Audit Report for Year 2015 submitted to the Istanbul Stock Exchange). 7 Free on board. 8 Cost insurance and freight.

Political economy of industrial policy in Turkey: The case of the automotive industry
25
between the export and import prices declined to 3-5 percent. Considering the cost of insurance and freight, we may conclude that there is no substantial quality difference, on average, between imported and exported passenger cars in Turkey.9 The improvement in the quality of products necessitates a substantial investment in process renewal and new model development. As we have already shown above in Figure 7, the increase in the industry’s overall investment and its investments in new model development in 2000s, helped it introduce models that satisfy the demand for higher quality and greater diversity.
4.2. Firm-level performance
The automotive industry has undergone a process of transformation in the last decade, and the outcome of this process has been observed in recent years. Since official sectoral-level data for recent years are not available, firm-level data could provide additional information about this transformation process. Before analysing the firm-level performance from publicly available information on balance sheets, it will be helpful to give some information on foreign direct investments in the industry. In the early 1990s, subsidiaries of four multinational corporations (Fiat, Ford, Mercedes Benz and Renault) were operating in the Turkish automotive industry, with a sizeable market share and more than 20 years of experience.10 In the mid-1990s, with the increasing prospects of a CU agreement with the EU, Japanese and Korean companies (Honda, Hyundai and Toyota) started investing in Turkey in joint ventures with Turkish industrialists or, as in the case of Isuzu, expanding existing joint ventures.11 Perhaps because of the uncertain business environment in Turkey, these companies did not make substantial investments initially and built plants with small production capacities (in the vicinity of 10-20,000 units per year). Once the CU with the EU came into effect in 1996, the domestic market gradually opened up to competition from the EU. Actually, in the first couple of years of the CU, the sector struggled with wild fluctuations in domestic demand, as well as competition from imports. Contagion from the Russian crisis of 1998 and the Marmara earthquake of 1999 effectively hit demand in the auto market. However, there was a lot at stake. There was already substantial production capacity, coupled with a competitive parts and accessories industry. In addition,
9 The average unit price is determined to a large extent by the composition of imports/exports. We implicitly assume that there is not much change in the composition of imports/exports during the period under investigation. 10 Obviously, there were other producers active in the domestic market. The listed four had the largest market shares in the automotive industry. 11 Of these four MNCs, Toyota and Honda decided to become the sole owners of their production units (and Hyundai increased its shares to 70 percent) once they had decided to target their production towards the European market, rather than the domestic market. This fact can be taken as an example of the difficulty that foreign investors face when entering the domestic market without an insider on board.

Political economy of industrial policy in Turkey: The case of the automotive industry
26
domestic business establishments, with years of experience in the automotive industry and cheap but good-quality labour, induced MNCs in the automotive sector to increase their investments in Turkey and built new capacity to produce motor vehicles for the European market. None of the multinational corporations with a sizeable presence decided to close down their plants in Turkey.12 The auto parts and components industry also was successful in attracting foreign investors. Most of the world leaders of the sector have joint ventures with Turkish partners. Some of them are big suppliers, such as Robert Bosch, Valeo, Delphi Packard and Mannesmann Sachs. Coming back to the structure of the industry today, the Automotive Manufacturers’ Association (OSD) is the main umbrella organisation for automobile producers in Turkey. All major producers are members of the organisation. Six passenger car producers have foreign participation, four of which are majority foreign-owned.13 There are eight other companies (two of them foreign-owned) that produce trucks, pickups, buses, minibuses and road and farm tractors. Thus, the automotive industry has been dominated by subsidiaries of MNCs. There is a large number of suppliers, located mainly in the Marmara region. The Association of Automotive Parts and Components Manufacturers (TAYSAD) has 342 members.14 Almost a quarter of TAYSAD members are under foreign ownership. A number of automotive manufacturers are listed on the Istanbul Stock Exchange (see Table 4). The financial statements of these companies are audited by independent auditors and are publicly available. Thus, the financial data on listed companies could be used to shed light on recent changes in these sectors. The majority of the companies, especially the motor vehicles manufacturers, listed in Table 4, have increased their employment levels and export rate while lowering dependence on imports for inputs over the last ten years. The export data at the firm level reveal that automotive manufacturers reacted swiftly to the 2001 crisis and the devaluation of the TL, and increased export rates substantially in 2001 and 2002 (see Figure 10). The TL appreciated rather rapidly after the crisis until 2006, so much so that it was (in real terms) 25 percent overvalued in 2005 compared to 2000. In spite of the appreciation of the TL, automotive manufacturers were successful in keeping their export rates at a higher level than the pre-crisis level. Apparently, their export intensity reached and remained at a higher plateau after the crisis. While the average export intensity of motor vehicle manufacturers moved close to 40 percent, average export intensity for
12 Only Opel closed down its small plant near Izmir that was used to undertake the assembly of some of its car models. 13 Home countries: EU (2), Japan (2), United States (1) and Korea (1). 14 The member companies of OSD and TAYSAD employed 43,683 and 140,000 people, respectively, in 2014 (see the organisations’ websites: http://www.osd.org.tr and http://www.taysad.org.tr).

Political economy of industrial policy in Turkey: The case of the automotive industry
27
Table 4: Turkish automotive industry producers listed on the Istanbul stock exchange
No of employees Export rate (%) Import rate (%)
2005 2015 2005 2015 2005 2015
Motor vehicles
Anadolu Isuzu (F) 741 944 15.0 8.0 34.0 45.4
Ford Otosan (F) 7,722 10,745 42.7 64.0 63.0 45.4
Karsan (D) 957 1,748 3.5 27.2 61.8 34.5
Otokar (D) 988 2,105 37.0 29.3 43.0 33.3
Tofaş (F) 4,379 8,018 48.7 57.7 46.1 45.1
Parts and components
Bosch Fren S. (F) 246 121 81.2 16.4 57.0 36.6
Ditaş Doğan (D) 576 384 41.0 45.8 24.0 19.6
Ege Endüstri (D) 474 567 59.0 83.6 25.0 18.6
F-M İzmit Piston (D) 24 64 22.3 75.7 4.1 25.5
Mutlu Akü (2014, F) 561 807 36.0 31.0 55.0 --
Parsan (D) 565 1182 66.0 71.0 33.0 -- Source: Istanbul stock exchange. Notes: 2015 data for the number of employees, export rate and import rate. Export rate is the share of exports in sales revenue. Import rate is the proportion of imported inputs to sales revenue. Foreign/domestic ownership is indicated by F/D in parenthesis next to the name of the company.
parts and components manufacturers has stayed above 40 percent since 2006 and has started to increase to close to 60 percent over the last two years. Automotive manufacturers experienced, on average, declining profitability15 in the second half of the 1990s, which hit the bottom during the 2001 crisis. They gradually recovered after the crisis and the profit margin increased to positive levels in 2002 and 2003. However, the profit margin has remained low (slightly above 5 percent, weighted average) since the second half of the 2000s (see Figure 11). While Karsan and Isuzu’s net profit margins fluctuate substantially, those of major car producers Ford and Tofas have been quite steady, moving up to 7-8 percent. While motor vehicle manufacturers’ weighted average profit margin has stayed flat for a long time, that of parts and components manufacturers recently increased significantly to surpass the 20 percent mark.
15 Profit margin is measured as net profits after taxes/net sales ratio.

Political economy of industrial policy in Turkey: The case of the automotive industry
28
The profitability data show that motor vehicles manufacturers especially operate on thin margins (an average of slightly above 6 percent), and their sales revenues are only slightly more than their expenses. In other words, price competition seems to be very important, especially for consumer electronics producers. Figure 10: Export-output ratio of automotive companies, 1998-2015
Source: Istanbul stock exchange.
Figure 11: Net profit margin of automotive companies, 1993-2015 (net profit after taxes/net sales, weighted average)
Source: Istanbul stock exchange.
5. Integration and upgrading in global value chains
Our analysis indicates that the Turkish automotive industry has integrated with global, especially European, value chains since the mid-1990s as a result of the CU with the EU. In order to understand the process of integration with global value chains (GVCs), and gradual upgrading achieved within these systems, we need a detailed product-level analysis of the structure of Turkey's international trade.
-0.1
0.0
0.1
0.2
0.3
0.4
0.5
0.6
1998 2000 2002 2004 2006 2008 2010 2012 2014
Exp
ort r
ate
Motor Vehicle Manufacturers Parts & Components Manufacturers
‐0.10
‐0.05
0.00
0.05
0.10
0.15
0.20
0.25
1993 1995 1997 1999 2001 2003 2005 2007 2009 2011 2013 2015
Net Profit Margin (%)
Motor Vehicle Manufacturers Parts & Components Manufacturers

Political economy of industrial policy in Turkey: The case of the automotive industry
29
The concept of GVC encompasses all activities that are required to bring a product from conception through to the different stages of production. GVCs arise as a result of slicing up the production chain, and relocating activities across countries, and ‘value’ will be accumulated through consecutive stages of production. In the context of the automotive industry, different stages of production can be defined as the production of the final product (motor vehicles), main component (engine) and standard part and components. By using the UN's Classification by Broad Economic Categories (BEC) and the Harmonised Commodity Description and Coding Systems (HS, Version 1996), we classified the automotive products into five categories, and products defined at the HS six-digit level were associated with these categories. The product categories are as follows:
Automobiles (spark ignition and diesel engines)
Trucks, tractors and buses (TTB)
Engines (spark-ignition and diesel)
Mechanical components
Electrical components
Automobiles and trucks, tractors, and buses (TTB) represent the final product, engines the main component, and mechanical and electrical components are standard parts and components. Electrical components (Ecomp) include parts and components such as ignition magnetos, magneto-generators and flywheels, distributors and ignition coils, starter motors and generators and alternators; whereas mechanical components (Mcomp) are a diverse set of products including, for example, pneumatic tyres, bumpers, safety seatbelts, brake system parts, transmissions, drive axles, radiators, seats, etc.
Figure 12: World exports of automotive industry broad product categories, 1994–2015

Political economy of industrial policy in Turkey: The case of the automotive industry
30
Figure 12 presents the data on the value of international trade for these five categories of products.16 There is a rapid increase in the export value of automotive products in the first half of the 2000s, which was hit by the 2008-09 crisis. World trade in automotive products had increased 12 times, from 1998 to 2007 (the compounded annual growth rate was about 32 percent in that period).17 Export value declined sharply (by 32 percent) in 2009, and did not bounce back after the crisis: when deflated by the world GDP deflator, the real value of international trade in 2014 was almost equal to its level in 2007. Figure 13: Turkey’s share in world export (broad product categories)
The Turkish automotive industry achieved an even faster increase in exports in the same period in all product categories, so that Turkey's share in world trade improved considerably (see Figure 13). The most remarkable increase is observed in the case of TTB: Turkey's share in world truck, tractor and bus exports was only 0.5 percent in 2000, but it jumped to almost 4 percent in 2008, and declined to 3 percent after the world economic crisis. At the detailed product level (HS six-digit level), there are three products that account for the export boom: diesel-powered buses, light diesel trucks (diesel-powered trucks weighing < 5 tonnes), and light diesel automobiles (automobiles with a diesel engine of <1500 cc) (see Figure 14).18 Turkey's market share in automobiles and mechanical components also achieved a continuous increase from the mid-1990s until the crisis in 2009: market share in 16 The CEPII's harmonised international trade data were used in this section (http://cepii.fr). 17 The rate of inflation for the world was about 3 percent per year, i.e., the annual real rate of growth was 29 percent. 18 Figures 14 and 15 present the data for HS six-digit level products in which Turkey's share in world exports is higher than 2 percent, and the value of Turkey's exports is higher than $100 million.

Political economy of industrial policy in Turkey: The case of the automotive industry
31
Figure 14: Turkey’s share in world export (by HS six-digit final product categories)
automobiles reached 1.3 percent in 2009, up from 0.1 per cent in the mid-1990s, whereas the share in mechanical components gradually increased from 0.4 percent in the mid-1990s to 1.6 percent in 2014. In contrast to other categories, Turkey's exports of mechanical components preserved its positive trend even after the crisis. In the case of electrical components, Turkey's exports started to increase in the second half of the 2000s, and, as in the case of mechanical components, it continued to increase in the early 2010s. Turkey's share in world trade of engines was very low in the 1990s and early 2000s. It improved considerably after 2005, reaching almost 0.5 percent in 2010, and remained at that level. At the product level, distributors and ignition coils, seats, wheels, parts for diesel engines and bodies for tractors, buses and trucks are the products in which Turkey has actively participated in GVCs in recent years (see Figure 15). The data on Turkey's export share reveal that Turkey's integration with the automotive GVCs has been intensified in all product categories. Upgrading within GVCs is an important issue that attracts the attention of policymakers, because integration without upgrading may not be beneficial for the industry or the country.

Political economy of industrial policy in Turkey: The case of the automotive industry
32
Figure 15: Turkey’s share in world automotive exports (by HS six-digit parts and components categories)
There are four types of upgrading identified in the literature (Gereffi et al., 2001; Gereffi, 2014):
Process upgrading: Firms can increase their productivity by using their resources more efficiently and effectively. For example, process upgrading may involve the replacement of craft production by mass production, and then mass production by lean (or just-in-time) production.
Product upgrading: Firms can increase their productivity by moving into more sophisticated product lines. The ‘sophistication level’ of a product can be measured by unit value, labour productivity or task content.
Functional upgrading: Functional upgrading implies opportunities within the existing value chain (for this reason, it is also called ‘intra-chain upgrading’). For example, firms can increase their productivity by acquiring new functions (or abandoning existing functions) to move towards skilled labour-intensive activities.
Chain upgrading: In this case, the firm moves into new (and related) value chains that are more productive (this is also called ‘inter-chain upgrading’). In this type of upgrading, the firm applies the competence acquired in a particular function of a chain to a new sector.
The outcome of process and product upgrading is the increase in the sector's competitiveness, and the value-added content of its products. Functional upgrading will manifest itself in the changing composition of exported products and countries. The data presented above reveal that Turkey's share in all categories of automotive products has increased since the mid-1990s. The increase in the world export share supports the hypothesis that the Turkish automotive industry achieved process and/or product upgrading, so that it has become more competitive in those products.

Political economy of industrial policy in Turkey: The case of the automotive industry
33
In order to understand the extent of process and product upgrading, we use the data on (relative) unit values as a measure of product quality. Relative unit value is defined as ruv = log((xT/qT)/(xW/qW)), where x refers to the value of export, and q to the quantity of exports. Subscripts T and W denote Turkey and the world, respectively. Since the relative unit value measure is defined in the log form, a positive number means the unit value of Turkey's exports is higher than that of the world (Turkey produces higher quality/high value-added products for that segment), whereas a negative value implies the opposite.
As shown in Figure 16, Turkey's relative unit value is higher only in the case of TTB, mainly thanks to the exports of diesel-powered buses, and light diesel trucks. In all other product categories, relative unit values are negative. There is only one product category in which Turkey seems to achieve product upgrading: mechanical components. The relative unit value of mechanical components produced in Turkey increased almost continuously for almost a decade in the 2000s. However, that trend seems to halt in the early 2010s.
Figure 16: Relative unit values of Turkish automotive exports (by broad product categories)
The case of electrical components is worrisome. The relative unit value was positive in the late 1990s, but one should be careful in interpreting the unit value data for electrical components for the 1990s because of the very low value and incidence of exports. The relative unit value of exports has declined almost continuously since the

Political economy of industrial policy in Turkey: The case of the automotive industry
34
early 2000s. This may indicate that Turkish producers have been specialised in low value-added electrical components without any significant product upgrading. A network analysis could provide additional information on integration and upgrading in the GVC. The network charts for five product categories for three time periods (1995-97, 2004-06, and 2012-14) are summarised in Figures A1-A5. To eliminate the effects of annual fluctuations, average values for three-year periods are used.19 To simplify the network charts, trade flows of less than $150 million for autos and mechanical components, and $50 million for TTB, engines and electrical components are deleted. The charts for the automobile trade show that Turkey was not a significant player in the international market in the mid-1990s (see Figures A1.a, A1.b and A1.c). Turkey imported automobiles from Germany, and its export value to any partner did not exceed $150 million. However, within a decade, its participation in the GVC intensified rapidly. Turkey has become a major importer of automobiles from established European producers (Germany, France, the UK, Belgium, Spain), Poland and Korea, and exported to established European markets (Germany, France, the UK, Belgium, Spain), Italy and Russia. As a result of its deeper integration, the Czech Republic and Romania were added to the list of major auto suppliers, whereas Turkey diversified its exports to Israel. The evolution of Turkey's major export markets and import sources has closely followed the origin of multinational firms invested in the Turkish automotive industry. The network for TTB is sparse compared to the automobile network (see Figures A2.a, A2.b and A2.c). There are fewer countries and links forming the TTB network, even though we use a lower export threshold for this category. Turkey used to import from Germany and export (temporarily) to Russia in the mid-1990s. In the mid-2000s, the Netherlands became a major supplier, whereas France has become the largest export market for Turkish producers. That pattern did not change in the mid-2010s. The network for mechanical components complements the story about the evolution of the auto network (see Figures A3.a, A3.b and A3.c). Turkey used to import mechanical components from Germany, the UK and Italy in the mid-1990s, and did not export these products in large volumes to any country. However, in the mid- 2000s, its imports of mechanical components followed a pattern similar to that of automobile imports: Germany, the UK, Italy, France, Spain, Japan and Korea were the largest suppliers of mechanical components in the mid-2000s, whereas Turkey started to export these products to Germany, the UK, Italy and France, partly as a result of process and product upgrading in the automobile GVC. In the mid-2010s, China has become another supplier of mechanical components for Turkey, whereas Turkey continued to expand its markets, including Belgium, Spain and Russia.
19 In order to eliminate the effects of price increases, nominal values are deflated by the world GDP deflator, which is obtained from the World Bank's World Development Indicators. The base year is 1994. Since the data starts from 1995, 1995-97 is the initial period.

Political economy of industrial policy in Turkey: The case of the automotive industry
35
Turkey was not involved heavily in the electrical components network until the early 2000s (see Figures A4.a, A4.b and A4.c). As mentioned above, Turkey's share in the global market for electrical components increased only after 2005. The main supplier of electrical components for Turkey is Bulgaria, whereas Turkey exports these products mostly to the UK, France, Belgium and Sweden. In spite of positive developments in recent years, engine production and trade is the weakest link in Turkey's integration with the GVCs (see Figures A5.a, A5.b and A5.c). Turkey imported engines from Germany and the UK in the mid-1990s. Its suppliers have diversified in the mid-2000s as a result of investment by multinational companies in the Turkish automobile industry, and Turkey imported engines from Italy, Spain, Poland, Hungary and Japan as well as former suppliers, Germany and the UK. In the mid-2010s, Japan and Hungary ceased to be large suppliers of engines, and France, Romania and India started to export engines to Turkey in large volumes. In this period, Turkey exported engines to multinational companies' plants in Romania. Analysis of the network of international trade provides complementary information about the transformation of the Turkish automotive industry. It shows that Turkey's position in the international division of labour has been largely shaped by investments of multinational firms in the Turkish auto industry. The pattern of exports and imports (in terms of destination/source countries, and the type of products trade) is determined by multinational companies' global production decisions. During this process, the Turkish automotive industry has been successful in upgrading its position within the GVC, especially in the categories of light diesel trucks, and buses, and mechanical components. The network charts visualise the fact that European countries are strongly integrated with each other in all segments of the industry, and Turkey is being integrated with the sub-network. Turkey’s links with European countries have increased and intensified in the last couple of decades. Apart from turopean countries, Turkey only has strong links with Korea, and China is likely to become more important in the future. The evolution of GVCs also reveals the missing opportunities for Turkey. As being strongly integrated with and oriented towards European markets, Turkey appears not to be benefiting from its geographical advantages. For example, as shown in Figures A1a-A1c, the Korean automotive industry was able to significantly increase its exports to a number of countries around Turkey, such as Iraq, Syria, Jordan, Egypt and Libya in the early 2010s. Apparently, those Korean firms that operate in Turkey were not exporting to Turkey’s neighbours, perhaps because multinational automotive firms make their production and export decisions on a global scale.

Political economy of industrial policy in Turkey: The case of the automotive industry
36
6. Recent government policies and automotive industry performance
The automotive industry in Turkey has proved to be a vibrant and growing sector, and achieved outstanding export performance in the last decade in spite of the macroeconomic problems that have plagued the country. What are the main factors behind its performance? The automotive industry is well integrated within international production chains. From its inception in the 1960s and 1970s until the late 1990s, foreign firms, either through joint ventures with major domestic business groups or through wholly owned subsidiaries, have been dominant in the industry. Although these companies were oriented towards the domestic market until the early 1990s, they were able to seize new market opportunities opened by the CU with the EU in 1996. New foreign companies entering the Turkish market in the second half of the 1990s have targeted the EU market as well. These companies have strong links with their subsidiaries in the EU, and intra-firm trade has apparently played an important role in producing automobiles in Turkey and marketing them in EU countries. Although the automotive industry is well integrated within international, or, more specifically, European production chains, it has also benefited to a large extent from the existence of a strong domestic industrial and supplier base. The automobile parts and components sector developed to some extent in the 1970s and 1980s, and attracted foreign investment in the 1990s. Strong and responsive supplier-producer links have enabled automobile producers to expand their capacity and output rapidly after the 2001 crisis (for a comprehensive analysis of supplier-buyer links, see Wasti, Kozan and Kuman, 2006). The automotive industry in Turkey would not be successful had it failed to adapt itself quickly to new conditions imposed by the CU. The OSD played an instrumental role in anticipating new challenges and orchestrating a common course of action to face these challenges. The OSD regarded the CU as an inescapable fact, and considered it as an opportunity in the early 1990s.20 The first challenge was to adopt massive EU rules and regulations affecting the industry. The process of discovering, understanding and transposing EU rules and regulations proved to be useful in enhancing the competence of technical personnel employed by automobile producers (and government officials). After achieving a certain level of technological sophistication necessary to satisfy EU rules, technical personnel pushed forward to improve quality and to introduce new designs (especially in the commercial vehicles segment) to become more competitive in the EU market. ‘Research and development’ became a catchword in the late 1990s. The automotive industry’s two major manufacturers associations (OSD and
20 During the negotiation stage of the CU agreement, the automotive industry was expected to be one of the industries that would face the toughest competition from the EU-origin imports. Thanks to forceful lobbying by the industry, full liberalisation of the automotive imports was phased in over a period of five years.

Political economy of industrial policy in Turkey: The case of the automotive industry
37
TAYSAD) have proven to be important catalysts in the industry’s successful response to the challenges it has faced over the last two decades. Both associations have been working closely with their members, the government, universities and the public at large to enhance the sector’s long-term viability in the face of increased global competition and to increase the contribution of the industry to the Turkish economy. As it has a little more than a dozen members, it was easier for motor vehicle manufacturers, under the umbrella of OSD, to act together in matters that concern the viability of the whole sector. OSD represented the industry’s viewpoint effectively in very different meetings. OSD representatives were in general active participants of meetings and workshops, whether the meetings were directly related to industrial or R&D policymaking or not. When the latest industrial and regional investment subsidies were announced in 2012, the government designed policy so that the automotive industry’s R&D efforts would not receive the same support as other industries. OSD objected to this viewpoint and argued that, through subsidised R&D efforts, they were attracting millions of dollars’ worth of R&D projects to Turkey. In the end, the government agreed with OSD’s viewpoint. According to plans drawn up by industry representatives, the industry set itself the target of making Turkey the third largest producer in Europe by 2013, as well as making it a centre for design and R&D.21 Unfortunately, these plans did not work out.
6.1. R&D policies and the automotive industry
Manufacturing firms have established R&D centres in large numbers in recent years, because the government has made some changes in its R&D incentives framework that would lower the initial cost of establishing R&D centres. For example, in order for firms to be eligible to receive subsidies for their R&D expenditures, they had to employ a minimum of 50 engineers in their R&D centres. With the recent change, the minimum number of engineers employed in these centres was lowered to 30. This change, along with others, helped increase the number of firms establishing R&D centres very quickly. The automotive industry was one of the leading industries in responding to these incentives. The majority of automotive producers established R&D units close to their production plants. While initially their R&D efforts mostly focused on simple development activities over time, as their engineers gained more experience, many automotive firms moved part of their international design activities to Turkey. Finally, these efforts culminated in the development of technology management capability in the Turkish automotive sector. However, the industry still has a lot of room to acquire full technology management capability.
21 Interview with Ercan Tezer, Secretary General of the Automotive Manufacturers’ Association, 4 April 2007.

Political economy of industrial policy in Turkey: The case of the automotive industry
38
As of January 2016, there were 232 R&D centres established by private sector companies. With 52 R&D centres, automotive parts and components manufacturing is the leading sector in terms of R&D centres. Even though all automotive manufacturers have established R&D centres, as there are only 13 of them, the automotive manufacturing sector came fourth in the list. The Turkish automotive industry also takes the lead in terms of total R&D expenditures. As of the end of 2014, it accounted for 18.9 percent of total R&D expenditures undertaken by the Turkish private sector. With this share, Turkey ranks third after Germany and Japan, where automotive industry shares in private R&D expenditures were 31.7 percent and 19.8 percent. The automotive industry started investing in R&D activities as early as the second half of the 2000s, much earlier than other sectors. Yet, they only recently started undertaking more value-added development and design activities in Turkey. In 2015, R&D spending by the two leading automotive manufacturing companies, Ford Otomotiv and Tofas, reached 1.6 percent and 2.5 percent of revenues, respectively. The two companies reported that in the same year they employed 1,512 and 700 employees, respectively, in their R&D centres.
6.2. Current tax policy is the most critical obstacle for the industry’s next round of structural transformation
While the government’s R&D policy supports the automotive industry’s aspirations to become one of the major R&D centres in the European automotive industry, where new models and engines are developed for every segment of the industry, its tax policies are currently creating the most formidable obstacle to the industry’s next round of structural transformation. Turkish tax policy is awkwardly shaped by the macroeconomic stabilisation attempts immediately after the 2001 crisis. At the time, it was imperative to increase tax revenues in a short period of time. As a result, the most effective and politically feasible way of collecting taxes is to introduce indirect taxes. Turkey increased the VAT rate, as well increasing special consumption tax on some goods and introducing the special consumption tax on many other goods. The special consumption tax on motor vehicles was introduced in August 2002. The tax targeted mostly automobiles. The tax rate was 27 percent on cars with engines less than or equal to 1600 cc power, 46 percent for cars with 1601-2000 cc engines and 50 percent for cars with engines bigger than 2000 cc engines. Until recently the tax rate on light commercial vehicles was kept at a minimum of 10 percent. SCT tax rates for automobiles, however, have been increased four times. Now the rates stand at 45, 90 and 145 percent, respectively. On top of the already high special consumption tax, the government also levies value-added tax, which means that the total indirect tax rate on a car increases significantly. If someone wants to buy a car with a 1600cc or lower power engine,

Political economy of industrial policy in Turkey: The case of the automotive industry
39
and the car’s value is 1 TL, then the person ends up paying 1.71 TLs for the car. If the car has an engine power between 1601cc-2000cc, the buyer will pay 2.3 TL. If the car has a 2001cc or higher power engine, then the buyer will pay 2.89 TL. The special consumption tax and the annual motor vehicle are important sources of revenue for the government. In 2015, approximately 6.5 percent of all tax revenues were obtained through the special consumption tax on motor vehicles and the annual motor vehicle tax (see Figure 17). We do not have information on VAT collections obtained from car sales, but because it is imposed on the already taxed car value, it is likely to be closer to the total value of SCT tax. When we assume that, we come up with a figure of more than 10 percent of all tax revenues obtained from car ownership. This does not include the SCT on oils and lubricants, which account for close to 12.5 percent of all tax revenues in 2015. Figure 17: Tax revenues from special consumption tax on motor vehicles and annual motor vehicle tax (percent)
Source: Ministry of Finance.
High sales/consumption taxes on cars not only lower demand for cars, but also lead to a lower scale of production for the industry. In the long run, this will prove a major obstacle for the growth of the sector. Actually, when we look at the production numbers closely, following the rapid growth performances in the mid-2000s, the industry has not been able to maintain the pace of its growth in the 2010s, even though real interest rates have fallen significantly since the global financial crisis. High SCTs on automobiles, along with low SCTs on commercial vehicles, have so far led the industry to devote a larger fraction of its capacity to LCVs compared to other countries. In 2015, 35 percent of the motor vehicles produced were LCVs. This focus on the lower end of the market may prove to be a major threat for the future of the industry.

Political economy of industrial policy in Turkey: The case of the automotive industry
40
The best way to prove this hypothesis is to look at the distribution of production in Turkey. The bulk of production takes place in LCVs and small cars, both of which are subject to low consumption tax. On the other hand, fewer than 20,000 automobiles with engine capacity above 1600cc are produced in Turkey (Figure 18). As the presence of high consumption taxes on automobiles prevents mass scale production of more sophisticated and higher value-added automobiles with engines above 1600cc, it also prevents multinational firms from bringing higher value-added R&D functions to Turkey. After all, firms introduce their new products mostly at the higher end of the market, because that is where the customers are willing to pay a higher price for a completely new design and/or improvement in efficiency, etc. After they have made use of their best R&D outcomes at the higher end of the market, companies gradually shift these new products, designs etc. into their mid-market and lower-end products. Figure 18. Automobile production by engine size (‘000s)
Source: OSD.
Despite generous government subsidies, no company would be willing to shift its most critical R&D activities to a country where there is little expertise in producing higher quality and higher value-added cars. Furthermore, no company will start producing a car model in a country where the tax rates on the model can be as high as 200 percent combined. When the company produces a new model, it should be able to sell a sizeable share of the model in the domestic market. That is, however, impossible in a country where the tax burden on the higher end of the market is very high. Therefore, with the existing tax system, it would be a serious challenge to move the Turkish automotive industry from its current production level of 1.4 million units to the projected 2 million units.

Political economy of industrial policy in Turkey: The case of the automotive industry
41
Finally, in this section we discuss another critical problem with the current consumption tax system, where SCT rates are based on vehicle engine power. Many European and other industrial countries design their vehicle tax systems so that they can minimise the environmental impact of vehicle ownership. For that reason, in their systems tax rates tend to increase with CO2 emissions. In the current Turkish SCT system, however, companies find ways to avoid taxes. Instead of following the practice in other countries, and mounting 1800cc or 2000c engines, companies prefer to mount 1600c engines in their luxury and/or SUV vehicles. While the avoidance of taxes in this fashion lowers government tax revenues, the existing tax system does not lead to lower CO2 emissions. As indicated by Mock (2016), revising the existing vehicle taxation system to be based on a vehicle’s CO2 emission level could complement and hence increase the effects of CO2 vehicle standards. Once the tax system becomes geared towards the control of CO2 emissions, then the very low tax rates on LCVs will have to be increased along with engine power. Finally, revision of the current tax system should also include revision of mandates and incentives for alternative fuels and electrified vehicles. Such a comprehensive revision of the vehicle tax system will, in return, further enhance technological innovation in the automotive industry. One may suggest that the special consumption tax is a kind of progressive tax, because the tax rate is higher for large-engine cars that are likely to be bought by wealthier people. Moreover, large-engine cars pollute the environment more, and higher tax means a tax for negative environmental externality. However, the main motive seems to be tax collection, because the tax rates are not directly related to either the individual’s income level or the car’s level of pollution. Moreover, the motor vehicle tax (the annual tax paid for each vehicle) reinforces the market-distorting effects of the special consumption tax. Similar in spirit to the special consumption tax, the motor vehicle tax depends on engine size (in the case of new cars, the motor vehicle tax is about 210 dollars for cars with engines smaller than 1300 cc, and as high as around 7,570 dollars for cars with engines larger than 4000 cc). However, the motor vehicle tax declines very quickly by age of the car (more than 50 percent after age seven). Therefore, the motor vehicle tax system reduces demand for new cars by lowering tax rates for used cars.
7. Conclusions: Lessons to learn
The development of the Turkish economy since the early 1990s shows that, despite macroeconomic policies and conditions inhibiting investment and growth, certain industries have performed very well and played an important role in generating employment and fostering growth. The automotive industry has certainly been among the most successful industries in Turkey in the last two decades. It has achieved remarkable output and productivity growth rates, and has been very competitive in international markets.

Political economy of industrial policy in Turkey: The case of the automotive industry
42
The country has a long experience of production in the automotive industry. Domestic industrialists have had significant experience in the automotive industry, either by themselves or in joint ventures with multinational corporations. The automotive industry has a strong domestic supplier base, established during the import-substituting industrialisation era of the 1960s and 1970s, and has seized the opportunities opened up by the CU by investing in new product and process technology and learning. Both the final product and the supplier segments of the industry are well organised, and have established a shared vision of the future, through organised dialogue within the industry and with the public sector as well. Industrial leadership, coordination and cooperation have been vitally important for the success of the automotive industry. The automotive industry has strong backward linkages to low-, medium- and high- tech sectors. These linkages have so far enabled Turkey to become one of the mid-size players in the global automotive market. However, its future ability to survive and thrive will depend on its ability to attract international electronics part suppliers to invest in Turkey. This, however, will require a structural change in the industry towards higher value-added products. According to the 2015 market report by the Automotive Distributors’ Association, 82.9 percent of automobile sales in 2015 were accounted for by lower segments of the market, namely A, B and C segments. The success of the automotive industry has much to do with its deep roots in the industrial heartland of the country, as well as the increased competition it had to face after the CU, rather than macroeconomic policies. Had Turkey adopted the correct mix of macroeconomic and sectoral policies in the 1990s, the majority of other manufacturing sectors would have realised structural transformations similar to those of the automotive industry. As a result, Turkey could have undertaken the transformation from a lower middle-income economy with competitive advantage in labour-intensive sectors, into a higher middle-income country, with increased focus on technology-intensive sectors.
In the early 1990s, there was no reason for the automotive industry to change the way it ran business. However, in the ten years following the formation of the CU, the Turkish auto industry went through a serious transformation period. The seeds of change came about in the early 1990s. Trade liberalisation throughout the late 1980s and early 1990s reduced protection against motor vehicle imports. However, as domestic demand was booming, the industry was performing quite well in terms of profits. Import penetration was rather small, thanks to the still-high protection rates.
During the negotiation stage of the CU agreement, the Turkish auto industry was expected to face tough competition from EU-origin imports. The industry did not hide this fact and forcefully lobbied the government to gain as much time as possible in order to postpone the full impact of the CU. As a result, the auto industry was one of the sensitive sectors that the Turkish side wanted to include in the agreement. Full

Political economy of industrial policy in Turkey: The case of the automotive industry
43
liberalisation of auto imports was phased in over a period of five years. Imports of used cars are still prohibited and likely to continue to be so in the near future.
A natural implication of Turkey’s large domestic market would be the attraction of FDI to benefit from it. However, the automotive sector is a good example of how an initially protected home market can be transformed into a competitive and increasingly export-oriented industry through FDI inflows coupled with the availability of low-cost, qualified labour. During the debate on the CU, the automotive sector was expected to be the worst affected by lowering protection on EU imports. However, that prediction was proven wrong: in the mid-2000s, the automotive sector has become the second-largest export sector. One of the important conclusions of our study is about the effectiveness of industrial policy in the Turkish framework. We emphasise the lack of a well-designed, long-term industrial development perspective in place that led to the current state of the Turkish automotive industry, in particular, and the manufacturing industry, in general. It was not the presence of well developed and implemented industrial policies that was responsible for the successful development of several sectors in recent decades. Rather, the manufacturing subsectors that performed well in recent decades did so thanks to their organisation and their knowledge and experience in international competition. These sectors developed haphazardly, despite the fact that there was no government policy framework in place guiding them in their long-run investment decisions. It is interesting to observe that the policymakers themselves also complain about the lack of a consistent government policy towards the automotive industry. The ad hoc Expert Committee report on automotive manufacturing, written five years after the customs union, emphasises the importance of a ‘master plan’ for the development of the automotive industry in Turkey. The report explains that policy towards the automotive industry is related to industrial and technology policies (taxes, state subsidies, foreign trade, tariffs, etc.), so that it is necessary to design all those policies coherently within the context of a master plan (SPO, 2001: 7). A report prepared by the private sector a year later echoes the same concern, and considers the lack of a ‘national master plan’ to be among the weaknesses of the automotive industry (ICI, 2002: 44). Our analysis on export patterns and GVCs shows that Turkey’s position in the international division of labour has been largely determined by multinational firms, whose subsidiaries are important players in the Turkish automotive industry. The pattern of exports and imports (in terms of destination/source countries, and the type of products traded) is determined by MNCs’ global production decisions. Automobile producers in Turkey, as a group, were able to relocate their position vis-à-vis European value chains by skillfully managing the benefits of geography (proximity to the European markets) and their metalworking capability. However, existing tax policies (especially the special consumption tax scheme) have created

Political economy of industrial policy in Turkey: The case of the automotive industry
44
significant obstacles for firms, which in principle can move their production and R&D activities towards high quality/high value-added segments of the industry.

Political economy of industrial policy in Turkey: The case of the automotive industry
45
References
Alpay, Z. A. (1997). ‘Otomotiv Sanayiimize Devlet Müdahaleleri ve Gümrük Birliği Sonrası Teknik Mevzuat’ [State intervention in automotive industry and technical regulations in the post customs union] Automotive Main and Parts Industry Symposium Proceedings. Bursa: Chamber of Architects and Engineers Publications, pp. 8-11, November.
Gereffi, G. (2014). ‘Global value chains in a post-Washington consensus world’. Review of International Political Economy 21(1): 9-37.
Gereffi, G., Humphrey, J., Kaplinsky, R. and Sturgeon, T. J. (2001). ‘Introduction: Globalisation, value chains and development’. IDS Bulletin 32(3): 1-8.
Istanbul Chamber of Industry (ICI) (2002). Otomotive Sanayii Sektörü (Automotive Industry). Istanbul: Istanbul Chamber of Industry.
Kaminski, B. and Ng, F. (2006). ‘Turkey’s evolving trade integration into pan-European markets’. Policy Research Department, Working Paper 3908. Washington, DC: World Bank.
Milanovic, B. (1986). ‘Export incentives and Turkish manufactured exports: 1980-84’. World Bank Staff Working Paper, No. 602, Washington DC.
Mock, P. (2016). ‘Driving change: A snapshot of the automotive sector in Turkey’. Istanbul Policy Center-Mercator policy brief, March.
Özler, S. and Yılmaz, K. (2009). ‘Productivity response to reduction in trade barriers: Evidence from Turkish manufacturing plants’. Review of World Economics, 37(2): 479-88.
State Planning Organisation (1989). Altıncı Beş Yıllık Kalkınma Planı (1990-1994) [Sixth Five Year Development Plan (1990-1994]. Ankara: State Planning Organisation.
State Planning Organisation (2001). Karayolu Taşıtları İmalat Sanayii Özel İhtisas Komisyonu Raporu [Ad hoc Expert Committee Report on Motor Vehicles Manufacturing]. Ankara: State Planning Organisation.
State Planning Organisation (2005). Dokuzuncu Kalkınma Planı, 2007-2013: Otomotiv Sanayii Özel İhtisas Komisyonu Raporu [Ninth Development Plan, 2007-2013: Automotive Industry Expert Commission Report]. Ankara: State Planning Organization.
Taymaz, E. and K. Yılmaz (2007). ‘Productivity and trade orientation: Turkish manufacturing industry before and after the customs union’, Journal of International Trade and Diplomacy, 1: 127-54.

Political economy of industrial policy in Turkey: The case of the automotive industry
46
Togan, S. (1994). Foreign Trade Regime and Trade Liberalisation in Turkey during the 1980s. Aldershot, UK: Avebury.
Togan, S. (2000). ‘Effects of a Turkey-European Union customs union and prospects for the future’, Russian & East European Finance and Trade 36(4): 5-25.
Togan, S., Nebioğlu, H. and Doğan, S. (2005)., ‘Integration and the manufacturing industry’, in B. Hoekman and S. Togan (eds.), Turkey: Economic Reform and Accession to the European Union. Oxford: Oxford University Press, pp. 87-121.
Turel, O. (2007). ‘Türkiye’de Sanayi Politikalarının Dünü ve Bugünü’ [The past and the current state of Turkish industrial policies] mimeo, Middle East Technical University, Ankara.
Wasti, S. N., Kozan, M. K. and Kuman, A. (2006). ‘Buyer-supplier relationships in the Turkish automotive industry’, International Journal of Operations and Production Management, 26: 947-70.
Yücel, F. (2015). Cumhuriyet Türkiye’sinin Sanayileşme Öyküsü, [Industrialisation story of republican Turkey]. Ankara: Turkish Foundation for Technological Development Publication.
Yükseler Z., and Türkan, E. (2006). ‘Türkiye’nin Üretim ve Dış Ticaret Yapısında Dönüşüm: Küresel Yönelimler ve Yansımalar’ [The transformation of Turkey’s production and foreign trade structure: Global trends and reflections] Koç University-TÜSİAD Economic Research Forum Research Reports, Istanbul.

Political economy of industrial policy in Turkey: The case of the automotive industry
47
Appendix – Network graphs
Figure A1.a: Network for automobiles (1995-97)
Figure A1.b: Network for automobiles (2004-06)

Political economy of industrial policy in Turkey: The case of the automotive industry
48
Figure A1.c: Network for automobiles (2012-14)
Figure A2.a: Network for trucks, tractors and buses (1995-97)

Political economy of industrial policy in Turkey: The case of the automotive industry
49
Figure A2.b: Network for trucks, tractors and buses (2004-06)
Figure A2.c: Network for trucks, tractors and buses (2012-14)
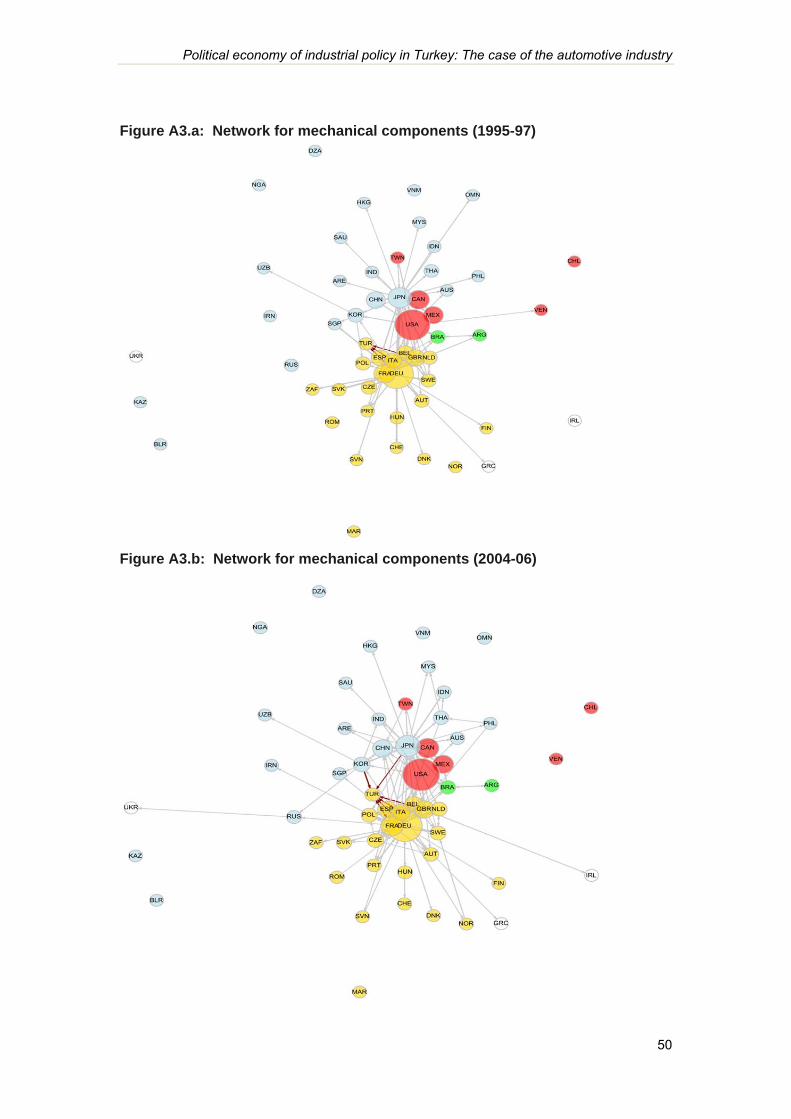
Political economy of industrial policy in Turkey: The case of the automotive industry
50
Figure A3.a: Network for mechanical components (1995-97)
Figure A3.b: Network for mechanical components (2004-06)
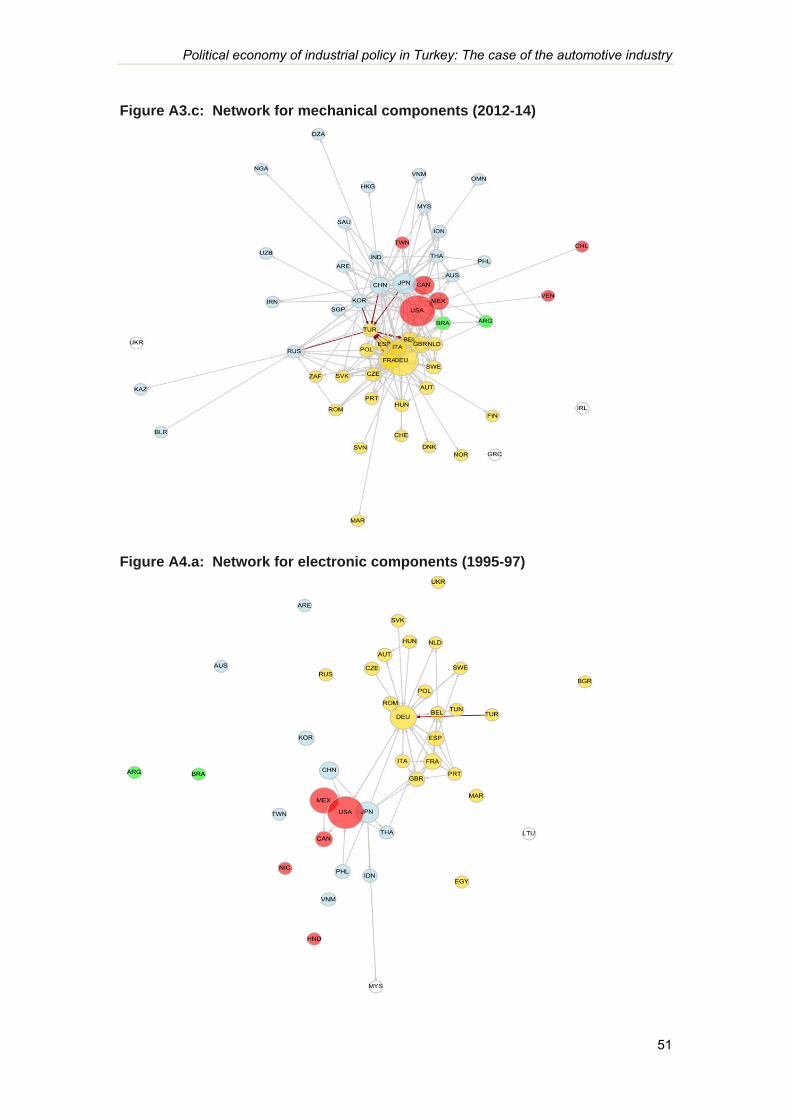
Political economy of industrial policy in Turkey: The case of the automotive industry
51
Figure A3.c: Network for mechanical components (2012-14)
Figure A4.a: Network for electronic components (1995-97)

Political economy of industrial policy in Turkey: The case of the automotive industry
52
Figure A4.b: Network for electronic components (2004-06)
Figure A4.c: Network for electronic components (2012-14)

Political economy of industrial policy in Turkey: The case of the automotive industry
53
Figure A5.a: Network for engines (1995-97)
Figure A5.b: Network for engines (2004-06)

Political economy of industrial policy in Turkey: The case of the automotive industry
54
Figure A5.c: Network for engines (2012-14)

Political economy of industrial policy in Turkey: The case of the automotive industry
55
Abbreviations
ASMI Annual Survey of Manufacturing Establishments BEC Broad economic categories CU Customs union EU European Union FDI Foreign direct investment FTA Free Trade Agreement FYDP Five-Year Development Plan GDP Gross domestic product GVC Global value chain HS Harmonised commodity description and coding systems ISIC International Standard Industry Classification LCV Light commercial vehicle MFN Most favoured nation MNC Multinational corporation OSD Automotive Manufacturers Association (Turkish acronyms) PTA Preferential trade agreement R&D Research and development SCT Special consumption tax STS Short-term statistics TAYSAD Association of Automotive Parts and Components Manufacturers
(Turkish acronyms) TL Turkish lira TTB Trucks, tractors and buses TurkStat Turkish Institute of Statistics UN United Nations UNIDO United Nations Industrial Development Organization WTO World Trade Organization

email: [email protected] Effective States and Inclusive Development Research Centre (ESID) School of Environment, Education and Development, The University of Manchester, Oxford Road,
Manchester M13 9PL, UK www.effective-states.org
The Effective States and Inclusive Development Research Centre The Effective States and Inclusive Development Research Centre (ESID) aims to improve the use of governance research evidence in decision-making. Our key focus is on the role of state effectiveness and elite commitment in achieving inclusive development and social justice.
ESID is a partnership of highly reputed research and policy institutes based in Africa, Asia, Europe and North America. The lead institution is the University of Manchester.
The other institutional partners are:
• BRAC Institute of Governance and Development, BRAC University, Dhaka
• Center for Democratic Development, Accra
• Center for International Development, Harvard University, Boston
• Department of Political and Administrative Studies, University of Malawi, Zomba
• Graduate School of Development, Policy & Practice, Cape Town University
• Institute for Economic Growth, Delhi
In addition to its institutional partners, ESID has established a network of leading research collaborators and policy/uptake experts.