policy paper an analysis of tax forecasting errors in ireland
TRANSCRIPT

Abstract: This paper examines the tax revenue forecasting performance of the Department ofFinance over the period 1997-2014. While the general forecasting framework used reflects standardinternational practice, forecasting errors are relatively large by international standards. In almostall cases, we find no evidence of bias in the forecasts when considering the major tax heads overvarious forecast horizons. A decomposition of the forecast errors reveals substantial contributionsfrom sources other than errors in forecasting the macroeconomic environment or in estimating theprevious year’s revenue outturn. This suggests that a formal review of specific procedures andassumptions by the Department could yield further improvements in forecasting performance. Aninnovative exercise examining the routine use of judgement by the Department to adjust theoutcome of forecasting equations indicates that this practice often improved the quality of theforecasts.
I INTRODUCTION
The central role played by numerical targets in meeting fiscal rules hasunderscored the importance of high quality forecasts of government revenue
and expenditure streams. This is particularly key in the case of tax forecasts,
391
The Economic and Social Review, Vol. 47, No. 3, Autumn, 2016, pp. 391-423
POLICY PAPER
An Analysis of Tax Forecasting Errors in Ireland
ANDREW HANNON*Irish Fiscal Advisory Council
EIMEAR LEAHYIrish Fiscal Advisory Council
RÓISÍN O’SULLIVANSmith College, Massachusetts and formerly Irish Fiscal Advisory Council
Acknowledgements: We would like to acknowledge helpful comments from Keith Walsh (RevenueCommissioners) and Niall Feerick (Department of Finance) as well as from members of the Counciland Secretariat of IFAC. Any remaining errors are the authors’.
* Corresponding author: [email protected]
04 Hannon et al PP_Vol. 47-3 20/09/2016 21:12 Page 391

usually the main source of government revenue, accounting for around 70 percent of General Government revenue in Ireland over the past decade.1
Forecasting tax revenues relatively accurately is a difficult task, however,encompassing predictions about macroeconomic growth and about theresponsiveness of the economy to any tax policy changes, among other factors.Moreover, government commitments to meet certain targets for deficitmeasures may create incentives to produce ex ante revenue forecasts that areeither overly optimistic (to create room for additional spending) or deliberatelyprudent (to ensure targets are met or exceeded). Frankel and Schreger (2012)find that the optimism bias in forecasts for the European countries used in theirsample was greater than for others, and questions whether this finding isdespite or because of those countries being subject to the Stability and GrowthPact (SGP). In Ireland the Department of Finance is responsible for forecastingtax revenues twice a year, in the Stability Programme and in the budget. Whenjudging the quality of these official forecasts, both the size and the direction offorecast errors are of interest to assess accuracy and un-biasedness.
Some previous work that looked at Irish revenue forecasts in aninternational context found that the Irish official forecasting performance wason the weaker end of the spectrum. For example, IMF (2005) assessed totalrevenue forecasting accuracy in Ireland as relatively weak when compared to agroup of 11 other countries.2 That study attributed a dominant role tomacroeconomic forecasting errors while also noting evidence of prudence inrevenue forecasts. Buettner and Kauder (2010) found that the accuracy of Irish revenue forecasts ranked tenth among 12 OECD countries examined(Figure 1).3 They also highlighted the potentially important contribution ofmacroeconomic forecasting errors and noted that Irish GDP Root Mean SquareErrors (RMSEs) were by far the largest in the sample (2.5 compared with anaverage of 1.4 for the 12 countries). These findings are consistent with thetendency for macroeconomic forecasts to be relatively large in small economieswhere growth is volatile and GDP forecasts are heavily reliant on external
392 THE ECONOMIC AND SOCIAL REVIEW
1 General Government measures make adjustments for accruals and other exceptional items. Theanalysis that follows is mostly on an Exchequer basis. In the case of taxes, these measures areoften similar.2 Other countries included in this analysis were the US, Germany, UK, France, Italy, Canada,Australia, New Zealand, Netherlands, Sweden, and Switzerland. Ireland was placed 10th out of12 in terms of the root mean square error of its fiscal balance (1991-2003), with revenues accountingfor most of the deviation.3 Eight of the 11 countries included with Ireland in the IMF study were also part of Buettner andKauder’s work. The additional three countries in Buettner and Kauder (2010) were Japan, Austriaand Belgium that replaced Australia, Sweden and Switzerland. Measures of accuracy includedstandard deviation of the forecast errors and root mean squared forecast errors. Data for Irelandspanned 1998-2008.
04 Hannon et al PP_Vol. 47-3 20/09/2016 21:13 Page 392

assumptions. (See, for example, European Commission, 2012). In a recent studyof the European Commission’s revenue forecasts, Afonso and Carvalho (2013)reported that the accuracy of the EC’s total revenue forecasts scaled by GDPfor Ireland ranked 11th of the EU15, with an absolute mean error across threeyears of 0.532 for Ireland compared with 0.142 for the EU15.4 As these resultscompared forecasts across countries that were made by the same institution,the relatively poor performance for Ireland reinforces the idea that forecastingIrish revenues may be particularly challenging. In addition to difficulties inforecasting the macroeconomic drivers of the tax revenue, other factors such asa small number of dominant firms contributing to corporation taxes, complicatethe task.
AN ANALYSIS OF TAX FORECASTING ERRORS IN IRELAND 393
USA-CBO
Japan
USA-OM
B
Irelan
d
Nethe
rland
s
Germ
any
Canad
aIta
ly
New Z
ealan
d
Belgium
Fran
ce
Austri
aUK
–15
–10
–5
0
5
10
15
20
25
Err
or a
s a
per
cent
age
of fo
reca
st
Source: Buettner and Kauder (2010).Note: CBO: US Congressional Budget Office. OMB: US Office of Management andBudget. The Figure displays the forecast errors for total tax revenues in percentage forup to 13 years in each country, each point representing one forecast. A positive (negative)value denotes overestimation (underestimation). The forecasts are arranged indescending order of the standard deviation of the respective forecast errors. The two USforecasts only refer to federal taxes. The comparison of taxes is on an accruals basis.The analysis that follows is not.
Figure 1: Forecasting Performance in an International Context
4 This is based on the average mean error for total revenue as a percentage of GDP for forecasts fort, t+1 and t+2 based on the ESA95 definition of total revenue for 1999-2012.
04 Hannon et al PP_Vol. 47-3 20/09/2016 21:13 Page 393

The most comprehensive study focussing exclusively on official tax fore -casting errors in Ireland is the analysis of the Tax Forecasting MethodologyReview Group (TFMRG) published in 2008.5 That study outlined the forecastingmethodology used by the Department of Finance and analysed the size offorecast errors over the 1999-2006 period. The report found that, even whenmacroeconomic forecast errors were controlled for, overall forecast errorsremained significant. VAT forecasts were most accurate while the largestforecast errors were observed for capital gains tax, stamp duty and corporationtax. The influence of property market developments on tax revenues over thatperiod was highlighted and recommendations were made to incorporate suchdevelopments into forecasts for VAT and stamp duty. The report also called formore regular analysis of tax forecasting performance, including analyses of one-off factors affecting tax revenue, and for the annual publication of such analysesby the Department of Finance. Since the publication of the 2008 report some ofthe recommendations have been implemented, but there has not been anotherreview of that kind in the meantime. A summary of the report’s mainrecommendations can be found in Appendix A.
This paper undertakes a comprehensive analysis of official tax forecasterrors for the period 1997-2014. Some of the analysis builds upon material fromthe TFMRG report and publications by the Irish Fiscal Advisory Council (IFAC,2014). Section II contains a brief description of the structure of the Irish taxsystem and outlines the general forecasting approach employed by theDepartment of Finance. The remainder of the paper evaluates the Departmentof Finance’s tax forecasting performance. Of interest is both the overall accuracyof the forecasts and whether there is any evidence of bias in the forecastingprocess. Section III looks at the size and direction of forecast errors, discussingwhether forecasts are persistently optimistic or pessimistic, as well asexamining the relative contributions of different tax categories to the overallerror. In Section IV, the errors for each major tax category are decomposed todetermine whether they primarily arise from errors in macroeconomic forecastsor other sources. Section V analyses the degree to which forecasts are subjectedto discretionary upward or downward adjustments by the Department ofFinance while Section VI provides some conclusions.
394 THE ECONOMIC AND SOCIAL REVIEW
5 The TFMRG was given the task of reviewing tax forecasting performance and methodologies andwas required to make methodological recommendations where appropriate. The working groupconsisted of 11 members: five from the Department of Finance; two from the RevenueCommissioners; two from the Economic and Social Research Institute; one from the Central Bankof Ireland; and one from the European Commission.
04 Hannon et al PP_Vol. 47-3 20/09/2016 21:13 Page 394

II TAX REVENUE IN IRELAND
2.1 Structure of the Irish Tax SystemTax revenue (including direct and indirect taxes but not social security
contributions) amounted to 21.8 per cent of GDP (25.3 per cent of GNP) in 2014.While this ratio has been slightly below the Euro Area average in recent years,Ireland relies relatively more on direct and indirect taxes than on social securitycontributions compared with the average in the Euro Area (EuropeanCommission, 2013).
The relative contribution of the main tax heads towards overall tax revenuein Ireland between 1997 and 2014 is shown in Figure 2. Despite a reduction inthe number of people at work from 2008-2013, the contribution of income roseover that period, reaching over 40 per cent in 2011 (due to changes in taxcredits, standard rate bands as well as the phasing out and abolition of certainreliefs). The introduction of the Universal Social Charge contributed tocontinued strength in subsequent years.
VAT is the second biggest tax category, contributing 29 per cent of total taxrevenue on average between 1997 and 2014. Its contribution peaked at 33 percent in 2008 (and overtook income tax as the largest category) driven by veryhigh levels of consumer spending and VAT related property transactions. Sincethen, its contribution has fallen and is now back below the period average.
Figure 2: Structure of Tax Revenue
Source: Department of Finance.Note: Income tax includes the Universal Social Charge (USC) from 2012 onward. Otherincludes Local Property Tax (LPT) from 2013 on.
AN ANALYSIS OF TAX FORECASTING ERRORS IN IRELAND 395
1997
1998
1999
2000
2001
2002
2003
2004
2005
2006
2007
2008
2009
2010
2011
2012
2013
2014
0%
10%
20%
30%
40%
50%
60%
70%
80%
90%
100%
Income Tax VAT Excise Corp’n Tax Capital
P
erce
ntag
e of
tot
al t
ax
04 Hannon et al PP_Vol. 47-3 20/09/2016 21:13 Page 395

Excise and corporation tax each account for about 14 per cent of total taxrevenue. Although revenue from excise increased in absolute terms, itscontribution towards total tax revenue decreased during the boom period.
The remaining two categories are capital taxes, comprising capital gainstax and capital acquisitions tax (5 per cent of total) and “other”, which includesstamp duties and customs duties (5 per cent of total). Revenue from both ofthese categories increased steadily during the “Celtic Tiger” era, with thecontributions of capital and other taxes reaching 8 and 9 per cent of total taxrevenue respectively in 2006. With the collapse in the property market, revenuefrom these categories has fallen sharply in more recent years.
2.2 Department of Finance Tax Forecasting MethodologyThe forecasting procedure employed by the Department of Finance is
described in the 2008 TFMRG report and can be summarised using thefollowing equation:
Revt+1 = (Revt – Tt)(1 + (BGt+1E)) + Tt+1 + Mt+1 + Jt+1 (1)
where Revt+1 is the one-year-ahead forecast for a particular tax head, Revt isan estimate of the yield for that tax head in the current year, i.e. the year inwhich the forecast is made, Tt are one-off (temporary) items affecting the yieldin the current year, BG
t+1 is the projected growth rate in the appropriatemacroeconomic driver (i.e. the main economic variable that drives receipts) fora particular tax for the year ahead, E is the elasticity measuring theresponsiveness of tax revenue to the tax base, Tt+1 are one-off items affectingthe yield in the coming year, Mt+1 is the estimated static yield from any changesin policy affecting receipts for a particular tax in the coming year and Jt+1 is ajudgement factor applied by the Department of Finance. The relevant macrodriver for each tax head is shown in Table 1.6
The elasticity factor, E, in Equation (1) measures the response of taxrevenue to changes in the macro driver. An elasticity of 1 is used7 except in thecase of PAYE, which uses time-specific earnings and employment elasticities.Most recently, the Department of Finance assumes that the elasticity of PAYEis 2.15 with respect to growth in earnings per head and 0.9 with respect togrowth in employment. 8
The same basic procedure used to forecasts taxes in t+1 is applied to t+2and t+3. The forecasts for all taxes are then aggregated to total tax revenue
396 THE ECONOMIC AND SOCIAL REVIEW
6 Table 1 excludes DIRT, self-assessed income tax, USC and local property tax.7 TFMRG (2008) specifies the elasticity used in the case of each tax head. 8 PAYE’s elasticity with respect to earnings per head has varied between 1.95 and 2.18 since 2004.The elasticity with respect to employment has varied between 0.7 and 1.0.
04 Hannon et al PP_Vol. 47-3 20/09/2016 21:13 Page 396

and a consistency check is applied to ensure that total tax revenue growsbroadly in line with nominal GDP. TFMRG (2008) stated that “over the 1996-2006 period, the implied aggregate tax-to-GDP elasticity was found to average1.1”.10 Analysis by the ESRI (published in TFMRG, 2008) suggests that theDepartment of Finance’s assumption of an aggregate tax elasticity of 1 isreasonable. It is also the case that elasticities vary over time, with aggregateannual measures sometimes deviating far from the long-run average, makingthis a worthy topic for further investigation.
In addition to the responsiveness of tax revenue to the macro drivercaptured by E, revenue forecasts also need to take account of the impact ofpolicy changes, such as the effect of changes in tax rates on the appropriatemacro driver. For example, while nominal personal consumption growth willimpact VAT revenue (with E capturing this relationship) a change in the VATrate will also affect the growth in nominal personal consumption. The taxforecasting equation does not specify this effect explicitly but attempts tocapture it by taking account of the impact of tax rate changes in the forecastfor the macro driver.
AN ANALYSIS OF TAX FORECASTING ERRORS IN IRELAND 397
Table 1: Macro Driver by Tax Head
Tax Head Macro driver
VAT Nominal personal consumption adjusted for touristspending.
Corporation Tax Nominal GDP until 2008, since then Gross OperatingSurplus.
Excise Duties excl. Nominal personal consumption adjusted for touristVehicle Registration spending and spending on transport equipment.Tax (VRT)
VRT Projected change in the price of new cars and the volumeof new car sales.
PAYE9 Non-agricultural employment and non-agricultural wages.
Capital Gains Tax Nominal GNP.
Capital Acquisitions Tax Nominal GNP.
Stamp Duties Volume and price of new housing activity; Investment innon-residential construction.
9 Pay as you earn (PAYE) is the largest component of income tax. Non-PAYE components of incometax are not considered in this paper due to data limitations. 10 At the time of this study the Department of Finance confirmed that their estimate of the elasticityhas not changed.
04 Hannon et al PP_Vol. 47-3 20/09/2016 21:13 Page 397
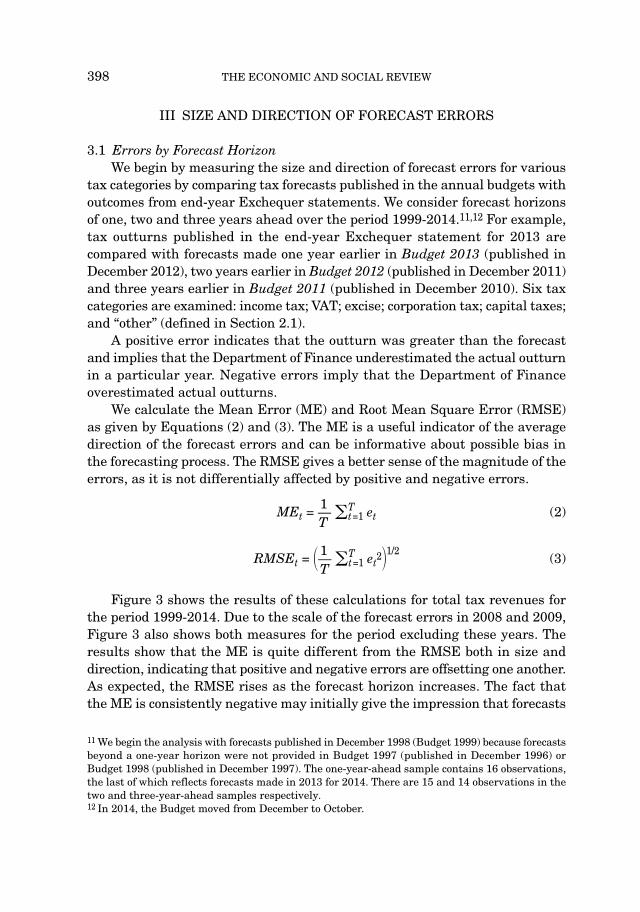
III SIZE AND DIRECTION OF FORECAST ERRORS
3.1 Errors by Forecast HorizonWe begin by measuring the size and direction of forecast errors for various
tax categories by comparing tax forecasts published in the annual budgets withoutcomes from end-year Exchequer statements. We consider forecast horizonsof one, two and three years ahead over the period 1999-2014.11,12 For example,tax outturns published in the end-year Exchequer statement for 2013 arecompared with forecasts made one year earlier in Budget 2013 (published inDecember 2012), two years earlier in Budget 2012 (published in December 2011)and three years earlier in Budget 2011 (published in December 2010). Six taxcategories are examined: income tax; VAT; excise; corporation tax; capital taxes;and “other” (defined in Section 2.1).
A positive error indicates that the outturn was greater than the forecastand implies that the Department of Finance underestimated the actual outturnin a particular year. Negative errors imply that the Department of Financeoverestimated actual outturns.
We calculate the Mean Error (ME) and Root Mean Square Error (RMSE)as given by Equations (2) and (3). The ME is a useful indicator of the averagedirection of the forecast errors and can be informative about possible bias inthe forecasting process. The RMSE gives a better sense of the magnitude of theerrors, as it is not differentially affected by positive and negative errors.
1MEt = — otT=1 et (2)
T
1RMSEt = 1— otT=1 et
221/2(3)
T
Figure 3 shows the results of these calculations for total tax revenues forthe period 1999-2014. Due to the scale of the forecast errors in 2008 and 2009,Figure 3 also shows both measures for the period excluding these years. Theresults show that the ME is quite different from the RMSE both in size anddirection, indicating that positive and negative errors are offsetting one another.As expected, the RMSE rises as the forecast horizon increases. The fact thatthe ME is consistently negative may initially give the impression that forecasts
398 THE ECONOMIC AND SOCIAL REVIEW
11 We begin the analysis with forecasts published in December 1998 (Budget 1999) because forecastsbeyond a one-year horizon were not provided in Budget 1997 (published in December 1996) orBudget 1998 (published in December 1997). The one-year-ahead sample contains 16 observations,the last of which reflects forecasts made in 2013 for 2014. There are 15 and 14 observations in thetwo and three-year-ahead samples respectively. 12 In 2014, the Budget moved from December to October.
04 Hannon et al PP_Vol. 47-3 20/09/2016 21:13 Page 398

are biased towards an overestimation of tax revenues, in contrast with theIMF’s (2005) view that between 1991 and 2003 “budget forecasts relied on aprudent assumption”, i.e. tended to be biased in the direction of under -estimation. However, the ME excluding 2008-2009 shows a less clear-cutpattern. Indeed, upon closer examination, it appears that there are no clearsigns of bias in the forecasts over the 1999-2014 period as a whole. For the 14-16 years for which forecasts across the various horizons are examined, thereare close to equal numbers of positive and negative errors observed for total taxrevenue.
Figure 3: Forecast Error Summary (1999-2014)
Sources: Department of Finance and author calculations.Note: YA indicates Year(s) Ahead
Total taxes are generally forecast as the sum of each of the tax heads.Figures 4 to 7 show the ME and RMSE for each tax head. We also show themean weighted error and the weighted RMSE, where the errors for each taxhead are weighted by their forecast share in total tax revenue to reflect theirrelative importance. Due to the distortionary effects of the 2008-2009 yearsshown above, these observations are again excluded. Figure 4 shows that theerrors for capital taxes and other taxes are the largest over all forecast horizonsand Figure 5 shows that they remain important even after adjusting for theirrelatively small share in total taxes. This is not unexpected given theextraordinary influence of the boom in the housing sector on these tax headsover much of the period examined. Recall that stamp duties related to propertyconveyance are included in the “other taxes” category and that capital gainstax receipts relating to the property market are included under the capital taxeshead. Addison-Smyth and McQuinn (2010) gives a good sense of the extent of
AN ANALYSIS OF TAX FORECASTING ERRORS IN IRELAND 399
1 YA 2 YA 3 YA–15.0
–10.0
–5.0
0.0
5.0
10.0
15.0
20.0
25.0
Mean Error Mean Error ex.08-09 RMSE RMSE ex.08-09
Per
cent
age
of r
etur
n
04 Hannon et al PP_Vol. 47-3 20/09/2016 21:13 Page 399

this housing-related impact, documenting that the share of residentialconstruction-related taxes in the Exchequer returns more than doubled between1999 and their peak in 2006. It is unsurprising, therefore, that the forecastingerrors for the tax heads most directly influenced by this development were sodominant.
This is also borne out in Figures 6 and 7 where the magnitude of the errorsis more clearly depicted. Even when weighted according to their forecastedshare in total taxes, the RMSEs for capital taxes and other taxes remain asimportant (and in some cases more important) than errors in much larger taxheads such as income tax and VAT. It is also important to note that income taxincludes USC from 2011 onwards. This could have affected errors in the periodsurrounding its introduction due to uncertainty surrounding the impact of thenew tax. Interestingly, breaking down these averages to look at the direction ofyear-by-year errors does indicate that for many tax heads, revenues tended tobe underestimated during periods of strong economic activity and overestimatedwhen economic conditions were weak, including during the exceptional periodof economic weakness in 2008-2009. In subsequent sections, a closer look istaken at the pattern of errors in specific sub-periods and the role of errors inthe forecasts of the relevant macroeconomic drivers for tax revenue is examined.
400 THE ECONOMIC AND SOCIAL REVIEW
Figure 4: Mean Error(Excluding 2008-2009) By Tax
Head
Figure 5: Mean Weighted Error(Excluding 2008-2009)
1 YA 2 YA 3 YA-25
-20
-15
-10
-5
0
5
10
15
% o
f ou
ttur
n
1 YA 2 YA 3 YA-3.0
-2.5
-2.0
-1.5
-1.0
-0.5
0.0
0.5
1.0
% o
f ou
ttur
n
Income Tax Excise VAT Other Capital TaxesCorporation Tax
04 Hannon et al PP_Vol. 47-3 20/09/2016 21:13 Page 400
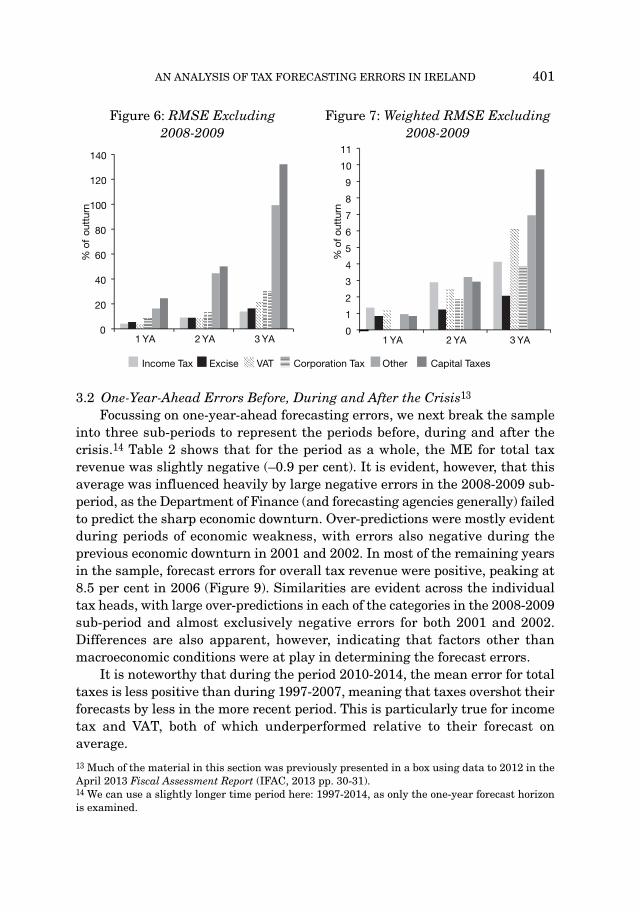
3.2 One-Year-Ahead Errors Before, During and After the Crisis13
Focussing on one-year-ahead forecasting errors, we next break the sampleinto three sub-periods to represent the periods before, during and after thecrisis.14 Table 2 shows that for the period as a whole, the ME for total taxrevenue was slightly negative (–0.9 per cent). It is evident, however, that thisaverage was influenced heavily by large negative errors in the 2008-2009 sub-period, as the Department of Finance (and forecasting agencies generally) failedto predict the sharp economic downturn. Over-predictions were mostly evidentduring periods of economic weakness, with errors also negative during theprevious economic downturn in 2001 and 2002. In most of the remaining yearsin the sample, forecast errors for overall tax revenue were positive, peaking at8.5 per cent in 2006 (Figure 9). Similarities are evident across the individualtax heads, with large over-predictions in each of the categories in the 2008-2009sub-period and almost exclusively negative errors for both 2001 and 2002.Differences are also apparent, however, indicating that factors other thanmacroeconomic conditions were at play in determining the forecast errors.
It is noteworthy that during the period 2010-2014, the mean error for totaltaxes is less positive than during 1997-2007, meaning that taxes overshot theirforecasts by less in the more recent period. This is particularly true for incometax and VAT, both of which underperformed relative to their forecast onaverage.
AN ANALYSIS OF TAX FORECASTING ERRORS IN IRELAND 401
Figure 6: RMSE Excluding 2008-2009
Figure 7: Weighted RMSE Excluding2008-2009
1 YA 2 YA 3 YA0
20
40
60
80
100
120
140
% o
f ou
ttur
n
Income Tax Excise VAT Other Capital TaxesCorporation Tax
1 YA 2 YA 3 YA0
1
2
3
4
5
6
7
8
9
10
11
% of
out
turn
13 Much of the material in this section was previously presented in a box using data to 2012 in theApril 2013 Fiscal Assessment Report (IFAC, 2013 pp. 30-31).14 We can use a slightly longer time period here: 1997-2014, as only the one-year forecast horizonis examined.
04 Hannon et al PP_Vol. 47-3 20/09/2016 21:13 Page 401

Figure 8 shows that the largest RMSEs have been consistently in capitaltaxes and the “other” category, with the latter including stamp duties. Asdiscussed above, the major influence of property market developments on thesetax categories is reflected in the large positive MEs during the boom years, asrevenues from this source were underestimated, followed by even largernegative errors (overestimates) during the subsequent correction.
Figure 8: One-Year-Ahead RMSE by Tax Head
Figure 9 shows the contributions of each tax head towards overall errors. Ithas generally been the case that the largest tax categories have made thegreatest contributions to forecasting errors over the 1997-2014 period. VATaccounted for the greatest proportion of the forecasting errors in both 2008 and2009, due mainly to the unforeseen collapse in property related and
402 THE ECONOMIC AND SOCIAL REVIEW
Table 2: One-Year-Ahead Mean Errors by Tax Head
ME 1997-2014 1997-2007 2008-2009 2010-2014
Income Tax 0.2 2.3 –8.6 –0.7Excise –2.1 –0.9 –16.0 0.8Capital Taxes –1.0 21.8 –128.8 0.0VAT –1.7 1.2 –20.7 –0.3Corporation Tax –3.0 0.6 –42.4 4.8Other 1.8 7.9 –54.9 10.9Total –0.9 2.7 –24.7 0.9
1997-2014 1997 - 2002 2003-2007 2008-2009 2010-20140
20
40
60
80
100
120
140
Income Tax Excise VAT Corporation Tax OtherCapital Taxes Total
% o
f ou
ttur
n
04 Hannon et al PP_Vol. 47-3 20/09/2016 21:13 Page 402

consumption expenditure.15 A decomposition of the errors, presented in SectionIV, suggests that effects of VAT policy changes16 and one-off items were alsooverestimated in these years. Corporation tax made the second largestcontribution to the error during this period, as yields fell by over 20 per cent inboth 2008 and 2009 against the background of a broad deterioration in theinternational economic environment. Although capital and “other” taxescontribute only a small proportion of the total tax take, the contribution of thesetaxes toward the overall error became quite significant between 2003 and 2009.For example, in 2005, capital and “other” taxes contributed 13 per cent to totaltax revenue but accounted for over two-thirds of the forecasting error. Thecontribution of income tax errors is particularly small in the post-2009 periodas even during the introduction of the USC in 2011. Smaller errors featureacross many of the other tax categories post-2009 where we can again see thatthe error for total tax revenue is less positive than it had been during most ofpre-2008 period.
Figure 9: Contribution of Each Tax Head to the Overall Error
AN ANALYSIS OF TAX FORECASTING ERRORS IN IRELAND 403
15 Addison-Smyth and McQuinn (2010) report that VAT receipts relating to new housing accountedfor almost a quarter of VAT receipts in 2007. The Department of Finance forecast that realconsumption would grow by 3.8 per cent and 0.5 per cent in 2008 and 2009 respectively. Data fromthe CSO’s National Income and Expenditure Accounts 2014 shows that the actual growth rateswere 0.3 per cent in 2008 and -5.3 per cent in 2009. 16 Changes in VAT charged on supplies in the construction sector were expected to yield €49 millionin 2008. Also, the standard rate of VAT was increased from 21 to 21.5 per cent in December 2008.This measure was expected to yield €227 million in a full year.
1997
1998
1999
2000
2001
2002
2003
2004
2005
2006
2007
2008
2009
2010
2011
2012
2013
2014
-29
-24
-19
-14
-9
-4
1
6
11
Income Tax Excise VAT Corporation
Tax Capital
Taxes Other
per
cent
age
of
tota
l ou
ttur
n
Sources: Department of Finance and author calculations.Note: Forecast error = Outturn – forecast, where forecast includes adjustment forjudgement. *2009 contained a Supplementary Budget.
04 Hannon et al PP_Vol. 47-3 20/09/2016 21:13 Page 403

IV ERROR DECOMPOSITION17
4.1 Data and Methodology To gain further insight into the sources of the errors, we decompose one-
year-ahead errors for four of the main tax heads (VAT, corporation tax, exciseand the “pay as you earn” (PAYE) component of income tax). Three types oferrors are identified: starting point errors, i.e. errors that are caused by usingan incorrect estimate of the yield for a particular tax in the current year (Revtin Equation 1); macro driver errors, i.e. errors that are caused by using anincorrect projected growth rate in the macro driver (BG
t+1 in Equation 1); andother errors which are caused by using incorrect estimates of any othercomponent of the forecast, i.e. one-off items in the current year and the nextyear (Tt and Tt+1), the static yield from any changes in policy for the comingyear (Mt+1), the judgement factor for the coming year (Jt+1) and the elasticity,E, which the Department of Finance assumes is 1 for most tax heads (anexception is the PAYE component of income tax).18
First, the Department of Finance forecasts are replicated. This is done bycollecting the data that were used at the time the forecast was made: in thecase of VAT and corporation tax, data for Revt are taken from annual budgetpublications while the Department of Finance supplied these data for the PAYEcomponent of income tax and for sub components of excise duty; data for Mt+1for each tax head are taken from Budget publications; information about BG
t+1,Tt, Tt+1 and E was provided to us by the Department of Finance for the years2004-2014. We identify the judgement term, Jt+1, as the difference between thepublished forecast and the forecast that is generated using the information thatwas provided by the Department of Finance.
The forecast equations for VAT and corporation tax mirror Equation (1)presented earlier. The forecast for excise duty consists of two parts: the firstpart involves predicting the expected yield from Vehicle Registration Tax (VRT)(in which case the macro driver is the expected increase in sales of new carsmultiplied by the expected increase in the price of new cars); the second partconsists of forecasting excise duty minus VRT (in which case the macro driveris the projected growth rate in nominal personal consumption excluding carsand tourism spending).19 In the case of PAYE, Equation (1) is adapted to includetwo macro drivers – the expected growth in non-agricultural wages and non-agricultural employment – each of which is multiplied by an elasticity factor
404 THE ECONOMIC AND SOCIAL REVIEW
17 Some of the results in this section were presented in Analytical Note 3 as part of IFAC (2014).18 This approach ignores possible interactions between different sources of errors. It is likely thatany interaction terms would be small and this approach greatly simplifies the analysis.19 In the case of excise, the measure of personal consumption expenditure is adjusted to includeexpenditure by Irish residents abroad and exclude expenditure of non-Irish residents in Ireland.
04 Hannon et al PP_Vol. 47-3 20/09/2016 21:13 Page 404

(see Section 2.2). The elasticities used to forecast PAYE are estimated by theDepartment of Finance and can vary over time. The employment elasticity hasbeen close to one in recent years while the earnings elasticity has been between2.1 and 2.2. In the case of other tax heads the elasticity, E, is assumed to beone.
Starting point errors can be identified by estimating Equation (1) usingactual outturn data for Revt which is published in the end year Exchequerstatement.20 All other values in the equation are those that were used by theDepartment of Finance at the time the forecast was made. By comparing thenumber that is generated using this equation to the budget forecast we isolatethe degree to which Revt+1 is inaccurate due to the use of an incorrect estimateof the tax yield in the current year, that is at the start of the forecast period.For example, in the case of VAT, the total forecast error in 2012 was €176million. This error falls to €166 million when the actual yield for 2011 (Revt) isused in place of the estimated yield. Thus, the starting point error in this caseis €10 million. Similarly, we identify the macro driver error by estimatingEquation (1) using the correct value for BG
t+1, published in the National Incomeand Expenditure Accounts (NIE).21 The “other” forecast error is calculated as aresidual, i.e. the overall forecast error for a particular tax head minus thestarting point error and the macro driver error. All errors are calculated innominal values to facilitate aggregation and comparison. In the case of excise,the various types of errors are calculated for each subcomponent separately andare then combined in order to get the total excise starting point, macro driverand “other” errors.
The specific equations for each tax head are described in more detail inAppendix A. Due to data limitations, we cannot decompose the forecast errorsfor other components of income tax, capital taxes, customs duties or stampduties, or for the period before 2004.
4.2 Error Decomposition ResultsBecause positive and negative errors from different sources can cancel each
other out, we convert all errors to positive values and generate a “gross” error in absolute terms. We can then identify the contribution of each source oferror to the overall error. Table 3 reports the average contribution made by each of the four tax heads to the gross error over the period 2004-2014. The
AN ANALYSIS OF TAX FORECASTING ERRORS IN IRELAND 405
20 Outturn data for PAYE, VRT and excise excluding VRT are provided by the Department ofFinance. 21 In the case of a forecast made for the year 2011, outturn data for BG
t+1 are taken from the NationalIncome and Expenditure Accounts (2014). Outturns for non-agricultural employment, which feedsinto the PAYE forecast, are taken from the Quarterly National Household Survey (Q1 2015). In thecase of VRT, outturn data for new car sales and prices were provided by the CSO.
04 Hannon et al PP_Vol. 47-3 20/09/2016 21:13 Page 405

peak contribution and the year in which it occurred are also shown. In Figures10 to 13, the forecast error for each year is decomposed in nominal terms.Results show that both positive and negative errors were prevalent over theperiod.
In the case of VAT, the error peaked in absolute terms in 2009 when theerror relating to the macro driver estimate (i.e. expected levels of consumptionexpenditure) accounted for 70 per cent of the gross error. Generally, however,the contribution of the macro driver error to the gross VAT error was muchlower, accounting for approximately one-third of the total. The starting point errors were negative (the outturns were overestimated) in most yearsconsidered and accounted for the smallest proportion of the gross VATforecasting error on average. The size and direction of the “other” error hasfluctuated over time. It peaked in absolute terms in 2008. We cannot tell theextent to which the “other” error is influenced by mis-estimation of the cost of new policy measures (Mt+1), the level of judgement imposed on theforecast (i.e. the Jt+1 component) or the effect of one-off items (Tt+1) beingoverstated. It is also possible that part of the other error pre-2008 is due to the fact that a portion of VAT receipts were related to the property market rather than ordinary consumption. Since 2009, the absolute size of VAT forecasterrors has generally decreased. However, in some years (e.g. 2010) it has been the case that substantial positive and negative errors from differentsources have offset each other, resulting in an overall forecast error that appearssmall.
Table 3: Gross Errors 2004-2014
% of Gross Error
Macro Starting Point Other
Avg. Peak Avg. Peak Avg. Peak(Yr. of Peak) (Yr. of Peak) (Yr. of Peak)
VAT 30% 70% 8% 23% 62% 85%(2009) (2004) (2013)
PAYE 40% 89% 11% 38% 49% 85%(2009) (2011) (2012)
Corporation 18% 51% 23% 73% 59% 89%Tax (2014) (2013) (2006)
Excise 42% 83% 18% 60% 41% 83%(2006) (2014) (2007)
406 THE ECONOMIC AND SOCIAL REVIEW
04 Hannon et al PP_Vol. 47-3 20/09/2016 21:13 Page 406

Figure 10: VAT
Sources: Department of Finance and author calculations.Note: Forecast error = Outturn – forecast, where forecast includes adjustment forjudgement. * 2009 Contained a Supplementary Budget.**The Jobs Initiative 2011 levied a reduced 9 per cent VAT rate on the tourism sector.
Figure 11: PAYE
AN ANALYSIS OF TAX FORECASTING ERRORS IN IRELAND 407
2004 2005 2006 2007 2008 2009* 2010 2011** 2012 2013 2014-3000
-2500
-2000
-1500
-1000
-500
0
500
1000
Macro Error Starting
Point
Error Other
Error Total
Error
€ m
illio
n
2004
2005
2006
2007
2008
2009
*20
1020
1120
1220
1320
14-3,000
-2,500
-2,000
-1,500
-1,000
-500
0
500
1,000
Macro
Error Starting Point Error Other Error Total Error
€ m
illio
n
Sources: Department of Finance and author calculations.Note: Forecast error = Outturn – forecast, where forecast includes adjustment forjudgement. *2009 contained a Supplementary Budget.
04 Hannon et al PP_Vol. 47-3 20/09/2016 21:13 Page 407

Figure 12: Corporation Tax
Sources: Department of Finance and author calculations.Note: Forecast error = Outturn – forecast, where forecast includes adjustment forjudgement. *2009 contained a Supplementary Budget.
Figure 13: Excise
Sources: Department of Finance and author calculations.Note: Forecast error = Outturn – forecast, where forecast includes adjustment forjudgement. *2009 contained a Supplementary Budget.
408 THE ECONOMIC AND SOCIAL REVIEW
2004
2005
2006
2007
2008
2009
*20
1020
1120
1220
1320
14-3,000
-2,500
-2,000
-1,500
-1,000
-500
0
500
1,000
Macro Error Starting Point Error Other Error Total Error
€ m
illio
n
2004
2005
2006
2007
2008
2009
*20
1020
1120
1220
1320
14-3,000
-2,500
-2,000
-1,500
-1,000
-500
0
500
1,000
Macro Error Starting Point Error Other Error Total Error
€ m
illio
n
04 Hannon et al PP_Vol. 47-3 20/09/2016 21:13 Page 408

The total PAYE error peaked in 2009, having been overestimated by some€1.6 billion (19 per cent of the outturn for that year). The macro driveraccounted for 89 per cent of the gross error that year. On average, however,“other” errors made the largest contributions (49 per cent) towards the grossPAYE forecasting error over the 2004-2014 period. PAYE errors are smallcompared to the other tax heads with the only large error coming in 2009 dueto the size of the macro error. The contribution of starting point errors to thegross error has been small (11 per cent on average) due to the fact that PAYEreceipts do not fluctuate much from month to month.
Corporation tax forecasts errors have also been well distributed above andbelow zero since 2004. Figure 12 shows that they peaked in 2009, withcontributions from all three types of error. The biggest contributor was thestarting point error (45 per cent of the gross error), reflecting, in part, theunexpected decline in company profits in 2008. In most years considered,however, the “other” errors accounted for the greatest proportion of theforecasting error (59 per cent of the gross error on average) reflecting thedifficulty in predicting the effects of Irish policy changes22 and the externalenvironment on already volatile levels of corporation tax revenue.23 Until 2008,the macro driver used for corporation tax was the predicted change in the levelof nominal GDP. In an effort to improve forecasting performance following theTFMRG 2008 report, the macro driver has been Gross Operating Surplus (GOS)(i.e. GDP less taxes and compensation of employees, plus subsidies) since 2009.An analysis of the forecast errors for both of these variables indicates that onaverage the move to GOS had only a small positive effect on the accuracy of theforecasts.24 Starting point errors have been most significant for corporation tax,reflecting the somewhat lumpy nature of corporate tax revenues often receivedtowards the end of the year.
In the case of excise, errors in the macro driver and starting point contributealmost evenly to the gross error. Macro driver errors accounted forapproximately 42 per cent of the error on average over the relevant period andmade the largest contribution on six of the eleven occasions considered.Separate decompositions of the forecasts for excise excluding VRT and VRTitself are shown in Appendix B. Results indicate that the large excise duty
AN ANALYSIS OF TAX FORECASTING ERRORS IN IRELAND 409
22 Although the rate of corporation tax has not changed since 2003, various policy changes havebeen introduced, for example, incentives for expenditure on research and development, changes inliability depending on accounting periods, or alternative thresholds for start-up/small companies. 23 As noted above, corporation tax receipts are highly concentrated among several large corporationsin the external sector.24 Over the four year period (2009-2013 inclusive), the RMSE for nominal GDP was 25 per centwhereas for GOS it was 21 per cent. Nominal GDP forecasts performed better than GOS forecastsin 2011 and 2012 whereas GOS performed better in all other years.
04 Hannon et al PP_Vol. 47-3 20/09/2016 21:13 Page 409

errors in 2008-2009 were driven by poorer than expected levels of VRT.25
Appendix B also shows that VRT errors are driven by macro errors whilestarting point errors tend to be particularly small. As very few cars are sold inthe month of December, it may be easier to predict Revt for VRT than is thecase for other tax heads.
In general, these decompositions suggest that the relative contribution ofdifferent error sources towards the overall error varies over time and by taxhead. The exercise reveals that, on occasion, relatively small overall forecasterrors mask larger offsetting component errors. A brief analysis of thecorrelations between the errors from the various sources did not reveal anydiscernible pattern, however. The IMF (2005) stated that “revenue forecasterrors can be largely explained by errors in the outlook for growth” for the 1991-2003 period. The analysis presented here indicates that, while macro drivererrors accounted for substantial portions of the errors in many cases, the “other”component had at least an equal if not more significant impact on forecastingaccuracy over the 2004-2014 period. This finding was consistent across the fourkey tax heads. Thus, it is clear that tax revenue errors are not simply reflectingerrors in the macro forecasts.
V ADJUSTMENTS TO THE FORECASTS
In some cases forecasters may seek to make adjustments to the forecastbeyond those made to account for one-offs or policy changes. This may be dueto the forecasting procedure persistently over- or underestimating the tax yieldin the past, or due to a belief that some part of agents’ behaviour with regardto the tax may change in a way that cannot accurately be picked up by themacro driver.26 In this section, we take a more in-depth look at this judgementterm, given the obvious potential for bias to enter into the forecasting processthrough this avenue. Specifically, we estimate the degree to which one-year-ahead forecasts for VAT, corporation tax, excise and PAYE were subjected todiscretionary upward or downward adjustments by the Department of Finance.We do this by estimating the forecast equations described in Section 2.2 (andAppendix B) for the years 2004-2014 using the same data as was used by theDepartment of Finance at the time the forecast was made. The judgement term
410 THE ECONOMIC AND SOCIAL REVIEW
25 According to the Department of Finance (2010), car sales declined by 19 per cent in 2008 and by63 per cent in 2009. These declines, combined with an increase in car price competition, and thetendency towards buying cheaper and cleaner cars (where the VRT rates are lower), significantlyreduced the VRT yield. 26 For example, the Department of Finance may believe that growth in consumption could be moretax rich in future years and wish to adjust for that.
04 Hannon et al PP_Vol. 47-3 20/09/2016 21:13 Page 410

Jt+1 is omitted from the estimation (we refer to these forecasts as “unadjusted”forecasts). We then compare the resulting values to the forecasts that arepublished in the annual budgets (we refer to these forecasts as “adjusted”forecasts because they are altered by the judgement term Jt+1). We also analysethe effect of such adjustments on overall forecast errors.
Figures 14 to 17 show the size and direction of adjustments (i.e. the size of Jt+1 as a percentage of the overall forecast) that were applied to VAT, PAYE,corporation tax, and excise forecasts respectively between 2004 and 2014. Theabsolute size of the adjustments as well as the size of the adjustment as apercentage of the yield for the relevant tax head is shown in Appendix D. As apercentage of overall forecasts, adjustments appear relatively small: the biggestadjustments were applied to corporation tax (the absolute value of theadjustment amounted to 7.7 per cent of the forecast on average), followed byPAYE (6.2 per cent of the forecast on average). The average adjustments appliedto excise and VAT forecasts were much smaller (1.6 per cent and 1.4 per centrespectively). In the case of corporation tax, the biggest adjustment was appliedin 2010 where forecasts were adjusted downwards by over €800 million (26 percent of the forecast for that year). The biggest excise adjustment occurred in2009 when the forecast was adjusted downwards by €196 million (3.4 per centof the forecast).27 The largest adjustment to the VAT forecast occurred in 2009– a downward adjustment of almost €800 million (5.8 per cent of the forecastfor that year) – despite an increase of 0.5 per cent in the standard VAT ratethat year.28 The biggest adjustments to PAYE forecasts occurred before thecrisis where forecasts were adjusted upwards by 12 per cent in 2004, 2005 and2006. (This followed three years of income tax underestimations of 6, 4 and 2per cent respectively).
For VAT, corporation tax and PAYE, the majority of adjustments were inan upward direction. In the case of excise, however, downward adjustmentswere consistently applied between 2004 and 2011. This pattern was reversedin 2012 when a small upward adjustment (less than 1 per cent of the exciseforecast) was imposed. Although forecasts are routinely adjusted by theDepartment of Finance, in general, the adjustments are relatively small.29
Also shown in Figures 14 to 17 are the forecast errors that resulted afteradjustments had been applied to the forecasts (i.e. the difference between the
AN ANALYSIS OF TAX FORECASTING ERRORS IN IRELAND 411
27 This adjustment coincided with a measure to reduce excise on alcohol which was expected to costapproximately €90 million in 2010. This measure, however, should be captured in the term Mt+1rather than Jt+1.28 The standard rate was increased from 21 per cent to 21.5 per cent and was expected to yield€208 million in 2009. 29 An exception is the VRT component of excise duty. Between 2004 and 2012, the VRT forecastwas adjusted on only one occasion: a downward adjustment of €67 million in 2010.
04 Hannon et al PP_Vol. 47-3 20/09/2016 21:13 Page 411
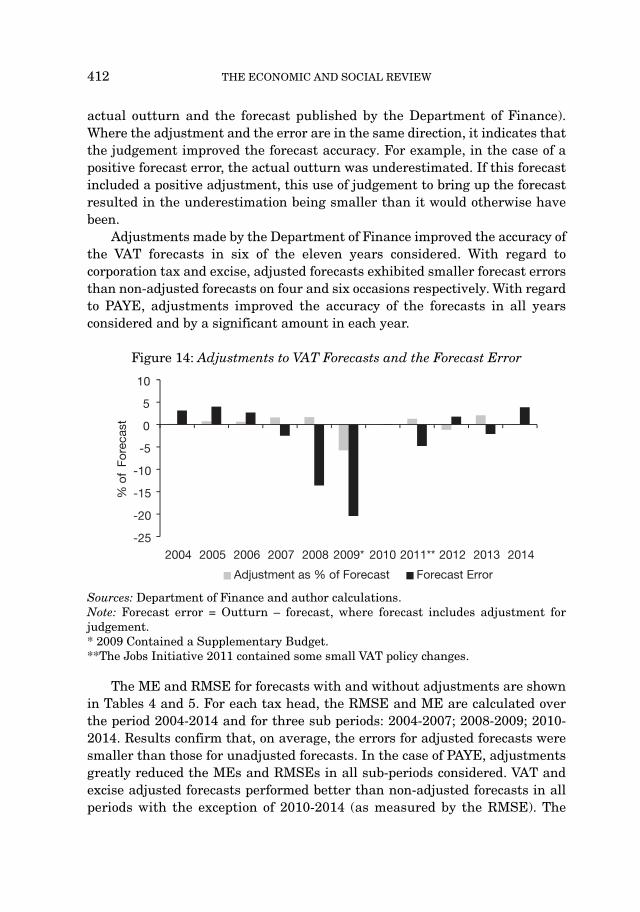
actual outturn and the forecast published by the Department of Finance).Where the adjustment and the error are in the same direction, it indicates thatthe judgement improved the forecast accuracy. For example, in the case of apositive forecast error, the actual outturn was underestimated. If this forecastincluded a positive adjustment, this use of judgement to bring up the forecastresulted in the underestimation being smaller than it would otherwise havebeen.
Adjustments made by the Department of Finance improved the accuracy ofthe VAT forecasts in six of the eleven years considered. With regard tocorporation tax and excise, adjusted forecasts exhibited smaller forecast errorsthan non-adjusted forecasts on four and six occasions respectively. With regardto PAYE, adjustments improved the accuracy of the forecasts in all yearsconsidered and by a significant amount in each year.
Figure 14: Adjustments to VAT Forecasts and the Forecast Error
Sources: Department of Finance and author calculations.Note: Forecast error = Outturn – forecast, where forecast includes adjustment forjudgement. * 2009 Contained a Supplementary Budget.**The Jobs Initiative 2011 contained some small VAT policy changes.
The ME and RMSE for forecasts with and without adjustments are shownin Tables 4 and 5. For each tax head, the RMSE and ME are calculated overthe period 2004-2014 and for three sub periods: 2004-2007; 2008-2009; 2010-2014. Results confirm that, on average, the errors for adjusted forecasts weresmaller than those for unadjusted forecasts. In the case of PAYE, adjustmentsgreatly reduced the MEs and RMSEs in all sub-periods considered. VAT andexcise adjusted forecasts performed better than non-adjusted forecasts in allperiods with the exception of 2010-2014 (as measured by the RMSE). The
412 THE ECONOMIC AND SOCIAL REVIEW
2004 2005 2006 2007 2008 2009* 2010 2011** 2012 2013 2014-25
-20
-15
-10
-5
0
5
10
Adjustment as % of Forecast Forecast Error
% o
f Fo
reca
st
04 Hannon et al PP_Vol. 47-3 20/09/2016 21:13 Page 412

adjustments to corporation tax reduced the ME and RMSE in the 2004-2007period only.
Figure 15: Adjustments to PAYE Forecasts and the Forecast Error
Sources: Department of Finance and author calculations.Note: Forecast error = outturn – forecast, where forecast includes adjustment forjudgement. *2009 contained a Supplementary Budget.
Figure 16: Adjustments to Corporation Tax Forecasts and the Forecast Error
Sources: Department of Finance and author calculations.Note: Forecast error = outturn – forecast, where forecast includes adjustment forjudgement. *2009 contained a Supplementary Budget.
AN ANALYSIS OF TAX FORECASTING ERRORS IN IRELAND 413
2004 2005 2006 2007 2008 2009* 2010 2011 2012 2013 2014-20
-15
-10
-5
0
5
10
15
Adjustment as % of Forecast Forecast Error
% o
f Fo
reca
st
2004 2005 2006 2007 2008 2009* 2010 2011 2012 2013 2014
-40
-30
-20
-10
0
10
20
30
Adjustment as % of Forecast Forecast Error
% o
f Fo
reca
st
04 Hannon et al PP_Vol. 47-3 20/09/2016 21:13 Page 413

Figure 17: Adjustments to Excise Forecasts and the Forecast Error
Sources: Department of Finance and author calculations.Note: Forecast error = outturn – forecast, where forecast includes adjustment forjudgement. *2009 contained a Supplementary Budget.
As can be seen in Tables 4 and 5, the application of judgement to theoutcome of the forecasting equation to form the final tax forecasts has improved the forecasts in most cases. The fact that the adjustments have mostlyhad the effect of reducing RMSEs across tax heads suggests that they reflectan attempt to improve the accuracy of the forecasts, rather than an attempt tounjustifiably move the forecasts to what is considered a “better” outcome basedon bias.
Table 4: Mean Error for Unadjusted30 and Adjusted Forecasts
2004-2014 2004-2007 2008-2009 2010-2014Mean Error Unadd Adjusted Unadd Adjusted Unadd Adjusted Unadd Adjusted
VAT –4 –4 2.5 1.7 –23.4 –20.7 0.2 –0.3Corporation Tax –4.2 –6.5 3.7 0.1 –35.2 –42.4 2.5 4.4Excise –4.8 –3.2 –0.9 0.5 –19.3 –16 0 0.9PAYE 4.9 –1.5 12.1 1.2 –10.8 –10.3 5.7 0.9
414 THE ECONOMIC AND SOCIAL REVIEW
2004 2005 2006 2007 2008 2009* 2010 2011 2012 2013 2014
-20
-15
-10
-5
0
5
10
Adjustment as % of Forecast Forecast Error
% o
f Fo
reca
st
30 We refer to unadjusted forecasts as forecasts that do not include the judgement term Jt+1. Theadjusted forecast is that which includes the judgement term and was published in the annualBudget.
04 Hannon et al PP_Vol. 47-3 20/09/2016 21:13 Page 414

Table 5: RMSE for Unadjusted and Adjusted Forecasts
2004-2014 2004-2007 2008-2009 2010-2014RMSE Unadd Adjusted Unadd Adjusted Unadd Adjusted Unadd Adjusted
VAT 11.5 9.9 3.2 3.1 25.3 21.3 2.4 3.1Corporation Tax 18.9 21.5 8.7 5.8 36.1 43.6 11.6 11.9Excise 9.4 8 3.2 2.7 20.5 17.1 1.2 2.5PAYE 10.6 6.3 12.2 1.9 13.7 13.5 6 2.2
VI: CONCLUSIONS
From the analysis conducted in this paper, we conclude that Department ofFinance’s forecasting errors are relatively large by international standards.With regard to bias, while judgement is routinely applied to the outcome of thetax forecasting equations, the adjustments usually improved the accuracy ofthe forecast and we find no evidence that this judgement is exercised in asystematic way with a view to biasing the forecasts in a particular direction.
It has generally been the case that the largest tax categories have made thegreatest contributions to forecasting errors over the 1997-2014 period. As thisincorporated the recent economic crisis, however, there were unusually largeerrors observed in certain years, leading to significant contributions from someof the smaller tax heads to the forecast errors for overall tax revenue. Adecomposition of the overall errors into errors arising from macro driver errors,starting point errors and “other” sources, reveals an important contributionfrom errors associated with the macro driver for the tax head in question. Thisis partly in line with the finding on the role of macroeconomic forecast errors inIMF (2005) for an earlier time period. However, we also find that the “other”category routinely accounts for a very significant portion of the errors. Thisresidual category by definition is a “catch-all” and includes errors arising fromestimates of the static impact of policy changes, of one-off items, of elasticitiesand an element of judgement applied by the Department of Finance.
The dominant role played by this “other” source of forecasting errorsuggests that the relatively weak forecasting record for Ireland is not simplyan inevitable consequence of the macroeconomic uncertainty associated with asmall open economy and that careful review of the forecasting process may yieldimprovement. The smaller errors noted in Section 3.2 post-2009 are consistentwith a positive impact from the implementation of some of the recommenda -tions of the TFMRG (2008) report, underpinning the potential value of engagingagain in this type of exercise, where the choice of macro drivers and elasticityassumptions were reviewed. The report also recommended incorporating
AN ANALYSIS OF TAX FORECASTING ERRORS IN IRELAND 415
04 Hannon et al PP_Vol. 47-3 20/09/2016 21:13 Page 415

additional information sources in the forecasting process. The difficult fiscalperiod experienced in Ireland and other countries recently has spurred newresearch on identifying windfall revenues, for example, that could provideguidance on how to augment current procedures for forecasting and monitoringtax revenues. (In addition to Addison-Smyth and McQuinn (2010) referred toearlier, see, for example, Morris et al. (2009) for a multi-country analysis).
It appears, however, that no formal review of the tax forecastingmethodology has been undertaken since the 2008 TFMRG study. While internalreviews may occur periodically within the Department of Finance, theadditional benefits of a more formal and public review, with inputs from abroader group of experts and users, would suggest another review is overdue.Indeed, a more regular analysis of the tax forecasting performance was a keyrecommendation of the 2008 review. In addition, the periodic publication ofmore detailed information, such as on the role of judgement, on how the staticimpact of tax changes are calculated, on the impact of one-off factors and theevolution of elasticities over time, for example, would facilitate greaterunderstanding of the forecasts generally and allow for more detailedinvestigations by outside analysts. It is noteworthy that much of the data usedto conduct the decompositions in this paper were not publicly available. Agreater level of transparency would likely bolster confidence in the officialforecasts, as it would enable more rigorous independent and regular assessmentof the size and source of forecast errors, and whether the forecasts suffer frombias.
BIBLIOGRAPHY
Addison-Smyth, D. and K. McQuinn, 2010. “Quantifying Revenue Windfalls from theIrish Housing Market”, Economic and Social Review, Vol. 41, No.2, Summer, pp. 201-223.
Afonso, A. and R. Carvalho, 2013. Revenue Forecast Errors in the European Union.Department of Economics, ISEG-UL, Working Paper No. 02/2014/DE/UECE.Available at SSRN: http://ssrn.com/abstract=2358610 or http://dx.doi.org/10.2139/ssrn.2358610.
Buettner, T. and B. Kauder, 2010. “Revenue Forecasting Practices: Differences acrossCountries and Consequences for Forecasting Performance”, Fiscal Studies, Vol. 31,No. 3, pp. 313-240.
Department of Finance, 2010. “Tax Policy, Vehicle Registration Tax (VRT)”. Availablefrom: http://taxpolicy.gov.ie/wp-content/uploads/2011/06/10.17b-Vehicle-Regristration-Tax-VRT.pdf.
European Commission, 2012. European Economic Forecast Autumn 2012. Availablefrom: http://ec.europa.eu/economy_finance/publications/european_economy/2012/pdf/ee-2012-7_en.pdf.
416 THE ECONOMIC AND SOCIAL REVIEW
04 Hannon et al PP_Vol. 47-3 20/09/2016 21:13 Page 416

European Commission, 2013. Taxation Trends in the European Union. Available from:http://ec.europa.eu/taxation_customs/taxation/gen_info/economic_analysis/tax_structures/index_en.htm.
Frankel, J. A. and J. Schreger, 2012. Over-optimistic Official Forecasts in the Eurozoneand Fiscal Rules, NBER W18283.
International Monetary Fund, 2005. IMF Country Report No. 05/370, Available from:http://www.imf.org/external/pubs/ft/scr/2005/cr05370.pdf.
Irish Fiscal Advisory Council, 2013. Fiscal Assessment Report, April 2013. Available from:http://www.fiscalcouncil.ie/wp-content/uploads/2013/04/FARApr13.pdf.
Irish Fiscal Advisory Council, 2014. Fiscal Assessment Report, June 2014. Available fromhttp://www.fiscalcouncil.ie/new-home-page/fiscal-assessment-report-june-2014-2.
Morris, R., F. De Castro Fernandez, S. Jonk, J. Kremer, S. Linehan, R. M. Marion, C. Schalck and O. Tkavevs, 2009. “Explaining Government Revenue Windfalls andShortfalls: An Analysis for Selected EU Countries”, Working Paper Series, No 1114,European Central Bank.
Tax Forecasting Methodology Review Group, 2008. Report of the Tax ForecastingMethodology Review Group. Available from: http://s3.amazonaws.com/zanran_storage/www.finance.gov.ie/ContentPages/8987749.pdf.
AN ANALYSIS OF TAX FORECASTING ERRORS IN IRELAND 417
04 Hannon et al PP_Vol. 47-3 20/09/2016 21:13 Page 417

APPENDIX A
Summary of the Tax Forecasting Methodology Review Group recommendations
Table A1: TFMRG Recommendations
Recommendation Implemented?
Maintain aggregate tax-to-GDP elasticity of 1.0 Yesas a “top-down” check on the “bottom-up” forecasting approach.
Complement VAT forecasting with approach No published evidence (butwhich projects VAT receipts from new housing reportedly used internally byseparately. the Department to inform
judgement)
Forecast corporation tax using Gross Operating YesSurplus in conjunction with nominal GDP.
Continue using new housing output and prices to Yesproject stamp duty from residential property while using investment in building and construction for stamp duty from non-residential property.
Continue the cautious approach to forecasting Yesproperty related tax revenue.
Investigate the possibility of providing a more No published evidencedetailed breakdown of VAT.
Undertake more regular analysis of the tax No major subsequent reviewforecasting performance. published.
Source: TFMRG (2008).
418 THE ECONOMIC AND SOCIAL REVIEW
04 Hannon et al PP_Vol. 47-3 20/09/2016 21:13 Page 418

APPENDIX B
The following equation can be used to summarise the VAT forecastingprocess:
VATt+1 = (VATt – Tt)((1 + (dPCNt+1)E) + Tt+1 + Mt+1 + Jt+1
where VATt+1 is the forecast for VAT in the coming year, VATt is an estimate ofthe yield in the current year, Tt are one-off items affecting the yield in thecurrent year and dPCNt+1 is the projected growth rate in nominal personalconsumption expenditure adjusted for tourism spending for the coming year, Eis the elasticity between VAT revenue and the tax base, assumed to be 1, Tt+1are one-off items affecting the yield in the coming year, Mt+1 is the estimatedstatic yield from any changes in policy and Jt+1 is a judgement factor appliedby the Department of Finance.
The procedure for forecasting corporation tax can be summarised using thefollowing equation:
Cort+1 = (Cort – Tt)((1 + (dGDPt+1)E) + Tt+1 + Mt+1 + Jt+1
where Cort+1 is the forecast for corporation tax in the coming year, Cort is anestimate of the yield in the current year and dGDPt+1 is the projected growthrate in nominal GDP for the coming year. Nominal GDP was used as the macrodriver until 2008. From 2009 onwards, gross operating surplus was used. Tt, E,Tt+1, Mt+1, and Jt+1 are defined above.
The forecasting procedure for excise involves two strands, the first of whichis to estimate excise that is collected from Vehicle Registration Tax (VRT). Thesecond strand forecasts excise that is collected from all other sources.31 Theprocedure can be summarised using the following equations:
VRTt+1 = VRTt((1 + dPNCt+1)(1 + dVNCt+1)) + Tt+1 + Mt+1 + Jt+1
VRTt+1 is the forecast for Vehicle Registration Tax in the coming year, VRTt isan estimate of the VRT yield in current year, dPNCt+1 is the projected increasein the price of new cars while dVNCt+1 is the projected increase in the volumeof new car sales. All other variables are defined above. The second equation canbe summarised as follows:
AN ANALYSIS OF TAX FORECASTING ERRORS IN IRELAND 419
31 There are three main categories of excisable products: mineral oils; alcohol and alcoholicbeverages; and manufactured tobacco. Excise duties are also chargeable on certain premises andactivities (e.g. on betting and licenses for retailing of liquor). In Ireland, carbon tax, VRT and airtravel tax are also collected as part of excise duty. The rates that apply to each excisable item canbe found at http://www.revenue.ie/en/tax/excise/duties/excise-duty-rates.html.
04 Hannon et al PP_Vol. 47-3 20/09/2016 21:13 Page 419
Exct+1 = (Exct – Tt)((1 + (dPCAt+1)E) + Tt+1 + Mt+1 + Jt+1
Exct+1 is the forecast for excise excluding VRT in the coming year, Exct is anestimate of the excise excluding VRT yield in current year, and dPCAt+1 is theprojected growth rate in nominal personal consumption adjusted for tourismand excluding cars.
PAYE accounted for approximately 73 per cent of total income tax revenuein 2012. The PAYE forecasting process can be summarised as follows:
PAYEt+1 = (PAYEt – T)t((1 + (dYt+1)EYt+1)(1 + (dMt+1)E
Mt+1)) + Tt+1 + Mt+1 + Jt+1
where PAYEt+1 is the forecast for PAYE in the coming year and PAYEt is anestimate of the yield in the current year. dYt+1, the projected growth in non-agricultural wages, is multiplied by an earnings elasticity EY
t+1and dMt+1, theprojected growth in non-agricultural employment, is multiplied by anemployment elasticity EM
t+1. All other variables are defined above.
420 THE ECONOMIC AND SOCIAL REVIEW
04 Hannon et al PP_Vol. 47-3 20/09/2016 21:13 Page 420

APPENDIX C
Figure C1: Excise excluding VRT
Figure C2: VRT
AN ANALYSIS OF TAX FORECASTING ERRORS IN IRELAND 421
2004 2005 2006 2007 2008 2009* 2010 2011 2012 2013 2014
-800
-600
-400
-200
0
200
400
Macro Error Starting Point Error Other Error
€ m
illio
n
2004 2005 2006 2007 2008 2009* 2010 2011 2012 2013
-800
-600
-400
-200
0
200
400
Macro Error Starting Point Error Other Error
€ m
illio
n
04 Hannon et al PP_Vol. 47-3 20/09/2016 21:13 Page 421

APPENDIX D
Figure D1: Adjustment to VAT Forecasts
Note: The size of the adjustment is shown on the left axis whereas the adjustment as apercentage of the outturn is shown on the right axis.
Figure D2: Adjustment to PAYE
422 THE ECONOMIC AND SOCIAL REVIEW
2004 2005 2006 2007 2008 2009*2010 2011** 2012 2013 2014-1000
-800
-600
-400
-200
0
200
400
-10
-8
-6
-4
-2
0
2
4
Adjustment Adjustment as % of Outturn (rhs)
Ad
just
men
t (€
mill
ion)
% o
f O
uttu
rn
2004
2005
2006
2007
2008
2009
*20
1020
1120
1220
1320
14-200
0
200
400
600
800
1,000
1,200
-2
0
2
4
6
8
10
12
14
Adjustment Adjustment as % of Outturn (rhs)
Ad
just
men
t (€
mill
ion)
% o
f O
uttu
rn
04 Hannon et al PP_Vol. 47-3 20/09/2016 21:13 Page 422
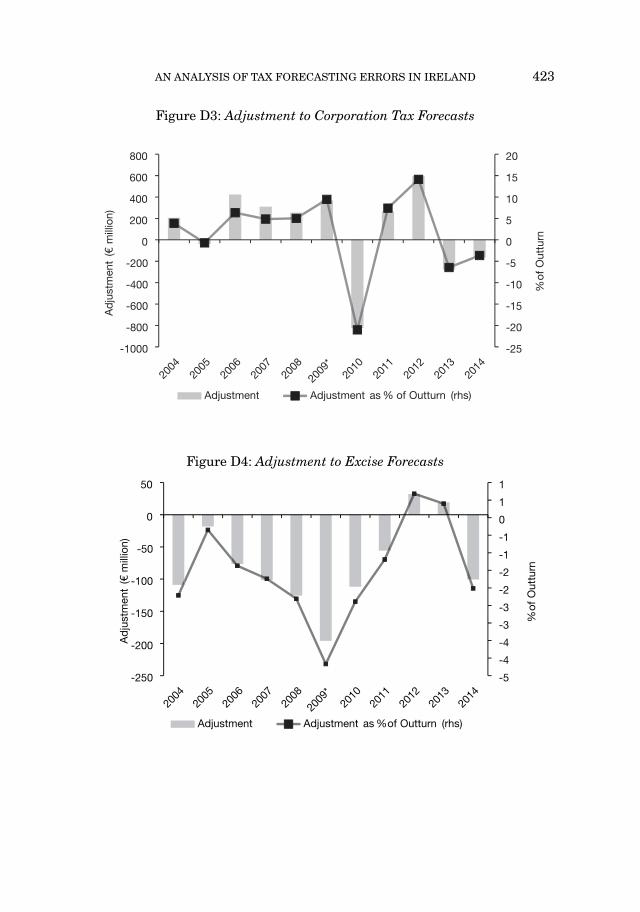
Figure D3: Adjustment to Corporation Tax Forecasts
Figure D4: Adjustment to Excise Forecasts
AN ANALYSIS OF TAX FORECASTING ERRORS IN IRELAND 423
2004
2005
2006
2007
2008
2009
*20
1020
1120
1220
1320
14-1000
-800
-600
-400
-200
0
200
400
600
800
-25
-20
-15
-10
-5
0
5
10
15
20
Adjustment Adjustment as % of Outturn (rhs)
Ad
just
men
t (€
mill
ion)
% o
f O
uttu
rn
2004
2005
2006
2007
2008
2009
*20
1020
1120
1220
1320
14-250
-200
-150
-100
-50
0
50
-5
-4
-4
-3
-3
-2
-2
-1
-1
0
1
1
Adjustment Adjustment as % of Outturn (rhs)
Ad
just
men
t (€
mill
ion)
% o
f O
uttu
rn
04 Hannon et al PP_Vol. 47-3 20/09/2016 21:13 Page 423

04 Hannon et al PP_Vol. 47-3 20/09/2016 21:13 Page 424