policy making and academic cooperation for sustainable...
TRANSCRIPT

Catherine L. Kling
Professor of Economic
Director, Center for Agricultural and Rural Development
Iowa State University
Policy Making and Academic Cooperation for Sustainable Development

Role for Academics
• Issues in sustainability classic example of need for government policy
• Independent science assessment
– “Honest brokers” in contentious public debates

Role for Academics
• Economists can provide information
– Core data, information on alternatives
– Modeling, scenario analysis
– Benefit cost anaylsis

Example: Benefit Cost-Aanalysis
Water Quality Improvement • Four year data on Iowans usage of Iowa lakes
– Surveyed 8000 Iowans, random population sample
– Use, knowledge, and perceptions regarding lake quality
• water quality at 130 primary lakes in Iowa
• Economic value = how much are people willing to give up to get more water quality
• Use observed patterns in lake usage to infer WTP for water quality

Stated Preference Question: Would you be willing to pay $25/year in property taxes to support a project to improve the conditions of Storm Lake to those described below?
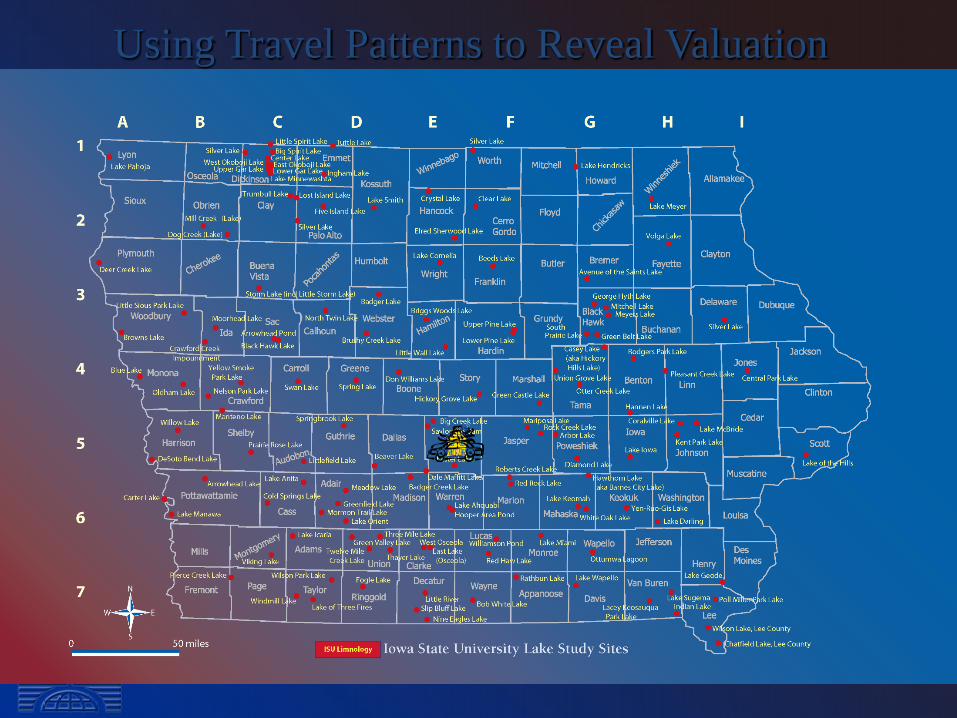
Using Travel Patterns to Reveal Valuation

Top 10 Lake Usage
Lake_Name 2002 2003 2004 2005 Average
Saylorville 607,186 695,917 567,669 642,079 628,213
Coralville 401,716 528,547 408,423 485,895 456,145
West Okoboji 348,149 474,738 479,125 437,648 434,915
Big Creek 382,165 495,476 396,514 379,190 413,336
Clear 347,466 453,621 426,007 401,653 407,187
East Okoboji 267,737 383,770 363,797 338,222 338,382
Red Rock 309,965 340,080 345,740 354,317 337,526
Spirit Lake 182,173 344,252 321,300 300,886 287,153
Macbride 266,744 153,073 310,843 340,093 267,688
Rathbun 192,700 279,335 269,325 250,380 247,935

Single Lake Rankings
Sorted by Total Net Benefits ($million) Ranking Lake Net Benefits Benefits Costs
1 Big Creek 733.74 755.76 22.03
2 Brushy Creek 490.70 517.20 26.50
3 Hickory Grove 275.94 277.80 1.86
4 Lake McBride 218.18 226.21 8.03
5 Clear Lake 185.32 202.93 17.61
6 Lake Geode 161.34 166.11 4.77
7 Three Mile 153.36 163.67 10.32
8 Easter 102.33 113.48 11.15
9 Lake Ahquabi 86.91 88.55 1.64
10 Little Wall 76.78 81.85 5.07
11 Lake Anita 68.81 69.67 0.86
12 Kent Park 61.28 61.99 0.71
13 Springbrook 60.69 61.79 1.10
14 Red Haw 54.65 55.10 0.45
15 Don Williams 54.12 66.14 12.02

Iowa Department of Natural Resources
• Used this information as one component of ranking of lakes for project funding of water quality investments
• other components: engagement of watershed groups, geographic distribution and others
• Continuing work: keep tracking usage, values, and use data to value investments