polic effects of physician payment reform on … · increase in the use of peritoneal dialysis....
TRANSCRIPT

VOL. 22, NO. 6 n THE AMERICAN JOURNAL OF MANAGED CARE n e215
POLICY
© Managed Care &Healthcare Communications, LLC
P ay-for-performance (P4P) initiatives tying payment to performance and the value of care have become a major component of recent healthcare reform ef-
forts. Since the passage of the Affordable Care Act and, more recently, the repeal of Medicare’s Sustainable Growth Rate, P4P programs are increasingly targeting physician practices directly.1,2 Lessons from prior P4P initiatives can help inform the development of future policies that will ap-ply to both managed care and fee-for-service settings.
More than 100,000 individuals develop end-stage renal dis-ease (ESRD) every year in the United States.3 Due to a short-age of kidneys available for transplantation, the vast majority receive dialysis, which can be provided through 1 of 3 mo-dalities. In-center hemodialysis is the most common dialysis modality and involves patients going to a dialysis facility 3 or 4 times per week to receive therapy; home-based dialysis therapies (which include peritoneal dialysis and home hemo-dialysis) are alternatives that offer more flexibility and lifestyle benefits for some patients.4-8 Ideally, dialysis modality is cho-sen after careful consideration of medical suitability, followed by shared decision making among patients, loved ones, and care providers.9 Evidence suggests that these discussions occur infrequently,10 leading many to conclude that home dialysis therapies are underutilized in the United States.11,12
It is uncertain whether physicians’ economic incentives influence dialysis modality choice. International compari-sons indicate that the relative physician payment for pa-tients on home versus in-center dialysis directly influences the fraction of patients on home dialysis.13 In the United States, higher Medicare payment to dialysis facilities for home therapies associated with the 2011 ESRD Prospective Payment System (“bundling”) coincided with a substantial increase in the use of peritoneal dialysis.3,14 However, surveys of nephrologists suggest that patient preferences and health, rather than economic factors, are the primary factors consid-ered when recommending a dialysis modality.11,15
Effects of Physician Payment Reform on Provision of Home Dialysis
Kevin F. Erickson, MD, MS; Wolfgang C. Winkelmayer, MD, ScD; Glenn M. Chertow, MD, MPH; and Jay
Bhattacharya, MD, PhD
ABSTRACT
Objectives: Patients with end-stage renal disease can receive dialysis at home or in-center. In 2004, CMS reformed physician payment for in-center hemodialysis care from a capitated to a tiered fee-for-service model, augmenting physician payment for frequent in-center visits. We evaluated whether payment reform influenced dialysis modality assignment.
Study Design: Cohort study of patients starting dialysis in the United States in the 3 years before and the 3 years after payment reform.
Methods: We conducted difference-in-difference analyses comparing patients with traditional Medicare coverage (who were affected by the policy) to others with Medicare Advantage (who were unaffected by the policy). We also examined whether the policy had a more pronounced influence on dialysis modality assignment in areas with lower costs of traveling to dialysis facilities.
Results: Patients with traditional Medicare coverage experienced a 0.7% (95% CI, 0.2%-1.1%; P = .003) reduction in the absolute probability of home dialysis use following payment reform com-pared with patients with Medicare Advantage. Patients living in areas with larger dialysis facilities (where payment reform made in-center hemodialysis comparatively more lucrative for physi-cians) experienced a 0.9% (95% CI, 0.5%-1.4%; P <.001) reduction in home dialysis use following payment reform compared with patients living in areas with smaller facilities (where payment reform made in-center hemodialysis comparatively less lucrative for physicians).
Conclusions: The transition from a capitated to a tiered fee-for-service payment model for in-center hemodialysis care resulted in fewer patients receiving home dialysis. This area of policy failure highlights the importance of considering unintended con-sequences of future physician payment reform efforts.
Am J Manag Care. 2016;22(6):e215-e223

e216 n www.ajmc.com n JUNE 2016
POLICY
In 2004, in an effort to align economic incentives and encourage high-quality care, CMS transformed its pay-ment to physicians caring for patients receiving in-center hemodialysis from a capitated model to a tiered fee-for-service model (eAppendix Table 1 [eAppendices are avail-able at www.ajmc.com]).16 Under the new payment system, which continues to govern physician in-center hemodial-ysis reimbursement, physicians could increase profession-al fee revenues by conducting 4 or more visits per month to patients receiving in-center hemodialysis.
Although this policy was not focused on the deliv-ery of home dialysis care, it may have influenced dialy-sis modality decisions by making in-center hemodialysis comparatively more lucrative for some physicians; physi-cian payment for home dialysis therapy remained capi-tated and decreased slightly.16 In this study, we determined whether the transition to a tiered fee-for-service payment model influenced dialysis modality choices. We hypoth-esized that patients were less likely to receive home di-alysis following payment reform, and that this decrease was more pronounced in places where physicians could increase in-center hemodialysis revenues at lower cost.
METHODSData and Patient Selection
We selected patients who started dialysis in the United States from January 1, 2001, through December 31, 2006—the 3 years prior to and the 3 years following physician payment reform. We excluded patients who received a kidney transplant within 60 days of ESRD onset. We obtained data on patients’ insurance coverage, home zip codes, and initial dialysis modality, as well as informa-tion about dialysis facilities from the United States Renal Data System, a national registry of patients with treated ESRD. We obtained data on patient comorbidities prior to ESRD from the CMS Medical Evidence Report (CMS-2728).17 Due to large numbers of missing values for Qué-telet’s (body mass) index, hemoglobin, and albumin, we used multiple imputations to estimate missing values.18-20
Information on population density came from Census-based rural-urban commuting area codes.21 Information on hospital refer-ral region (HRR) came from the Dartmouth Atlas of Health Care.22
Outcomes and Study DesignThe primary study outcome was the ini-
tial dialysis modality chosen, as reported by the nephrologist to CMS. We categorized
dialysis modality as in-center hemodialysis or home dialy-sis, where home dialysis included home hemodialysis or peritoneal dialysis.
We used several difference-in-difference (DID) models to examine the effect of payment reform on dialysis modality. DID analysis is an econometric method commonly used to analyze policy,23 where patients are separated into treat-ment and control groups. The treatment group includes patients who were affected by the policy of interest and the control group includes patients who were not subject to the policy. Thus, any changes observed in the control group re-flect changes in the population from measures not changed by the policy. The difference in the change of the outcome after implementation of the policy between the treatment and control groups characterizes the policy’s effect.
Comparison GroupsWe formed comparison groups from 2 separate cohorts.
In an Insurance Coverage cohort, we selected patients en-rolled in either traditional Medicare as a primary payer or Medicare Advantage prior to start of dialysis. In this analy-sis, we only included patients 65 years or older at ESRD on-set because patients are not permitted to enroll in Medicare Advantage if ESRD (rather than age) is their qualifying cri-terion; thus, most patients with ESRD with Medicare Ad-vantage are 65 years or older. We conducted a DID analysis comparing the choice of dialysis modality among patients with traditional Medicare versus Medicare Advantage. We chose these groups because payment for services provided to patients with traditional Medicare was affected by pay-ment reform, while payment for services provided to pa-tients with Medicare Advantage was not.
In a “non–health maintenance organization (non-HMO) Medicare” cohort, we selected patients with tra-ditional Medicare as a primary payer, or waiting for Medicare coverage, at the onset of dialysis. Because the majority of patients in the United States who develop ESRD qualify for Medicare within 90 days of ESRD on-set, we assumed that patients documented as “waiting” for Medicare would soon receive it and that physicians
Take-Away PointsIn 2004, CMS reformed physician payment for in-center hemodialysis care from a capitated to a tiered fee-for-service model, augmenting physician payment for fre-quent in-center visits. This policy may have influenced home dialysis use by making in-center dialysis more lucrative for some physicians. We compared home dialysis use among patients differentially affected by the policy.
n Patients most affected by the policy experienced nearly a 1% reduction in the absolute probability of home dialysis use following payment reform.
n Our findings indicate that transition to fee-for-service payment for in-center he-modialysis had the unintended consequence of reducing home dialysis use.

VOL. 22, NO. 6 n THE AMERICAN JOURNAL OF MANAGED CARE n e217
Physician Payment and Home Dialysis Use
would consider the financial implications of treating these patients as similar to treating patients already covered. In this cohort, we excluded patients with private insurance because they do not qualify for Medicare until 30 months have passed following the diagnosis of ESRD.
We previously demonstrated that the frequency of phy-sician (or advanced practice provider) visits to patients re-ceiving in-center hemodialysis was predominantly related to geographic and dialysis facility factors, rather than to patient clinical characteristics.24 Geographic measures—such as dialysis facility size and population density—that determine the costs physicians incur (in resources and time) traveling to visit patients at dialysis facilities have a substantial influence on visit frequency. All else being equal, it is more lucrative for physicians to see patients in larger dialysis facilities because physicians can collect revenue for more patient visits after incurring a fixed cost of traveling to a facility. Likewise, it is more lucrative for physicians to see patients in more densely populated areas due to lower travel costs to facilities.
Using the non-HMO Medicare cohort, we conducted 2 DID analyses to determine whether changes in the choice of dialysis modality following payment reform varied geo-graphically, depending on how costly it was for physicians to see patients more frequently. Although the small decrease in physician payment for home dialysis was similar across all geographic regions, the change in physician payment for in-center hemodialysis after 2004 varied geographically. Phy-sicians practicing in areas where the cost of more frequent visits was lower had an opportunity to increase their profes-sional fee revenues after payment reform by assigning more patients to in-center hemodialysis. In contrast, physicians practicing in areas where it was too costly to visit patients 4 times per month would have experienced little or no in-crease in professional fee revenues by assigning patients to in-center hemodialysis. We used the 2 geographic character-istics previously found to be associated with visit frequency and, therefore, the relative gain in professional fee revenue from in-center hemodialysis—dialysis facility size and popu-lation density—to determine if changes in physician pay-ment influenced dialysis modality choice.
We averaged dialysis facility size across the HRRs where patients lived. We calculated dialysis facility size from the average number of patients receiving in-center hemodialysis documented in annual facility surveys in the 3 years prior to payment reform. We divided HRRs into quintiles based on their average facility size and assessed the proportion of prevalent in-center patients seen 4 or more times per month, as well as associated changes in revenues, in the 3 years fol-lowing payment reform within each quintile. We observed
that the proportion of patients with 4 or more visits per month was smallest in the lowest mean facility size quintile. Consequently, we categorized HRRs in the lowest quintile of mean facility size as areas with “smaller facilities.”
We dichotomized population density into “small town/rural” and “non–small town/non-rural.” The differences in visit frequency across population density category were small relative to differences across dialysis facility size (eAppendix Table 2).
Statistical Methods Due to large population size, we used a 10% standardized
mean difference as a marker of heterogeneity when compar-ing differences in characteristics among treatment groups.25 In all DID analyses, we used logistic regression to estimate odds ratios and corresponding 95% CIs. We controlled for regional differences in population density and dialysis facility size, as well as in patient age, sex, race, ethnicity, and medical comorbidities (Table 1).26 We did not adjust for dialysis facility characteristics because the facility where a patient receives dialysis is often a consequence of dialysis modality choice. An interaction term between binary vari-ables representing the start of dialysis before versus after payment reform, and whether patients were in the treat-ment or control group, estimated the effect of the policy on the odds of dialysis modality choice for each comparison.
We used our logistic regression estimates to determine the effect of physician reimbursement reform on the abso-lute probability of home dialysis use. For each patient in the relevant cohort, we calculated 4 predicted probabilities of home dialysis use assuming they were in each compari-son group both before and after the policy. We used these predicted probabilities to calculate a DID estimate of the policy effect for each patient (see eAppendix). We averaged the individual policy effect estimates over all patients, and used the delta method to calculate standard errors and 95% CIs around average predicted probability estimates.
In a secondary analysis, we explored how different pa-tients were affected by the policy. We separated selected categories of patients by dialysis facility size comparison group. For each patient category, we determined the un-adjusted change in the proportion of patients assigned to home dialysis following payment reform stratified by di-alysis facility size.
RESULTSThe cohort of patients with traditional Medicare and
Medicare Advantage (Insurance Coverage cohort) included 241,111 patients. Before payment reform, 18,754 (16.5%) and

e218 n www.ajmc.com n JUNE 2016
POLICY
94,615 (83.5%) of patients had Medicare Advantage and traditional Medicare, respectively, compared with 22,473 (17.6%) and 105,269 (82.4%) after the reform. Among patients with traditional Medicare, 5.8% and 5.0% of patients were as-signed to home dialysis before and after payment reform, re-spectively. Corresponding figures for patients with Medicare Advantage were 4.5% and 4.3%. Patient characteristics were similar across insurance categories, except more patients with Medicare Advantage were Hispanic and fewer lived in rural areas and small towns (Table 1).
The cohort of patients with traditional Medicare or waiting for Medicare coverage (non-HMO Medicare co-hort) included 389,526 patients. Before payment reform, 19,685 (10.8%) and 163,415 (89.2%) of patients lived in
areas with smaller and larger facilities, respectively, com-pared with 21,840 (10.6%) and 184,586 (89.4%) after the re-form. Among patients living in areas with smaller facility sizes, 6.7% were assigned to home dialysis both prior to and following payment reform. Among patients living in areas with larger facility sizes, 6.5% were assigned to home dialysis prior to payment reform compared with 5.5% fol-lowing payment reform. There were no significant differ-ences in comorbidities among patients receiving dialysis in areas with different facility sizes, whereas more whites and American Indians lived in areas with smaller facilities and more blacks and Hispanics lived in areas with larger facilities. Smaller facilities were more likely to be in rural areas and small towns (Table 2).
n Table 1. Baseline Characteristics of “Insurance Coverage” Cohortsa
Pre-Reimbursement Reform Postreimbursement Reform
Medicare Advantage(n = 18,754)
Traditional Medicare
(n = 94,615) Std Diff
Medicare Advantage(n = 22,473)
Traditional Medicare
(n = 105,269) Std Diff
Demographic
Age, years: mean 75.2 75.2 0.4 75.6 75.5 1.1
Male, % 53.4 50.4 6.0 54.3 52.4 3.9
American Indian, % 0.3 0.9 7.4 0.3 0.8 7.2
Black, % 20.8 22.4 3.7 22.4 21.2 2.8
White, % 73.7 73.8 0.3 72.3 74.8 5.6
Other race, % 5.2 3.0 11.4 5.0 3.1 9.8
Hispanic ethnicity, % 12.3 7.5 16.5 12.7 7.9 16.1
Comorbidities
Diabetes, % 49.3 50.9 3.2 52.6 51.8 1.6
Coronary artery disease, % 34.6 38.0 6.9 31.1 34.8 7.9
Cancer, % 8.0 8.8 2.9 9.0 10.1 3.7
Heart failure, % 37.0 40.6 7.3 39.8 42.0 4.5
Pulmonary disease, % 9.0 11.0 6.7 10.1 12.4 7.3
Cerebrovascular disease, % 11.2 12.5 4.2 11.5 12.4 2.8
Peripheral vascular disease, % 15.9 18.7 7.4 16.3 19.0 7.0
Hemoglobin (g/dL)b 10.2 10.1 2.8 10.3 10.3 1.9
Serum albumin (g/dL)b 3.2 3.2 8.0 3.2 3.2 8.6
Body mass index (kg/m2)b 26.2 26.5 4.7 27.1 27.2 0.5
Smoking history, % 2.6 3.2 3.7 2.9 3.6 3.9
Immobility, % 4.1 5.0 4.4 6.5 7.3 3.2
Drug or alcohol use, % 0.6 0.7 1.3 0.6 0.7 0.8
Geographic
Rural or small town, % 2.3 12.3 37.2 3.8 12.3 30.8
Area with larger facilities, % 93.5 88.5 20.9 92.3 88.6 14.0
Std Diff indicates standardized mean difference. aA total of 1946 patients were excluded from this analysis because their zip codes could not be linked to hospital referral regions.bAmong patients included in the analysis, hemoglobin, serum albumin, and body mass index were missing in 8.4%, 25%, and 1.1% of the population, respectively. A total of 0.1% of patients had missing values for 1 or more of age, sex, drug or alcohol abuse, or population density. All missing values were imputed.

VOL. 22, NO. 6 n THE AMERICAN JOURNAL OF MANAGED CARE n e219
Physician Payment and Home Dialysis Use
Applying a DID regression model, patients with tra-ditional Medicare coverage (who were affected by the policy) experienced a 12% (95% CI, 2%-21%) reduction in the odds of home dialysis following payment reform compared with patients with Medicare Advantage (who were not affected by the policy) (eAppendix Table 3). This corresponds to a 0.7% (95% CI, 0.2%-1.1%; P = .003) reduc-tion in the average absolute probability of home dialysis use following payment reform among patients with tra-ditional Medicare compared with patients with Medicare Advantage (Table 3).
Patients living in areas with larger dialysis facilities (where physicians could increase revenues from in-center dialysis at lower cost) experienced a 16% reduction in the
odds of provision of home dialysis (95% CI, 8%-22%) com-pared with patients living in areas with smaller facilities (where it was less lucrative to visit patients receiving in-cen-ter dialysis) (eAppendix Table 4). This corresponds to a 0.9% (95% CI 0.5%-1.4%; P <.001) reduction in the average abso-lute probability of home dialysis use following payment reform among patients living in areas with larger facilities compared with patients living in areas with smaller facili-ties (Table 3). Figure 1 illustrates the unadjusted change in modality choice among patients residing in areas with dif-ferent dialysis facility sizes. There was no significant effect of the policy in our analysis of population density.
Nearly all patient groups living in areas with larger fa-cilities were less likely to receive home dialysis following
n Table 2. Baseline Characteristics of Dialysis Facility Size Comparison in the “Non-HMO Medicare” Cohorta
Pre-Reimbursement Reform Postreimbursement Reform
Larger Facility(n = 163,415)
Small Facility(n = 19,685) Std Diff
Larger Facility(n = 184,586)
Small Facility(n = 21,840) Std Diff
Demographic
Age, years: mean 62.8 64.0 7.4 63.0 64.1 7.4
Male, % 53.4 54.2 1.7 55.1 55.0 0.1
American Indian, % 1.1 3.1 14.2 1.0 3.1 14.4
Black, % 31.8 19.4 29.7 31.0 18.9 29.3
White, % 63.3 76.1 25.5 64.0 76.5 25.0
Other race, % 3.9 1.4 15.8 4.0 1.5 15.2
Hispanic ethnicity, % 11.5 2.8 34.3 12.1 3.1 35.0
Comorbidities
Diabetes, % 51.9 50.1 3.8 53.1 52.2 1.9
Coronary artery disease, % 27.7 31.5 8.3 25.1 29.2 9.2
Cancer, % 6.0 6.8 3.5 6.8 7.9 4.5
Heart failure, % 32.4 33.7 2.8 33.8 35.3 3.1
Pulmonary disease, % 7.8 9.9 7.2 8.8 11.1 7.7
Cerebrovascular disease, % 9.6 11.0 4.5 9.7 10.9 3.8
Peripheral vascular disease, % 14.3 17.9 9.7 14.6 18.0 9.3
Hemoglobin (g/dL)b 9.9 10.1 9.4 10.1 10.2 9.7
Serum albumin (g/dL)b 3.1 3.1 1.6 3.1 3.2 4.7
Body mass index (kg/m2)b 27.6 27.9 4.3 28.3 28.6 4.0
Smoking history, % 5.1 6.6 6.2 5.9 7.3 5.8
Immobility, % 3.9 3.9 0.3 5.6 5.2 1.5
Drug or alcohol use, % 1.9 1.5 2.8 2.2 1.9 2.2
Geographic
Rural or small town, % 9.7 27.2 43.0 9.8 27.0 42.3
HMO indicates health maintenance organization; Std Diff, standardized mean difference.aA total of 2402 patients were excluded from this analysis because their zip codes could not be linked to hospital referral regions. This cohort differs from the group of patients with traditional Medicare coverage in the Insurance Coverage cohort in 2 ways. First, it includes patients of all ages at onset of dialysis. Second, it includes patients documented as “waiting” for Medicare coverage at the onset of dialysis.bAmong patients included in the analysis, hemoglobin, serum albumin, and body mass index were missing in 8.4%, 25%, and 1.1% of the population, respectively. A total of 0.1% of patients had missing values for 1 or more of age, drug or alcohol abuse, or population density. All missing values were imputed.

e220 n www.ajmc.com n JUNE 2016
POLICY
physician payment reform. Among pa-tients living in areas with smaller facilities, women, whites, patients with hemoglobin >10.5 g/dL, and immobile patients ap-peared more likely to receive home dialy-sis following payment reform (Figure 2).
DISCUSSIONWe found that the 2004 Medicare re-
form to physician in-center hemodialysis visit payments led to a reduction in the use of home dialysis. Patients who were most affected by the policy, either because they were insured by traditional Medi-care or because they lived in areas where physicians could increase in-center he-modialysis revenues at lower cost, expe-rienced nearly a 1% absolute reduction in the probability of receiving home dialysis compared with patients who were unaf-fected (or less affected) by the policy. More specifically, approximately 8 of every 1000 patients initiating dialysis who were af-
n Table 3. Average Probability of Home Dialysis from Regression Modelsa
Insurance Coverage Comparison Groups
Medicare Advantage Traditional Medicare
Probability of Home Dialysis (%) LCI UCI
Probability of Home Dialysis (%) LCI UCI
Prior to reimbursement reform 4.5 4.2 4.8 5.8 5.7 6.0
Following reimbursement reform 4.2 4.0 4.5 4.9 4.8 5.1
Difference following reform –0.2 –0.6 0.1 –0.9 –1.1 –0.7
Policy Effect (%) LCI UCI
Difference-in-difference estimateb 0.7 0.2 1.1
Dialysis Facility Size Comparison Groups
Areas With Small Facilities Areas With Larger Facilities
Probability of Home Dialysis (%) LCI UCI
Probability of Home Dialysis (%) LCI UCI
Prior to reimbursement reform 5.8 5.5 6.2 6.6 6.5 6.7
Following reimbursement reform 5.8 5.5 6.1 5.6 5.5 5.7
Difference following reform –0.1 –0.5 0.3 –1.0 –1.2 –0.8
Policy Effect (%) LCI UCI
Difference-in-difference estimatec 0.9 0.5 1.4
LCI indicates lower bounds of the 95% CI; UCI, upper bounds of the 95% CI. aAn examination of the sensitivity of our findings to possible geographic clustering in dialysis modality choice using generalized estimating equation models was not substantially different from our primary study results (see eAppendix Table 5). bP = .003.cP <.001.
n Figure 1. Dialysis Modality Assignment Over Time in Areas With Small Versus Larger Dialysis Facilitiesa
0
10
20
30
40
0
0.01
–0.01Jan-02 Jan-03Jul-02 Jul-03 Jan-04 Jul-04 Jan-05 Jul-05 Jan-06 Jul-06
0.02
0.03
0.04
0.05
0.06
0.07
0.08
50
60
Never Rarely Sometimes
Difference Small facility Larger facility
Often Never Rarely Sometimes Often
Per
cen
t
Pro
po
rtio
n S
tart
ing
Ho
me
Dia
lysi
s (1
2-m
on
th m
ovi
ng
ave
rag
e)
Year
Responses
Refer to a specialist Prescribe a brand-name drug
aProbabilities are unadjusted. A plot of probabilities adjusted for covariates from our primary regression model is not substantively different. Dashed line represents the reimbursement reform proposed rule; solid line represents the final rule.

VOL. 22, NO. 6 n THE AMERICAN JOURNAL OF MANAGED CARE n e221
Physician Payment and Home Dialysis Use
fected by the policy received in-center hemodialysis rather than home dialysis as a result of the policy. The payment policy appeared to have influenced dialysis modality choice for nearly all patient groups, regardless of sex, race, ethnicity, or overall health.
According to statements from CMS, the 2004 physician payment reform was designed to align economic incentives and improve the quality of dialysis care.27 In the discourse leading up to the policy’s enactment, there was no men-tion of how the reform might influence dialysis modality decisions. Since the policy was enacted, some physicians have expressed concern that it created a financial incen-tive to place some patients on in-center hemodialysis rather than home hemodialysis or peritoneal dialysis.28 However, surveys of nephrologists in the United States suggest that economic factors do not play an important role in dialysis modality selection.11,15 Our findings indicate that economic
incentives have had a substantial effect on physicians’ decisions regarding dialysis mo-dality, and that payment reform had the unintended consequence of leading fewer patients to home dialysis. Since the choice of dialysis modality is central to patients’ quality of life, independence, and health-care costs, a reduction in the use of home dialysis can be seen as a failure of the poli-cy.8,29,30 Recently, reform to Medicare dialy-sis facility reimbursement (the 2011 ESRD Prospective Payment System) encouraged greater use of home dialysis, and this has coincided with a trend back toward greater use of peritoneal dialysis.14
P4P initiatives have been proposed as a solution to problems in healthcare by encouraging the delivery of high-value care.31,32 Small trials and demonstration projects suggest that P4P initiatives may lead to high-quality care33,34; yet, the overall efficacy of P4P programs remains uncertain, and a number of studies have demonstrat-ed important unintended consequences.35 Due to mandates from the Affordable Care Act, CMS is expanding the scope of its P4P initiative on a national scale, with a program directed at physician payments, called the Physician Value-based Payment Modifier.36 The recent repeal of Medicare’s Sustainable Growth Rate formula calls for additional programs directed at physician payment.2 Because it was, in part, designed
to improve the quality of care, the 2004 physician payment reform is an early example of a national P4P program di-rected at physician behavior. Despite evidence that more frequent hemodialysis visits are associated with some fa-vorable health outcomes,37-40 policy analyses have failed to demonstrate any benefit and suggest that increased visits increase healthcare costs.41,42
Our findings appear to contrast with physician surveys indicating that economic factors do not influence dialysis modality decisions; however, these seemingly disparate findings can be reconciled. For a given physician, or group of physicians practicing in geographic proximity, the net financial reward from in-center versus home dialysis is a function of facility size and insurance composition (ie, the fraction of patients with traditional Medicare versus Medi-care Advantage) among other factors. To the extent that dialysis facility characteristics and patients with Medicare
Areas with smaller facilitiesAreas with larger facilities
Percent Difference in Home Dialysis Pre- vs Post Policy
–2 –1.5 –1 –0.5 0 0.5 1.5 2.521
Age <50 years
Age 50-65 yearsb
Age 65-80 yearsb
Age >80 years
Black
Whiteb
Hispanic
Non–Hispanicb
Male
Femaleb
Medicaid
Non-Medicaidb
≥3 comorbiditiesb
<3 comorbiditiesb
Hbg ≥10.5 g/dLb
Hbg <10.5 g/dL
Albumin ≥3.5 g/dL
Albumin <3.5 g/dLb
BMI ≥30 kg/m2
BMI <30 kg/m2 b
Immobileb
Mobileb
Rural/small town
Non-rural/non–small townb
n Figure 2. Change in Dialysis Modality Following Payment Reform by Dialysis Facility Sizes and Selected Patient Characteristicsa
BMI indicates body mass index; Hbg, hemoglobin. aAnalyses are unadjusted. bRepresents a statistically significant difference (P <.01) in the change in use of home dialysis between areas with large and smaller facilities.
e222 n www.ajmc.com n JUNE 2016
POLICY
Advantage are clustered geographically, regional differ-ences in practice patterns may reflect underlying economic incentives, even if individual physicians do not base their dialysis modality recommendations on economic grounds.
LimitationsThis study has several limitations. Although we use
“control” groups for comparison and multivariable ad-justment to reduce the potential for bias, we cannot fully exclude the possibility that unobserved factors differen-tially affected changes in modality choice across compari-son groups. For example, unobserved changes over time in patients’ suitability for home dialysis, willingness to administer dialysis at home, or preparation for dialysis that differentially affected 1 comparison group could lead to bias. Additionally, the relative financial gain for phy-sicians of in-center versus home dialysis care may have influenced dialysis modality decisions for some patients receiving Medicare Advantage through a “spillover” ef-fect, leading us to underestimate the effect of payment reform. Finally, small variation in visit frequency associ-ated with geographic density may have prevented us from observing significant effects of this factor on dialysis mo-dality choice.
CONCLUSIONSWe found that national physician payment reform
enacted by CMS in 2004 in an effort to encourage more frequent face-to-face dialysis visits and improve the qual-ity of care resulted in an unintended consequence of rela-tively fewer patients choosing home dialysis. The tiered fee-for-service payment system enacted in 2004 continues to govern physician reimbursement for in-center hemodi-alysis care and, consequently, may continue to discourage home dialysis use in certain patient populations. These findings highlight both an area of policy failure and the importance of considering unintended consequences of future efforts to reform physician payment.
AcknowledgmentsThis work was conducted under a data use agreement between Dr Win-
kelmayer and the National Institute for Diabetes and Digestive and Kidney Diseases (NIDDK). An NIDDK officer reviewed the manuscript and ap-proved it for submission. The data reported here have been supplied by the United States Renal Data System. The interpretation and reporting of these data are the responsibility of the authors and in no way should be seen as an official policy or interpretation of the US government.
Author Affiliations: Section of Nephrology, Baylor College of Medi-cine (KFE, WCW), Houston, TX; Center for Innovations in Quality, Ef-fectiveness, and Safety, Baylor College of Medicine (KFE), Houston TX; Baker Institute for Public Policy, Rice University (KFE), Houston TX; Division of Nephrology, Department of Medicine, Stanford University
School of Medicine (GMC), Palo Alto, CA; Department of Medicine, Center for Primary Care and Outcomes Research, Stanford University School of Medicine (JB), Stanford, CA
Source of Funding: Grant number F32 HS019178 from Agency for Health Research and Quality; grant number DK085446 from the Na-tional Institute of Diabetes and Digestive and Kidney Diseases; WCW receives research and salary support through the endowed Gordon A. Cain Chair in Nephrology at Baylor College of Medicine. JB would like to thank the National Institute on Aging for support for his work on this paper (R37 150127-5054662-0002).
Author Disclosures: Dr Chertow is a board member for Satellite Healthcare, which is a medium-sized nonprofit dialysis provider that pro-vides in-center and home hemodialysis therapies; changes in the use of home versus in-center hemodialysis that might result from policies enact-ed in response to these findings could affect revenues received by Satellite Healthcare. The remaining authors report no relationship or financial interest with any entity that would pose a conflict of interest with the subject matter of this article.
Authorship Information: Concept and design (KFE, JB, GMC); ac-quisition of data (KFE, WCW); analysis and interpretation of data (KFE, WCW, JB, GMC); drafting of the manuscript (KFE); critical revision of the manuscript for important intellectual content (KFE, WCW, JB, GMC); statistical analysis (KFE, JB); obtaining funding (KFE, WCW); administra-tive, technical, or logistic support (JB); and supervision (WCW, JB, GMC).
Address correspondence to: Kevin F. Erickson, MD, MS, Center for Innovations in Quality, Effectiveness, and Safety, Baylor College of Medi-cine, 2002 Holcombe Blvd, Mail Code 152, Houston, TX 77030. E-mail: [email protected].
REFERENCES1. Burwell SM. Setting value-based payment goals—HHS efforts to improve U.S. health care. N Engl J Med. 2015;372(10):897-899. doi: 10.1056/NEJMp1500445.2. Steinbrook R. The repeal of Medicare’s sustainable growth rate for physician payment. JAMA. 2015;313(20):2025-2026. doi: 10.1001/jama.2015.4550.3. Annual data report. United States Renal Data System website. https://www.usrds.org/adr.aspx. Accessed October 1, 2015.4. King K. Patients’ perspective of factors affecting modality selection: a National Kidney Foundation patient survey. Adv Ren Replace Ther. 2000;7(3):261-268.5. Boateng EA, East L. The impact of dialysis modality on qual-ity of life: a systematic review. J Ren Care. 2011;37(4):190-200. doi: 10.1111/j.1755-6686.2011.00244.x.6. Rubin HR, Fink NE, Plantinga LC, Sadler JH, Kliger AS, Powe NR. Patient ratings of dialysis care with peritoneal dialysis vs hemodialysis. JAMA. 2004;291(6):697-703.7. Cameron JI, Whiteside C, Katz J, Devins GM. Differences in quality of life across renal replacement therapies: a meta-analytic comparison. Am J Kidney Dis. 2000;35(4):629-637.8. Morton RL, Tong A, Howard K, Snelling P, Webster AC. The views of patients and carers in treatment decision making for chronic kidney disease: systematic review and thematic synthesis of qualitative stud-ies. BMJ. 2010;340:c112. doi: 10.1136/bmj.c112.9. Blake PG, Quinn RR, Oliver MJ. Peritoneal dialysis and the process of modality selection. Perit Dial Int. 2013;33(3):233-241. doi: 10.3747/pdi.2012.00119.10. Chapter IV: the USRDS Dialysis Morbidity and Mortality Study (wave 2). United States Renal Data System website. https://www.usrds.org/download/ 1997/ch04.pdf. Published 1997. Accessed September 15, 2015. 11. Mendelssohn DC, Mullaney SR, Jung B, Blake PG, Mehta RL. What do American nephrologists think about dialysis modality selection? Am J Kidney Dis. 2001;37(1):22-29.12. Heaf J. Underutilization of peritoneal dialysis. JAMA. 2004;291(6):740-742.13. Nissenson AR, Prichard SS, Cheng IK, et al. ESRD modality selec-tion into the 21st century: the importance of non medical factors. ASAIO J. 1997;43(3):143-150.14. Rivara MB, Mehrotra R. The changing landscape of home dialysis in the United States. Curr Opin Nephrol Hypertens. 2014;23(6):586-591. doi: 10.1097/MNH.0000000000000066.

VOL. 22, NO. 6 n THE AMERICAN JOURNAL OF MANAGED CARE n e223
Physician Payment and Home Dialysis Use
15. Thamer M, Hwang W, Fink NE, et al. US nephrologists’ recommen-dation of dialysis modality: results of a national survey. Am J Kidney Dis. 2000;36(6):1155-1165.16. Physician fee schedule [2003 and 2004]. CMS website. https://www.cms.gov/apps/physician-fee-schedule/search/search-criteria.aspx. Updated April 4. 2016. Accessed May 2016.17. CMS. Medicare program; revisions to payment policies un-der the physician fee schedule for calendar year 2004 [proposed rule]. Federal Register website. https://www.federalregister.gov/articles/2003/08/15/03-20662/medicare-program-revisions-to-payment-policies-under-the-physician-fee-schedule-for-calendar-year. Published August 15, 2003. Accessed July 15, 2015. 18. Montez-Rath ME, Winkelmayer WC, Desai M. Addressing missing data in clinical studies of kidney diseases. Clin J Am Soc Nephrol. 2014;9(7):1328-35. doi: 10.2215/CJN.10141013.19. Buuren SV, Brands JPL, Groothuis-Oudshoorn CGM, Rubin DB. Fully conditional specification in multivariate imputation. JSCS. 2006;76(12):1049-1064.20. Little RJA, Rubin DB. Statistical Analysis With Missing Data. 2nd edition. Hoboken, NJ: John Wiley & Sons, Inc; 2002.21. Rural-Urban Commuting Area Codes (RUCAs). WWAMI Rural Health Research Center website. http://depts.washington.edu/uwruca/. Accessed July 15, 2015.22. Selected hospital and physician capacity measures [2006]. Dart-mouth Atlas of Health Care website. http://www.dartmouthatlas.org/tools/downloads.aspx#resources. Accessed June 1, 2012.23. Dimick JB, Ryan AM. Methods for evaluating changes in health care policy: the difference-in-differences approach. JAMA. 2014;312(22):2401-2402. doi: 10.1001/jama.2014.16153.24. Erickson KF, Tan KB, Winkelmayer WC, Chertow GM, Bhattacharya J. Variation in nephrologist visits to patients on hemodialysis across dialysis facilities and geographic locations. Clin J Am Soc Nephrol. 2013;8(6):987-994. doi: 10.2215/CJN.10171012.25. Austin PC. Balance diagnostics for comparing the distribution of baseline covariates between treatment groups in propensity-score matched samples. Stat Med. 2009;28(25):3083-3107. doi: 10.1002/sim.3697.26. Stack AG. Determinants of modality selection among incident US dialysis patients: results from a national study. J Am Soc Nephrol. 2002;13(5):1279-1287.27. CMS, HHS. Medicare program; revisions to payment policies under the physician fee schedule for calendar year 2004. Final rule with com-ment period. Fed Regist. 2003;68(216):63195-63395.28. Just PM, de Charro FT, Tschosik EA, Noe LL, Bhattacharyya SK, Riella MC. Reimbursement and economic factors influencing dialysis modality choice around the world. Nephrol Dial Transplant. 2008;23(7):2365-2373. doi: 10.1093/ndt/gfm939.29. Hirth RA, Chernew ME, Turenne MN, Pauly MV, Orzol SM, Held PJ. Chronic illness, treatment choice and workforce participation. Int J Health Care Finance Econ. 2003;3(3):167-181.
30. Berger A, Edelsberg J, Inglese GW, Bhattacharyya SK, Oster G. Cost comparison of peritoneal dialysis versus hemodialysis in end-stage renal disease. Am J Manag Care. 2009;15(8):509-518.31. Frølich A, Talavera JA, Broadhead P, Dudley RA. A behavioral model of clinician responses to incentives to improve quality. Health Policy. 2007;80(1):179-193.32. Epstein AM, Lee TH, Hamel MB. Paying physicians for high-quality care. N Engl J Med. 2004;350(4):406-410.33. Bardach NS, Wang JJ, De Leon SF, et al. Effect of pay-for-perfor-mance incentives on quality of care in small practices with electronic health records: a randomized trial. JAMA. 2013;310(10):1051-1059. doi: 10.1001/jama.2013.277353.34. Petersen LA, Simpson K, Pietz K, et al. Effects of individual physician-level and practice-level financial incentives on hypertension care: a randomized trial. JAMA. 2013;310(10):1042-1050. doi: 10.1001/jama.2013.276303.35. Damberg CL, Sorbero ME, Lovejoy SL, Martsolf GR, Raaen L, Mandel D. Measuring success in health care value-based purchasing programs. RAND Corporation website. http://www.rand.org/content/dam/rand/pubs/research_reports/RR300/RR306z1/RAND_RR306z1.pdf. Published 2014. Accessed September 30, 2015. 36. Fact sheet: computation of the 2016 value modifier. CMS website. https://www.cms.gov/Medicare/Medicare-Fee-for-Service-Payment/PhysicianFeedbackProgram/Downloads/2016-VM-Fact-Sheet.pdf. Pub-lished September 2015. Accessed May 2016.37. McClellan WM, Soucie JM, Flanders WD. Mortality in end-stage renal disease is associated with facility-to-facility differences in ad-equacy of hemodialysis. J Am Soc Nephrol. 1998;9(10):1940-1947.38. Plantinga LC, Jaar BG, Fink NE, et al. Frequency of patient-physi-cian contact in chronic kidney disease care and achievement of clinical performance targets. Int J Qual Health Care. 2005;17(2):115-121.39. Erickson KF, Winkelmayer WC, Chertow GM, Bhattacharya J. Physi-cian visits and 30-day hospital readmissions in patients receiving hemodialysis. J Am Soc Nephrol. 2014;25(9):2079-87. doi: 10.1681/ASN.2013080879.40. Erickson KF, Mell M, Winkelmayer WC, Chertow GM, Bhattacharya J. Provider visits and early vascular access placement in maintenance hemodialysis. J Am Soc Nephrol. 2015;26(8):1990-1997. doi: 10.1681/ASN.2014050464 41. Erickson KF, Winkelmayer WC, Chertow GM, Bhattacharya J. Medi-care reimbursement reform for provider visits and health outcomes in patients on hemodialysis. Forum Health Econ Policy. 2014;17(1):53-77.42. Mentari EK, DeOreo PB, O’Connor AS, Love TE, Ricanati ES, Sehgal AR. Changes in Medicare reimbursement and patient-nephrologist visits, quality of care, and health-related quality of life. Am J Kidney Dis. 2005;46(4):621-627. n
www.ajmc.com Full text and PDF
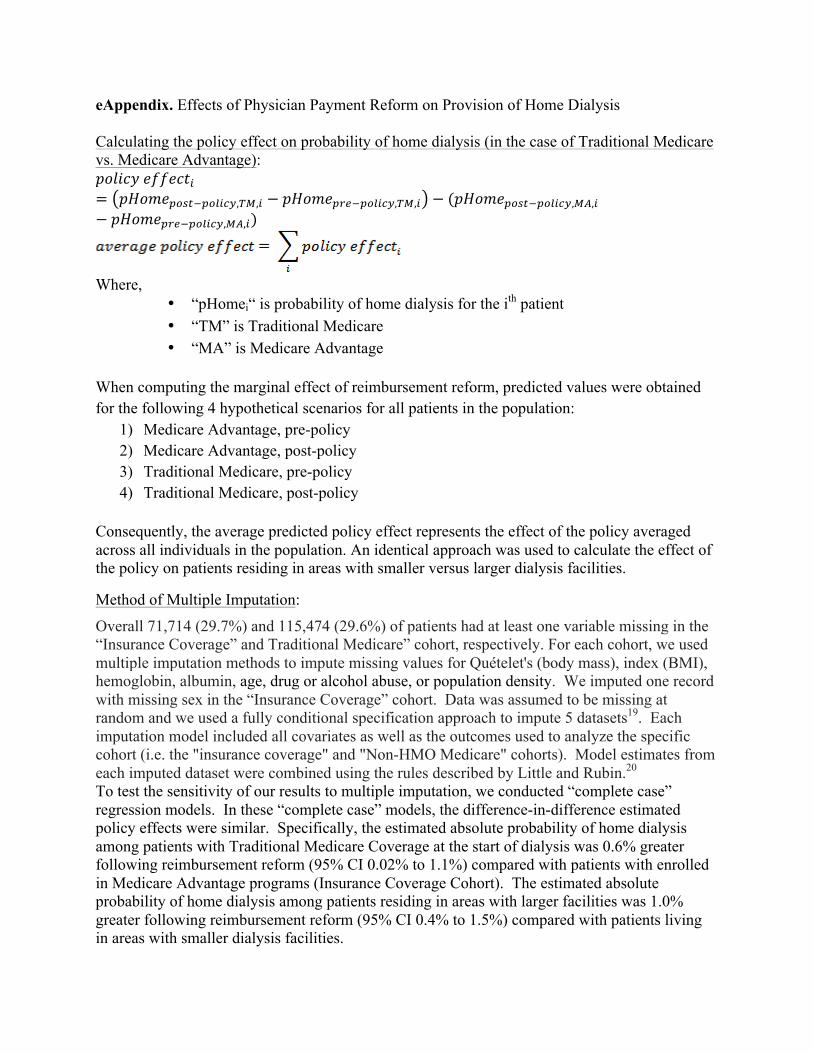
eAppendix. Effects of Physician Payment Reform on Provision of Home Dialysis Calculating the policy effect on probability of home dialysis (in the case of Traditional Medicare vs. Medicare Advantage): 𝑝𝑜𝑙𝑖𝑐𝑦 𝑒𝑓𝑓𝑒𝑐𝑡!= 𝑝𝐻𝑜𝑚𝑒!"#$!!"#$%&,!",! − 𝑝𝐻𝑜𝑚𝑒!"#!!"#$%&,!",! − (𝑝𝐻𝑜𝑚𝑒!"#$!!"#$%&,!",!− 𝑝𝐻𝑜𝑚𝑒!"#!!"#$%&,!",!)
Where,
• “pHomei“ is probability of home dialysis for the ith patient • “TM” is Traditional Medicare • “MA” is Medicare Advantage
When computing the marginal effect of reimbursement reform, predicted values were obtained for the following 4 hypothetical scenarios for all patients in the population:
1) Medicare Advantage, pre-policy 2) Medicare Advantage, post-policy 3) Traditional Medicare, pre-policy 4) Traditional Medicare, post-policy
Consequently, the average predicted policy effect represents the effect of the policy averaged across all individuals in the population. An identical approach was used to calculate the effect of the policy on patients residing in areas with smaller versus larger dialysis facilities.
Method of Multiple Imputation:
Overall 71,714 (29.7%) and 115,474 (29.6%) of patients had at least one variable missing in the “Insurance Coverage” and Traditional Medicare” cohort, respectively. For each cohort, we used multiple imputation methods to impute missing values for Quételet's (body mass), index (BMI), hemoglobin, albumin, age, drug or alcohol abuse, or population density. We imputed one record with missing sex in the “Insurance Coverage” cohort. Data was assumed to be missing at random and we used a fully conditional specification approach to impute 5 datasets19. Each imputation model included all covariates as well as the outcomes used to analyze the specific cohort (i.e. the "insurance coverage" and "Non-HMO Medicare" cohorts). Model estimates from each imputed dataset were combined using the rules described by Little and Rubin.20 To test the sensitivity of our results to multiple imputation, we conducted “complete case” regression models. In these “complete case” models, the difference-in-difference estimated policy effects were similar. Specifically, the estimated absolute probability of home dialysis among patients with Traditional Medicare Coverage at the start of dialysis was 0.6% greater following reimbursement reform (95% CI 0.02% to 1.1%) compared with patients with enrolled in Medicare Advantage programs (Insurance Coverage Cohort). The estimated absolute probability of home dialysis among patients residing in areas with larger facilities was 1.0% greater following reimbursement reform (95% CI 0.4% to 1.5%) compared with patients living in areas with smaller dialysis facilities.
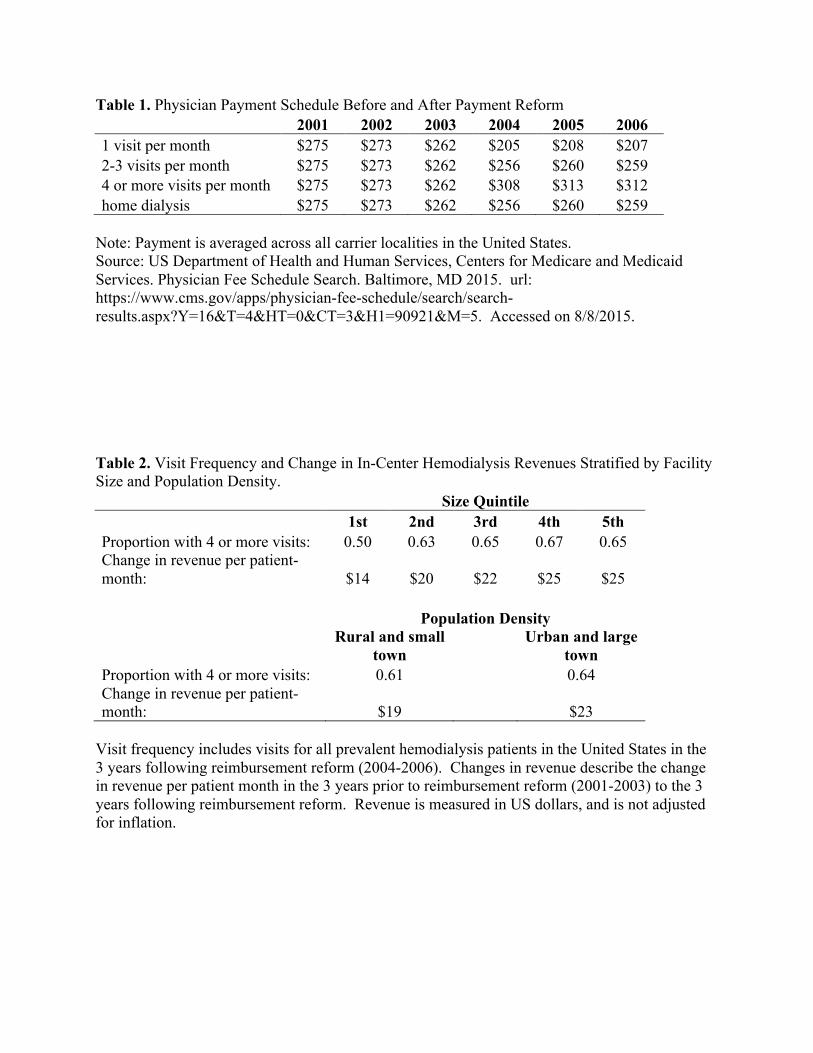
Table 1. Physician Payment Schedule Before and After Payment Reform 2001 2002 2003 2004 2005 2006 1 visit per month $275 $273 $262 $205 $208 $207 2-3 visits per month $275 $273 $262 $256 $260 $259 4 or more visits per month $275 $273 $262 $308 $313 $312 home dialysis $275 $273 $262 $256 $260 $259
Note: Payment is averaged across all carrier localities in the United States. Source: US Department of Health and Human Services, Centers for Medicare and Medicaid Services. Physician Fee Schedule Search. Baltimore, MD 2015. url: https://www.cms.gov/apps/physician-fee-schedule/search/search-results.aspx?Y=16&T=4&HT=0&CT=3&H1=90921&M=5. Accessed on 8/8/2015. Table 2. Visit Frequency and Change in In-Center Hemodialysis Revenues Stratified by Facility Size and Population Density. Size Quintile
1st 2nd 3rd 4th 5th
Proportion with 4 or more visits: 0.50 0.63 0.65 0.67 0.65 Change in revenue per patient-month: $14 $20 $22 $25 $25
Population Density
Rural and small town
Urban and large town
Proportion with 4 or more visits: 0.61
0.64 Change in revenue per patient-month: $19 $23
Visit frequency includes visits for all prevalent hemodialysis patients in the United States in the 3 years following reimbursement reform (2004-2006). Changes in revenue describe the change in revenue per patient month in the 3 years prior to reimbursement reform (2001-2003) to the 3 years following reimbursement reform. Revenue is measured in US dollars, and is not adjusted for inflation.
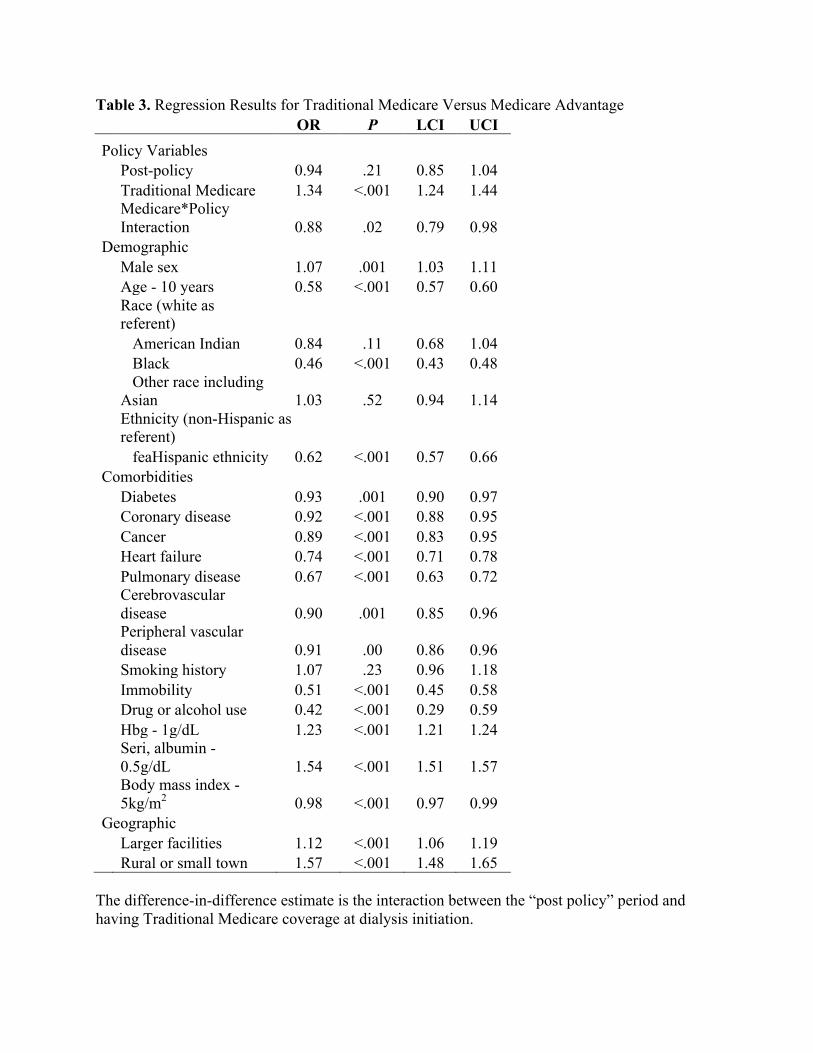
Table 3. Regression Results for Traditional Medicare Versus Medicare Advantage OR P LCI UCI Policy Variables
Post-policy 0.94 .21 0.85 1.04
Traditional Medicare 1.34 <.001 1.24 1.44
Medicare*Policy Interaction 0.88 .02 0.79 0.98
Demographic
Male sex 1.07 .001 1.03 1.11
Age - 10 years 0.58 <.001 0.57 0.60
Race (white as referent)
American Indian 0.84 .11 0.68 1.04
Black 0.46 <.001 0.43 0.48
Other race including Asian 1.03 .52 0.94 1.14
Ethnicity (non-Hispanic as referent)
feaHispanic ethnicity 0.62 <.001 0.57 0.66 Comorbidities
Diabetes 0.93 .001 0.90 0.97
Coronary disease 0.92 <.001 0.88 0.95
Cancer 0.89 <.001 0.83 0.95
Heart failure 0.74 <.001 0.71 0.78
Pulmonary disease 0.67 <.001 0.63 0.72
Cerebrovascular disease 0.90 .001 0.85 0.96
Peripheral vascular disease 0.91 .00 0.86 0.96
Smoking history 1.07 .23 0.96 1.18
Immobility 0.51 <.001 0.45 0.58
Drug or alcohol use 0.42 <.001 0.29 0.59
Hbg - 1g/dL 1.23 <.001 1.21 1.24
Seri, albumin - 0.5g/dL 1.54 <.001 1.51 1.57
Body mass index - 5kg/m2 0.98 <.001 0.97 0.99
Geographic
Larger facilities 1.12 <.001 1.06 1.19
Rural or small town 1.57 <.001 1.48 1.65 The difference-in-difference estimate is the interaction between the “post policy” period and having Traditional Medicare coverage at dialysis initiation.

Table 4. Regression Results for Dialysis Facility Size OR P LCI UCI Policy Variables
Post-policy 0.99 .73 0.91 1.07
Large Facility 1.15 <.001 1.08 1.23
Large Facility*Policy Interaction 0.84 <.001 0.78 0.92
Demographic
Male sex 0.86 <.001 0.84 0.89
Age - 10 years 0.79 <.001 0.78 0.79
Race (white as referent)
American Indian 0.83 .003 0.74 0.94
Black 0.52 <.001 0.50 0.54
Other race including Asian 0.89 .001 0.83 0.95
Ethnicity (non-Hispanic as referent)
Hispanic ethnicity 0.70 <.001 0.67 0.74 Comorbidities
Diabetes 1.07 <.001 1.04 1.10
Coronary disease 1.00 .97 0.97 1.04
Cancer 0.87 <.001 0.82 0.93
Heart failure 0.74 <.001 0.71 0.76
Pulmonary disease 0.75 <.001 0.71 0.80
Cerebrovascular disease 0.89 <.001 0.85 0.94
PVD 0.96 .04 0.91 1.00
Smoking history 1.02 .54 0.96 1.08
Immobility 0.53 <.001 0.48 0.59
Drug or alcohol use 0.45 <.001 0.39 0.52
Hbg - 1g/dL 1.20 <.001 1.19 1.21
Serum albumin - 0.5g/dL 1.43 <.001 1.41 1.44
Body mass index - 5kg/m2 0.93 <.001 0.92 0.94
Geographic Rural or small town 1.48 <.001 1.42 1.54
The difference-in-difference estimate is the interaction between the “post policy” period and residing in areas with larger dialysis facilities.
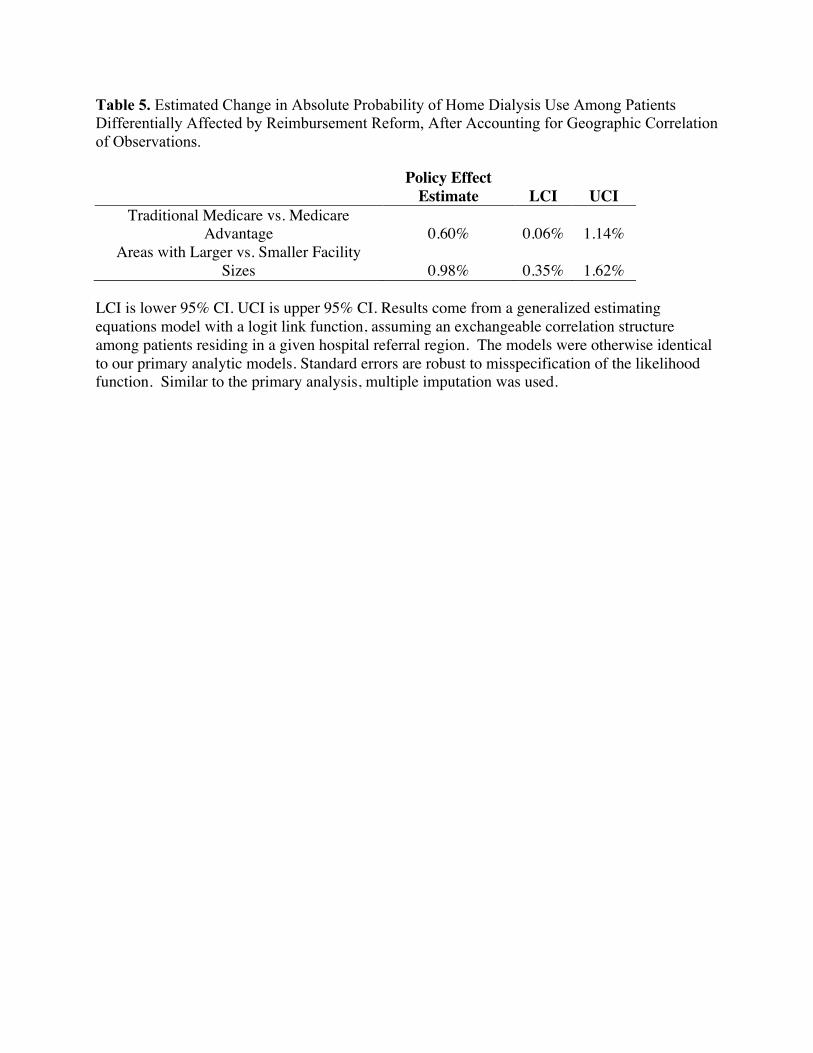
Table 5. Estimated Change in Absolute Probability of Home Dialysis Use Among Patients Differentially Affected by Reimbursement Reform, After Accounting for Geographic Correlation of Observations.
Policy Effect
Estimate LCI UCI Traditional Medicare vs. Medicare
Advantage 0.60% 0.06% 1.14% Areas with Larger vs. Smaller Facility
Sizes 0.98% 0.35% 1.62% LCI is lower 95% CI. UCI is upper 95% CI. Results come from a generalized estimating equations model with a logit link function, assuming an exchangeable correlation structure among patients residing in a given hospital referral region. The models were otherwise identical to our primary analytic models. Standard errors are robust to misspecification of the likelihood function. Similar to the primary analysis, multiple imputation was used.

eAPPENDIX REFERENCES 1. Burwell SM. Setting value-based payment goals--HHS efforts to improve U.S. health
care. New England Journal of Medicine. Mar 5 2015;372(10):897-899. 2. Steinbrook R. The Repeal of Medicare's Sustainable Growth Rate for Physician Payment.
JAMA. 2015;313(20). 3. USRDS. Annual Data Report: Atlas of Chronic Kidney Disease and End-Stage Renal
Disease in the United States. Bethesda, MD: National Institutes of Health, National Institute of Diabetes and Digestive and Kidney Diseases;2013.
4. King K. Patients' perspective of factors affecting modality selection: a National Kidney Foundation patient survey. Advances in Renal Replacement Therapy. Jul 2000;7(3):261-268.
5. Boateng EA, East L. The impact of dialysis modality on quality of life: a systematic review. Journal of Renal Care. Dec 2011;37(4):190-200.
6. Rubin HR, Fink NE, Plantinga LC, Sadler JH, Kliger AS, Powe NR. Patient ratings of dialysis care with peritoneal dialysis vs hemodialysis. JAMA. Feb 11 2004;291(6):697-703.
7. Cameron JI, Whiteside C, Katz J, Devins GM. Differences in quality of life across renal replacement therapies: a meta-analytic comparison. American Journal of Kidney Diseases. Apr 2000;35(4):629-637.
8. Morton RL, Tong A, Howard K, Snelling P, Webster AC. The views of patients and carers in treatment decision making for chronic kidney disease: systematic review and thematic synthesis of qualitative studies. BMJ. 2010;340:c112.
9. Blake PG, Quinn RR, Oliver MJ. Peritoneal dialysis and the process of modality selection. Peritoneal Dialysis International. May-Jun 2013;33(3):233-241.
10. System USRD. The USRDS Dialysis Morbidity and Mortality Study: Wave 21997. 11. Nissenson AR, Prichard SS, Cheng IKP, et al. ESRD Modality Selection Into the 21st
Century: The Importance of Non Medical Factors. ASAIO Journal May/June. 1997;43(3):143-150.
12. Rivara MB, Mehrotra R. The changing landscape of home dialysis in the United States. Current Opinion in Nephrology & Hypertension.23(6):586-591.
13. Mendelssohn DC, Mullaney SR, Jung B, Blake PG, Mehta RL. What do American nephologists think about dialysis modality selection? American Journal of Kidney Diseases. Jan 2001;37(1):22-29.
14. Thamer M, Hwang W, Fink NE, et al. US nephrologists' recommendation of dialysis modality: results of a national survey. American Journal of Kidney Diseases. Dec 2000;36(6):1155-1165.
15. Services DoHaHRCfMaM. Physician Fee Schedule. 2011; http://www.cms.gov/apps/physician-fee-schedule/overview.aspx. Accessed June, 2011.
16. CMS. Medicare Program; Revisions to Payement Policies Under the Physician Fee Schedule for Calendar Year 2004; Proposed Rule. In: Centers for Medicare & Medicaid Services; Department of Health and Human Services, ed. Vol 682003:20-22.
17. Services CfMaM. End Stage Renal Disease Medical Evidence Report Medicare Entitlement And/Or Patient Registration. In: Services DoHaH, ed. Baltimore, MD2004.
18. ME M-R, WC W, M D. Addressing Missing Data in Clinical Studies of Kidney Diseases. Clinical Journal of The American Society of Nephrology: CJASN. 2014.
19. Buuren SV, Brands JPL, Groothuis-Oudshoorn CGM, Rubin DB. Fully Conditional Specification in Multivariate Imputation. Journal of Statistical Computation and Simulation. December 2006 2006;76(12):1049-1064.
20. Little R, Rubin D. Statistical Analysis with Missing Data. Hoboken, New Jersey: John Wiley & Sons, Inc.; 2002.
21. Rural-Urban Commuting Area Codes (RUCA). WWAMI Rural Health Research Center; 2005.
22. Practice TDIfHPaC. Selected Hospital and Physician Capacity Measures. 2006; http://www.dartmouthatlas.org/tools/downloads.aspx#resources. Accessed 6/1/2012, 2012.
23. Methods for evaluating changes in health care policy: the difference-in-differences approach. JAMA. Dec 10 2014;312(22):2401-2402.
24. Erickson KF, Tan, K.B., Winkelmayer, W.C., Chertow, G.M., Bhattacharya, J. Variation in Nephrologist Visits to Patients on Hemodialysis across Dialysis Facilities and Geographic Locations. Clinical Journal of The American Society of Nephrology: CJASN. 2013;8(6):987-994.
25. Austin PC. Balance diagnostics for comparing the distribution of baseline covariates between treatment groups in propensity-score matched samples. Statistics in Medicine. Nov 10 2009;28(25):3083-3107.
26. Stack AG. Determinants of modality selection among incident US dialysis patients: results from a national study. Journal of the American Society of Nephrology.13(5):1279-1287.
27. Centers for M, Medicaid Services HHS. Medicare program; revisions to payment policies under the physician fee schedule for calendar year 2004. Final rule with comment period. Federal Register. Nov 7 2003;68(216):63195-63395.
28. Just PM, de Charro FT, Tschosik EA, Noe LL, Bhattacharyya SK, Riella MC. Reimbursement and economic factors influencing dialysis modality choice around the world. Nephrology Dialysis Transplantation. Jul 2008;23(7):2365-2373.
29. Hirth RA, Chernew ME, Turenne MN, Pauly MV, Orzol SM, Held PJ. Chronic illness, treatment choice and workforce participation. International Journal of Health Care Finance & Economics. Sep 2003;3(3):167-181.
30. Berger A, Edelsberg J, Inglese GW, Bhattacharyya SK, Oster G. Cost comparison of peritoneal dialysis versus hemodialysis in end-stage renal disease. American Journal of Managed Care. Aug 2009;15(8):509-518.
31. Talavera JA, Broadhead P, Dudley RA. A behavioral model of clinician responses to incentives to improve quality. Health Policy. Jan 2007;80(1):179-193.
32. Epstein AM, Lee TH, Hamel MB. Paying physicians for high-quality care. New England Journal of Medicine. Jan 22 2004;350(4):406-410.
33. Wang JJ, De Leon SF, Shih SC, Boscardin WJ, Goldman LE, Dudley RA. Effect of pay-for-performance incentives on quality of care in small practices with electronic health records: a randomized trial. JAMA. Sep 11 2013;310(10):1051-1059.
34. Simpson K, Pietz K, Urech TH, et al. Effects of individual physician-level and practice-level financial incentives on hypertension care: a randomized trial. JAMA. Sep 11 2013;310(10):1042-1050.
35. Damberg C, Sorbero M, Lovejoy S, Martsolf G, Raaen L, Mandel D. Measuring Success in Health Care Value-Based Purchasing Programs. Santa Monica, CA: RAND Corporation;2014.
36. Services CfMM. Value-Based Payment Modifier. Medicare FFS Physician Feedback Program/Value Based Payment Modifier 2014; http://www.cms.gov/Medicare/Medicare-Fee-for-Service-Payment/PhysicianFeedbackProgram/ValueBasedPaymentModifier.html. Accessed 1/14/2015, 2015.
37. McClellan WM, Soucie JM, Flanders WD. Mortality in end-stage renal disease is associated with facility-to-facility differences in adequacy of hemodialysis. Journal of the American Society of Nephrology. Oct 1998;9(10):1940-1947.
38. Plantinga LC, Jaar BG, Fink NE, et al. Frequency of patient-physician contact in chronic kidney disease care and achievement of clinical performance targets. International Journal for Quality in Health Care. Apr 2005;17(2):115-121.
39. Erickson KF, Winkelmayer WC, Chertow GM, Bhattacharya J. Physician Visits and 30-Day Hospital Readmissions in Patients Receiving Hemodialysis. Journal of the American Society of Nephrology. 2014.
40. Erickson KF, Mell M, Winkelmayer WC, Chertow GM, Bhattacharya J. Provider Visits and Early Vascular Access Placement in Maintenance Hemodialysis. Journal of the American Society of Nephrology. 2014;2014(Published ahead of print).
41. Erickson KF, Winkelmayer WC, Chertow GM, Bhattacharya J. Medicare Reimbursement Reform for Provider Visits and Health Outcomes in Patients on Hemodialysis. Forum for Health Economics & Policy. 2014;0(0):1558-9544.
42. Mentari EK, DeOreo PB, O'Connor AS, Love TE, Ricanati ES, Sehgal AR. Changes in Medicare reimbursement and patient-nephrologist visits, quality of care, and health-related quality of life. American Journal of Kidney Diseases. Oct 2005;46(4):621-627.