physician workforce 2015 -...
TRANSCRIPT

2015 Physician Workforce
Missouri’s

2
Table of ContentsMissouri’s Physician Workforce 2015 3Allopathic Physician vs. Osteopathic 3Overall Education 4Education for MDs 4Tuition for MDs 7Education for DOs 8Tuition for DOs 10Residents 11Physician Workforce 12Geographical Distribution 12Race 15Wages 16Employment 17Family and General Physicians 19General Pediatricians 21General Internists 23Obstetricians and Gynecologists 25Psychiatrist 26Anesthesiologist 28Sources 30

3
Missouri’s Physician Workforce
Physicians and surgeons diagnose and treat injuries and illnesses. Physicians take medical histories; examine patients; prescribe medications; and order, perform, and interpret diagnostic tests. In addition, they advise patients on proper diet, hygiene and preventive healthcare. Surgeons operate on patients to treat injuries, diseases and deformities.15
Physicians specialize in a wide variety of disciplines. Some of the most common types, which will be highlighted throughout this report, are:15
• family and General Physicians
• pediatricians
• internists
• obstetricians and Gynecologists
• psychiatrists
• anesthesiologists
2015
Figure 1. Comparisons of the Percent of Medical Doctors and Osteopathic Doctors in Missouri, 201519
Specialty MD Percent DO Percent TotalFamily/General 1,521 (65%) 827 (35%) 2,348
Pediatrician 1,456 (92%) 132 (8%) 1,588General Internist 3,171 (91%) 312 (9%) 3,483
OB/GYN 723 (88%) 96 (12%) 819Psychiatrist 751 (91%) 77 (9%) 828
Anesthesiologist 829 (86.5%) 129 (13.5%) 958
There are two types of practicing physicians, Allopathic physicians (MD) and Osteopathic physicians (DO). The two types are very similar and both are fully qualified physicians that have been licensed to perform surgery and prescribe medication.4 According to the American Osteopathic Association (AOA), “While DOs and MDs have
Allopathic Physician vs. Osteopathic Physician many things in common; osteopathic medicine is a parallel branch of American medicine with a distinct philosophy and approach to patient care.”4 Comparisons of the percent of MDs and DOs in Missouri for the six highlighted specialties as well as physicians in Missouri as a whole are portrayed in Figure 1.19
Other common specialties include allergy/immunology, cardiology, dermatology, emergency medicine, endocrinology, geriatrics, medical genetics, neurological surgery, neurology, oncology, ophthalmology, orthopedics, pathology, physical medicine and rehab, plastic surgery, radiology and urology.19
4
Undergraduate, medical school and graduate medical education are required in order to become a licensed physician. Physicians must obtain a bachelor of science or arts; attend four years at a U.S. medical school accredited by the Liaison Committee on Medical Education (LME); and complete a 3-7 year residency program under senior physician supervision. The length of residency depends on the specialty. Physicians who choose to become highly specialized in a particular field must also complete a 1-3 year fellowship involving additional training. A physician then needs to obtain a license from the state in which they plan to practice. In Missouri the Missouri State Board of Healing Arts licenses physicians under the Missouri Code of State Regulations, 20 CSR 2150-2.4, 17, 21
In addition, physicians may choose to become board certified by one of the 24 member boards that make up the American Board of Medical Specialties (ABMS). This optional certification is not required for licensure, but does require additional testing and the ability to meet additional standards beyond those required by licensing bodies.3
In the State of Missouri there are currently four allopathic and two osteopathic medical schools: 2, 6
• A.T. Still University of Health Sciences-Kirksville College of Osteopathic Medicine
• Kansas City University of Medicine and Biosciences (Osteopathic)
• St. Louis University- School of Medicine
• University of Missouri-Columbia School of Medicine
• University of Missouri-Kansas City School of Medicine
• Washington University School of Medicine-St. Louis
Data related to application, enrollment, race/ethnicity, and gender from the American Association of Colleges of Osteopathic Medicine (AACOM) and the Association of American Medical Colleges (AAMC) have been compiled into two separate sections for all six Missouri schools. Note, due to the fact that two separate data sources were utilized to gather information, different material is available for each degree.
Overall Education
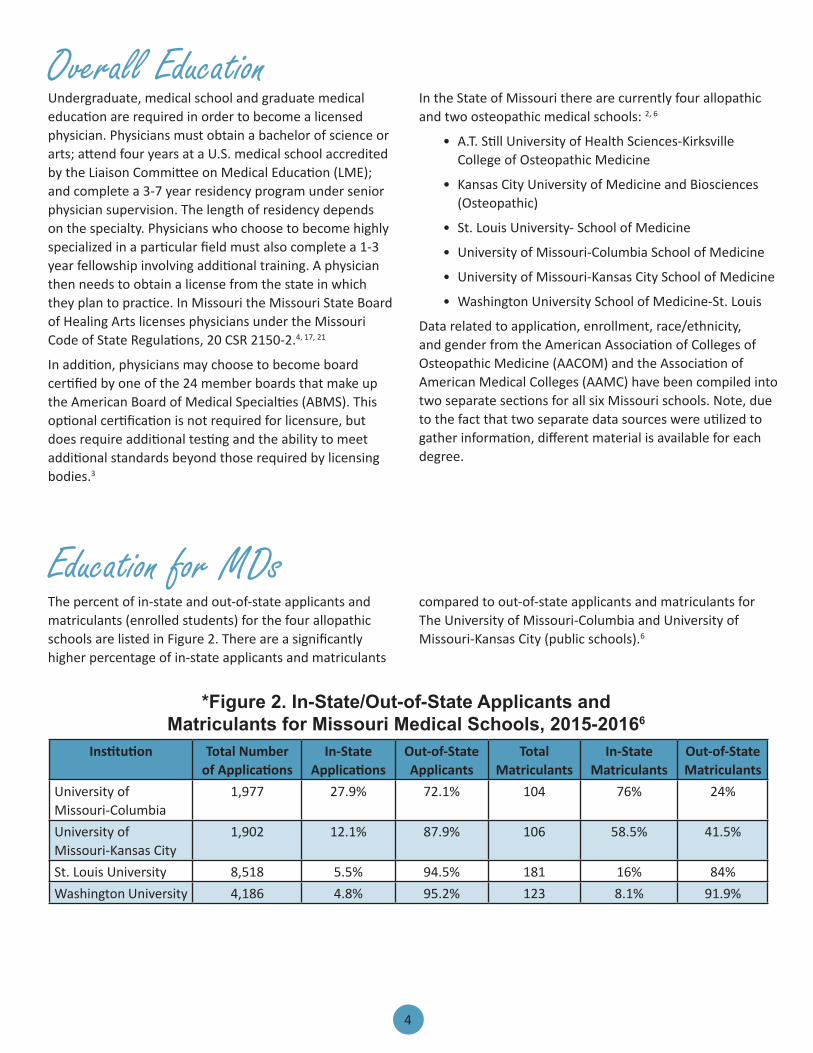
The percent of in-state and out-of-state applicants and matriculants (enrolled students) for the four allopathic schools are listed in Figure 2. There are a significantly higher percentage of in-state applicants and matriculants
Education for MDs
Institution Total Number of Applications
In-State Applications
Out-of-State Applicants
Total Matriculants
In-State Matriculants
Out-of-State Matriculants
University of Missouri-Columbia
1,977 27.9% 72.1% 104 76% 24%
University of Missouri-Kansas City
1,902 12.1% 87.9% 106 58.5% 41.5%
St. Louis University 8,518 5.5% 94.5% 181 16% 84%Washington University 4,186 4.8% 95.2% 123 8.1% 91.9%
compared to out-of-state applicants and matriculants for The University of Missouri-Columbia and University of Missouri-Kansas City (public schools).6
*Figure 2. In-State/Out-of-State Applicants and Matriculants for Missouri Medical Schools, 2015-20166

5
Additionally, at both St. Louis University and Washington University (private schools), the percentage of in-state matriculants is more than triple the percentage of in-state applicants.
The number of applicants by the state of their legal residence has increased slightly in recent years. There was a 2.3% increase in Missouri applicants between the years 2013 and 2014. The number of matriculants increased
by 7.5% between 2013 and 2014, after a minor decrease between years 2012 and 2013.6 The trends of the number of in-state applicants and matriculants between the years 2004 and 2015 in Missouri are highlighted in Figure 3. The number of in-state applicants has been on an overall incline since 2004 as depicted by the red trend line.
*Applicants may have applied to more than one Missouri school, resulting in discrepancies of total applicant numbers in Figures 2 and 3.
Figure 3. Number Applicants and Matriculants from Missouri to US Medical Schools, 2004-20146
The division of gender for applicants and matriculants is listed in Figure 4.6 Nationally, the amount of women applying and attending allopathic medical school has been on a steady incline since 1977. In 1982-1983, 26.8% of MD degrees were awarded to women. In 2010-2011,
female students received 48.4% of the MD’s awarded, representing the largest number of women earning an MD of any national graduating class to date.6
Institution Total Number of Applications
Percent Women
Percent Men
Total Matriculants
Percent Women
Percent Men
University of Missouri-Columbia
1,713 44% 56% 104 44.2% 55.8%
University of Missouri-Kansas City
1,266 44.3% 55.7% 121 55.4% 44.6%
St. Loiuis University 7,267 43% 57% 180 52.8% 47.2%Washington University 4,367 42.5% 57.5% 123 50.4% 49.6%
Figure 4. Percent of Gender Specific Applicants and Matriculants for 4 Missouri Allopathic Schools, 2014-20156
6
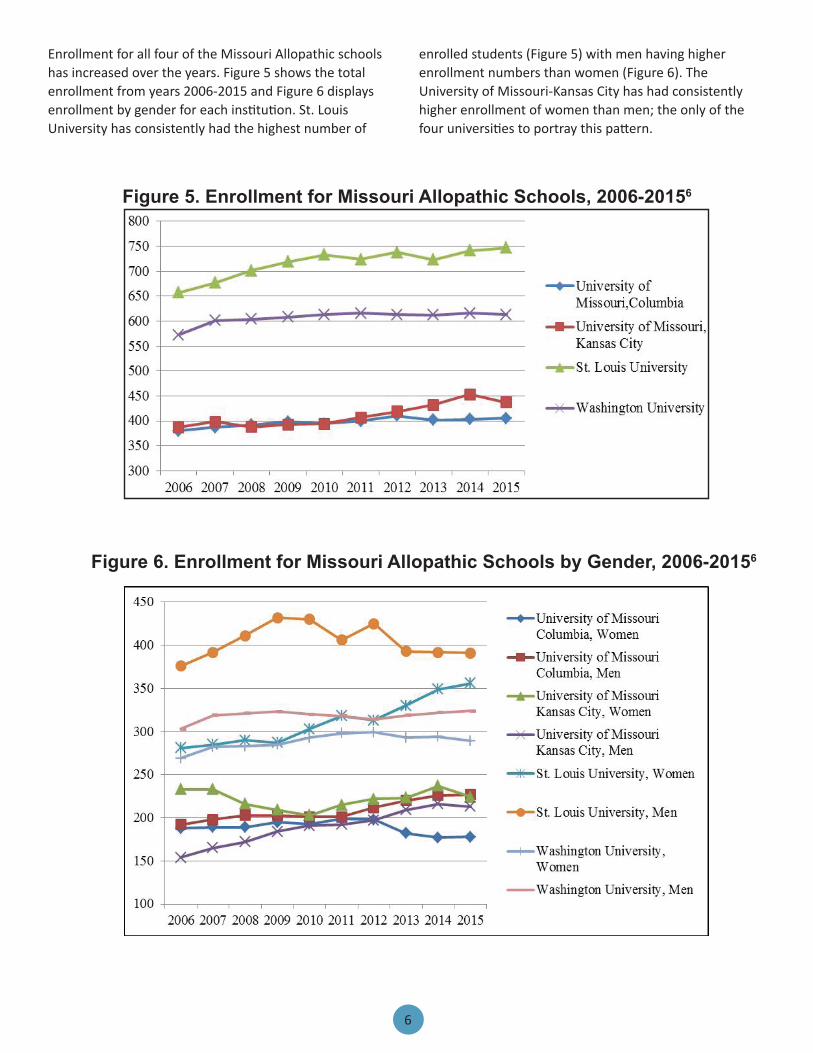
Enrollment for all four of the Missouri Allopathic schools has increased over the years. Figure 5 shows the total enrollment from years 2006-2015 and Figure 6 displays enrollment by gender for each institution. St. Louis University has consistently had the highest number of
enrolled students (Figure 5) with men having higher enrollment numbers than women (Figure 6). The University of Missouri-Kansas City has had consistently higher enrollment of women than men; the only of the four universities to portray this pattern.
Figure 5. Enrollment for Missouri Allopathic Schools, 2006-20156
Figure 6. Enrollment for Missouri Allopathic Schools by Gender, 2006-20156

7
Tuition for all four of the Missouri allopathic medical schools has been on a steady incline since the 1996-1997 school years (first year of available data). Tuition for non-residents is approximately double the tuition for residents at both public institutions, University of Missouri-Columbia and University of Missouri-Kansas City. Tuition is the same amount for both resident and non-resident students at the private institutions, St. Louis University and Washington University.6
Figures 7 and 8 display tuition rates by school year for all schools from the 1996-1997 school years to the present 2015-2016 school year in both tabular and graph form. The percent changes in tuition cost between school years
Tuition for MDs
Figure 7. Tuition Rates for Missouri Medical Schools, 1996-20166
1996-1997 and 2015-2016 are listed in the last line of Figure 7. The school years that have the largest increase in tuition cost are bolded with the percent next to the more expensive year. Tuition cost had the most significant increase between school years 2001-2002 and 2002-2003 for the University of Missouri-Columbia and University of Missouri-Kansas City for both residents and non-residents. There was a tuition decrease between the years 2010-2011 and 2011-2012 at the University of Missouri-Kansas City for both residents (4%) and non-residents (1%). There was also a tuition decrease at Washington University between the years 2013-2014 and 2014-2015 (1%).
School Year University of Missouri-Columbia, Resident
University of Missouri-Columbia,
Non-Resident
University of Missouri-Kansas City,
Resident
University of Missouri-Kansas City,
Non-Resident
St. Louis University, Resident &
Non-Resident
Washington University, Resident &
Non-Resident96 - 97 $13,216 $26,579 $19,453 $39,416 $25,600 $27,43597 - 98 $13,626 $27,830 $20,059 $40,642 $27,140 6% $28,80098- 99 $14,037 $28,225 $20,059 $40,642 $28,500 $29,67099 - 00 $14,486 $29,128 $21,322 $43,200 $29,930 $31,700 6%00 - 01 $14,951 $30,060 $22,003 $44,582 $31,430 $32,96001 - 02 $15,458 $31,082 $22,752 $46,099 $33,300 6% $34,28002 - 03 $17,082 9.5% $34,016 9% $24,986 9% $50,297 8% $34,800 $35,78003 - 04 $18,792 $37,418 $25,094 $50,405 $36,190 $37,03204 - 05 $20,203 $40,226 $25,845 $51,158 $37,640 $38,33005 - 06 $20,909 $41,634 $26,817 $52,060 $38,960 $39,72006 - 07 $21,953 $43,715 $26,933 $52,229 $40,520 $41,91007 - 08 $22,788 $45,374 $26,933 $53,866 $42,140 $43,38008 - 09 $23,724 $47,236 $27,470 $54,939 $43,830 $45,55009 - 10 $23,724 $47,236 $28,810 $56,279 $44,710 $47,15010 - 11 $23,724 $47,236 $28,810 $56,279 $45,600 $48,80011 - 12 $25,265 $50,307 $27,780 $55,559 $46,510 $50,51012 - 13 $26,022 $51,812 $28,719 $57,438 $47,440 $52,02013 - 14 $26,935 $53,629 $29,150 $58,299 $48,390 $54,05014 - 15 $27,339 $54,433 $29,295 $58,591 $49,450 $453,46315 - 16 $27,558 $54,868 $29,589 $59,178 $50,440 $455,711Percent Change
109% 106% 52% 50% 97% 103%

8
Figure 8. Tuition Rates for Missouri Medical Schools, 1996-20166
Nationally, the amount of Osteopathic medical schools and attendees has increased from 14 institutions and 3,926 enrollees in 1997 to 31 institutions at 44 locations and 23,071 enrollees in 2014. Figure 9 shows the enrollment numbers for A.T. Still University-Kirksville College of Osteopathic Medicine (ATSU-KCOM) and Kansas City University of Medicine and Bioscience College of Osteopathic Medicine (KCUMB-COM) between 2008 and 2012.2
The number of 2014-2015 school year enrollees by gender and self-reported race/ethnicity for schools nation-wide and for Missouri’s two osteopathic schools are listed in Figures 10, 11 and 12. Asian and Caucasian students are listed as the largest enrolled demographics at both the national and state levels.2
In 2009-2010 Missouri had second the highest number of osteopathic medical school graduates (404), next only to Pennsylvania with 450 graduates. Florida was third with 357 osteopathic medical student graduates.2 As of May 1, 2015; 5,229 osteopathic residents were matched, compared with 31 who were not matched.2
Education for DOsFigure 9. Enrolment for Missouri Osteopathic Schools, 2008-2012 2

9
Nationally Male Female TotalTotal 13,661 (56%) 10,903 (44%) 24,564Hispanic/Latino 573 (4%) 498 (4%) 1,062 (4%)White, non-Hispanic 9,174 (67%) 6,799 (62%) 15,973 (65%)American Indian/Alaska Native, non-Hispanic 66 (0.5%) 43 (0.4%) 109 (0.4%)Black/African American, non-Hispanic 298 (2%) 415 (4%) 713 (3%)Asian, non-Hispanic 2,626 (19%) 2,321 (21%) 4,947 (20%)Pacific Islander, non-Hispanic 10 (0.07%) 18 (0.2%) 28 (0.1%)Two or more races, non-Hispanic 346 (3%) 321 (3%) 667 (3%)Unkown 406 (3%) 355 (3%) 761 (3%)Nonresident alien 162 (1%) 142 (1%) 304 (1%)
A.T. Still University - Kirksville College of Osteopathic Medicine
Male Female Total
Total 397 (57%) 296 (43%) 693Hispanic/Latino 14 (4%) 16 (5%) 30 (4.3%)White, non-Hispanic 332 (84%) 213 (72%) 545 (79%)American Indian/Alaska Native, non Hispanic 1 (0.3%) 1 (0.3%) 2 (0.3%)Black/African American, non-Hispanic 5 (1%) 9 (3%) 14 (2%)Asian, non-Hispanic 29 (7%) 25 (8%) 54 (8%)Pacific Islander, non-Hispanic 0 0 0Two or more races, non-Hispanic 2 (.5%) 19 (6%) 21 (3%)Unkown 9 (2%) 21 (4%) 21 (2%)Nonresident alien 5 (1%) 1 (0.3%) 6 (0.9%)
Kansas City University of Medicine and Bioscience College of Osteopathic Medicine
Male Female Total
Total 580 (57%) 442 (43%) 1,022Hispanic/Latino 11 (2%) 7 (2%) 18 (2%)White, non-Hispanic 437 (75%) 317 (72%) 754 (74%)American Indian/Alaska Native, non-Hispanic 2 (0.3%) 3 (0.7%) 5 (0.5%)Black/African American, non-Hispanic 2 (0.5%) 5 (1%) 8 (0.8%)Asian, non-Hispanic 108 (19%) 94 (21%) 202 (20%)Pacific Islander, non-Hispanic 1 (0.2%) 0 0Two or more races, non-Hispanic 1 (0.2%) 2 (0.5%) 3 (0.3%)Unkown 17 (3%) 14 (3%) 31 (3%)Nonresident alien 0 0 0
Figure 10. National Gender and Race/Ethnicity Enrollment for Osteopathic Colleges, 2014-152
Figure 11. ATSU-KCOM Gender and Race/Ethnicity Enrollment for Osteopathic Colleges, 2014-152
Figure 12. KCUMB-COM Gender and Race/Ethnicity Enrollment for Osteopathic Colleges, 2014-152

10
The fluctuation of new male and female matriculants for both institutions between 2013 and 2015 is listed in Figure 13. Attendance for Kansas City University of Medicine and Bioscience College of Osteopathic Medicine males has increased since 2013, as the attendance for females has decreased.2
Figure 13. Gender Specific Attendance for 2 Missouri Osteopathic Schools, 2013-20152
Both ATSU-KCOM and KCUMB-COM are private institutions. Nationally, tuition cost at the 25 private osteopathic colleges (2015-2016 school year mean tuition, $46,214) is higher than the six publically run Osteopathic universities (2015-2016 school year mean tuition, $28,103).2 The 2012-2013 cost of attendance for ATSU-KCOM was $74,955 for both resident and non-resident students, with an average graduate indebtedness
of $201,900. The 2012-2013 tuition cost for KCUMB-COM was approximately $10,000 less at $64,872 for both resident and non-resident students with an average graduate indebtedness of $255,000 (Figure 14).2 The varied indebtedness may be due to scholarship and financial aid differences as opposed to tuition costs. Data on years prior to 2012 were not available.
Tuition for DOs
Figure 14. Tuition and Indebtedness for both Missouri Osteopathic Colleges, 2012-20132

11
Resident physicians in Missouri are certified under the Accreditation Council for Graduate Medical Education (ACGME). To achieve residency status, medical education graduates must go through an extensive matching process which utilizes an applicant-proposing algorithm to produce the best result for the applicant.1
The National Resident Matching Program found that the majority of graduates listed certain top criteria when making match selections and ranking those selections. Although data was not available on the correlation of resident home state with resident matching state, certain top criteria may have been chosen in an attempt to be matched at the state in which residents are originally from.20
Medical school seniors chose geographic location as the highest rated criteria when selecting hospitals to match at 87%. The average ranking of importance for geographic location on a scale of 1-5, with 1 being not important at all and 5 being extremely important, was a 4.5. Having a support network in the area was listed at 53% importance with a ranking of 4.2. Independent applicants also listed
geographic location with the highest importance at 87% with a 4.2 ranking; and listed having a support network in the area at 32% with an importance ranking of 4.1. Ranking criteria had similar scores. Senior medical students scored geographic location as the third most important factor at 80% with a 4.5 importance ranking. Support network came in at 47%, and ranked a 4.3. Independent applicants also ranked geographic location third with 58% and a ranking of 4.2. Having a close support network scored 27% at a 4.2 ranking.20
Figure 15 displays the 2015-2016 national numbers of residency program applicants by sex for the specialties highlighted in this assessment. Internal Medicine consistently has higher numbers of residency applications compared to the other specialties.20
Figure 16 shows the number of residents that matched per specialty for the year of 2015 in Missouri. The number of positions available was equal to the number of positions filled for all but two of the specialties. Family Medicine had 62 vacant positions and Internal Medicine had 185 open positions.20
Residents
Figure 15. National Residency Program Applicants by Gender and Specialty, 2015-201620

12
Figure 16. Number of Residents Matched per Specialty in Missouri, 201520
The dynamic nature of physicians results in numerous specialties, geographic distribution, industry profiles, wages and an abundant amount of other variations. The following section of this analysis serves to provide a baseline assessment of Missouri’s physician workforce by providing basic information related to six of the most common physician specialties, as well as physicians and surgeons in general. Additionally, due to the use of two dynamic data sets from the Missouri Board of Registration for the Healing Arts and the Missouri Healthcare Workforce Registry and Exchange (MoHWoRx), discrepancies in total numbers may occur.
Physician Workforce Geographical Distribution
*Medical and osteopathic physician/surgeon temporary are defined as resident physicians.
*It should be noted that the information in this report was obtained on October 13, 2015 and is current as of that date.
Out of the 28,085 physicians who received a license in Missouri, 22,134 list a current primary Missouri address (this analysis includes medical physicians and surgeons, medical physician/surgeon temporary, osteopathic physicians, and osteopathic physician/surgeon temporary). The physician-to-rural population ratio is 1:364 and the physician-to-urban population ratio is 1:239.17 Figure 17 displays the physician-to-population ratio for all counties in the state of Missouri. There are 5 counties, all rural, that list only one practicing physician or surgeon of any type. Saint Louis County has the largest population of practicing physicians. Maries County has the lowest physician-to-population ratio at 1:77 and St. Francois has the highest at 1:11,035. The number of physicians per county is displayed on the map in Figure 18.

13
Figure 17. Physician-to-Population Ratio Map for Missouri Counties
Figure 18. Geographical Distribution of Physicians per Missouri County17
Texas
Pike
Dent
Ray
Polk
Cass
Bates
Linn
Barry
Howel l
Iron
Ozark
Macon
Saline
Henry
Pettis
Vernon
Wayne
Butler
Holt
Shannon
Franklin
Boone
Adair
Mil ler
OregonTaney
Benton
Carroll
Knox
Ripley
Phelps
Wright
Ral ls
Johnson
Douglas
Laclede
Clark
Dade
Osage
Jasper
Clay
Nodaway
Callaway
Greene
Cole
Perry
Lewis
Stoddard
Monroe
Audrain
Barton
Stone
Lincoln
Chariton
Reynolds
Dallas
Camden
Cedar
St. Clair
Harrison
Scott
Newton
Morgan
Sull ivan
Carter
CrawfordMaries
CooperJackson
Pulaski
Shelby
Daviess
Platte
Gentry
Dunkl in
Webster
Jefferson
Bollinger
Putnam
Lafayette
Mercer
Marion
Lawrence
Washington
Atchison
Christian
Howard
Grundy
DeKalb
Madison
Warren
Clinton
St. Louis
Andrew
Pemiscot
McDonald
St. Charles
Randolph
Scotland
Buchanan
NewMadrid
Hickory
LivingstonCaldwell
Gasconade
Moniteau
Worth
Montgomery
Mississippi
St. Francois
Cape Girardeau
Schuyler
Ste. Genevieve
St. Louis City
501 - 1,500
1,501 - 3,000
3,001 - 6,000
6,001 - 11,035
Map DetailsRatio
77 -50
Texas
Pike
Dent
Ray
Polk
Cass
Bates
Linn
Barry
Howel l
Iron
Ozark
Macon
Saline
Henry
Pettis
Vernon
Wayne
Butler
Holt
Shannon
Franklin
Boone
Adair
Mil ler
OregonTaney
Benton
Carroll
Knox
Ripley
Phelps
Wright
Ral ls
Johnson
Douglas
Laclede
Clark
Dade
Osage
Jasper
Clay
Nodaway
Callaway
Greene
Cole
Perry
Lewis
Stoddard
Monroe
Audrain
Barton
Stone
Lincoln
Chariton
Reynolds
Dallas
Camden
Cedar
St. Clair
Harrison
Scott
Newton
Morgan
Sull ivan
Carter
CrawfordMaries
CooperJackson
Pulaski
Shelby
Daviess
Platte
Gentry
Dunkl in
Webster
Jefferson
Bollinger
Putnam
Lafayette
Mercer
Marion
Lawrence
Washington
Atchison
Christian
Howard
Grundy
DeKalb
Madison
Warren
Clinton
St. Louis
Andrew
Pemiscot
McDonald
St. Charles
Randolph
Scotland
Buchanan
NewMadrid
Hickory
LivingstonCaldwell
Gasconade
Moniteau
Worth
Montgomery
Mississippi
St. Francois
Cape Girardeau
Schuyler
Ste. Genevieve
St. Louis City
22
4
7
1
196
271
6
43
10
278
18
699
3668
327
28
84
13
45
1
19
22
12
15
15
6
1
34
6
12
24
79
3
23
1
3
3
17
53
38
296
14
5
53
7
72
10
37
8
4
1275
1159
2
19
136
2
42
49
7
99
12
9
177
30
76
2
2
8
50
20
454
15
3
9
19
4
10
2
8
4
5
4
1
5
25
8
11
14
6
24
116
1606
17
14
54
163
20
175
6
21
43
170
22
3778
6048
125
25
13
21
580
53
1159
149
3
122
2 - 200
201 - 500
1,001 - 3,000
501 - 1,000
3,001 - 6,050
Map DetailsPhysicians
1
1
2 - 200
3,001 - 6,0501,001 - 3,000
201 - 500
77 -50
501 - 1,500
6,001 - 11,0353,001 - 6,000
1,500 - 3,000
Map DetailsRatio
Map DetailsRatio
14
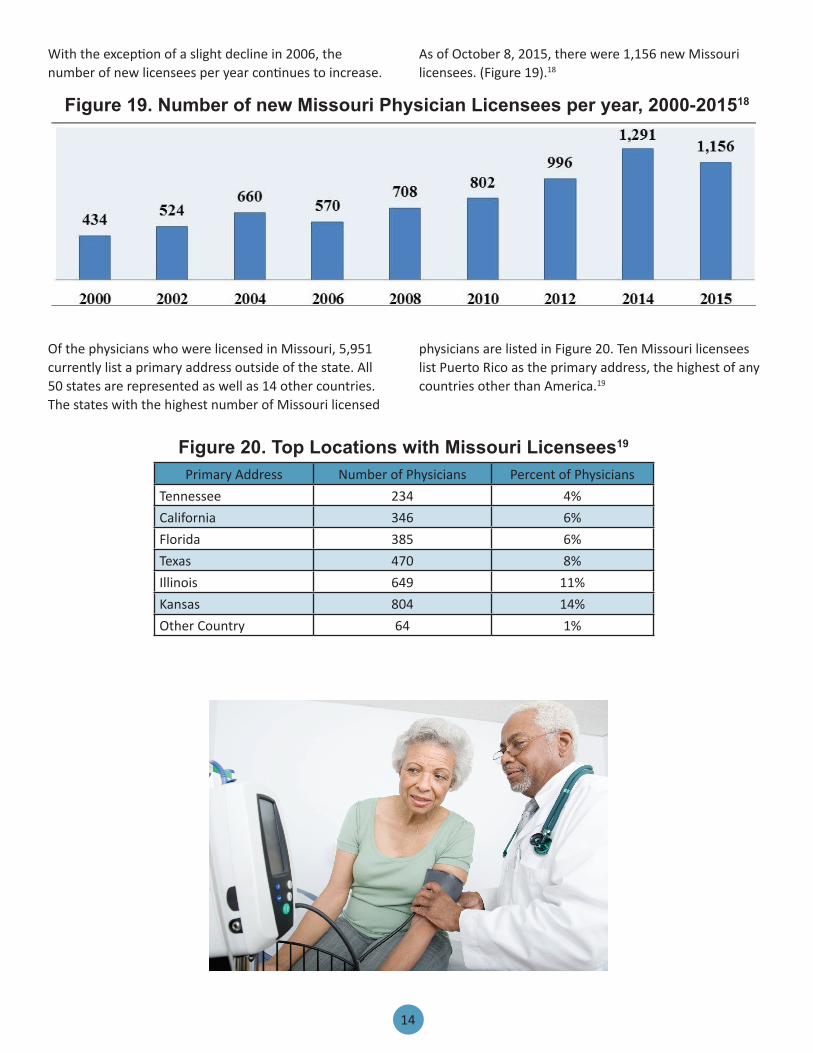
With the exception of a slight decline in 2006, the number of new licensees per year continues to increase.
Figure 19. Number of new Missouri Physician Licensees per year, 2000-201518
Of the physicians who were licensed in Missouri, 5,951 currently list a primary address outside of the state. All 50 states are represented as well as 14 other countries. The states with the highest number of Missouri licensed
Figure 20. Top Locations with Missouri Licensees19
Primary Address Number of Physicians Percent of PhysiciansTennessee 234 4%California 346 6%Florida 385 6%Texas 470 8%Illinois 649 11%Kansas 804 14%Other Country 64 1%
As of October 8, 2015, there were 1,156 new Missouri licensees. (Figure 19).18
physicians are listed in Figure 20. Ten Missouri licensees list Puerto Rico as the primary address, the highest of any countries other than America.19

15
Figure 21 compares the self-reported race groups in Missouri for the specialties highlighted in this assessment. The race classifications have been divided according to United States Census standards.21 Verbiage in the MoHWoRx database is classified differently e.g. individuals defined as Filipino, Chinese, Japanese and Korean are listed independently in MoHWoRx; these
Race have been combined under the Asian Alone group for this assessment. *Many of the licensees in MoHWoRx self-reported being Asian-Indian. Such numbers were of enough significance to categorize in their own section, although this is not defined as one of the U.S. census race groups. **The percent represents percent of the total number of physicians in highlighted specialties (10,026).19
Figure 21. Number of Employees Divided by Race and Specialty in Missouri, 201519
Race Family Pediatric General Internist
OB/GYN Psychiatrist Anesthesiologist Total for MO
**Percent
Black or African American
84 64 157 41 46 34 426 4%
American Indian & Alaskan Native
5 3 20 1 0 3 32 0.3%
Asian Alone 97 88 376 32 86 73 752 7.5%Native Hawaiian & Other Pacific Islander
4 2 9 1 2 0 18 0.2%
Two or More Races
78 62 241 22 61 32 496 5%
White alone, not Hispanic or Latino
1,994 1,264 2,162 692 478 748 7,338 73%
*Asian Indian 86 105 518 32 155 68 964 10%

16
Overall, wages for physicians and surgeons are among the highest of all occupations. Nationally, the 2012 annual median wage for a practicing primary care physician was $220,942. The median annual wage for physicians practicing medical specialties was significantly higher at $396,233. Compensation varies among the different practices.15 As of May 2014, the annual median wage for physicians and surgeons in Missouri was $197,280;
Wages
Figure 22. Comparison of the Missouri and National Annual Median Wages per Specialty14
lower than the national wage.15 In fact, of seven of the most common types of physicians, only internal medicine physicians in Missouri have a comparable annual wage to national compensation (Figure 22). The national annual wage for anesthesiologists is nearly double Missouri’s wage.14 Figure 23 displays a map of the geographical distribution of the annual mean wage per state for physicians and surgeons.12

17
WA
OR
AZ
TX
AK
NVCA
NM
MOKS
NE
SD
OH
MT
IL
MI
ND
CO
WY
UT
MS
FL
ID
VAKY
GA
PA
LA
SC
NC
ME
NY
VT
AL
AR
TN
IA
OK
WI
MN
RI
HI
NJ
CT
NHMA
MDDE
PR
WV
NEIN
DC
Figure 23. Bureau of Labor Statistics12
Blank areas indciate data not available
$124,030 - $175,940$200,420 - $210,870
$180,050 - $198,060$211,810 - $235,150
Annual mean wage of physicians and surgeons, all other, by state. May 2014
The level of employment varies per industry nationwide. The top five industries of employment are listed in Figure 24
Employment
Industry Employment Hourly mean wage Annual mean wageOffices of Physicians 140,920 $107.49 $223,580General Medical and Surgical Hospitals
97,820 $69.65 $144,870
Federal Executive Branch (OES Designation)
31,990 $95.16 $197,930
Colleges, Universities and Professional Schools
9,840 $51.33 $106,760
Figure 24. National Physician Industry Employment and Wage Profile12
Annual Mean Wage
with Offices of Physicians being the lead employer as well as the highest paying industry of those listed.12

18
Available data on primary settings for Missouri licensees are listed in Figure 25. Hospitals and private offices
Primary Setting Number of Practicing Physicians Percent of Practicing PhysiciansHospital 7,350 33%Private Office 7,160 32%School of Medicine 1,341 6%Community Health Center 763 3%Military/Federal Facility 299 1%University/College 145 0.7%Correctional Facility 139 0.6%Nursing Home/Long Term Care Facility 110 0.5%Free Clinic 86 0.4%Group Health Plan (HMO) 76 0.3%Palliative/Hospice 58 0.3%Public Health 35 0.2%
Figure 25. Number of Practicing Missouri Physicians per Primary Setting19
The number of Missouri licensees by reported primary specialty group is displayed in Figure 26. Internal medicine is the most common primary medical specialty in Missouri.19
Medical Specialty Group Primary SpecialtyInternal Medicine 3,483Family/General Medicine 2,348Pediatrics 1,588Emergency Medicine 966Anesthesiology 958Radiology 858General Surgery 853Psychiatry 828Obstetrics/Gynecology 819Cardiology 568Orthopedic 456Ophthalmology 392Neurology 385Oncology 264Otolaryngology 252Urology 220Dermatology 218Physical Medicine/Rehab 171Plastic Surgery 146Neurological Surgery 144Endocrinology 95Allergy/Immunology 81Geriatrics 26Medical Genetics 11
Figure 26. Number of Practicing Missouri Physicians per Primary
Specialty19
employ the highest number of physicians with significantly higher numbers than all other areas.19

19
Family and general physicians commonly have regular, long-term patients. Their job duties involve assessment, treatment and prevention of a range of conditions and injuries that occur in everyday life for the general population.15
As of October 13, 2015, there were 2,348 family and general physicians practicing in Missouri. Every Missouri county is listed as having at least one family/general
physician. The counties with the lowest number of family/general physicians are Bollinger, Daviess, Hickory, Holt, Knox, Mercer, Oregon, Ralls, Worth and Shelby. All 10 of these counties list one practicing physician and all are defined as rural. The top five counties with the highest level of employment for family/general physicians are all urban. They include Clay, Boone, Greene, Jackson and St. Louis County (Figure 27).19
Family and General Physicians
County Number of Practicing Family and General Physicians
St. Louis County 320Jackson 293Greene 138Boone 126Clay 99
Figure 27. Missouri Counties with the Highest Number of Practicing Family & General Physicians19
The national median annual wage for this specialty is $180,180. The Missouri mean annual wage is $149,320. Figure 28 shows the percentile break down of the Missouri and national annual wage as of May 2014. Figure
29 displays the annual mean wage of family and general practitioners per state.8 The annual wages for Missouri and the nation in both the 75th and 90th percentile are greater than or equal to $187,999 (>=187,999).8
Figure 28. Comparison of the Missouri and National Annual Wage Percentiles for Family & General Practitioners8
Percentile 10% 50% (Median) 90%Missouri Annual Wage $51,960 $149,320 >=$187,999National Annual Wage $72,190 $180,180 >=$187,999

20
$71,200 - $171,480$184,860 - $196,380
$171,980 - $184,450$198,120 - $231,110
Figure 29. Bureau of Labor Statistics8
Annual mean wage of family and general practioners, by state. May 2014
The industry profile for Family and General Physicians is displayed in Figure 30. In coordination with the Physicians
Figure 30. National Family and General Physician Industry Employment and Wage Profile8
Industry Employment Hourly Mean Wage Annual Mean WageOffices of Physicians 82,980 $92,87 $193,170General Medical and Surgical Hospitals 22,730 $84.96 $176,720Outpatient Care Centers 6,850 $93.32 $194,110Colleges, Universities and Professional Schools 4,020 $47.74 $99,300Local Government (OES Designation) 1,690 $81.27 $169,030
Annual Mean Wage
Blank areas indciate data not available
and Surgeons industry profile, Offices of Physicians is listed as the top employer at 3.38% of industry employment.8
WA
OR
AZ
TX
AK
NVCA
NM
MOKS
NE
SD
OH
MT
IL
MI
ND
CO
WY
UT
MS
FL
ID
VAKY
GA
PA
LA
SC
NC
ME
NY
VT
AL
AR
TN
IA
OK
WI
MN
RI
HI
NJ
CT
NHMA
MDDE
PR
WV
NEIN
DC
21
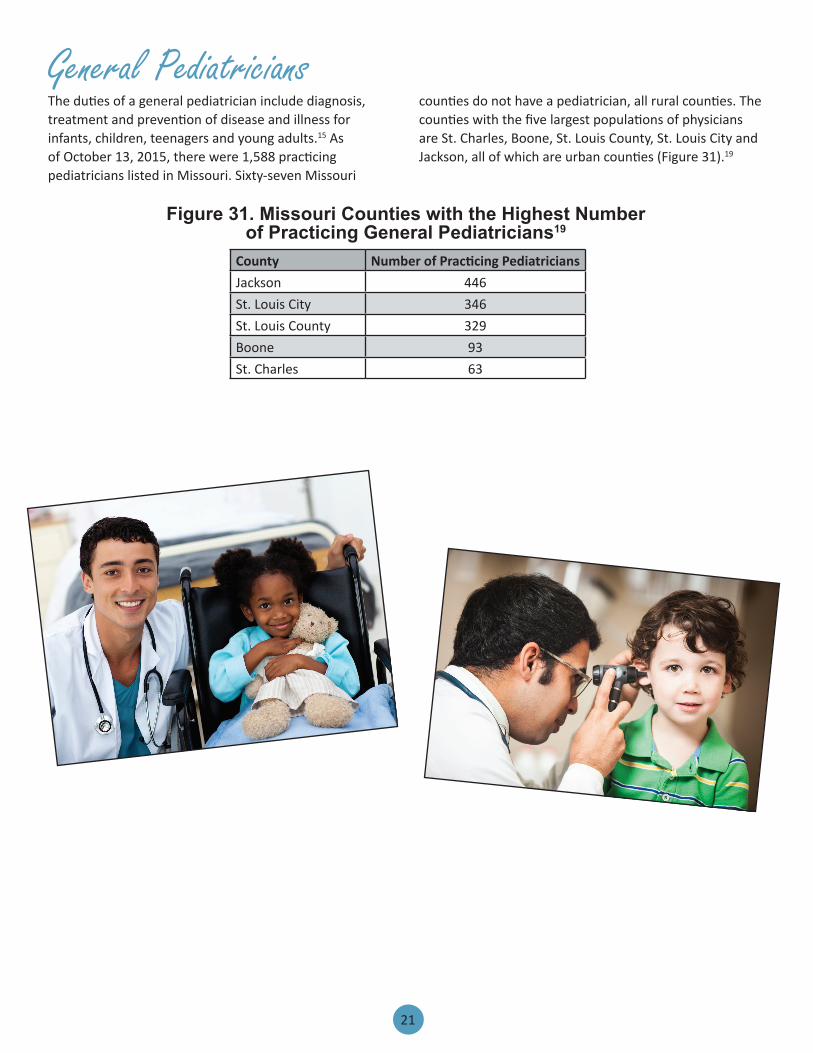
The duties of a general pediatrician include diagnosis, treatment and prevention of disease and illness for infants, children, teenagers and young adults.15 As of October 13, 2015, there were 1,588 practicing pediatricians listed in Missouri. Sixty-seven Missouri
counties do not have a pediatrician, all rural counties. The counties with the five largest populations of physicians are St. Charles, Boone, St. Louis County, St. Louis City and Jackson, all of which are urban counties (Figure 31).19
General Pediatricians
County Number of Practicing PediatriciansJackson 446St. Louis City 346St. Louis County 329Boone 93St. Charles 63
Figure 31. Missouri Counties with the Highest Number of Practicing General Pediatricians19

22
$61,530 - $158,850$181,880 - $188,050
$158,860- $178,800$189,010 - $236,690
Figure 32. Bureau of Labor Statistics11
Annual mean wage of pediatricians, by state. May 2014
Blank areas indciate data not available
Annual Mean Wage
The median annual wage nationally for general pediatricians is $163,350. The median annual wage for Missouri is slightly higher at $181,270. The mean wage per year for the state is $178,800. Figure 32 portrays the
annual mean wage for pediatricians by state. Missouri is listed in the second highest income group. Figure 33 displays a comparison between national and state percentile wages as of May 2014.11
WA
OR
AZ
TX
AK
NVCA
NM
MOKS
NE
SD
OH
MT
IL
MI
ND
CO
WY
UT
MS
FL
ID
VAKY
GA
PA
LA
SC
NC
ME
NY
VT
AL
AR
TN
IA
OK
WI
MN
RI
HI
NJ
CT
NHMA
MDDE
PR
WV
NEIN
DC
23
Area Name Annual 10th Percentile Wage Annual Median Wage Annual 90th Percentile WageMissouri $68,860 $181,1270 >=$187,999Nation $93,120 $163,350 >=$187,999
Offices of Physicians are once again the top employer at 0.96% of industry employment. Offices of Physicians ($179,170) are listed as the second highest payer in the top industry employers, following Specialty Hospitals ($209,140), Figure 34.11
Figure 33. Comparison of the Missouri and National Annual Wage Percentiles for Pediatricians10
Industry Employment Hourly Mean Wage Annual Mean WageOffices of Physicians 23,590 $86.14 $179,170General Medical and Surgical Hospitals
4,810 $79.50 $165,370
Otpatient Care Centers 1,280 $85.19 $177,190Colleges, Universities and Professional Schools
690 $49.34 $102,630
Specialty (except Psychiatric and Substance Abuse) Hospitals
330 $100.55 $209,140
Figure 34. National Pediatrician Industry Employment and Wage Profile11
General internists (internal medicine) are physicians who diagnose and provide non-surgical treatment for a range of problems that affect the internal organ systems such as; liver, kidney, stomach and the digestive tract in adult patients.15
As of October 13, 2015, there were 3,483 General internists listing employment in Missouri. This is the highest number of employment of all the specialties listed. This is due to the fact that internal medicine
General Internists
County Number of Practicing General InternistsSt. Louis County 1087Jackson 557St. Louis City 488Boone 234Greene 190
doctors have numerous subspecialties including gastroenterology, infectious disease, critical care medicine, nephrology, pulmonary disease, rheumatology, and vascular medicine.19
There are 37 Missouri counties who do not have a practicing internal medicine physician, all being rural. The counties with the highest number of general Internists are Greene, Boone, St. Louis City, Jackson and St. Louis County, all urban (Figure 35).19
Figure 35. Missouri Counties with the Highest Number of Practicing General Internists19

24
The national median annual wage is equal to or greater than $187,199 (>=187,999) according to the Bureau of Labor Statistics. The median wage for Missouri is also listed as >= 187,999 per year. The mean wage per year for
Figure 36. Bureau of Labor Statistics9
$89,460 - $181,610$205,970 - $219,450
$181,680- $205,170$219,450 - $247,110
Annual mean wage of internists, general, by state. May 2014
In conjunction with family physicians and pediatricians, offices of physicians are the highest industry employer at
Figure 37. National General Internists Industry Employment and Wage Profile9
Industry Employment Hourly Mean Wage Annual Mean WageOffices of Physicians 32,790 $99.79 $207,560General Medical and Surgical Hospitals
11,510 $72.07 $149,900
Outpatient Care Centers 1,800 $94.67 $196,900Colleges, Universities and Professional Schools
1,090 $41.60 $86,540
Home Health Care Services 210 $101.62 $211.360
Annual Mean Wage
Blank areas indciate data not available
the state is $246,760. Missouri is listed as the third highest paying state in the nation for this specialty. 9 Figure 36 depicts the annual mean wage per state.
1.33% (Figure 37). This industry is also the highest payer of the top five employers for general internists.9
WA
OR
AZ
TX
AK
NVCA
NM
MOKS
NE
SD
OH
MT
IL
MI
ND
CO
WY
UT
MS
FL
ID
VAKY
GA
PA
LA
SC
NC
ME
NY
VT
AL
AR
TN
IA
OK
WI
MN
RI
HI
NJ
CT
NHMA
MDDE
PR
WV
NEIN
DC
25
Physicians specializing in this area provide medical care related to pregnancy, childbirth and the female reproductive system. They also diagnose, treat and help prevent diseases affecting women such as cervical cancer, breast cancer, hormonal disorders and symptoms related to menopause.15
As of October 13, 2015, there were 819 OB/GYN physicians listed as practicing in Missouri. Sixty- four Missouri counties do not have a practicing OB/GYN, all of these being rural counties. The five counties with the highest number of employment in this specialty are Boone, Greene, St. Louis City, Jackson and St. Louis County (Figure 38).19
County Number of Practicing OB/GYNsSt. Louis County 268Jackson 128St. Louis City 76Greene 47Boone 43
Figure 38. Missouri Counties with the Highest Number of Practicing OB/GYNs19
Nationally the annual median wage for OB/GYNs is >= $187,999. The median wage for Missouri is also listed as >= 187,999 per year. The annual 10th percentile wage for Missouri as of May 2014 was 148,130 so it can be assumed that the median wage is significantly higher. The
annual mean wage for the state is $237,450. 10 Kansas City and St. Louis are listed as having the highest number of employed OB/GYNs.14 Figure 39 shows the annual mean wage for all the states. Out of the four wage divisions, Missouri is in the third.10
WA
OR
AZ
TX
AK
NVCA
NM
MOKS
NE
SD
OH
MT
IL
MI
ND
CO
WY
UT
MS
FL
ID
VAKY
GA
PA
LA
SC
NC
ME
NY
VT
AL
AR
TN
IA
OK
WI
MN
RI
HI
NJ
CT
NHMA
MDDE
PR
WV
NEIN
DC
Figure 39. Bureau of Labor Statistics10
Annual mean wage of obstetricians and gynecologists, by state. May 2014
Blank areas indciate data not available
Obstetricians and Gynecologists (OB/GYNs)
$83,000 - $181,610$229,980 - $419,380
$203,900 - $228,,460$242,200 - $264,050
Annual Mean Wage

26
The industry with the highest level of employment is the Offices of Physicians at 0.68%. Outpatient Care Centers and Specialty Hospitals employ fewer OB/GYNs, yet have
Industry Employment Hourly Mean Wage Annual Mean WageOffices of Physicians 16,820 $104.70 $217,780General Medical and Surgical Hospitals 3,550 $98.92 $205,750Outpatient Care Centers 870 $105.83 $220,120Colleges, Universities and Professional Schools 250 $50.67 $105,400Specialty (except Psychiatric and Substance Abuse) Hospitals
50 $108.87 $226,450
Figure 40. National OB/GYN Industry Employment and Wage Profile10
Psychiatrists are primary mental health physicians. They diagnose, prevent and treat disorders of the mind through a combination of medication, hospitalization, psychoanalysis and psychotherapy (personal counseling).15
As of October 13, 2015, there were 828 practicing
Psychiatrist
County Number of Practicing PsychiatristsSt. Louis County 208Jackson 133St. Louis City 114Boone 76Greene 39
The national median annual wage for psychiatrists is $181,880 compared with Missouri’s which is significantly lower at $136,980 (Figure 42). The mean annual wage of the state is $162,620.12 As of May 2014, St. Louis (260) and Kansas City (200) were listed as having the highest level
Area Name Annual 10th Percentile Wage
Annual Median Wage Annual 90th Percentile Wage
Missouri $72,980 $136,980 >=$187,999Nation $61,600 $181,880 >=$187,999
Figure 42. Comparison of the Missouri and National Annual Wage Percentiles for Psychiatrists13
the two highest wages for this professional group (Figure 40).10
psychiatrists listed in Missouri. There are 58 counties, all rural that do not have a practicing psychiatrist. The five counties, all urban, with the highest number of employed psychiatrists are Greene, Boone, St. Louis City, Jackson and St. Louis County (Figure 41).15
of employed psychiatrists in Missouri. The mean annual income for Kansas City is higher than that of the state at $222,650.14 Figure 43 shows the annual mean wage of psychiatrists by state. Missouri is in the section with the lowest yearly wages.13
Figure 41. Missouri Counties with the Highest Number of Practicing Psychiatrists19

27
Figure 43. Bureau of Labor Statistics13
$87,890 - $162,620$187,920 - $206,590
$164,890- $187,050$208,830 - $260,820
Annual mean wage of psychiatrists, by state. May 2014
Blank areas indciate data not available
Annual Mean Wage
The top industry employer for mental health physicians are offices of physicians with 0.31% industry employment (Figure 44). Although many of the industry profiles were
Industry Employment Hourly Mean Wage Annual Mean WageOffices of Physicians 7,570 $84.20 $175,140Psychiatric and Substance Abuse Hospitals 3,690 $85.56 $177,960Outpatient Care Centers 3,450 $94.62 $196,820General Medical and Surgical Hospitals 3,220 $82.53 $171,660Local Government (OES Designation) 1,430 $94.00 $195,510
Figure 44. National Psychiatrist Industry Employment and Wage Profile13
similar for family practitioners, pediatricians, general internists, and OB/GYNs; the psychiatric profile is slightly different.13
WA
OR
AZ
TX
AK
NVCA
NM
MOKS
NE
SD
OH
MT
IL
MI
ND
CO
WY
UT
MS
FL
ID
VAKY
GA
PA
LA
SC
NC
ME
NY
VT
AL
AR
TN
IA
OK
WI
MN
RI
HI
NJ
CT
NHMA
MDDE
PR
WV
NEIN
DC

28
Anesthesiologists are physicians who administer drugs (anesthetics) prior to, during, or after surgery or other medical procedures, to reduce to sensation of pain. During an operation they are responsible for monitoring the patient’s breathing, body temperature, blood pressure and heart rate.15
Anesthesiologist
County Number of Practicing OB/GYNsSt. Louis County 277Jackson 179St. Louis City 134Boone 63Greene 54
Figure 45. Missouri Counties with the Highest Number of Practicing Practicing Anesthesiologists19
As of October 13, 2015, there were 958 anesthesiologists listed as practicing in Missouri. There are a total of 77 Missouri counties, all defined as rural, that do not have a practicing anesthesiologist. The five counties that have the highest number of anesthesiology employment are Greene, Boone, St. Louis City, Jackson and St. Louis County, all urban counties. (Figure 45).19
Both the median annual wage for the nation and Missouri in this specialty is greater than or equal to $187,199. The
mean annual wage for Missouri is $228,550. Annual wage by state is portrayed in Figure 46.7

29
Figure 46. Bureau of Labor Statistics7
$76,200 - $218,460$245,690 - $251,990
$227,070 - $245,330$252,730 - $263,320
Annual mean wage of anesthesiologists, by state. May 2014
Blank areas indciate data not available
Annual Mean Wage
Industry Employment Hourly Mean Wage Annual Mean WageOffices of Physicians 25,300 $123.19 $256,230General Medical and Surgical Hospitals 3,220 $92.29 $191,970Outpatient Care Centers 550 $116.42 $242,150Colleges, Universities and Professional Schools 500 $64.61 $134,400Specialty (except Psychiatric and Substance Abuse) Hospitals
220 $91.62 $190,570
Figure 47. National Anesthesiologist Industry Employment and Wage Profile7
WA
OR
AZ
TX
AK
NVCA
NM
MOKS
NE
SD
OH
MT
IL
MI
ND
CO
WY
UT
MS
FL
ID
VAKY
GA
PA
LA
SC
NC
ME
NY
VT
AL
AR
TN
IA
OK
WI
MN
RI
HI
NJ
CT
NHMA
MDDE
PR
WV
NEIN
DC

30
1. Accreditation Council for Graduate Medical Education. Data Collection Systems. Accessed January 7, 2016 at https://www.acgme.org/acgmeweb/.
2. American Association of Colleges of Osteopathic Medicine. AACOM Reports. Accessed November 5, 2015 at http://www.aacom.org/reports-programs-initiatives/aacom-reports.
3. American Board of Medical Specialties. About Board Certified Doctors. Accessed November 13, 2015 at http://www.certificationmatters.org/about-board-certified-doctors/about-board-certification.aspx.
4. American Medical Association. Requirements for Becoming a Physician. Accessed October 8, 2015 at http://www.ama-assn.org/ama/pub/education-careers/becoming-physician.page.
5. American Osteopathic Association. What is a DO? Accessed October 22,2015 at http://www.osteopathic.org/osteopathic-health/about-dos/what-is-a-do/Pages/default.aspx.
6. Association of American Medical Colleges. FACTS: Applicants, Matriculants, Enrollment, Graduates, MD/PhD, and Residency Application Data. Accessed November 4, 2015 at https://www.aamc.org/data/facts/.
7. Bureau of Labor Statistics. Occupational Employment and Wages, May 2014. Anesthesiologists. Accessed October 14,2015 at http://www.bls.gov/oes/current/oes291061.htm.
8. Bureau of Labor Statistics. Occupational Employment and Wages, May 2014. Family and General Practitioners. Accessed October 14,2015 at http://www.bls.gov/oes/current/oes291062.htm.
9. Bureau of Labor Statistics. Occupational Employment and Wages, May 2014. Internists, General.Accessed October 14,2015 at http://www.bls.gov/oes/current/oes291063.htm.
10. Bureau of Labor Statistics. Occupational Employment and Wages, May 2014. Obstetricians and Gynecologists. Accessed May 14,2015 at http://www.bls.gov/oes/current/oes291064.htm.
11. Bureau of Labor Statistics. Occupational Employment and Wages, May 2014. Pediatricians, General. Accessed October 14,2015 at http://www.bls.gov/oes/current/oes291065.htm.
12. Bureau of Labor Statistics. Occupational Employment and Wages. Physicians and Surgeons, All Other. Accessed October 9, 2015 at http://www.bls.gov/oes/current/oes291069.htm.
13. Bureau of Labor Statistics. Occupational Employment and Wages May 2014. Psychiatrists. Accessed October 14,2015 at http://www.bls.gov/oes/current/oes291066.htm.
14. Bureau of Labor Statistics. Occupational Employment Statistics Query System. Accessed October 13, 2015 at http://data.bls.gov/oes/search.jsp?data_tool=OES.
15. Bureau of Labor Statistics. Occupational Outlook Handbook. Physicians and Surgeons. Accessed October 8, 2015 at h ttp://www.bls.gov/ooh/healthcare/physicians-and-surgeons.htm.
16. Health Resources and Services Administration. Designated Health Professional Shortage Areas Statistics. Accessed October 23, 2015.
17. Missouri Code of State Regulations, 20 CSR 2150-2.
18. Missouri Division of Professional Registration, Missouri Board of Registration for the Healing Arts. Downloadable Listings. Medical Physician & Surgeon. Accessed October 8, 2015 at http://pr.mo.gov/listings-heal.asp.
19. Missouri Healthcare Workforce Registry and Exchange. Physicians. Accessed October 22, 2015 at https://webapp01.dhss.mo.gov/Login/Login.aspx?ReturnUrl=%2fMoHWoRXAdmin%2fDefault.aspx.
20. The National Resident Matching Program. Match Data. Accessed January 7, 2016 at http://www.nrmp.org/.
21. United States Census. State and County QuickFacts: Missouri. Accessed November 24, 2015 at http://quickfacts. census.gov/qfd/states/29000.html.
Sources
31
Missouri Department of Health and Senior ServicesOffice of Primary Care and Rural Health
P. O. Box 570Jefferson City, MO 65102-0570
573.751.6219health.mo.gov
For an electronic copy of the report, visit:http://health.mo.gov/living/families/ruralhealth/publications.php
Oral HealthRural Health
Primary Care
O�ce of PrimaryCare & Rural Health
Missouri
Alternate forms of this publication for persons with disabilities may be obtained by contacting the Missouri Department of Health and Senior Services, Office of Primary Care and Rural
Health, P.O. Box 570, Jefferson City, MO 65102, 573.751.6219.
Hearing- and speech-impaired citizens can dial 711.
AN EQUAL OPPORTUNITY/AFFIRMATIVE ACTION EMPLOYER
Services provided on a nondiscriminatory basis.