poised for digital growth - ub.unibas.ch
TRANSCRIPT

Poised for digital growthPreserving profitability in today’s digital world
Media & Entertainment

Global Media & Entertainment Centerii
About this report

Poised for digital growth: Preserving profi tability in today’s digital world iii
Seventy-fi ve media and entertainment company CFOs share their points of view on the digital landscape and how changing business models are shaping the future of the industry.
The CFOs we interviewed represent leading global
companies with combined annual revenues of
approximately US $300 billion. They broadly span the
media and entertainment industry in sector, size and
geography.
To augment our interview findings, we have used
secondary research and Ernst & Young analyses to
provide depth and context.
We promote an environment of openness and candor
during the interview process. As such, none of the
comments or quotes made by respondents and used
in this report have been attributed. We would like to
take a moment to thank all participants for the time
and the insights they generously provided. They were
instrumental in the creation of this report.

Global Media & Entertainment Centeriv
Thomas S. Summer
CFO
Advance Publications
Nick Priday
CFO
Aegis Group plc
Craig Ramsey
EVP and CFO
AMC Entertainment, Inc.
Kenneth J. Dale
SVP and CFO
The Associated Press
Claude Gagnon
SVP and CFO
Astral Media Inc.
Lothar Lanz
CFO
Axel Springer AG
Anthony Staffi eri
SVP Finance
Bell Canada
R. Shankar Narayan
CFO
Bennett Coleman & Co. Ltd.
Jim Hedges
EVP and CFO
ABC Television Network & Studios
Gord Nelson
CFO
Cineplex Entertainment LP
John H. Bell
CFO
Cinram International Inc.
Name withheld
Cogeco Cable, Inc.
Tom Peddie
CFO
Corus Entertainment Inc.
Michael Huseby
EVP and CFO
Cablevision Systems Corporation
Participating CFOs and executives

vPoised for digital growth: Preserving profi tability in today’s digital world
Mark F. Bowser
EVP and CFO
Cox Communications, Inc.
John Gossling
FCA, CFO
CTVglobemedia Inc.
P.G. Mishra
Group CFO
DB Corp Ltd.
Michael Gunter
EVP and CFO
Deluxe Entertainment Services Group Inc.
Bradley Singer
SEVP and CFO
Discovery Communications, Inc.
Lewis Coleman
President and CFO
DreamWorks Animation SKG, Inc.
Giles Willits
CFO
E1 Entertainment
David Ebersman
CFO
Facebook, Inc.
Brian Cassell
CFO
Fairfax Media Limited
Peter Tonagh
CFO
Foxtel Management Pty Limited
Piyush Gupta
CFO
HT Media Ltd.
Tom Fuelling
SVP and CFO
Hulu, LLC
Patrick T. Doyle
EVP and CFO
DirecTV
Frank Mergenthaler
EVP and CFO
Interpublic Group of Companies
Ian Griffi ths
Finance Director
ITV plc
Gérard Degonse
Chief Financial and Administrative Offi cer
JC Decaux SA
Peter Ingram
CFO
Keystone Entertainment
Bernie Dvorak
Co-CFO and Chief Accounting Offi cer
Liberty Global, Inc.
Christopher Shean
SVP and Controller
Liberty Media Corporation
Jim Keegan
CFO
Lions Gate Entertainment Corp.
Kathy Willard
EVP and CFO
Live Nation, Inc.

Global Media & Entertainment Centervi
Gordon Dyer
CFO
McGraw-Hill Ryerson Limited
Bedi A. Singh
President Finance and Administration, CFO, Offi ce of CEO
Metro-Goldwyn-Mayer Studios, Inc.
Clare Battellino
CFO
Photon Group Limited
Fabio Belli
Planning and Control Director
RAI Radiotelevisione Italiana SpA
Bryant Pike
CFO
Rainmaker Entertainment Inc.
MH Armour
CFO
Reed Elsevier Group plc
Shibasish Sarkar
CFO
Reliance Big Pictures
Shannon Valliant
VP Financial Operations
Rogers Media Inc.
Maureen O’Connell
EVP, Chief Administrative Offi cer and CFO
Scholastic Corporation
Thomas Hearne
CFO
Score Media Inc.
Silvio Santostefano
CFO
Sensis
Peter Lewis
CFO
Seven Network Limited
Kevin Kelleher
EVP and CFO
Sony Music Entertainment
David C. Hendler
SEVP and CFO
Sony Pictures Entertainment
Craig Harnett
SEVP and CFO
National Hockey League
R.D.S. Bawa
Group CFO
Network 18 Media & Investments Ltd.
James Follo
SVP and CFO
The New York Times Company
John P. Nallen
EVP and Deputy CFO
News Corporation
Stephen Rue
CFO
News Limited
Shad L. Burke
CFO
Outdoor Channel Holdings, Inc.
Pat O’Sullivan
CFO
PBL Media P/L
Robin Freestone
CFO
Pearson plc
Luke Littlefi eld
COO
Mitchell Communication Group
Jonathan Mariner
EVP and CFO
Major League Baseball
Participating CFOs and executivescontinued

viiPoised for digital growth: Preserving profi tability in today’s digital world
John Martin
CFO
Time Warner Inc.
David Holland
President and CEO (former CFO)
Torstar Corporation
Sean R. Gamble
EVP and CFO
Universal Studios
Andrew Hobson
CFO
Univision Communications Inc.
Norman McKeown
Group Finance Director
UTV Media plc
Rajeev Wagle
CFO
UTV Software Communications Limited
Thomas E. Dooley
SEVP, Chief Administrative Offi cer and CFO
Viacom Inc.
Julie Raffe
CFO
Village Roadshow Limited
Steven Macri
EVP and CFO
Warner Music Group
Hitesh Vakil
Director Finance
Zee Entertainment Enterprises Limited
Laurent Boissel
Group CFO
Zodiak Entertainment
Mark Vranesh
CFO
Zynga Game Network, Inc.
Tim Zahavich
CFO
St. Joseph Corporation
Kin-Man Lee
CFO
Sun Media Corporation
Lainie Goldstein
CFO
Take-Two Interactive Software, Inc.
Atul Bansal
CFO
Tata Sky Ltd.

Global Media & Entertainment Centerviii
The methodology
As part of the interview process, we asked CFOs to provide and rank their top
three responses to 11 questions. These questions focused on the industry as a
whole, as well as specific areas within each CFO’s organization.
We asked them to rank their answers in order of importance. Responses to each
question have been quantified and reflected in the bar charts that appear in this
report. For each response, the rankings are indicated by color and the combined
percentage for each response is provided. Responses that received less than a 20%
response rate from CFOs have been omitted from the charts.

1Poised for digital growth: Preserving profi tability in today’s digital world
Table of contents
2 Overview
5 Keeping pace with the digital imperative
New technology adoption has increased at a pace not known before in media
industries. Much of this growth is driven by the robust nature of broadband and
mobile platforms and consumers’ enthusiastic embrace of them.
11 Anticipating shifts in consumer demand
Shifting consumer patterns have the majority of CFOs worried; they are
influencing how their companies protect their market position and ensure the
continued viability of their business.
19 Driving growth and dealing with revenue declines
As the economy continues its recovery, CFOs are seeking to galvanize digital
growth opportunities that are relevant for their business sectors. At the same
time, they are searching for the digital business models that slow declining
digital per-unit prices and product unbundling.
27 Staying lean in a recovering economy
With declines in per-unit revenue and the global economic downturn, companies
have cut costs across the organization more deeply than ever before. Areas
once immune to cost-cutting measures — including creative business units — have
come under scrutiny.
31 Defining success
As CFOs assess the landscape, they know they face some tough challenges.
They believe that their key to success will come from balance — between digital
and traditional media, consumer demands and company offerings, investing
money in new growth opportunities, and saving money through cost cutting and
operational efficiencies.

Their focus was on the digital revolution,
which was transforming how consumers
accessed information and entertainment,
and forcing them to reexamine their
traditional media models.
The global economic downturn placed
additional pressure on media and
entertainment companies. While
companies reacted quickly with cost
initiatives, most remained focused on
investing in digital as a key strategic area
of growth.
It is now 2010 and many believe
that the worst of the recession has
passed. For this study — our fourth in
a series focused on senior media and
entertainment executives — we turn to
the CFOs of 75 leading global media and
entertainment organizations to ask them
for insights into their approaches to the
present and preparations for the future.
As they consistently share with us, their
focus is on the changing digital world and
how those changes are impacting their
customers’ media consumption habits
and their own companies’ operations.
Ultimately, as CFOs survey the
landscape, they see an equitable
balance of focus shared across investing
in digital growth, managing costs,
recruiting and retaining talent, and
achieving financial goals as key to their
company’s financial success.
When Ernst & Young last interviewed media and entertainment CEOs in 2008, few had anticipated the events that would unfold in the months that followed.
Global Media & Entertainment Center2
Overview

Digital is now. New technology — broadband and mobile in particular — is having a
powerful influence on how consumers experience information and entertainment.
The shift to digital is challenging old business models and increasingly driving
C-Suite investment decisions.
CFOs are worried about shifts in consumer patterns. Consumers’ migration to
digital is influencing how companies determine where they need to invest their
money — to protect their market position and ensure the continued viability of
their business.
Anticipating changing consumer demand means having timely and relevant
trend data. CFOs want to improve their understanding of how their customers and
their competition are navigating the current landscape, and how they can better
anticipate future developments.
CFOs are trying to manage a balance between digital growth and declining
traditional media revenue. CFOs say they are finally seeing meaningful growth in
digital revenues, but price deflation and product unbundling, combined with the
global economic downturn, are placing increasing pressure on traditional media
revenues. As a result, total industry revenues and “per unit spend” on items of
media content are stagnant.
Interactive media companies are best positioned to thrive in the next two to
three years. CFOs are not losing sight of their traditional roots. Digital earnings
are on the rise, but they are doing so at lower price points and are still small in
relation to traditional media revenue streams.
Bolt-on acquisitions will serve as a key driver of growth. In the next year or
two, CFOs are seeking to take the path of least resistance regarding growth. They
see bolt-on acquisitions as having the highest probabilities of success.
Nothing is off limits when it comes to cost savings. Areas once immune to
cost-cutting measures — including creative business units — have come under
scrutiny. They continue to reorganize for increased efficiency, and they are
exploring new opportunities for savings — opportunities that may include
outsourcing and co-sourcing.
Summary of key points
3Poised for digital growth: Preserving profi tability in today’s digital world

Global Media & Entertainment Center4
On to the report!

5Poised for digital growth: Preserving profi tability in today’s digital world
Keeping pace with the digital imperative
Technology has always been an enabler for media change. But the accelerated speed at which new technologies are being introduced and adopted by consumers is making it challenging for media and entertainment companies to keep up.
In the first 65 years of the 20th century, three significant technological advances
had an impact on the industry — radio in 1920, television in 1950 and cable in 1965.
In the late 1970s and 1980s the pace of new technology picked up speed with the
introduction of VCRs, video games, wireless devices, the personal computer, the
internet and DVD players.
Since 1998, the acceleration of new technology has reached warp speed. MP3 players,
broadband, video on demand (VOD), satellite radio, social networking, digital media
adapters, HDTV, Blu-Ray and online gaming have exploded into the marketplace.
And the technologies that were introduced in the 1980s — cellular phones, PCs and
the internet — have taken on new significance since they were launched. Once niche
market products for advanced technological wizards, they are now seen, especially in
developed world markets, as must-haves that even the most technophobic consumer
cannot live without. We no longer have cell phones, we have smart phones. PCs range
from desktop to laptop to tablet. And the internet has gone from an obscure form of
communication to a global information and entertainment phenomenon that covers any
topic in any category anywhere in the world.
New technology hits warp speed
“The degree of change in the last five years is unprecedented…As new technology
emerges it will be an interesting time for a lot of big players. Who knows what the
industry will look like in five years’ time.” – survey respondent

6 Global Media & Entertainment Center
1 Source: “Communications Industry Forecast,” Veronis Suhler Stevenson, 2003, 2005, 2007 and 2009; “Population: Households, Families, Group Quarters ,” US Census
Bureau website, www.census.gov/compendia/statab/cats/population/households_families_group_quarters.html, accessed 2 October 2009; “Statistical Abstract
of the United States,” US Census Bureau, 1996, 2003, 2006; “Falling Through the Net II: New Data on the Digital Divide,” US Department of Commerce, National
Telecommunications & Information Administration, 1998; “Worldwide Broadband Services 2005-2009,” IDC, 2005; “Worldwide Mobile Phone Forecast & Analysis,” IDC,
2003; “Worldwide Mobile Phone 2005-2009 Forecast Update,” IDC, 2005; “US Home Networking 2004-2008 Forecast,” IDC, 2005; “Worldwide and US DVR 2004-2008
Forecast,” IDC, 2004; “Worldwide & US DVR 2005-2009 Forecast,” IDC, 2005; “TV Basics: Television Households,” TV Bureau of Advertising website, citing Nielsen Media
Research, www.tvb.org/rcentral/mediatrendstrack/tvbasics/02_TVHouseholds.asp, accessed 1 September 2008; “TV, DVD and VCR Household Penetration in the US,”
eMarketer, 1 September 2005, citing data from Veronis Suhler Stevenson; “Mobile Users and Usage,” eMarketer, August 2009; “US Video Game Console Household
Penetration, 1995-2008,” eMarketer, October 2008, citing data from Odyssey LP; “Consumer Electronics Primer,” J.P. Morgan, May 2009; “Money For Nothing,” Wedbush
Securities, July 2009; “Connected Consumers, Connected Devices: 2009 Forecast,” Yankee Group, May 2009; “Basic Video Customers,” NCTA website, www.ncta.com/Stats/
BasicCableSubscribers.aspx, accessed 2 October 2009; “Survey: US tops 150 million Internet users,” Portland Business Journal, 24 October 2003, via Dow Jones Factiva;
“Entrée new,” American Demographics, 1 December 2003, via Dow Jones Factiva, © 2003 by Media Central Inc., A PRIMEDIA Company; “Social Network Marketing: Ad
Spending and Usage,” eMarketer, December 2007; “US Online Overview,” eMarketer, October 2007; “Social Networks: Five Consumer Trends for 2009,” eMarketer, February
2009; “Internet & new media - internet usage survey: focus on search,” SG Cowen, 23 May 2005; “The Digital Home: Emerging Trends in TV/PC Viewership,” eMarketer,
November 2009; “US Household Penetration of Select Media, 2001, 2006 & 2011,” eMarketer, 7 August 2007, citing data from PQ Media; “High-Definition (HD) Household
Penetration in the US,” eMarketer, 22 Sept 2006, citing data from Kagan Research; “US Broadband and Dial-Up Households and Penetration, 2000-2012,” eMarketer, 10
September 2008, citing data from FCC, MAGNA and US Census Bureau; “US Broadband and Dial-Up Households and Penetration, 2002-2014,” eMarketer, 23 September
2009, citing data from FCC, MAGNA and US Census Bureau; “US Internet Households, by Access Technology, 2009-2014,” eMarketer, 11 November 2009, citing data
from Forrester Research; “Computer use in 2003,” US Census Bureau, 2004; “MP3 Player Penetration in the US, 2002-2006,” eMarketer, 29 June 2006, citing data from
Ipsos Insight; “XM Satellite Radio Holdings Inc.,” Citi Corp., 26 October 2004; “Sirius XM Radio,” Stanford Group Company, 17 February 2009; “Digital Media And Electronic
Equipment,” SG Cowen, September 2001; “PC Household Penetration in Select Countries, 2001-2007,” eMarketer, 1 March 2008, citing data from Organisation for Economic
Co-operation and Development; “Echostar Communications Corp.,” Credit Suisse, 15 July 2004; “This Defense Not the Best Offense,” Morgan Stanley, January 2009.
2 Ibid
Perc
ent o
f hou
seho
lds
or p
opul
atio
n in
yea
rPe
rcen
t of h
ouse
hold
s or
pop
ulat
ion
in y
ear
Video games
Personal computer
Internet access
Radio
Television
Cable TV
VCR
Wireless devices
DBS
DVD player
MP3 players
Video on demand
Broadband
Satellite radio
DVRs
Social networking users
Digital media adapters
Blu-Ray
HDTV
100%
80%
60%
40%
20%
0%1920 1930 1940 1950 1960 1970 1980 2000 20101990
100%
80%
60%
40%
20%
0%1998 2000 2002 2004 2006 2008 2009
Figure 1
EY index of US media technology innovation frequency (1920-2009e1)
EY index of US media technology innovation frequency (1998-2009e2)

Poised for digital growth: Preserving profi tability in today’s digital world 7
So, when we asked CFOs what trends they thought would have the greatest impact
on their industry in the next two to three years, their answers were not surprising.
Seventy-eight percent of respondents rank new technology-enabled competitive
offerings among the top three drivers of change in the industry. The consequences of
these new technology-enabled competitive offerings, such as disruptive new business
models and shifts in consumer spending, are also cited as key drivers of change.
Notably, all of these drivers are technology-enabled and relate back to the rapid pace
of new technology adoption, which has so changed the media landscape.
Figure 2
Over the next two to three years, what trends will have the greatest impact on the
media and entertainment industry
Tech
nolo
gy c
hang
e
New technology enabled competitive offerings
Disruptive new business models
Shifting consumer spending
Global economic conditions
Reduction in marketing and advertising budgets
78%
10%0% 20% 30% 40% 50% 60% 70% 80%
Percent of total respondents (three responses provided)
Ranked #1 Ranked #2 Ranked #3
66%
53%
51%
30%
“The youth of the world are going to drive
new opportunities for new technology
and new media formats. New cost-
effective business models will gain
strength in the industry — video on
demand (VOD), internet-based and other
products will mature and new business
models will emerge.” – survey respondent

8 Global Media & Entertainment Center
The engine of change
For new technology adoption to accelerate at its current pace, it has needed a robust
platform — or two. Broadband and mobile networks are proving to have the strength
and capacity to enable the rocket-like speed of application development.
To provide a wider comparison, the Ernst & Young Digital Media Platform Saturation
(MPS) index indicates that although the global number of households has not yet
reached a 50% penetration mark, it will do so by next year. By 2013, two-thirds of
the world’s population will be connected and ready for multiplatform consumption.
Penetration rates vary by region, but overall, global penetration rates have seen a six-
fold increase in the last five years.
In 2010, we expect that 82% of US households will report having either broadband, 3G
or both mobile devices — penetration rates that have more than quadrupled in the last
five years.
Figure 3
Ernst & Young digital media platform saturation index
US and worldwide3
Index is based on the household penetration rates of broadband and 3G mobile devices. Index of 1.00 means all households have both technologies
20062005 2007 2008 2009 2010e 2011e 2012e 2013e
Dig
ital m
edia
pla
tfor
m s
atur
atio
n in
dex
0.10
0.20
0
0.30
0.40
0.50
0.60
0.70
0.80
0.90
0.200.24
0.49
0.64
0.810.82 0.83 0.83 0.84
0.07
0.130.17
0.23
0.31
0.41
0.52
0.63 0.66
US Digital Media Platform Saturation Index
Worldwide Digital Media Platform Saturation Index
In 2010, it is estimated that 27% of worldwide households will have
broadband and 55% will have 3G mobile devices.
Index = (27% + 55%) / 200% = 0.41
Penetration rates for 3G mobile devices were capped at 100% when the number of 3G mobile devices
equaled the number of households.
Survey respondents say:
“The way that consumers enjoy media
is going to change dramatically with
technological advancements in devices.”
“Technology is enabling a profound
new relationship to be established with
the customer. This is taking place at
lightning speed and the big old elephants
are having trouble keeping up.”
“Technology is driving change in how
people consume media. This raises
difficult questions in terms of how you
deliver your content and whether your
content is exclusive or not (e.g., paid
content versus ad funded).”
Peri Shamsai, Ernst & Young LLP:
“Penetration, particularly of mobile
devices is enabling the repurposing
of media brands and content in
the forms of games and snack-size
videos targeted at young consumers
resulting in new and lucrative
revenue streams.”
3 Source: “Wireless Equipment,” SG Cowen, 28 March 2006; “Mobile regional and country forecast pack,”
Ovum, December 2009; “Topline Data Forecast,” Yankee Group, October 2009; “Broadband forecast pack,”
Ovum, October 2009; “Broadband Worldwide: 2005-2011,” eMarketer, 1 March 2007; “US Broadband and
Dial-Up Households and Penetration, 2003-2015,” eMarketer, 14 January 2010, citing data from Federal
Communications Commission, MAGNA, US Census Bureau; “Paying 3G Subscribers in the US, by Company,”
eMarketer, 17 October 2005, citing data from Morgan Stanley.

Poised for digital growth: Preserving profi tability in today’s digital world 9
Broadband, cable modem and DSL speeds are increasing, while wireless
broadband is extending coverage to wider areas. In the mobile arena, the
use of smart phones is growing. These new phones combine extensive
communication, video, text and music capabilities. The result is that while
the MPS Index is growing, so too is the functionality of the devices being
measured in the Index.
“The mobile phone is quickly becoming the new internet and computer at
home, delivering information closer to the consumer and making it more
accessible. Having that content and information available on a mobile basis
will drive a shift in consumer desires and behavior.” – survey respondent
As consumers continue to adopt digital media around the world, CFOs
need to ensure that their companies’ media assets are available for digital
distribution. But they also need to make certain that as they wait for the
next technological explosion to occur, they are listening to their customers
and understanding their shifting demands and tastes. They need to be
able to adapt to changing desires by delivering content regardless of the
technology platform.
“It’s all about digital…people want content on their cell phones and other
handhelds.” – survey respondent

Global Media & Entertainment Center10
John Nendick, Ernst & Young LLP: “The phenomenal proliferation of
digital entertainment among consumers continues to challenge media and
entertainment companies. Revenues are dropping due to the unbundling
of media and the reduction of per unit pricing, challenging CFOs to identify
innovative ways to reach their financial objectives. However, as the demand
for digitally delivered entertainment continues to increase significantly,
CFOs feel optimistic about revenue potential.”
11Poised for digital growth: Preserving profi tability in today’s digital world
Anticipating shifts in consumer demand
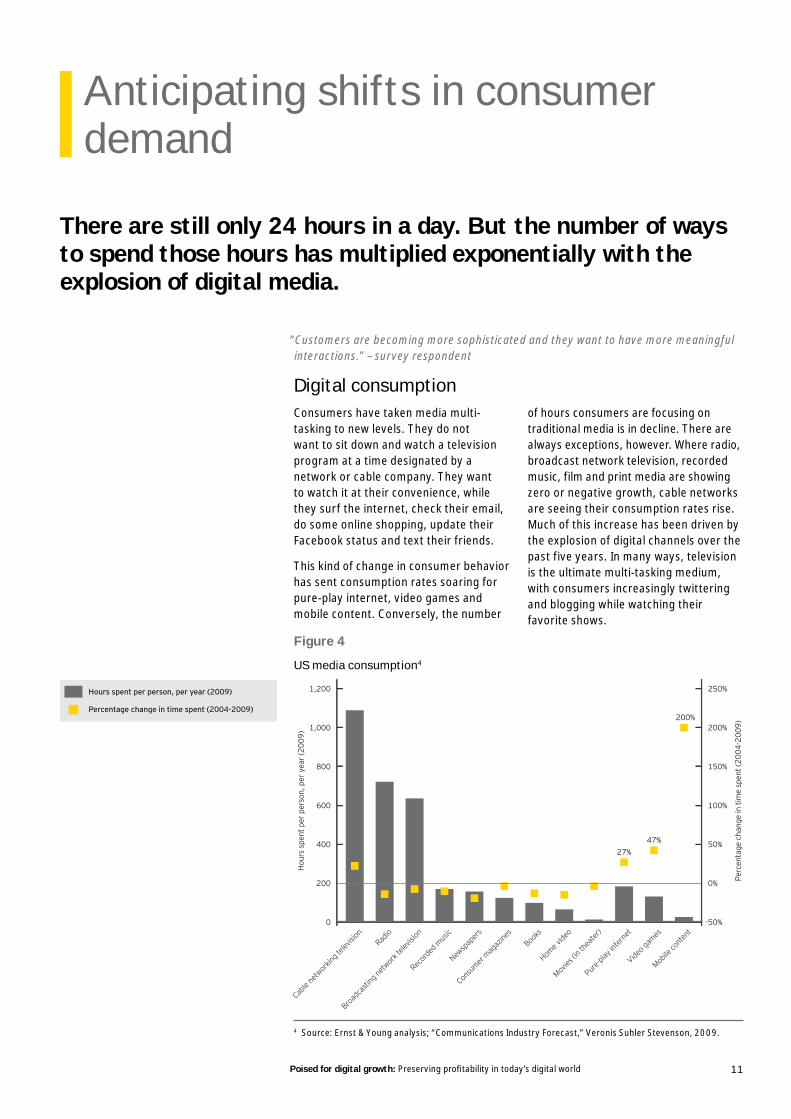
There are still only 24 hours in a day. But the number of ways to spend those hours has multiplied exponentially with the explosion of digital media.
Consumers have taken media multi-
tasking to new levels. They do not
want to sit down and watch a television
program at a time designated by a
network or cable company. They want
to watch it at their convenience, while
they surf the internet, check their email,
do some online shopping, update their
Facebook status and text their friends.
This kind of change in consumer behavior
has sent consumption rates soaring for
pure-play internet, video games and
mobile content. Conversely, the number
of hours consumers are focusing on
traditional media is in decline. There are
always exceptions, however. Where radio,
broadcast network television, recorded
music, film and print media are showing
zero or negative growth, cable networks
are seeing their consumption rates rise.
Much of this increase has been driven by
the explosion of digital channels over the
past five years. In many ways, television
is the ultimate multi-tasking medium,
with consumers increasingly twittering
and blogging while watching their
favorite shows.
Digital consumption
“Customers are becoming more sophisticated and they want to have more meaningful
interactions.” – survey respondent
Figure 4
US media consumption4
Cable
netw
orkin
g tele
vision
Broadc
astin
g netw
ork t
elevis
ionRad
io
Record
ed m
usic
Newsp
apers
Consu
mer mag
azine
sBoo
ks
Home v
ideo
Movies
(in th
eater
)
Pure-pl
ay in
terne
t
Video g
ames
Mobile
conte
nt
1,200
1,000
800
600
400
200
0
250%
200%
150%
100%
50%
0%
-50%
Hou
rs s
pent
per
per
son,
per
yea
r (20
09)
Perc
enta
ge c
hang
e in
tim
e sp
ent (
2004
-200
9)
27%47%
200%
Hours spent per person, per year (2009)
Percentage change in time spent (2004-2009)
4 Source: Ernst & Young analysis; “Communications Industry Forecast,” Veronis Suhler Stevenson, 2009.

Global Media & Entertainment Center12
It is these shifts in consumer patterns, with the resulting declines in traditional media
consumption that have a large majority of CFOs worried. It is influencing how their
companies determine where they need to make investments to protect their market
position and ensure the continued viability of their business.
Protecting intellectual property
More than half of respondents cite intellectual property protection as an area of
concern. As consumption patterns change, how intellectual property rights are
protected needs to change with them.
Companies are investing in rights management systems, which enable transparency
across media asset rights and restrictions in ways not experienced in the traditional
file-cabinet approach to contract management. Companies are also enabling greater
content exploitation across their assets by coupling their rights management systems
with robust product metadata repositories and digital asset management systems,
which allow sophisticated identification, search and retrieval of content. As a result,
the digital transformation is not relegated to the consumer experience alone. It is
influencing media companies’ operating models, enabling greater exploitation of their
assets across platforms, geographies, markets and businesses.
“The brand is very powerful, so there is a need to protect, maintain and monitor it.” –
survey respondent
Figure 5
Which areas of your business are being most impacted by the evolving digital
landscape?
Migrating consumer consumption patterns
Intellectual property protection
Pricing and packaging/bundling of new products and services
Contents management infrastructure (e.g., royalties, rights exploitation)
Technology infrastructure
67%
51%
47%
38%
30%
10%0% 20% 30% 40% 50% 60% 70%
Percent of total respondents (three responses provided)
Ranked #1 Ranked #2 Ranked #3
Michael Rudberg, Ernst & Young LLP:
“The challenge for CFOs and M&E
companies is to stay on top of the
consumer migration to these new
offerings, create value and monetize
these new digital media offerings —
which is difficult given how rapidly the
consumer moves.”

13Poised for digital growth: Preserving profi tability in today’s digital world
Pricing strategies for digital media
As consumers increasingly embrace online media, the industry
is seeking to capitalize on the trend by monetizing digital media
consumption. As illustrated in Figure 6, the number of users
creating a social network profile has increased from a modest
27% in 2006 to 63% in 2009. Similarly, the compound annual
growth rate (CAGR) of streamed videos has risen by a whopping
108% in the same time period.
But trying to create value by monetizing digital offerings is not
easy in a world where consumers are always looking for the
next new platform, “killer app” or creative content.
Access to information
Understanding that always knowing what is around the
corner is one of the biggest challenges a CFO faces in media
and entertainment, we asked them what they need to stay
competitive. CFOs point to greater insights into consumer
trends and the ability to benchmark data against their peers
and competitors.
Respondents say that getting real-time information into where
consumers are heading will help their companies be flexible in
adapting product offerings, keep pace with current trends and
anticipate future demands.
Figure 6
Percentage of worldwide internet users who have created a
social network profile5
Perc
enta
ge o
f int
erne
t use
rs
0%
10%
20%
30%
40%
50%
60%
70%
2006 2007 2008 2009
27%
36%
57%
63%
Streamed videos, by selected sites, US6
Stre
amed
vid
eos
(in b
illio
ns)
0
2
4
6
8
10
12
14
August 2006
November 2007
November 2008
November 2009
Google sites (primarily YouTube)HuluYahoo
1.5
3.3
5.6
13.6
CAGR 108%
5 Source: “Social Network Ad Spending: 2010 Outlook,” eMarketer, December 2009, citing data from Universal McCann.
Note: n=22,729; ages 16-54; daily or every other day internet access.
6 Source: “Top 10 Online Video Properties among US Internet Users, Ranked by Streams Initiated, August 2006,” eMarketer, 19 October 2006; “Top 10 Online Video
Properties Among US Internet Users, Ranked by Videos Viewed, November 2007,” eMarketer, 17 January 2008; “Top 10 Online Video Properties Among US Internet
Users, Ranked by Videos Viewed, November 2008,” eMarketer, 5 January 2009; “Top 10 Online Video Properties Among US Internet Users, Ranked by Videos
Viewed, November 2009,” eMarketer, 5 January 2010; all citing data from comScore, Inc.

14 Global Media & Entertainment Center
Survey respondents say:
“One of the challenges we have as CFOs
is how do we keep ourselves on the tips
of our toes such that when things change
we are well-positioned to respond.”
“Real-time customer data and trends are
more important than ever. We need to be
able to get data, mine data and translate
the data in order to compete in this
changing market.”
“The winners will be the ones who can
predict most accurately what the
consumption will be.”
Figure 7
What kind of information would help you to be more
effective as a CFO?
10%0% 20% 30% 40% 50% 60% 70%
Insights intoconsumer trends
Benchmarking key metrics against peers/competitors
Competitive intelligence
Real-time data and analyses
Benchmarking key metrics across industries
62%
Percent of total respondents (three responses provided)
Ranked #1 Ranked #2 Ranked #3
Operating and capital management information
60%
53%
36%
27%
21%
They also point to the need to be able to benchmark data against their peers and
their competitors. With the colossal growth rates of sites like Hulu and Google,
media and entertainment companies are finding that their competition is no
longer confined to other traditional media players. They also have to worry about
companies with new media platforms that have burst into their space from garages,
basements, grad schools and high schools around the world.
Survey respondents say:
“Because of our parent/structure we’re so inwardly focused that perhaps we lose sight
of how we’re actually performing against our peers or other industries.”
”We would be interested in understanding the pricing strategy of our competitors.”
“Benchmarking with peers and competitors is always important to substantiate how
you are performing.”
“Benchmarking across industries will allow us to gain better insights and understanding
into the industry and how to enable the transition. What are packaged goods
companies doing, or consumer products or retail?”

15Poised for digital growth: Preserving profi tability in today’s digital world
Tom Connolly, Ernst & Young LLP:
“Interactive media companies are
appealing areas for investment
because of their revenue
growth potential and leverage in
expanding margins.”
Positioning for success
For the past six years we have been asking C-Suite executives which companies they
thought were best positioned to thrive in the future. Each time their answers have
been the same: Internet and interactive media. But where it was tied with new content
creation in our 2008 CEO survey, CFOs today select it by almost a two to one margin
over all other media channels.
Figure 8
What kind of media and entertainment companies are best positioned to thrive in
the future?
10%0% 20% 30% 40% 50% 60% 70%
Internet/interactive media
Conglomerates
Cable operators
Electronic gaming
Cable networks/channels
64%
38%
38%
37%
37%
Percent of total respondents (three responses provided)
Ranked #1 Ranked #2 Ranked #3
Traditional content creation (studio) 36%
Survey respondents say:
“The best positioned companies are
those that understand that digital is …
part of a revolution.”
“Interactive media and gaming
companies are best positioned to
thrive in the future. Consumers are
more about demand, personalization
and interactivity. These companies
have the make-up to succeed and have
employees who are more innovative.”
“Younger generations, which have more
access to the internet and technologies,
will position certain companies to thrive
with internet- and interactive-based
media. These companies will benefit
from more cost effective ways to
distribute their content and have a direct
to consumer relationship — which should
result in a better business model, faster
access to content and at costs that are
much cheaper than traditional business
models today.”

Global Media & Entertainment Center16
CFOs are not using growth or revenues
as the only measures of success.
Although EBITDA — earnings before
interest, taxes, depreciation and
amortization — is not a standardized term
under generally accepted accounting
principles and may be calculated
differently from one company to
another, it nevertheless serves as a
widely available metric used by analysts,
investors and reporting companies
to look at the financial performance
of companies in the media and
entertainment industry.
Figure 9 summarizes the results of an
Ernst & Young study of approximately
95 leading global companies and
conglomerates in 11 distinct M&E
sectors that, in the aggregate, generated
over $125 billion of EBITDA in 2009.
The line graph depicts the EBITDA
margin percentage for each sector over
the period 2005 through 2009. The
data on the right reflects the compound
annual growth rate (CAGR) in EBITDA
dollars over the same period.
For the years 2005-2009, interactive
media companies posted strong EBITDA
margins that, in 2009, were growing
and second only to the EBITDA margins
of cable operators. For the same
period, interactive media companies
can also boast a 19% CAGR in EBITDA
dollars — the highest of all media and
entertainment sectors. No wonder,
CFOs ranked internet and interactive
media companies as best positioned for
future success.
Some sectors, in particular the cable
operators and cable networks, showed
both healthy EBITDA dollar CAGR growth
(14% and 10%, respectively, for the
period 2005-2009), and high EBITDA
margins (approximately 40% and 30%,
respectively in 2009). Other sectors
enjoyed relatively high EBITDA margins
in a mature market, but declining EBITDA
dollar CAGR growth. For example,
the radio broadcast sector generated
EBITDA margins of over 40% in 2005,
declining to approximately 25% in 2009,
and suffered an EBITDA dollar CAGR of
-18% from 2005-2009.
Companies in the electronic games
sector generated relatively high margins
in 2005, but exhibited inconsistent and
declining margins in the subsequent
years. Not surprisingly, as a result of
the sector’s stronger performance in
2005, the electronic games sector
posted an EBITDA dollar CAGR of -8%
for the period. The music and publishing
sectors, not surprisingly, have shown
relatively consistent EBITDA margins
with very little EBITDA dollar CAGR
growth for the period 2005-2009.
Even as many media and entertainment
sectors appear to be positioned for
future success, their future is not without
challenge. As media and entertainment
companies experiment with new business
models to optimize their opportunities
within the digital marketplace, they need
to focus on maintaining revenues in the
areas that have been their mainstay
in decades past. CFOs cannot forsake
traditional earning in their quest for the
digital jackpot.

17
Figure 9
EBITDA margin percentage* (2005-2009)7
Poised for digital growth: Preserving profi tability in today’s digital world
7 Source: EBITDA data presented is based on publicly available company and analyst information for the years of 2005 to 2009.
* “EBITDA margin percentage“ is EBITDA dollars divided by revenue dollars.
** “2005-2009 CAGR (EBITDA $)” is the compound annual growth rate of EBITDA dollars.
30%
25%
20%
15%
10%
5%
0%
35%
40%
45%
EBIT
DA m
argi
n pe
rcen
tage
2005-2009 CAGR (EBITDA $**)
Interactive media: 19%
Satellite TV: 17%
Cable operators: 14%
Cable networks: 10%
Conglomerates: 4%
Film and TV production: 3%
Music: 3%
Publishing: 1%
TV broadcast: -4%
Electronic games: -10%
Radio broadcast: -18%
20062005 2007 2008 2009
Howard Bass, Ernst & Young LLP: “CFO’s see growth in new
distribution channels, products and services. Publishers and similar
content companies are embracing the fact there are almost 2 billion
digital media users to leverage their content and core products and
services to the web, mobile devices and electronic gaming globally.”

Global Media & Entertainment Center18

19Poised for digital growth: Preserving profi tability in today’s digital world
Driving growth and dealing with revenue declines
As the economy continues its recovery, CFOs are seeking to take the path of least resistance when it comes to growth opportunities. At the same time, they are searching for the digital business model that slows declining revenues from digital pricing and product unbundling.
“New digital distribution channels are a wonderful way to grow but monetization is the
key word.” – survey respondent
Knowing that interactive media is the place to play, when asked where they saw
the greatest opportunities for revenue growth in the next one or two years, 73% of
respondents indicated they will seek to invest in new distribution channels.
CFOs rank new products and services as their next target area for growth — with a
caveat. The opportunities they pursue will target digital channels. This is consistent
with everything we heard from CFOs throughout the study.
New geographic markets — a significant area of focus for CEOs in our last study — seem
less of a priority for CFOs today. In 2008, when we asked CEOs how large a part
emerging markets would play in their strategic growth plan over the next two to five
years, 89% saw those markets as key to their future growth. In this year’s study, new
geographic markets ranks third in importance, and some acknowledge that pushing into
new markets will play a role in their strategy.
Figure 10
Where do you see the greatest opportunities from a “go-to-market” or revenue
growth perspective over the next one to two years?
10%0% 20% 30% 40% 50% 60% 70% 80%
New distribution channels (e.g., digital)
New products and services
New geographic markets
Brand enhancements
New pricing strategies
73%
60%
53%
30%
26%
Percent of total respondents (three responses provided)
Ranked #1 Ranked #2 Ranked #3
Expanded licensing partnerships 23%
Survey respondents say:
“Distribution will become more
unconstrained by a tethered medium.
People will watch what they want,
where they want to watch it.”
“New distribution channels are critical
right now. People have to make
decisions and commitments.”
“The primary impact will be from new
business models designed around
digital distribution.”

20 Global Media & Entertainment Center
Looking for the easy deal
Not surprisingly, mergers and acquisitions
(M&A) transactions slowed for media
and entertainment companies in 2009.
Although CEOs expressed a desire in
our last study to invest in mergers that
would combine top technology with ready
access to the audience, because of the
economic downturn most companies
shelved M&A plans that could not meet
high return on investment hurdles or
increase share prices from day one. New
media companies sometimes proved an
exception, but CFOs noted that many of
the most attractive new media properties
had already been acquired.
However, even though the number of
announced transactions declined for
most subsectors of the industry, a few
high-priced deals pushed the average deal
value higher than previous years. These
included:
Comcast’s acquisition of NBC
Universal, announced at $14 billion
The Walt Disney Company’s $3.9 billion
acquisition of Marvel Entertainment
UPC Germany’s $3 billion acquisition
of Unitymedia
CPP Investment Board’s $2
billion acquisition of Macquarie
Communications
Figure 11
Global media and entertainment M&A transactions8
(Based on announced deals with disclosed transaction values)
8 Source: Ernst & Young analysis of Capital IQ data.
100
0
200
300
400
500
600
700
800
900 $250
$200
$150
$100
$50
$0
Num
ber o
f dea
ls
Ave
rage
dea
l val
ue (i
n m
illio
ns)
2006 2007 2008 2009
Broadcasting and cable TV
Digital
Publishing
Filmed entertainment
Average deal value (in millions)
$61
740
843
574
398
$194
$169$191

21Poised for digital growth: Preserving profi tability in today’s digital world
When we asked CFOs about their company’s acquisition strategy in the next year
or two, the majority indicated that M&A activity will focus primarily on bolt-on
acquisitions that could add depth to existing portfolios and improve profit margins.
They felt that these types of transactions are most likely to succeed and the easiest
ones to integrate into the existing structure of their organizations.
Figure 12
If your company were to acquire a business over the next one to two years, what
would that acquisition more likely reflect?
10%0% 20% 30% 40% 50% 60% 70% 80%
A “bolt on” to an existing operation to improve margins and depth of product
A new complementary business
An acquisition from outside your home country
An acquisition in the distressed markets (pre- or post-bankruptcy filing)
81%
55%
38%
32%
Percent of total respondents (three responses provided)
Ranked #1 Ranked #2 Ranked #3
Survey respondents say:
“Our most successful deals have been
small bolt-ons. Our larger attempts have
been unsuccessful to date, mainly as we
have smothered these businesses in our
corporate processes.”
“Bolt-on acquisitions are just easier to do;
they have fewer integration challenges.”
“We would look for an acquisition that
would take us deeper into each of our
current verticals.”

Global Media & Entertainment Center22
As media companies move into the
digital marketplace, there is inevitably
a significant impact on key areas of
financial reporting that are top-of-mind
for CFOs. Revenue recognition is an area
of concern. With an increasing number
of channels across which media and
entertainment companies can distribute
their assets, we are seeing that revenue
recognition is changing dramatically. This
is becoming more complex with respect
to timing and allocation issues.
New products and services in the
digital market are also resulting in
highly complex revenue recognition
requirements. As the number of
channels grows, CFOs need to review
revenue recognition policies to ensure
that they properly reflect the new
revenue streams.
New digital revenue streams may be
the “long tail” for many media assets.
Digital distribution channels may enable
companies to exploit older titles or
products through new media and may
represent a hidden demand for content
that was previously inaccessible.
The move to digital may impact more
than just revenue recognition. New
revenue streams may mean companies
need to reevaluate their amortization
of content and programming costs.
They may need to revisit their risk
assessments, as digital initiatives bring
new challenges in rights management,
intellectual property protection, and
are increasingly demanding the audit of
third-parties for transparency. Among
other things, they want access to
click-through rates, costs per thousand
impressions in ad buys and details to
support royalty payments.
Addressing the complexities of revenue recognition

23Poised for digital growth: Preserving profi tability in today’s digital world
While digital and online media are
key areas of growth — areas where
consumers are spending their time
and money — most traditional media
consumption is either flat or in decline.
Between 2004 and 2009 the number of
hours spent per person using traditional
media has seen either zero or negative
growth, except for cable networks (see
Figure 4). For traditional media, those
lost hours are translating into reduced
profit margins.
The decline in consumer end-user
spending began in the late 1990s with
online piracy of music, which resulted
in a 32% fall in global revenues. That is
expected to level out in the near future
as the number of entertainment units
being consumed increases because of
digital adoption (see Figure 13). But the
music industry serves as a cautionary
tale for other media and entertainment
sectors that are poised to experience
a similar revenue squeeze. In the
publishing industry, for example, price
points for books, which had historically
been $24.99, $19.99 or $14.99 are now
appearing as eBooks for $9.99.
As shown by the yellow trend line in
Figure 13, declining price points are
having a significant impact on the
aggregate consumer spend across music
and video purchases.
Additional downward pressure on
pricing has come in the form of product
unbundling. Where consumers once
ordered from a “prix fix” menu, they
are now able to order “à la carte.” For
example, music companies went from
a $14.99 bundled package of singles to
selling a single song for $0.99. Similarly,
episodes of a television series, once
only available for purchase on DVD as
a season, are now available as a single
unit of entertainment. The Kindle, Sony
Reader and iPad may usher in a similar
pricing challenge for publishers, and
some analysts are beginning to warn
that moving broadcast television content
from the television to the personal
computer — and thus unbundling it —
may diminish the industry’s advertising
pricing power and reshuffle the notion
of a bundled cable subscription service,
once televisions are broadly connected
to the internet.
There are a multitude of factors that
depress the price of content and that is
part of what is making it so hard for media
and entertainment companies to find the
right digital business model — whether it
is advertising, subscriptions or a hybrid.
CFOs across the industry worry about
how they are going to migrate into the
digital space, at what price point and how
it will impact their business in the near
and long term.
Managing revenue declines

Global Media & Entertainment Center24
Figure 13
Units consumed, and total end-user spending, for online and physical music and
home video, US9
9 Source: Ernst & Young analysis; “Communications Industry Forecast,” Veronis Suhler Stevenson, 2009; “The
Pause Button 3-D: Studio Benefits Unclear; Lowering DVD Sales Again,” Morgan Stanley, 26 October 2009.
1,000
2,000
3,000
4,000
5,000
6,000
7,000
Uni
ts c
onsu
med
(in
mill
ions
)
Tota
l end
-use
r spe
ndin
g (in
bill
ions
)
2009e 2010e 2011e 2012e0
$5
$10
$15
$20
$25
$30
$35
$40
$0
Digital home video downloads (purchase and rental)
Digital music downloads (singles and albums)
Physical CD shipments (singles and albums)
Physical home video (rental and purchases)
Total home video and music end-user spending (in billions)
621 514 385 257 205 178 161
$36.4
614
3,562
$34.5
852
3,545
$31.6
1,090
3,544
$29.4
1,258
3,557
$28.5
1,417
3,566
$27.6
491
3,517
1,625 1,904
$27.5
808
3,472
2006 2007 2008

25Poised for digital growth: Preserving profi tability in today’s digital world
David McGregor, Ernst & Young: “Our media and
entertainment clients across the board are actively reviewing
how they are going to migrate into the digital space and at what
price point, and what the impact will be on their core business
two, five, ten years down the road.”

Global Media & Entertainment Center26

27Poised for digital growth: Preserving profi tability in today’s digital world
Staying lean in a recovering economy
With declines in per-unit revenue and the global economic downturn, companies have cut costs across the organization more deeply than ever before. Areas once immune to cost-cutting measures — including creative business units — have come under scrutiny.
“We need to continually look at
structures and processes: shared
services for finance, IT, research, call
centers and even editorial content.” –
survey respondent
One surprising result from this study
is the speed with which media and
entertainment CFOs cut costs when
the economic crisis began. Most
CFOs state that they have already
cut the majority of fat from their
organizations. Furthermore, CFOs
express a commitment to keeping
costs down as the economy rebounds.
As we emerge from the recession,
CFOs continue to search for cost-
saving opportunities. They are
reorganizing already lean operations
to improve performance. And they
are exploring new opportunities
for savings through shared service
centers, outsourcing and off-shoring
where appropriate — all without
compromising the quality of key talent
they know is necessary to take their
companies to the next level.
Figure 14
Where do you see the greatest opportunities for cost savings over the next
one to two years?
10%0% 20% 30% 40% 50% 60%
Process improvement
Improved sourcing/outsourcing
Integration and optimization of technologies
Rethinking organizational structure
Control content and marketing costs
56%
51%
47%
45%
41%
Percent of total respondents (three responses provided)
Ranked #1 Ranked #2 Ranked #3
Increased automation 23%

28 Global Media & Entertainment Center
CFOs feel they have identified all cost efficiencies available in a business-as-usual
context. They are now looking at different ways of performing day-to-day activities that
can drive costs out of the business without taking away any of the service or delivery.
Process improvement and enhanced sourcing and outsourcing receive the largest
numbers of votes overall. But when looking at responses in the context of ranking the
number one choice in isolation, controlling content and marketing costs ranks highest
for more than 30% of CFOs.
“It’s a balancing act to control content and marketing costs. We are scrutinizing costs
but it’s hard to find the right digital business model so we don’t lose market share.” –
survey respondent
Survey respondents say:
“We have ripped our cost down to the
lowest level possible unless we make a
cultural change in the organization.”
“Moving to outsource more of the
company’s activities should provide
significant cost savings.”
“There are still a lot of costs to take out
of the back office, particularly in IT
and finance.”
“We need to step back and strategically
look at the business-heavy costs
as opposed to continuing to nibble
around the edges.”
Figure 15
Common media and entertainment outsourcing initiatives
Accounting and
Finance
Accounts payable (e.g., vendor master data management,
payables processing, disbursements processing); accounts
receivable (e.g., billing); payroll; general ledger maintenance;
financial and management reporting
Supply chain Printing and production of books, CDs and DVDs
Distribution Warehousing, picking and packing of retail products
IT Application
Development
Digital content creation, media asset management, community
networking and cross-brand programming.

Poised for digital growth: Preserving profi tability in today’s digital world 29
Bruno Perrin, Ernst & Young et Associés: “CFOs are looking
for different ways to sustain recent cost reductions, while
maintaining the value and brand of the business. Shared
service centers, outsourcing, and off-shoring are appealing
ways to improve efficiency of back-office functions.”

Global Media & Entertainment Center30

31
Defining success
In our 2008 study, CEOs told us they saw the role of the CFO changing in response to the shifting media landscape — that they were looking for more. CEOs were demanding greater insight, analysis and planning, a more effi cient fi nance function, and more open and accurate accounting.
“The role of the CFO is no longer purely
accounting-based. He/she needs to be
updated about technological advancements,
legal issues, copyrights and other financial
aspects.” – survey respondent
Figure 16
Let’s imagine it’s two years from now and you are celebrating a wildly successful
performance as the CFO at your company. What would you think you would identify
as having been your keys to success?
Poised for digital growth: Preserving profi tability in today’s digital world
10%0% 20% 30% 40% 50% 60% 70%
Met, or exceeded, the company’s financial performance goals
Recruited, developed and retained the right talent
Successfully implemented operational efficiencies resulting in cost reductions
Established myself as a strategic partner within the company
Enabled the company to develop a successful business strategy
Successfully managed the company’s balance sheet
40%
56%
68%
27%
23%
22%
Percent of total respondents
I have...
It is interesting then to compare how CFOs view themselves today and what they
think will make them successful. When asked how they would define their keys
to success, CFOs cited implementing operational efficiencies that reduced costs,
recruiting and retaining the right talent, and achieving or surpassing financial
performance targets.
This shift in focus from the strategic to the operational directly corresponds to
the economic downturn, which forced CFOs to turn their attention to operational
efficiencies.

32 Global Media & Entertainment Center
Survey respondents say:
“The key to success will be to have
improved our cost structure through the
use of technology and process synergies.”
“We will succeed if we continue to be a
lean, not fat, organization.”
“The CFO should not be in the back office
looking at data. They need to have their
heads up looking at the future to improve
the decision-making of the business.”
“Doing what we are currently doing will
not get us there — even if we do it better.
We need to change.”
As CFOs assess the landscape, they
know they face some tough challenges.
New technology and customer
consumption patterns are evolving at
lightning speed, making it hard for the
industry to adapt. Traditional business
models that have rooted the industry for
decades are beginning to decay, while
new models have yet to gain traction.
And then there was the global economic
crisis, which placed CFOs in the position
of having to make some hard decisions
around cost savings and cost cutting.
Finding the balance
In the chaos that swirls around them,
CFOs are seeking a calm that comes
from balance — among digital and
traditional media, consumer demands
and company offerings, investing
money in new growth opportunities,
and saving money through cost-cutting
and operational efficiencies.
It is a tough balance to achieve, but
CFOs feel certain that their success
depends on it.
“Success will be finding the right balance
between growth and profitable growth.” –
survey respondent

33Poised for digital growth: Preserving profi tability in today’s digital world
Farokh Balsara, Ernst & Young Pvt. Ltd.: “Most media companies
have targeted the low-hanging fruits, cutting non-essential costs
across the board. The focus has now turned to “profitable growth”
through operational efficiencies such as process improvement,
outsourcing, shared services and alliances. These areas are more
difficult to achieve as they may require structural and cultural shifts
within the organization.”

Global Media & Entertainment Center34

Poised for digital growth: Preserving profi tability in today’s digital world 35
Contacts
Telephone Email
Global Media & Entertainment CenterJohn Nendick, Global Sector leader (Los Angeles, US) + 1 213 977 3188 [email protected]
Sylvia Ahi Vosloo, Associate Director, Marketing (Los Angeles, US) + 1 213 977 4371 [email protected]
Karen Angel, Global Implementation Director (Los Angeles, US) + 1 213 977 5809 [email protected]
Yooli Ryoo, Knowledge Manager (Los Angeles, US) + 1 213 977 4218 [email protected]
Peri Shamsai, M&E Senior Manager (New York, US) + 1 212 773 9172 [email protected]
Pam Walker, Events Coordinator (Los Angeles, US) + 1 213 977 3046 [email protected]
Global Area Leaders and Advisory Panel MembersFarokh T. Balsara (Mumbai, India) + 91 22 4035 6550 [email protected]
Mark Besca (New York, US) + 1 212 773 3423 [email protected]
Neal Clarance (Vancouver, Canada) + 1 604 648 3601 [email protected]
Noriharu Fujita (Tokyo, Japan) + 813 3503 1355 [email protected]
David McGregor (Melbourne, Australia) + 613 9288 8491 [email protected]
Gerhard Mueller (Munich, Germany) + 49 891 4331 13108 [email protected]
Bruno Perrin (Paris, France) + 33 1 46 93 6543 [email protected]
Michael Rudberg (London, England) + 44 207 951 2370 [email protected]
Global Service Line Leaders and Advisory Panel MembersMark J. Borao, Global M&E Advisory Services leader + 1 213 977 3633 [email protected]
Thomas J. Connolly, Global M&E Transaction Advisory Services leader + 1 212 773 7146 [email protected]
Alan Luchs, Global M&E Tax leader + 1 212 773 4380 alan.luchs @ey.com
Chris Pimlott, Global M&E Tax leader + 1 213 977 7721 [email protected]
Advisory Panel MembersHoward Bass + 1 212 773 4841 [email protected]
Glenn Burr + 1 213 977 3378 [email protected]
Vincent de La Bachelerie, Global Telecommunications leader + 33 1 46 93 6205 [email protected]
Pat Hyek, Global Technology leader + 1 408 947 5608 [email protected]
Bud McDonald + 1 203 674 3510 [email protected]
Ken Walker + 1 805 778 7018 [email protected]

Ernst & Young
Assurance | Tax | Transactions | Advisory
About Ernst & Young
Ernst & Young is a global leader in assurance, tax, transaction and
advisory services. Worldwide, our 144,000 people are united by
our shared values and an unwavering commitment to quality. We
make a difference by helping our people, our clients and our wider
communities achieve their potential.
Ernst & Young refers to the global organization of member firms
of Ernst & Young Global Limited, each of which is a separate
legal entity. Ernst & Young Global Limited, a UK company limited
by guarantee, does not provide services to clients. For more
information about our organization, please visit www.ey.com.
© 2010 EYGM Limited.
All Rights Reserved.
EYG No. EA0040
In line with Ernst & Young’s commitment to minimize
its impact on the environment, this document has
been printed on paper with a high recycled content.
This publication contains information in summary form and is
therefore intended for general guidance only. It is not intended to
be a substitute for detailed research or the exercise of professional
judgment. Neither EYGM Limited nor any other member of the
global Ernst & Young organization can accept any responsibility for
loss occasioned to any person acting or refraining from action as
a result of any material in this publication. On any specific matter,
reference should be made to the appropriate advisor.